6.introduction to dispersion_2
36
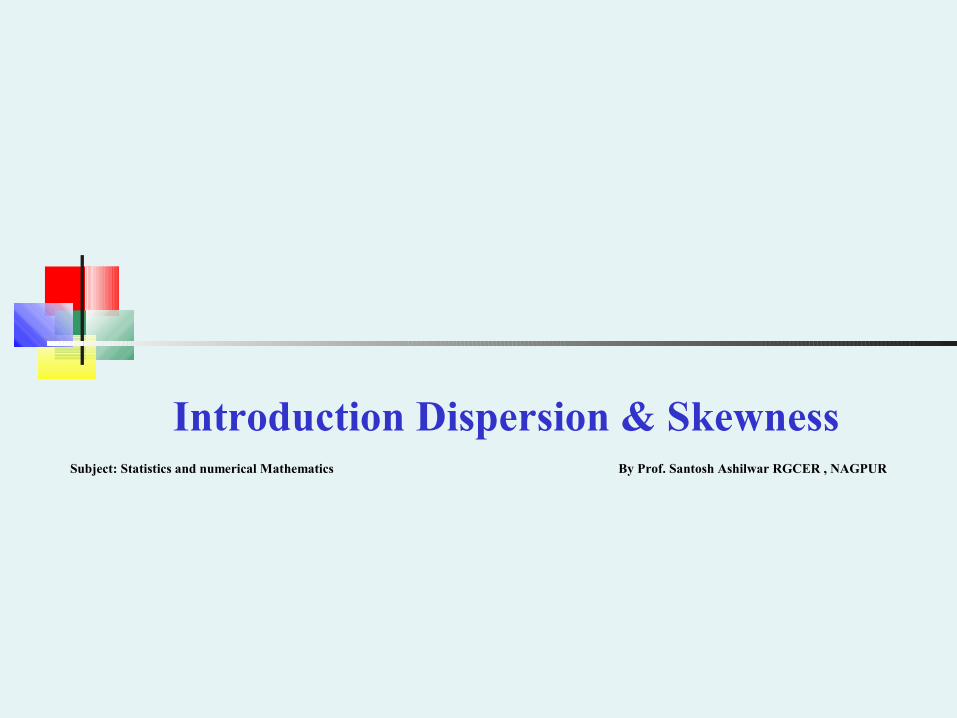
Introduction Dispersion & Skewness Subject: Statistics and numerical Mathematics By Prof. Santosh Ashilwar RGCER , NAGPUR
-
Upload
santosh-ashilwar -
Category
Education
-
view
132 -
download
0
Transcript of 6.introduction to dispersion_2
Introduction Dispersion & SkewnessSubject: Statistics and numerical Mathematics By Prof. Santosh Ashilwar RGCER , NAGPUR
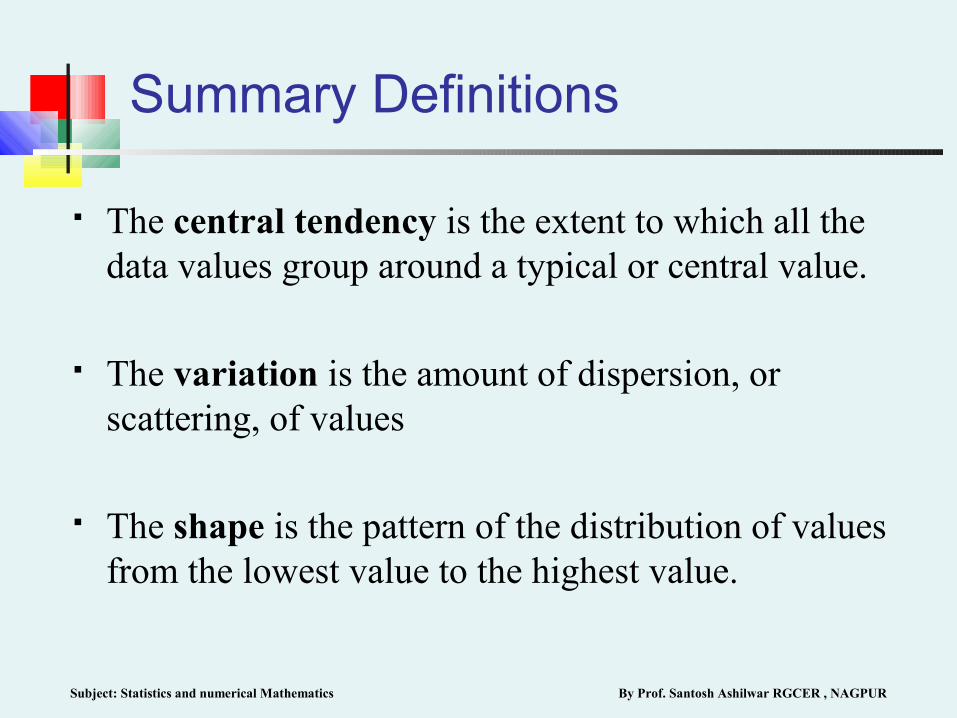
Summary Definitions
The central tendency is the extent to which all the data values group around a typical or central value.
The variation is the amount of dispersion, or scattering, of values
The shape is the pattern of the distribution of values from the lowest value to the highest value.
Subject: Statistics and numerical Mathematics By Prof. Santosh Ashilwar RGCER , NAGPUR
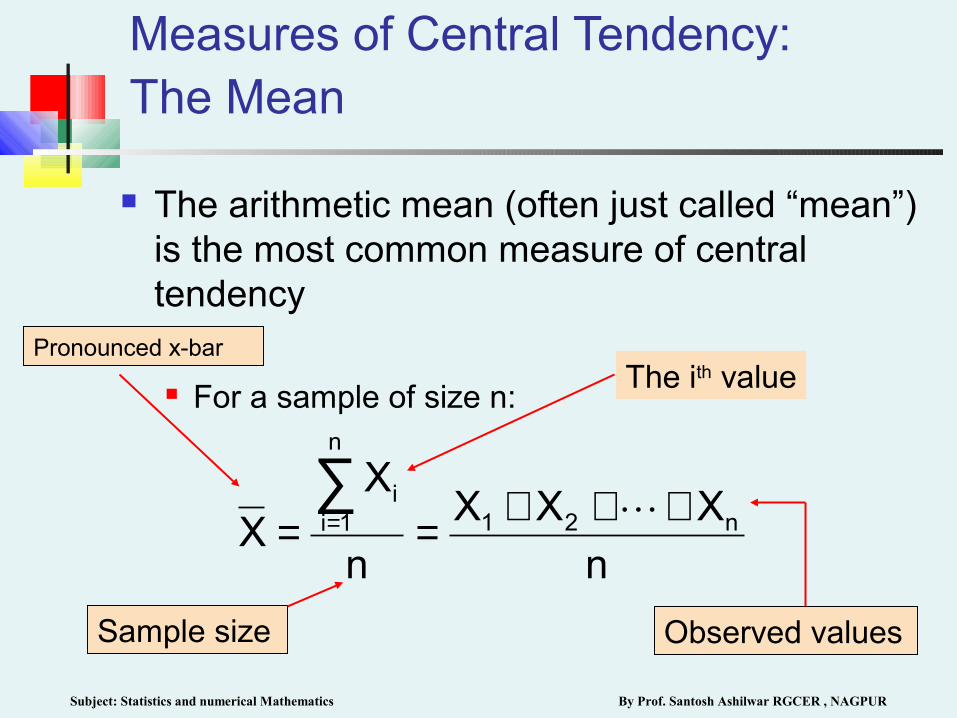
Measures of Central Tendency:The Mean
The arithmetic mean (often just called “mean”) is the most common measure of central tendency
For a sample of size n:
Sample size
n
XXX
n
XX n21
n
1ii +++==
∑=
Observed values
The ith valuePronounced x-bar
Subject: Statistics and numerical Mathematics By Prof. Santosh Ashilwar RGCER , NAGPUR

Measures of Central Tendency:The Mean
The most common measure of central tendency Mean = sum of values divided by the number of values Affected by extreme values (outliers)
(continued)
0 1 2 3 4 5 6 7 8 9 10
Mean = 3
0 1 2 3 4 5 6 7 8 9 10
Mean = 4
35
15
5
54321 ==++++4
5
20
5
104321 ==++++
Subject: Statistics and numerical Mathematics By Prof. Santosh Ashilwar RGCER , NAGPUR

Measures of Central Tendency:The Median
In an ordered array, the median is the “middle” number (50% above, 50% below)
Not affected by extreme values
0 1 2 3 4 5 6 7 8 9 10
Median = 3
0 1 2 3 4 5 6 7 8 9 10
Median = 3
Subject: Statistics and numerical Mathematics By Prof. Santosh Ashilwar RGCER , NAGPUR

Measures of Central Tendency:Locating the Median
The location of the median when the values are in numerical order (smallest to largest):
If the number of values is odd, the median is the middle number
If the number of values is even, the median is the average of the two middle numbers
Note that is not the value of the median, only the position of
the median in the ranked data
dataorderedtheinposition2
1npositionMedian
+=
2
1n +
Subject: Statistics and numerical Mathematics By Prof. Santosh Ashilwar RGCER , NAGPUR

Measures of Central Tendency:The Mode
Value that occurs most often Not affected by extreme values Used for either numerical or categorical
(nominal) data There may may be no mode There may be several modes
0 1 2 3 4 5 6 7 8 9 10 11 12 13 14
Mode = 9
0 1 2 3 4 5 6
No Mode
Subject: Statistics and numerical Mathematics By Prof. Santosh Ashilwar RGCER , NAGPUR

Measures of Central Tendency:Review Example
House Prices:
$2,000,000 $500,000 $300,000 $100,000 $100,000
Sum $3,000,000
Mean: ($3,000,000/5)
= $600,000 Median: middle value of ranked
data = $300,000
Mode: most frequent value = $100,000
Subject: Statistics and numerical Mathematics By Prof. Santosh Ashilwar RGCER , NAGPUR

Measures of Central Tendency:Which Measure to Choose?
The mean is generally used, unless extreme values (outliers) exist.
The median is often used, since the median is not sensitive to extreme values. For example, median home prices may be reported for a region; it is less sensitive to outliers.
In some situations it makes sense to report both the mean and the median.
Subject: Statistics and numerical Mathematics By Prof. Santosh Ashilwar RGCER , NAGPUR

Measures of Central Tendency:Summary
Central Tendency
Arithmetic Mean
Median Mode Geometric Mean
n
XX
n
ii∑
== 1
n/1n21G )XXX(X ×××=
Middle value in the ordered array
Most frequently observed value
Rate of change ofa variable over time
Subject: Statistics and numerical Mathematics By Prof. Santosh Ashilwar RGCER , NAGPUR

Same center, different variation
Measures of Variation
Measures of variation give information on the spread or variability or dispersion of the data values.
Variation
Standard Deviation
Coefficient of Variation
Range Variance

Measures of Variation:The Range
Simplest measure of variation Difference between the largest and the smallest values:
Range = Xlargest – Xsmallest
0 1 2 3 4 5 6 7 8 9 10 11 12 13 14
Range = 13 - 1 = 12
Example:
Subject: Statistics and numerical Mathematics By Prof. Santosh Ashilwar RGCER , NAGPUR

Measures of Variation:Why The Range Can Be Misleading
Ignores the way in which data are distributed
Sensitive to outliers
7 8 9 10 11 12
Range = 12 - 7 = 5
7 8 9 10 11 12
Range = 12 - 7 = 5
1,1,1,1,1,1,1,1,1,1,1,2,2,2,2,2,2,2,2,3,3,3,3,4,5
1,1,1,1,1,1,1,1,1,1,1,2,2,2,2,2,2,2,2,3,3,3,3,4,120
Range = 5 - 1 = 4
Range = 120 - 1 = 119
Subject: Statistics and numerical Mathematics By Prof. Santosh Ashilwar RGCER , NAGPUR

Average (approximately) of squared deviations of values from the mean
Sample variance:
Measures of Variation:The Variance
n
)X(XS
n
1i
2i
2∑
=
−=
Where = arithmetic mean
n = sample size
Xi = ith value of the variable X
X
Subject: Statistics and numerical Mathematics By Prof. Santosh Ashilwar RGCER , NAGPUR

Measures of Variation:The Standard Deviation
Most commonly used measure of variation Shows variation about the mean Is the square root of the variance Has the same units as the original data
Sample standard deviation:
n
)X(XS
n
1i
2i∑
=
−=
Subject: Statistics and numerical Mathematics By Prof. Santosh Ashilwar RGCER , NAGPUR

Measures of Variation:The Standard Deviation
Steps for Computing Standard Deviation
1. Compute the difference between each value and the mean.
2. Square each difference.
3. Add the squared differences.
4. Divide this total by n-1 to get the sample variance.
5. Take the square root of the sample variance to get the sample standard deviation.
Subject: Statistics and numerical Mathematics By Prof. Santosh Ashilwar RGCER , NAGPUR

Measures of Variation:Sample Standard Deviation:Calculation Example
Sample Data (Xi) : 10 12 14 15 17 18 18 24
n = 8 Mean = X = 16
4.30957
130
18
16)(2416)(1416)(1216)(10
1n
)X(24)X(14)X(12)X(10S
2222
2222
==
−−++−+−+−=
−−++−+−+−=
A measure of the “average” scatter around the mean

Measures of Variation:Comparing Standard Deviations
Mean = 15.5 S = 3.338 11 12 13 14 15 16 17 18 19 20
21
11 12 13 14 15 16 17 18 19 20 21
Data B
Data A
Mean = 15.5 S = 0.926
11 12 13 14 15 16 17 18 19 20 21
Mean = 15.5 S = 4.570
Data C
Subject: Statistics and numerical Mathematics By Prof. Santosh Ashilwar RGCER , NAGPUR

Measures of Variation:Comparing Standard Deviations
Smaller standard deviation
Larger standard deviation
Subject: Statistics and numerical Mathematics By Prof. Santosh Ashilwar RGCER , NAGPUR

Measures of Variation:Summary Characteristics
The more the data are spread out, the greater the range, variance, and standard deviation.
The more the data are concentrated, the smaller the range, variance, and standard deviation.
If the values are all the same (no variation), all these measures will be zero.
None of these measures are ever negative.
Subject: Statistics and numerical Mathematics By Prof. Santosh Ashilwar RGCER , NAGPUR

Measures of Variation:The Coefficient of Variation
Measures relative variation Always in percentage (%) Shows variation relative to mean Can be used to compare the variability of two or
more sets of data measured in different units
100%X
SCV ⋅
=
Subject: Statistics and numerical Mathematics By Prof. Santosh Ashilwar RGCER , NAGPUR
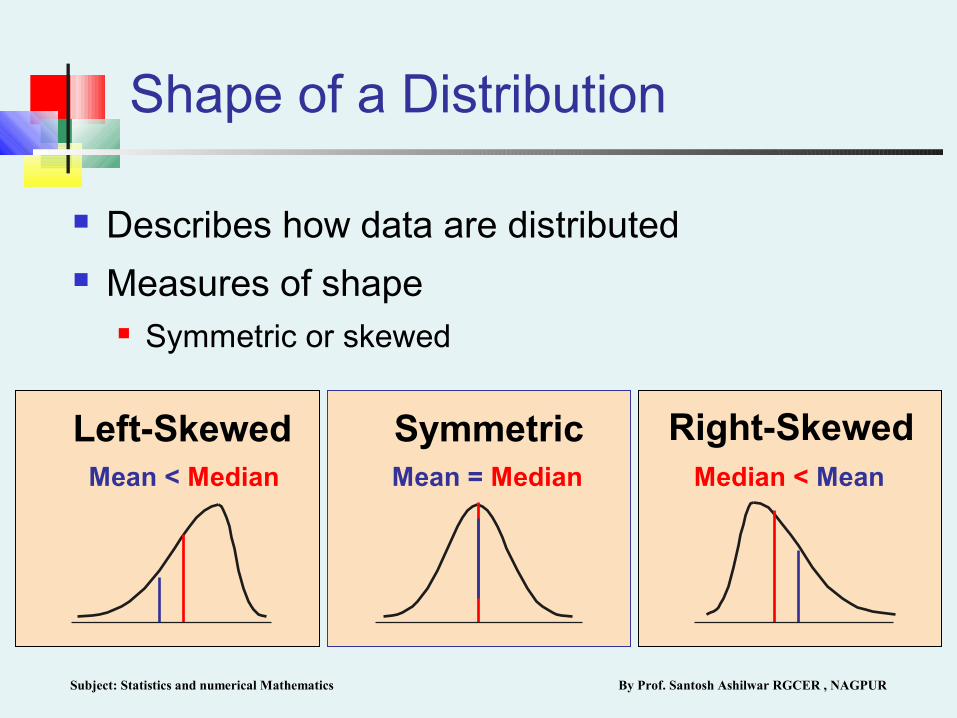
Shape of a Distribution
Describes how data are distributed Measures of shape
Symmetric or skewed
Mean = Median Mean < Median Median < Mean
Right-SkewedLeft-Skewed Symmetric
Subject: Statistics and numerical Mathematics By Prof. Santosh Ashilwar RGCER , NAGPUR

General Descriptive Stats Using Microsoft Excel
1. Select Tools.
2. Select Data Analysis.
3. Select Descriptive Statistics and click OK.
Subject: Statistics and numerical Mathematics By Prof. Santosh Ashilwar RGCER , NAGPUR

General Descriptive Stats Using Microsoft Excel
4. Enter the cell range.
5. Check the Summary Statistics box.
6. Click OK
Subject: Statistics and numerical Mathematics By Prof. Santosh Ashilwar RGCER , NAGPUR

Excel output
Microsoft Excel
descriptive statistics output,
using the house price data:
House Prices:
$2,000,000 500,000 300,000 100,000 100,000
Subject: Statistics and numerical Mathematics By Prof. Santosh Ashilwar RGCER , NAGPUR

Approximating the Mean from a Frequency Distribution
Use the midpoint of a class interval to approximate the values in that class
Where n = number of values or sample size
c = number of classes in the frequency distribution
mj = midpoint of the jth class
fj = number of values in the jth class
n
fm
X
c
1jjj∑
==
Subject: Statistics and numerical Mathematics By Prof. Santosh Ashilwar RGCER , NAGPUR

Approximating the Standard Deviation from a Frequency Distribution
Assume that all values within each class interval are located at the midpoint of the class
Where n = number of values or sample size c = number of classes in the frequency distribution
mj = midpoint of the jth class
fj = number of values in the jth class
1-n
f )X(m
S
c
1jj
2j∑
=
−=
Subject: Statistics and numerical Mathematics By Prof. Santosh Ashilwar RGCER , NAGPUR

Quartile Measures
Quartiles split the ranked data into 4 segments with an equal number of values per segment
25%
The first quartile, Q1, is the value for which 25% of the observations are smaller and 75% are larger
Q2 is the same as the median (50% of the observations are smaller and 50% are larger)
Only 25% of the observations are greater than the third quartile
Q1 Q2 Q3
25% 25% 25%
Subject: Statistics and numerical Mathematics By Prof. Santosh Ashilwar RGCER , NAGPUR

Quartile Measures:Locating Quartiles
Find a quartile by determining the value in the appropriate position in the ranked data, where
First quartile position: Q1 = (n+1)/4 ranked value
Second quartile position: Q2 = (n+1)/2 ranked value
Third quartile position: Q3 = 3(n+1)/4 ranked value
where n is the number of observed values
Subject: Statistics and numerical Mathematics By Prof. Santosh Ashilwar RGCER , NAGPUR
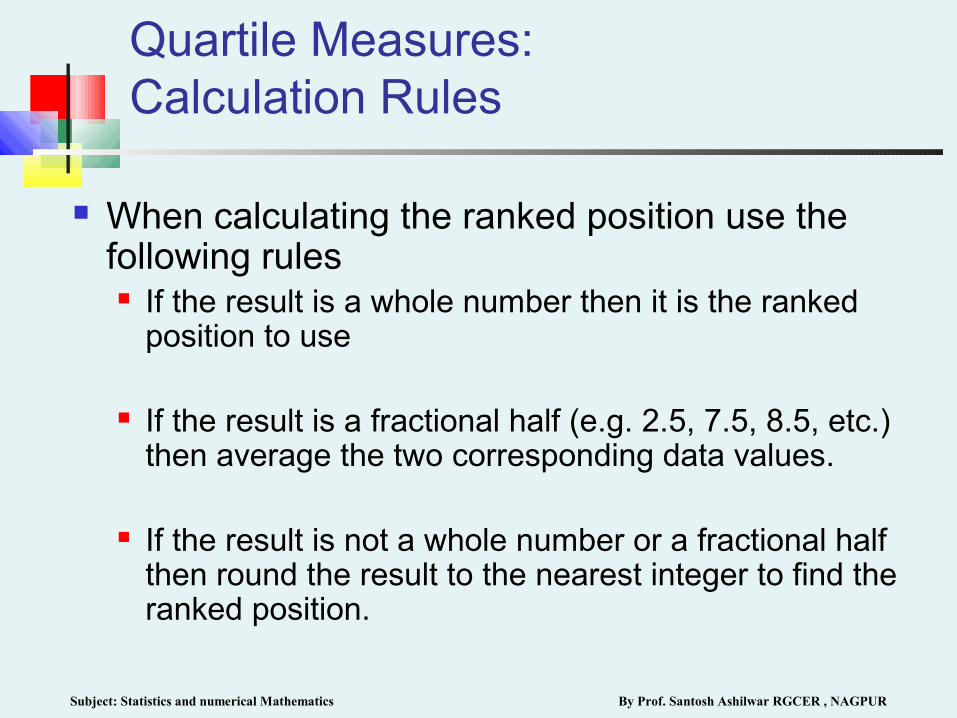
Quartile Measures:Calculation Rules
When calculating the ranked position use the following rules If the result is a whole number then it is the ranked
position to use
If the result is a fractional half (e.g. 2.5, 7.5, 8.5, etc.) then average the two corresponding data values.
If the result is not a whole number or a fractional half then round the result to the nearest integer to find the ranked position.
Subject: Statistics and numerical Mathematics By Prof. Santosh Ashilwar RGCER , NAGPUR

(n = 9)
Q1 is in the (9+1)/4 = 2.5 position of the ranked data
so use the value half way between the 2nd and 3rd values,
so Q1 = 12.5
Quartile Measures:Locating Quartiles
Sample Data in Ordered Array: 11 12 13 16 16 17 18 21 22
Q1 and Q3 are measures of non-central location Q2 = median, is a measure of central tendency
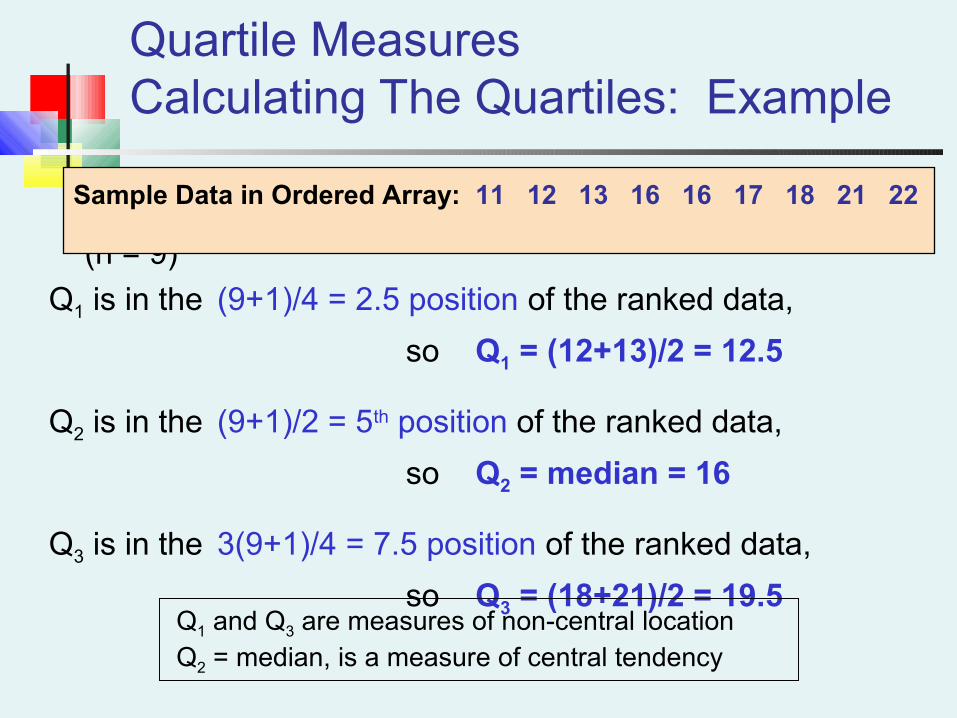
(n = 9)
Q1 is in the (9+1)/4 = 2.5 position of the ranked data,
so Q1 = (12+13)/2 = 12.5
Q2 is in the (9+1)/2 = 5th position of the ranked data,
so Q2 = median = 16
Q3 is in the 3(9+1)/4 = 7.5 position of the ranked data,
so Q3 = (18+21)/2 = 19.5
Quartile MeasuresCalculating The Quartiles: Example
Sample Data in Ordered Array: 11 12 13 16 16 17 18 21 22
Q1 and Q3 are measures of non-central location Q2 = median, is a measure of central tendency

Quartile Measures:The Interquartile Range (IQR)
The IQR is Q3 – Q1 and measures the spread in the middle 50% of the data
The IQR is also called the midspread because it covers the middle 50% of the data
The IQR is a measure of variability that is not influenced by outliers or extreme values
Measures like Q1, Q3, and IQR that are not influenced by outliers are called resistant measures

Calculating The Interquartile Range
Median(Q2)
XmaximumX
minimum Q1 Q3
Example:
25% 25% 25% 25%
12 30 45 57 70
Interquartile range = 57 – 30 = 27
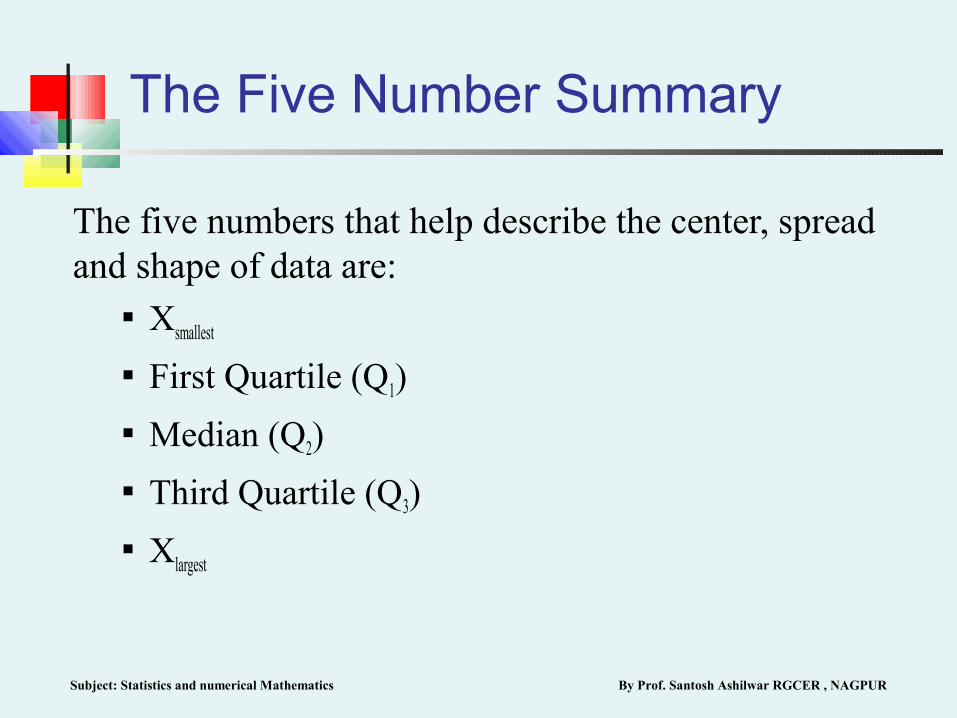
The Five Number Summary
The five numbers that help describe the center, spread and shape of data are:
Xsmallest
First Quartile (Q1)
Median (Q2)
Third Quartile (Q3)
Xlargest
Subject: Statistics and numerical Mathematics By Prof. Santosh Ashilwar RGCER , NAGPUR

Distribution Shape
Right-SkewedLeft-Skewed Symmetric
Q1 Q2 Q3 Q1 Q2 Q3Q1 Q2 Q3
Subject: Statistics and numerical Mathematics By Prof. Santosh Ashilwar RGCER , NAGPUR