FCH 532 Lecture 2 Webpage: 532/ 532/ Genetics review Chapter 1 Nucleic.
I I I I I I I I I I I I I I I I
-BINGHAM 1:1 ENVIRONMENTAL
5160 Wiley Post Way, Salt Lake City, Utah 84116, (801) 532-2230, FAX (801) 328-3381
PROJECT MEMORANDUM
TO: George Hellstrom - Envirocare of Utah, Inc. ''(i/ David Waite - Bingham EnvironmentalIn~ ).. . FROM: David Cline - Bingham Environmental In;· \c:f'"
DATE: August 3, 1995
SUBJECT: Summary of Results Radionuclide Kd Tests Envirocare Disposal Landfills Clive, Utah
This memorandum provides a summary of the distribution coefficient (Kd) testing performed for Envirocare by Barringer Laboratories Inc. (Barringer) located in Golden, Colorado. The objective of the Kd testing was to determine appropriate site-specific values for "five radionuclides~ utilizing test conditions which are representative of the soil, groundwater, and expected" radionuclide concentration in the waste disposed in the LARW landfill cell. Site specific Kd values for Envirocare's site have not been determined in the past. The lowest value reported in the Iiteratur~ under varying conditions has been used in previous contaminant transport modeling.
APPROACH
The detailed approach is outlined in the Work Plan (Bingham, 1995), and ASTM method D 4319-83, Standard Test Method/or Distribution Ratios by the Short-Term Batch Method. The Work Plan is presented in Appendix A, and the ASTMspecification is presented in Appendix B. The Work Plan presents detailed procedures for determining site-specific distribution ratios for the five radionuclides, and methods of collecting soil and groundwater samples. "
Several modifications to the Work Plan were made following the preparation of the Work Plan. The laboratory identified in the Work Plan is Controls for Environmental Pollution, Inc., the laboratory used for the tests was Barringer. Problems with the neptunium concentrate material Barringer received resulted in a contact solution that was at a lower activity than was proposed. Because of the low activity of the actual contact solution, the low-concentration test had levels of neptunium too low to measure accurately. The actual activity of the middle and high-concentration tests were
Bingham Envirollme1llal, Inc. Project No. 2019-013
-0 Printed on recycled paper.
August 3, 1995
J3.P
I I I I I I I I I
'. I I I
• I I
• I I
Envirocare of Utah, Inc. Summary of Kd Test Results
approximately equal to the proposed low-concentration level. Therefore, it was possible to determine values from these two tests. The majority of the testing was performed in accordance with the Work Plan, with the exception of the aforementioned changes
The ASTM D 4319-83 test determines a distribution ratio (Rd) which is used to evaluate an appropriate distribution coefficient (KJ for the particular radionuclide. The Rd value is a short-term laboratory value whic;h is the ratio of the concentration sorbed to the soil to the concentration remaining in the liquid. The Kd is "identically defined as Rd for equilibrium conditions and for ion exchange-adsorption reactions only" (ASTM D 4319-83) and is a measure of long-term field conditions. Each value is a measure of the solid/liquid ratio; one for laboratory conditions and one for field conditions. In order to determine the Kd from the measured Rd , the differences between laboratory and field conditions must be accounted for. The ASTM method suggests that "To apply Rd values to field situations, an assumption such that Kd = Rd is necessary." The method also suggests that such an assumption can only be made based on a detailed evaluation of the site and test conditions. Some conditions that may affect the determination of the Kd value from the Rd value include:
• differences in soil and contact solution chemistry • time differences (short-term versus long-term) • other fluids affecting field conditions (leachate) • contact time and soil/liquid ratios (soil surface area) • concentration of radionuclide • temperature differences
Because the sand and groundwater used in the test were collected from the site and determined to be representative of site conditions, there would be minimal differences in soil/groundwater physical and analytical characteristics. The test is performed over three different time periods to evaluate if the Rd is time dependent. Differences in the measured values for the three tests are an indication of time-dependency. The leachate through the disposal cell is assumed to have minimal impacts on groundwater chemistry because of the large dilution effects of the groundwater and the buffering capacity of the groundwater. The ratio of soil/water (wt/wt) for the test is 1 :4; actual field conditions would be closer to 1: 1. The higher soil/water ratio for field conditions would result in more adsorption surface area for a given volume of water. The effects of concentration were accounted for by performing the test at three concentrations. Temperature differences between the laboratory test and field conditions are minimal. Because the Rd value is determined under conditions that directly reproduce, or are more conservative than field conditions; the Kd value proposed are assumed to equal the calculated laboratory Rd value.
Binglram Envirollmental, Illc. Project No. 2019-013 -2-
August 3, 1995
I I I
• I I
• I I
• '. I I I I I I I I
Ellvirocare of Utah. fllc. , Summary of Kd Test Resulls
LABORATORY TESTING
The tests were performed under conditions considered typical of the site. Silty sand (Unit 3) and groundwater from the site were used in the tests in order to simulate field conditions as closely as possible. Groundwater was collected from LARW compliance wells GW-20, GW-22, and GW-64. These wells are located around the perimeter of the LARW cell. Three samples of Unit 3 sand were collected from the south end of the LARW cell by Envirocare. The soil and groundwater was analyzed prior to performing the distribution ratio tests. The characteristics of the collected soil and groundwater were compared to existing data to verify the material used in the tests was representative' of typical groundwater and the ~nit 3 sand layer.
Analytical testing of the groundwater was performed by Barringer and is presented with the Analytical Report Package (Appendix D). The analytical results indicate that the groundwater samples collected were typical of groundwater at the site. Gradation analysis of the three individual and composite soil samples were performed by Bingham and are presented in Appendix C. The gradation of the soil used in the test was compared to gradation curves developed by Daniel B. Stephens Laboratory (1993) for the Unit 3 sand. The gradation for the sand used in the tests is similar to the typical gradations for the Unit 3 sand utilized in previous tests.
After it was determined the materials were typical of site groundwater and Unit 3 sand" the distribution ratio tests were initiated. The individual radionuclides were added to the groundwater sample to produce contact solutions of varying concentrations, although the ASTM test does not require different concentrations of contact solution. Three separate radionuclide contact solution concentrations were used because the waste received may vary from the maximum waste
, concentrations permitted. The results from the different concentrations were used to determine the sensitivity of Rd values with respect to radioisotope concentration. These contact solutions were then batched with the soil and the mixture was stirred. The Rd was determined from the ratio of the amount of radionuclide that adsorbed to the soil, and the amount that remained in solution.
LABORATORY RESULTS
Barringer Laboratory performed the Rd testing and they have summarized the results in the report provided in Appendix D. As seen in the report, some 'of the Rd values calculated for Tc-99 are negative. These negative values are due to the fact that some of the concentrations measured in the contact solution batched with the soil (batch solution) are greater than the initial concentrations of the solution prior to batching (head sample). Because the quantity of the material adsorbed to the soil is calculated from the concentration difference between the head sample and the batch solution; the soil concentration appears to be negative, resulting in a negative Rd' Because the soil is assumed to be clean (no radionuclides), it is improbable that the batch solution concentration would increase due to leaching of radionuclides from the soil.
Bingham Environmental. Inc. Project No. 2019-013 -3-
August 3. 1995
I I I I I I I I I I I I I I I I I I I
E1lvirocare of Utah. [IIC.
Summary of Kd Test Results
There are at least two possible reasons for these negative Rd values. There are analytical variations, called 'uncertainty' values, that may result in a negative Rd; however, the uncertainty value is typically not large enough to result in a negative Rd value. Another possible reason for the negative value is some of the batch solution may hydrate (move into and remain in the soil pores) the soil producing a higher concentration in the batch solution; this is discussed in Barringer's report. Typically only a small portion of the total batch solution is analyzed; therefore, if some of the water hydrates the soil, the mass of the radionuclide remains the same and the volume of the liquid is reduced; resulting in a higher concentration.
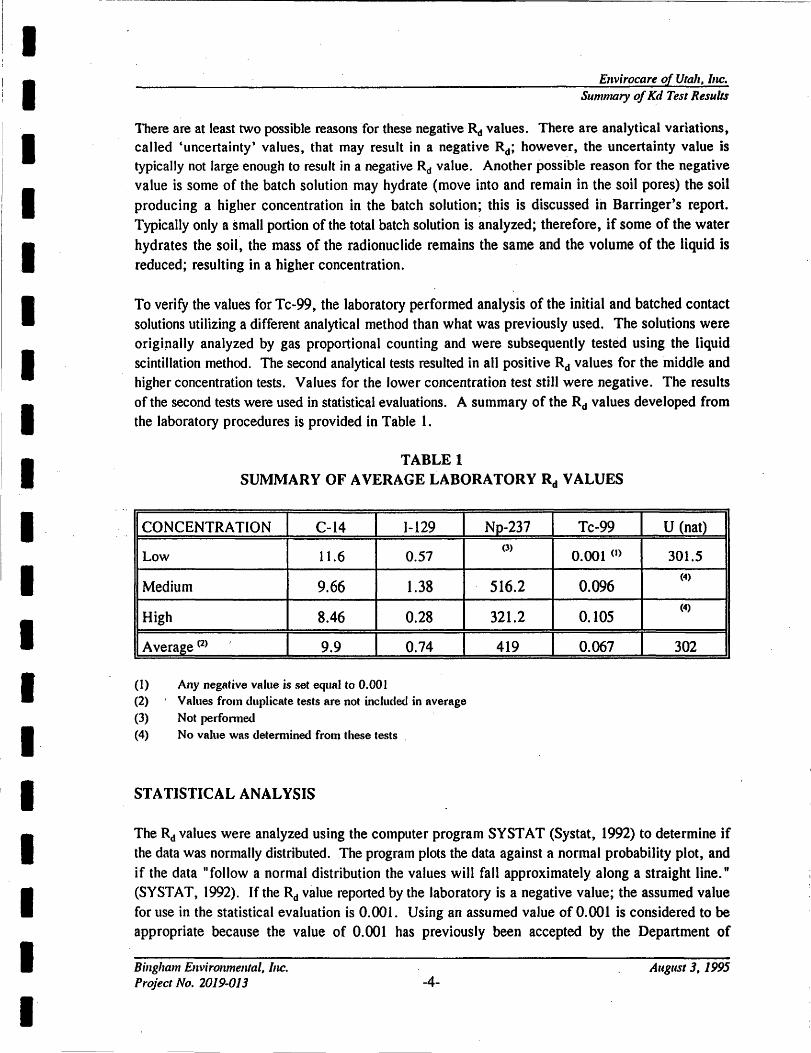
To verify the values for Tc-99, the laboratory performed analysis of the initial and batched contact solutions utilizing a different analytical method than what was previously used. The solutions were originally analyzed by gas proportional counting and were subsequently tested using the liquid scintillation method. The second analytical tests resulted in all positive Rd values for the middle and higher concentration tests. Values for the lower concentration test stiJl were negative. The results of the second tests were used in statistical evaluations. A summary of the Rd values developed from the laboratory procedures is provided in Table 1.
TABLE 1 SUMMARY OF AVERAGE LABORATORY Rd VALUES
CONCENTRA TION C-14 1-129 Np-237 Tc-99 U (nat)
Low 11.6 0.57 (3)
0.001 (I) 301.5
Medium 9.66 1.38 516.2 0.096 (4)
High 8.46 0.28 321.2 0.105 (4)
Average (2) 9.9 0.74 419 0.067 302
(1) Any negAtive VAlue is set equAl to 0.001 (2) , V Alues from duplicAte tests are not included in average
(3) Not perfonned (4) No value was detennined from these tests .
STATISTICAL ANALYSIS
The Rd values were analyzed using the computer program SYSTAT (Systat, 1992) to determine if the data was normally distributed. The program plots the data against a normal probability plot, and if the data "follow a normal distribution the values will fall approximately along a straight line." (SYSTAT, 1992). If the Rd value reported by the laboratory is a negative value; the assumed value for use in the statistical evaluation is 0.001. Using an assumed value of 0.001 is considered to be appropriate because the value of 0.001 has previously been accepted by the Department of
Bingham Environmental. Inc. Project No. 2019-013 -4-
August 3. 1995
I I I 1 I I I I I 1 1 I 1 1 1 I I. 1 1
Envirocare of UlaJr, Inc. Summary of Kd Test Resulls
Environmental Quality as a conservative value to use if the Kd value is not known.
Values from the duplicate tests were not included in the statistical evaluation. The duplicate values were not performed on all three concentrations or time intervals and therefore including the results would weight the final value to the duplicate sample. The duplicate is typically performed as an analytical check (laboratory QA/QC) to verify the result of the initial analysis. It does not provide results from an unique test and therefore was not used in the statistical evaluation.
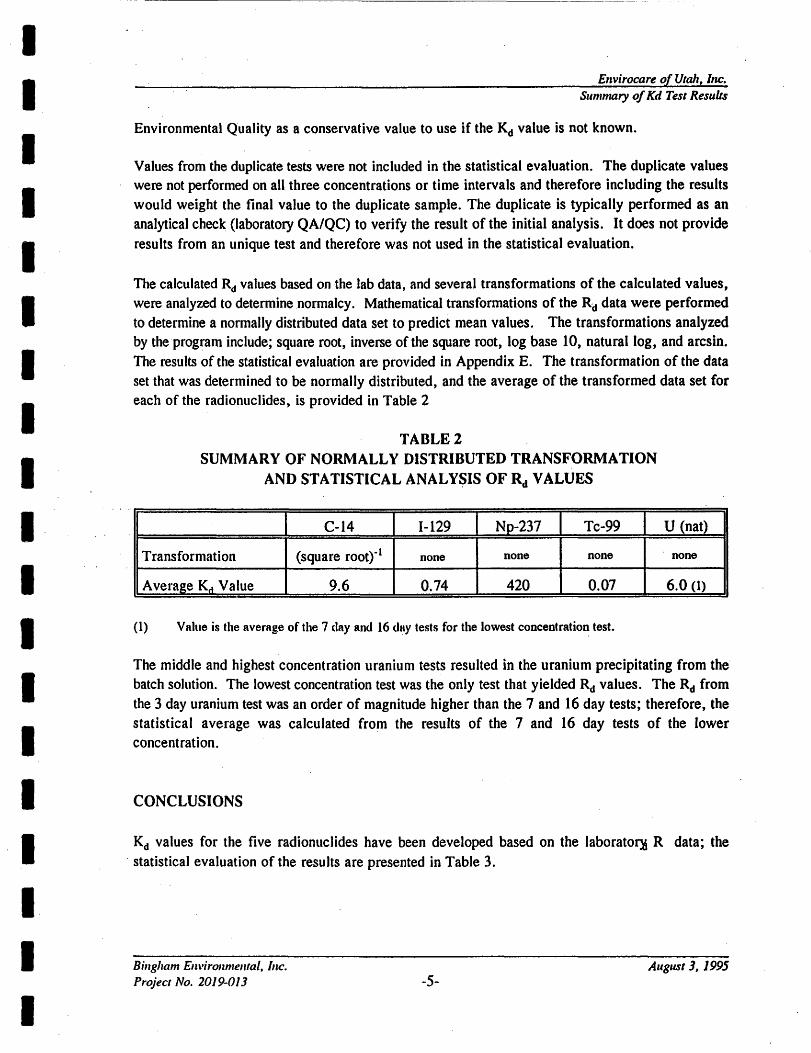
The calculated Rd values based on the lab data, and several transformations of the calculated values, were analyzed to determine normalcy. Mathematical transformations of the Rd data were performed to determine a normally distributed data set to predict mean values. The transformations analyzed by the program include; square root, inverse of the square root, log base 10, natural log, and arcsin. The results of the statistical evaluation are provided in Appendix E. The transformation of the data set that was determined to be normally distributed, and the average of the transformed data set for each of the radionuclides, is provided in Table 2
TABLE 2 SUMMARY OF NORMALLY DISTRIBUTED TRANSFORMATION
AND STATISTICAL ANAL Y~IS OF Rd V ALVES
C-14 1-129 Np-237 Tc-99
Trans formation (square rootr l none none none
Average Kd Value 9.6 0.74 420 0.07
(1) Value is the average of the 7 day and 16 dtty tests for the lowest concentration test.
U (nat)
none
6.0 (1)
The middle and highest concentration uranium tests resulted in the uranium precipitating from the batch solution. The lowest concentration test was the only test that yielded Rd values. The Rd from the 3 day uranium test was an order of magnitude higher than the 7 and 16 day tests; therefore, the statistical average was calculated from the results of the 7 and 16 day tests of the lower concentration.
CONCLUSIONS·
Kd values for the five radionuclides have been developed based on the laboratolJi R data; the . statistical evaluation of the results are presented in Table 3.
Bingham Em";ronmental. fllc. Project No. 2019-013 -5-
August 3, 1995
I I I I ,
I 'I I I I I I I I I I I I I I I I I
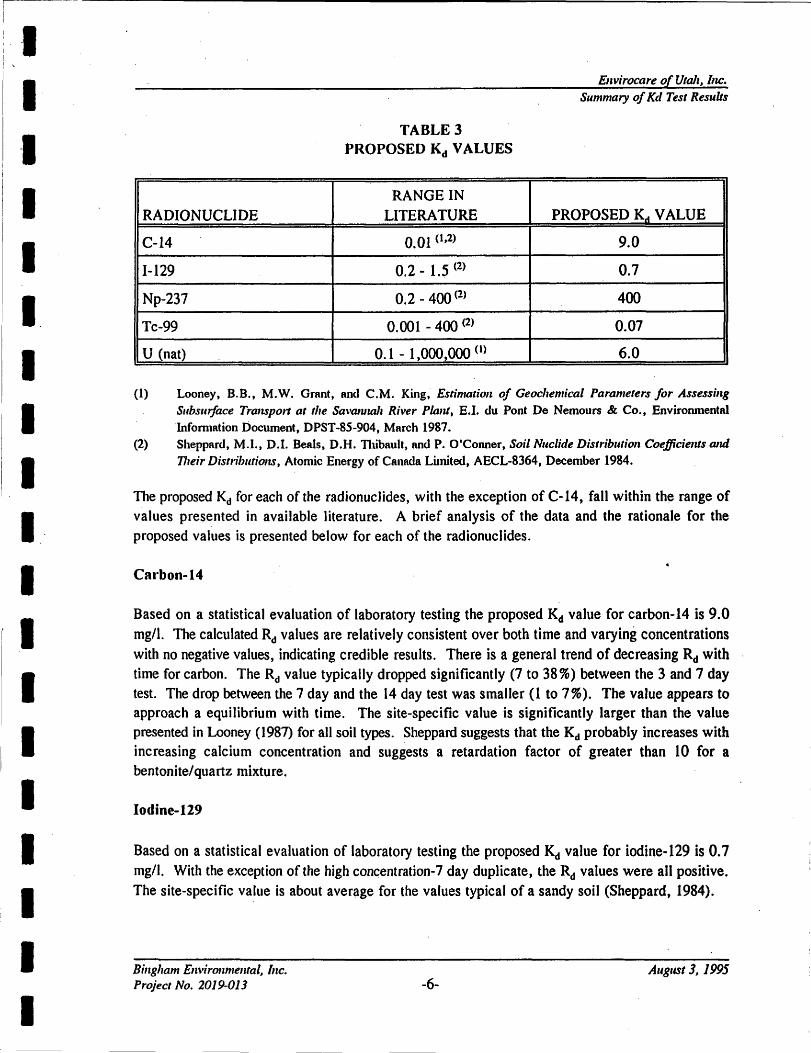
RADIONUCLIDE
C-14
1-129
Np-237
Tc-99
U (nat)
TABLE 3 PROPOSED Kd VALUES
RANGE IN LITERATURE
0.01 (1,2)
0.2 - 1.5 (2)
0.2 - 400 (2)
0.001 - 400 (2)
0.1 - 1,000,000 (1)
Ellvirocare of Uta", ["c. Summary of Kd Test Results
PROPOSED Kd VALUE
9.0
0.7
400
0.07
6.0
(1) Looney, B.B., M.W. Grant, and C.M. King, Estimation. of Geochemical Parameters for Assessing Subsll1face Transpol1 at tire Sa\'Qlur.ah River Plant, E.I. du Pont De Nemours & Co., Environmental lnfomlation Document, DPST-85-904, March 1987.
(2) Sheppard, M.I., OJ. Beals, D.H. Thibault, and P. O'Conner, Soil Nuclide Distributioll Coefficients Q/J.d 17re;r Disllibut;OIlS, Atomic Energy of Canada Limited, AECL-8364, December 1984.
The proposed Kd for each of the radionuclides, with the exception of C-14, fall within the range of values presented in available literature. A brief analysis of the data and the rationale for the proposed values is presented below for each of the radionuclides.
Cal'bon-14
Based on a statistical evaluation of laboratory testing the proposed Kd value for carbon-14 is 9.0 mg/1. The calculated Rd values are relatively consistent over both time and varying concentrations with no negative values, indicating credible results. There is a general trend of decreasing Rd with time for carbon. The Rd value typically dropped significantly (7 to 38%) between the 3 and 7 day test. The drop between the 7 day and the 14 day test was smaller (1 to 7%). The value appears to approach a equilibrium with time. The site-specific value is significantly larger than the value presented in Looney (1987) for all soil types. Sheppard suggests that the Kd probably increases with increasing calcium concentration and suggests a retardation factor of greater than 10 for a bentonite/ quartz mixture.
Iodine-129
Based on a statistical evaluation of laboratory testing the proposed Kd value for iodine-129 is 0.7 mg/1. With the exception of the high concentration-7 day duplicate, the Rd values were all positive. The site-specific value is about average for the values typical of a sandy soil (Sheppard, 1984).
Bingham Em";rollmental, Inc. Project No. 2019-013 -6-
August 3, 1995
I I I I I I I I I I I I I I I I I I I
E"virocare of Ulah, f,&C.
Summary of Kd Test Results
Neptunium-237
Based on a statis~ical evaluation of laboratory testing the proposed Kd value for neptunium-237 is 400 mg/1. The concentration of the contact solution used in the test was lower than the proposed value presented in the Work Plan, although the values are all positive and are reasonably consistent. The proposed site-specific value is at the higher end of the range of the sand Kd values presented in Sheppard (1984). The range of values for sand is 0.2 to 400, and the range for clay is 41 to 3,200.
Technetium-99
Based on a statistical evaluation of laboratory testing the proposed Kd value for technetium-99 is 0.07 mg/1. This proposed value is based on the values calculated from the verification analysis (second set of analysis) performed by the laboratory. The second analytical method is considered more accurate than the analytical method previously performed (verbal c,ommunication with Barringer, 7/27/95). The data from the second set of analysis also appears to be more consistent than the first test. All Rd values from the middle and high concentration tests are positive and fall within a reasonable range (0.07 to 0.14). The values from these tests also show a consistent decrease in Rd with time .. The Rd value typically dropped 20 to 30 % between the 3 and 7 day test, and the 7 day and the 14 day test; for a total decrease of about 50% between the 3.and 14 day tests. The negative values from the lower concentration tests are accounted for by setting them equal to 0.001 for statistical evaluation. The proposed site-specific value is near the lowest values reported in literature. The range of Kd values for a sandy soil ranged from 0.001 to 400 (Sheppard, 1984).
V.·allium (natural)
Based on a statistical evaluation of laboratory testing the proposed Kd value for all uranium isotopes is 6.0 mg/I. Values for the middle and highest concentrations were not utilized because the uranium was observed to precipitate out of the contact solution at these higher concentrations. It was possible to determine a value for the lower concentration because the uranium remained in solution. The lower-concentration value is assumed to represent field conditions; due to precipitation occurring at the higher concentrations.
The Rd value for the 3 day test was an order of magnitude larger than the value of the 7 arid 16 day tests. Therefore; in order to remain conservative, the proposed value is the average of the 7 and the 16 day tests. The values for these tests was 5.8 and 6.2, indicating little variance. The proposed site-specific value is in the middle range of values reported in literature for a sandy soil. The range of Kd values for a sandy soil ranged from 0.13 to 16, the range for a clay soil ranged from 200 to 8.0E+5 (Sheppard, 1984).
Bingham Environmental, Illc. Project No. 2019-013 -7-
August 3, 1995
I I I I
APPENDIX A
I WORK PLAN
I I I I I -I I"
I I I I I I I
~
I I I I I I I I I I I I-I I. I I I I I
WORK PLAN
DISTRIBUTION RATIO (KJ TESTING
ENVIROCARE OF UTAH LOW ACTIVITY RADIOACTIVE WASTE (LARW) DISPOSAL SITE
SOUTH CLIVE, UTAH
Prepared Cor
ENVIROCARE OF UTAH, INC 46 West Broadway, Suite 240 Salt Lake City, Utah 84101
Prepared by
BINGHAM ENVIRONMENTAL, INC. 5160 Wiley Post Way
Salt Lake City, Utah 84116
I I I I I I I I I I I I-
I I. I ·1 I I I
Distribution Ratio Work Plan Tab,. of ContenI8
TABLE OF CONTENTS
SECTION 1 PROJECT DESCRIPTION . . . . . . . . . . . . . . . . . . . . . . . . . . . . . . . . . 1
1.1 GENERAL OVERVIEW . . . • • . . . . . . • . . . . . . . . . . . . . . . • . . • . . • 1 1.2 OBJEcrIVES. . . . . . • . . . . . • . . . . . • . • . . . . . • . . • . . . . . . . . . . • 1 1.3 PROJECT SCHEDULE . . . . . . • • • . . . • • . . • • . . • . • . • . • • • . . . • . • 1 1.4 PROJECT RESPONSIBIUTIES .••...........•.•..••...•...• 1
SEcrION 2 APPROACH .....•......•..•...•................•..•.• 3
2.1 GENERAL . . . . . . . . . . . . . . . • . . . . . . . . . . . . . . . . . . . . . . . . . . . 3 2.2 CRITICAL CONTAMINANTS . . . . . . . . . . . . . . . . . . . . . . . . . . . . . . 3 2.3 FACTORS INFLUENCING ~ VALUES .. . . . . . . . . . . . . . . . . . . . . . 4
2.3.1 Soil Type . . . . . . . . . . . ... . . . . . . '.. . . . . . . . . . . . . . . . . . . 4 2.3.2 Contact Solution Radionuclide Concentrations ................ 4 2.3.3 Contact Solution pH ................................ 5 2.3.4 Contact Solution Eh ................................ 5
2.4 TEST ME'I"HOD ..........•.......•...•................ 5
SECTION 3 MATERIAL PROGRAM . . . . . . . . . . . . . . . • . . . . . . . . . . . . . . . . . . 7
3.1 MATERIALCOLLECTION ............................... 7 3. 1.1 Unit 3 Sand ..................................... 7 3.1.2 Groundwater ..................................... 7
3.2 MATERIAL ANALYSIS .................................. 8 3.2.1 Soil Analysis . . . . . . . . . . . . . . . . . . . . . . . . . . . . . . . . . . . . . 8 3.2.2 Groundwater Analysis ............................... 8
SECTION 4 ANALYTICAL LABORATORY PROGRAM ..................... 9
4.1 TEST SUMMARY . . . . . . . . . . . . . . . . • . . . . . . . . . . . . . . . . . . . . . 9 4.2 CONTACT SOLUTION GENERATION ....................... 10
4.2.1 Procedure...................................... 10 4.2.2 Concentrations................................... 10
4.3 ANALYTICAL TESTING . . . . . . . . . . . . . . . . . . . . . . . . . . . . . . .. 11
SECTION 5 QUAUTY ASSURANCE OBJECTIVES . . . . . . . . . . . . . . . . . . . . . .. 12
5.1 OBJECTIVE ......................................... 12 S.2 ANALYTICAL METHODS . . . . . . . . . . . . . . . . . . . . . . . . . . . . . .. 12
SECTION 6 DISPOSAL OF CONTAMINATED MATERIAL ................. 14
Bi1lgluJm Ellvironmenlal. [IIC.
Proj~ct No. 2019-013 TC 1 March 15. 1995
I I I I I I I I I I I I" I I. I I I I I
DistribUlioli Ratio Work Plan Project Description
SECTION!
PROJECT DESCRIPTION
1.1 GENERAL OVERVIEW
This worle plan presents the procedure for determining site-specific distribution ratios (K.·s) for five radionuclides at Envirocare's Low Activity Radioactive Waste (LARW) disposal cell. The new K. values derived from laboratory testing is anticipated to be used in continuing contaminant transport modelling for the Envirocare facility. Bingham Environmental Inc. (Bingham) has previously performed contaminant transport modelling for both metals and radionuclides at the Envirocare LARW site. The results are presented in the Report of Contaminant Transport ModelUng, hereafter called the Ref (Bingham, 1993).
1.2 OBJECTIVES
The objective of the K.s testing presented in this work plan is to determine appropriate saturated-sand K. values for five radionuclides, utilizing test conditions which are repres~ntative of the soil, groundwater, and expected radionuclide concentration conditions at the site. Previous K. values used in contaminant transport modelling were the lowest values reported in literature and were not based on actual site conditions. Site soils and groundwater will be collected and used for the proposed K. tests. Varying concentrations of the five radionuclides will be added to the groundwater, modelling the discharge of leachate from the waste cell into the groundwater. These site-specific ~ values will be used to reevaluate previous contaminant transport modelling performed in the saturated zone (shallow aquifer) as described in the RCT.
1.3 PROJECT SCHEDULE
The project is anticipated to require 7 weeks from the delivery of groundwater and soil samples to Bingh-am Material Laboratory (Bingham Laboratory). Laboratory analysis of the soil and groundwater samples is estimated to require approximately 6 weeks. The remaining week will be required for analysis of laboratory reports and preparation of a summary report.
1.4 PROJECT RESPONSIBILITIES
Envirocare will collect and deliver the specified Unit 3 soil and groundwater materials to Bingham Laboratory. Bingham Laboratory will then perform testing on the soil to demonstrate the materials representativeness of the Unit 3 soil. Bingham will deliver the groundwater samples to a StateCertified laboratory for analysis of the groundwater. Bingham will analyze the results from the groundwater analysis to determine if the groundwater is representative of site conditions. Bingham will ship the groundwater and soil materials to Controls for Environmental Pollution, Inc. (CEP),
Billgham Ellvirmamenlal, Inc. Project No. 2019-013 1
Marcl. 15, 1995
I I I I I I I I I I I I
I I. I I I I ,I
DistributiOlI Ratio Work Pftm Project Description
located in Santa Fe, New Mexico, who will prepare the contact solution and perform batch and analytical testing on the contact solution and soil. CEP will also be responsible for procuring radionuclide material for the tests and disposal of the contact solution and soil used in the testing. Bingham will oversee all testing; review the quality control for the preparation and analytical testing of the contact solution; and prepare a report summarizing the results.
Bing/ram Envirollmenlal. Inc. . Project No. 2019-013 2
Marcil 15, 1995
I I I I I I I I I II I
I I. I I I I I
Distribution Ratio Work Pima Approach
SECTION 2
APPROACH
2.1 GENERAL
An important parameter that significantly influences groundwater transport of a particular ,- contaminant is it's K. value. The ~ value is the ratio of the concentration of the contaminant
absorbed to solid material to the concentration in solution, and provides an indication of how rapidly the contaminant can move relative to the rate of groundwater. The lower the K., the more mobile the contaminant. Site specific K. values for the LARW site have not been determined in the past: therefore; the lowest value reported in literature under varying conditions has been used. For most elements this has resulted in very conservative K.. assumptions. For instance, the' K. range for Uranium is 0.1 to 1,000,000. The value used in contaminant transport modelling was 0.1, which is 7 orders of magnitude smaller than the largest reported K.. value. K.. values for selected radionuclides will be determined under conditions similar to actual field conditions.
K.s values are dependent on several factors, including soil type and groundwater chemistry. Soil and groundwater conditions that promote the adsorption of the contaminant to the soil, resulting in lower concentrations in the water, result in high Kc. values. Typically the K. value for a clay soil is larger than for a sandy soil due to the increased surface area, and the electrical charge on the clay particles which tend to attract the nlJclides. The pH and redox potential (Eh) of the groundwater also affects contaminant mobility due to their effects on adsorption of-the -radionuclide.
The K. tests will be performed under conditions typical of the shallow aquifer under the LARW waste cell. Unit 3 sand material will, be collected and will be used in the K. tests. Groundwater from the site will also be collected, and spiked with the radionuclides in order to manufacture a contact solution for the tests. The contact radionuclide tests will be performed over a range of concentrations predicted by previous contaminant transport modelling (ReT, 1993).
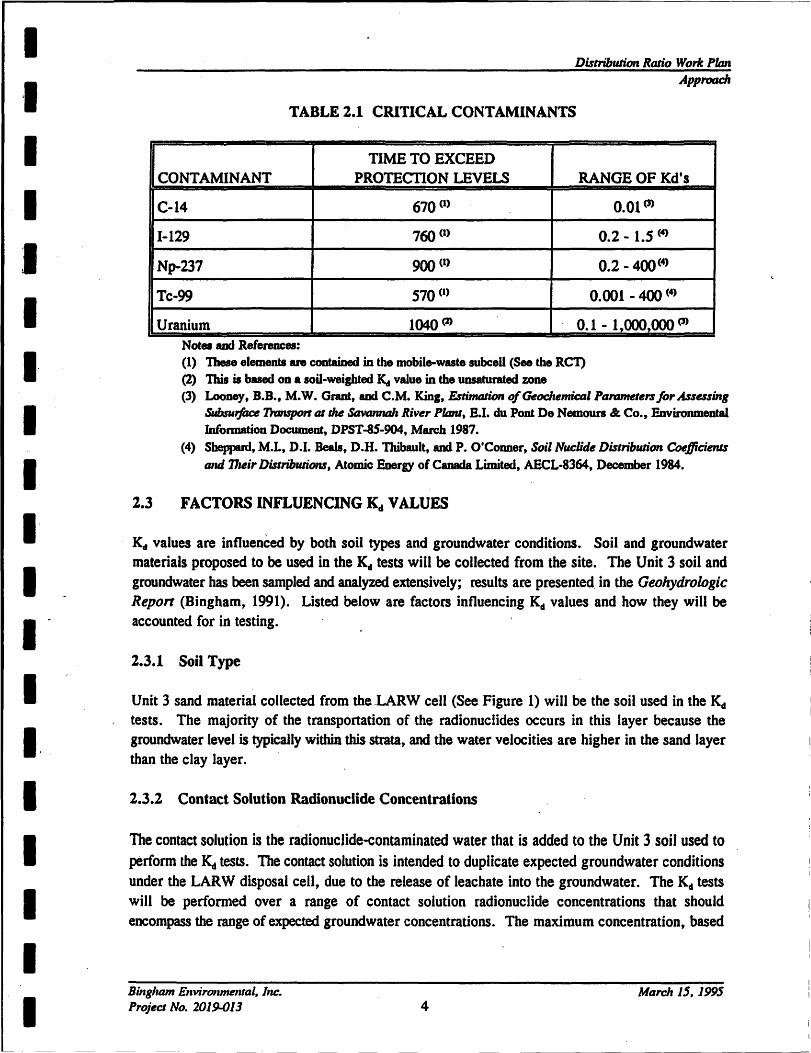
2.2 CRITICAL CONTAMINANTS
Kd tests will be performed on selected "critical contaminants n • Critical contaminants are those contaminants which have an assumed Kd that is very low, and therefore have very low retardation rates resulting in high mobility in groundwater. Another factor to consider in choosing critical contaminants is the range of ~ values reported for the contaminant in literature. If the contaminant has a large range of Kd values, there is a good possibility of defining a site-specific Kd that is significantly larger than the assumed value. Listed below are the contaminants that are proposed for Kct testing._
Billg/ram Environmelllal. /IIC.
Project No. 2019-013 3 Marcia 15. 1995
- ---- --------------'
1 'I 1 1 I 1 I· 1 I I· 1 • " 1 I. I I 1 1 1
2.3
Distribution Ratio Work Pima Approach
TABLE 2.1 CRITICAL CONTAMINANTS
TIME TO EXCEED CONTAMINANT PROTECTION LEVELS RANGE OF Kd's
C-14 670 (I) 0.01 (3)
1-129 760 (I) 0.2 - I.S (4)
Np-237 900 (I) 0.2 - 400(4)
Tc-99 570 (I) 0.001 - 400 (4)
Uranium 1040 (2) 0.1 - 1,000,000 (3)
Notes aud References: (1) These elements are contained in the mobile-waste subcell (See the RCT) (2) This is based OD a soil-weighted ~ value in the unsaturated ZODe (3) Looney, B.B., M.W. Grant, aDd C.M. King, Estimation of Gttochemietd PammetenforAssusing
SubsuIj'ac6 7ir:rnspon at die SavannaJ. River P1Dnt, E.I. du Pont De Nemours 8t Co., Environmental Information Document, DPST-85-904, March 1987.
(4) Sheppard, M.I., D.I. Beals, D.H. Thibault, and P. O'Conner, Soil Nuclidll Distribution COtI,fficienlS mid 17'lIir Distributions, Atomic Energy of Canada Limited, ABeL-8364, December 1984.
FACTORS INFLUENCING K. VALUES
K. values are influenced by both soil types and groundwater conditions. Soil and groundwater materials proposed to be used in the K. tests will be collected from the site. The Unit 3 soil and groundwater has been sampled and analyzed extensively; results are presented in the Geohydrologic Repon (Bingham, 1991). Listed below are factors influencing K. values and how they will be accounted for in testing .
2.3.1 Soil Type
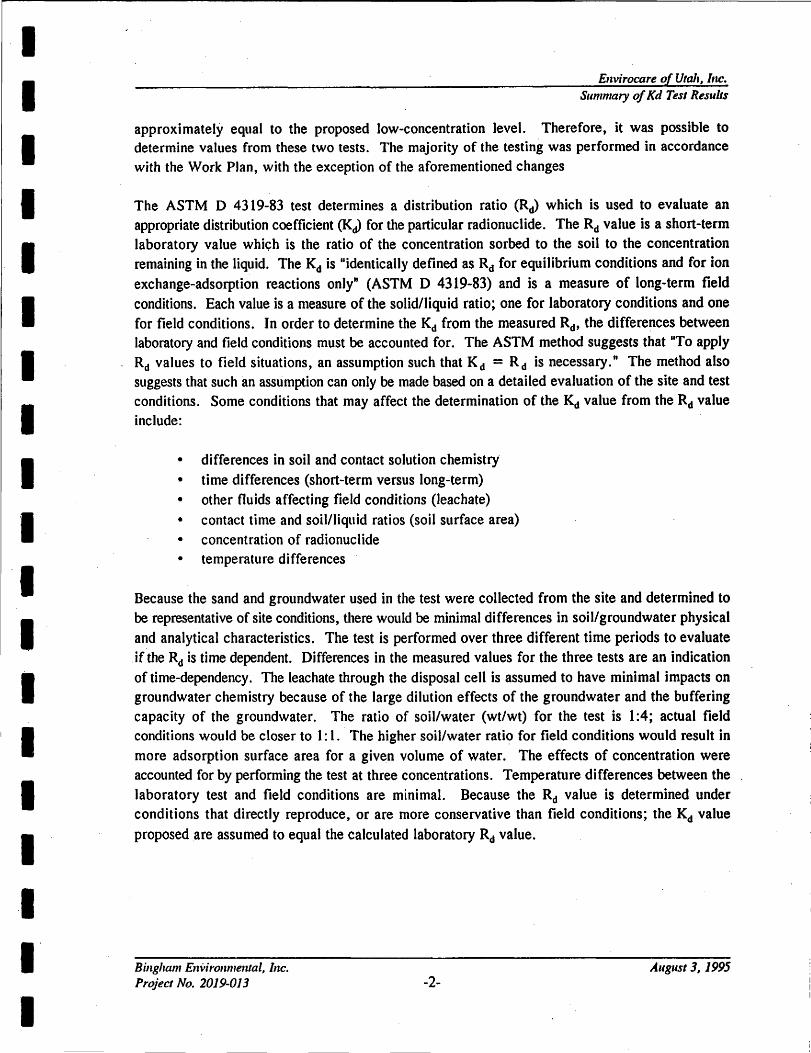
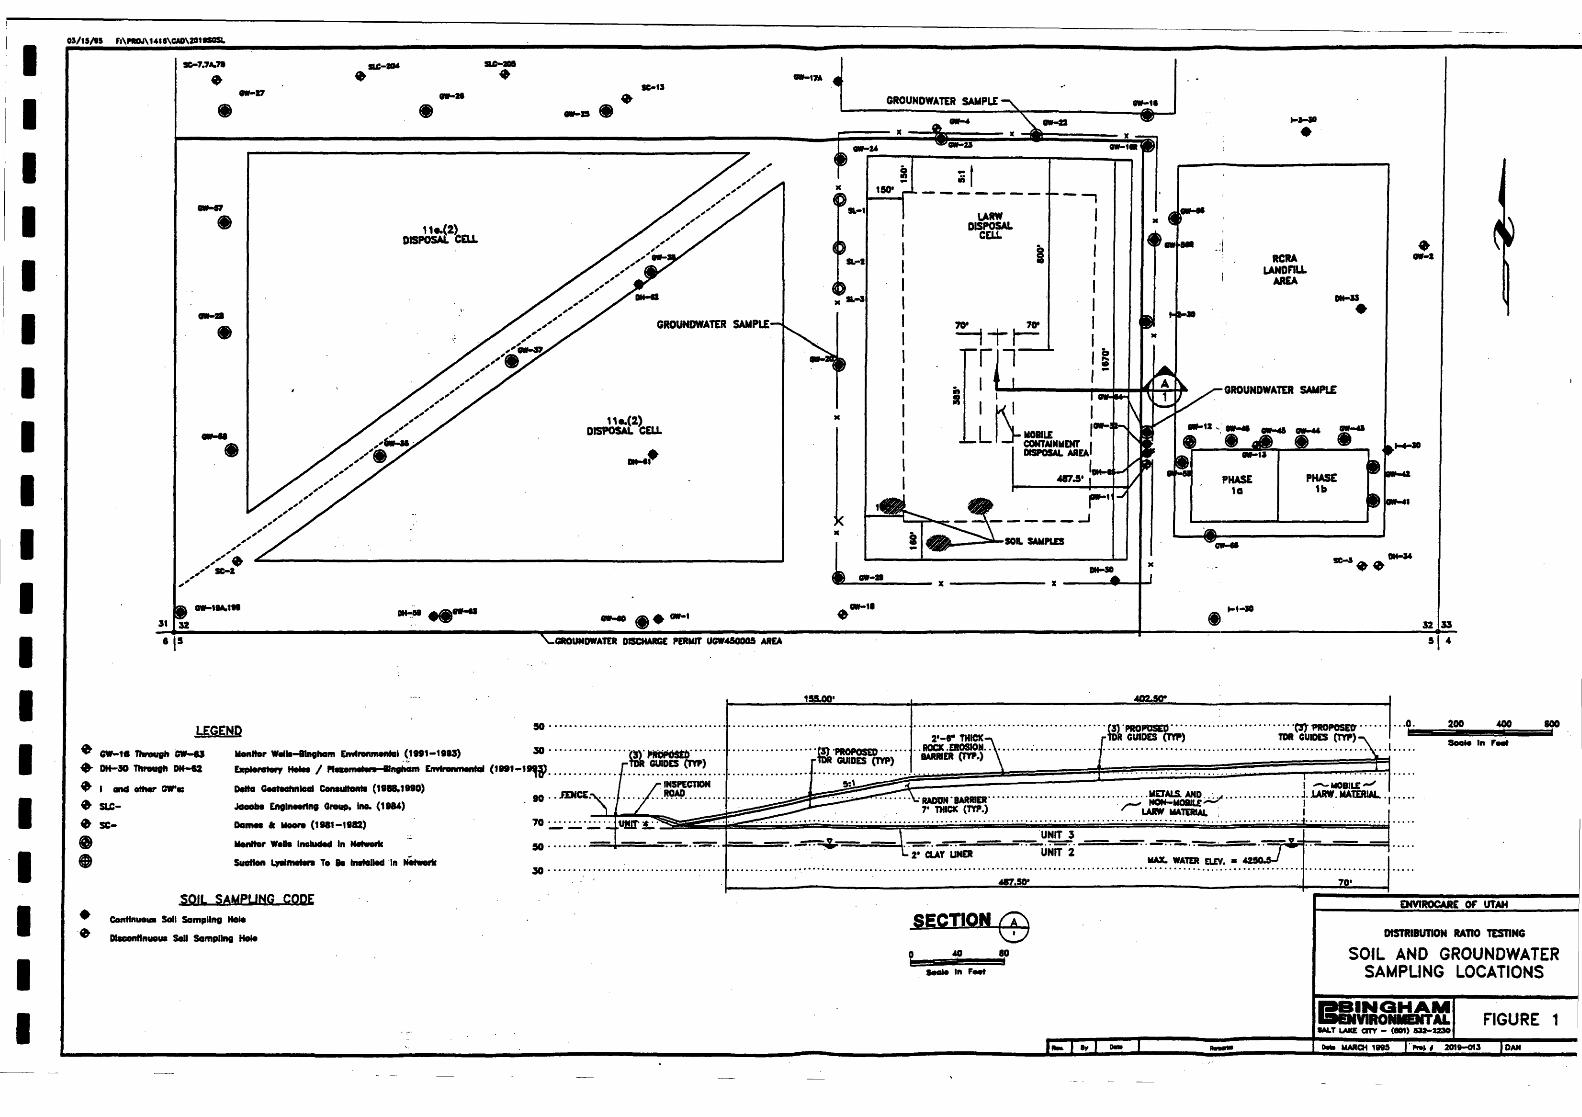
Unit 3. sand material collected from the .LARW cell (See Figure I) will be the soil used in the K. tests. The majority of the transportation of the radionuclides occurs in this layer because the groundwater level is typically within this strata, and the water velocities are higher in the sand layer than the clay layer.
2.3.2 Contact Solution Radionuclide Concentrations
The contact solution is the radionuclide-contaminated water that is added to the Unit 3 soil used to perform the Kd tests. The contact solution is intended to duplicate expected groundwater conditions under the LARW disposal cell, due to the release of leachate into the groundwater. The K. tests will be performed over a range of contact solution radionuclide concentrations that should encompass the range of expected groundwater concentrations. The maximum concentration, based
Billgllam E,lv;rOlunental. Inc. Projllct No. 2019-013 4
Marcil 15. 1995
I I I I I I I I I I' I • " I I I I I I I
Distribution Ratio Work Plan ApprotJCh
on maximum permitted waste concentrations, will be used as the upper range of the radionuclide concentrations. Tests will be performed at two other concentrations; at 112 of the maximum .concentration, and at the concentration typical of laboratory ~ testing. The three tests will be used to develop a graph of concentration in the solid phase vs. concentration in the liquid phase •.
2.3.3 Contact Solution pH
The Kd for a particular contaminant is sensitive to the pH of the water/soil matrix. Generally the lower the pH the smaller the K. value and the greater the mobility. There is the potential for low pH leachate to be produced from certain waste material disposed in the cell. The pH of the existing groundwater at the site typically ranges from neutral to slightly basic.
The pH of the existing groundwater is predicted to be insensitive to the application of a low-pH leachate, due to the large buffering capacity of the existing soil and groundwater. The buffering capacity is the result of a very high concentration of bicarbonate and carbonates in the groundwater and soil. Liner compatibility tests were performed on the silty clay soils at the site (Bingham, 1994); the pH of the leachate varied from 2 to 7. The leachate was passed through a compacted clay sample to detennine how the leachate affected the hydraulic conductivity of the clay liner. In the tests, the leachate that percolated through the soil was buffered and the effluent pH was above 7 in all cases.
The pH of the contact solution for the Kd tests will be the same pH value as the composite water sample from the three wells. This should accurately duplicate actual field conditions due to the pH of the groundwater having little variability over the LARW area. Also, the pH of the site· groundwater is predicted to be minimally affected by the addition of potentially low pH leachate, due to the buffering capacity of the groundwater and the dilution of the leachate within the groundwater .
2.3.4 Contact 'Solution Eh
The -K.. for a particular contaminant is also sensitive to the Eh of the water/soil matrix. Because of the existing high salinity and total dissolved solids in the water, the Eh of the groundwater is believed to be minimally impacted due to the addition of the leachate into the groundwater. In addition to the high salinity and TOS of the groundwater, the leachate will be significantly diluted across the depth of the saturated Unit 3 soil. The Eh of the contact solution will be the same Eh value as the groundwater composited from the three wells.
2.4 TEST MEmOD
The test that will be performed to determine Kd values is ASTM method 0 4319-83, Standard Test
Method for Distribution Ratios by the Short-Term Batch Method. The steps of the test are summarized below:
Bing/ram Environmental. Illc. Project No. 2019-013 5
March 15.1995
I I I·
·1 I I I I I
I 1-
I I. I .1 I I I
Distribution Ratio Work Pima Approach
• Site-specific groundwater and soil samples will be collected and it will be demonstrated that the samples are representative of the LARW site.
• . Contact solution consist of the site groundwater with varying radionuclide concentrations added.
• The contact solution will be applied to the soil. • Following testing protocol times, the contact solution will be decanted from the soil.
• The soil and contact solution will be analyzed to determine ~ values.
• The results will be summarized and reported by Bingham.
Test conditions are designed to ensure that the K. value is realistic and reasonably conservative for variations in both the soil, and the leachate generated from the disposal cell. Using groundwater and soil from the site will minimize the variability between laboratory derived K. values and actual field values.
Bing/ram Environmental. [,IC.
Project No. 2019-013 6 Marcil 15. 1995
• • • • I I I I I I·
• • -I I. I I I I I
Distribution Ratio Work Plan MtJlerial Program
SECTION 3
MATERIAL PROGRAM
3.1 MATERIAL COLLECTION
Materials used in K. testing will be Unit 3 sand and groundwater from the LARW site, in order to replicate site conditions to the best extent possible. Soil and groundwater will be collected from the site by Envirocare and will be delivered to Bingham Laboratory, for analysis and preparation for shipment to the analytical laboratory.
3.1.1 Unit 3 Sand
The sand material proposed for performing the K. tests will be representative material from the Unit 3 layer at the Clive site. The soil will be collected by Envirocare from three (3) locations, see Figure 1. The majority of the overlying Unit 4 clay has already been excavated in the soil sampling area, to be used as liner and cover material for the LARW cell. The Unit 3 sand is therefore expected to be within 2 feet of the bottom of the existing excavation in the soil sampling area. If the Unit 3 sand is exposed in this area, the soil sample should be collected from at least 1 foot below the surface. The material will be visually inspected at the time of collection to verify the material is Unit 3 sand. The material will be identified by location, placed in a labeled and sealed 5 gallon bucket, and transported to the Bingham Material Laboratory by Envirocare personnel. The amount collected will be approximately 7S kgs. (one .moderately packed 5 gallon bucket per location) for a total of 15 gallons. The soils will be tested and the characteristics of the collected material will be compared to existing Unit 3 data to ensure the material is representative of Unit 3 soils . Extensive data exists for the Unit 3 sand and is presented in the Hydrogeological Report (Bingham, 1991).
3.1.2 Groundwater
Groundwater from the Clive site will be collected and used as the contact solution for the K. test. The groundwater will be collected from three wells; GW-20, GW-22, and GW-64~ The wells are located around the perimeter of the LARW cell. The groundwater will be composited at the analytical laboratory that is performing the Kd tests to achieve a groundwater that is representative of site conditions. The material will be collected by Envirocare by pumping water from the weJls. Three well casings will be removed from the well prior to collection of the sample to ensure that the water is representative of groundwater in the soil. Groundwater analytical samples will also be collected at this time (See Section 3.2). The groundwater for the Kd tests will be placed in clean 5 gallon containers, provided by the laboratory that is performing the groundwater analytical tests, and transported to the Bingham Material Laboratory by Envirocare personnel. The contact solution amount collected will be at least 5 gallons per well, for a total of 15 gallons. The groundwater will
Binglram EnvirOlunelllal, Inc. Project No. 2019-013 7
March 15. 1995
I I I I I
• I I
• • I
." I I. I
• I I I
Distribution Ratio Worlc Pltm Marerial Program
be analyzed and compared to existing chemistry data for the groundwater at the site.
3.2 MATERIAL ANALYSIS
The soil and groundwater will be analyzed prior to performing the Kct tests to ensure that the materials are representative of site conditions. The characteristics of the collected soil and groundwater will be compared to existing data for the Unit 3 soil and the groundwater.
3.2.1 Soil Analysis
Extensive previous laboratory testing has been performed for Unit 3 soil material. The soil has been characterized as a tan silty sand material. The Unit 3 material has been shown to be quite homogenous across the site in both gradation and chemistry. Bingham laboratory will perform grain size distribution curves on the three soil samples to determine if the soil is typical of Unit 3 soils.
3.2.2 Groundwater Analysis
Extensive laboratolY testing has been performed for groundwater at the Clive site. The groundwater has been classified as a Class IV groundwater (saline groundwater) due to elevated levels of TDS. All analytical tests presented in Table 5.1 will be performed on the groundwater prior to shipping to CEP to determine if the sample is representative of the shallow aquifer.
Bing/ram Environmental, Inc. Project No. 2019-013 8
Marclr 15, 1995
I I I I I I· I I I I' I I-
I I. I I I I I
Distribution Ratio Work Plan Analytical Loboralory Program
SECTION 4
ANALYTICAL LABORATORY PROGRAM
4.1 TEST SlUMMARY
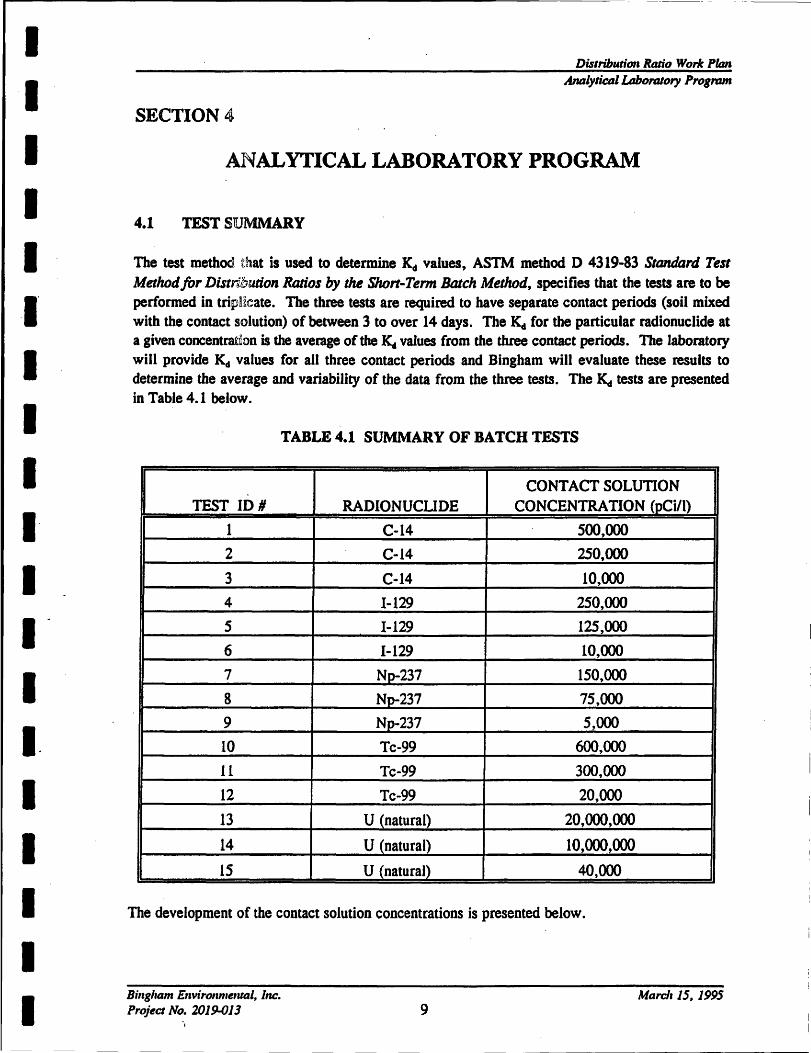
The test method that is used to determine Kd values, ASTM method D 4319-83 Standard Test Methodfor Distribution Ratios by the Short-Term Batch Method, specifies that the tests are to be performed in tripHcate. The three tests are required to have separate contact periods (soil mixed with the contact solution) of between 3 to over 14 days. The Kd for the particular radionuclide at a given concentra~don is the average of the K.. values from the three contact periods. The laboratory will provide Kd values for all three contact periods and Bingham will evaluate these results to determine the average and variability of the data from the three tests. The Kc. tests are presented in Table 4.1 below.
TABLE 4.1 SUMMARY OF BATCH TESTS
CONTACT SOLUTION TEST IDN RADIONUCUDE CONCENTRATION (pCi/1)
1 C-14 500,000
2 C-I4 2S0,OOO
3 C .. 14 10,000
4 1-129 250,000
5 1-129 I2S,OOO
6 1-129 10,000
7 Nj)-237 150,000
8 Np-237 75,000
9 Np-237 5,000
10 Tc-99 600,000
11 Tc-99 300,000
12 Tc-99 20,000
13 U (natural) 20,000,000
14 U. (natural) 10,000,000
15 U (natural) 40,000
The development of the contact solution concentrations is presented below.
Bingham Ellvirollnrelllal, Inc. Project No. 2019-013
.,
Marcil 15. 1995 9
r----------------------------------- -
I I I I I I I I I I 1 I I I· 1 I I I I
Distribution RtJlio Work plari AntJIytictJllAborcuory ProgrtJIII
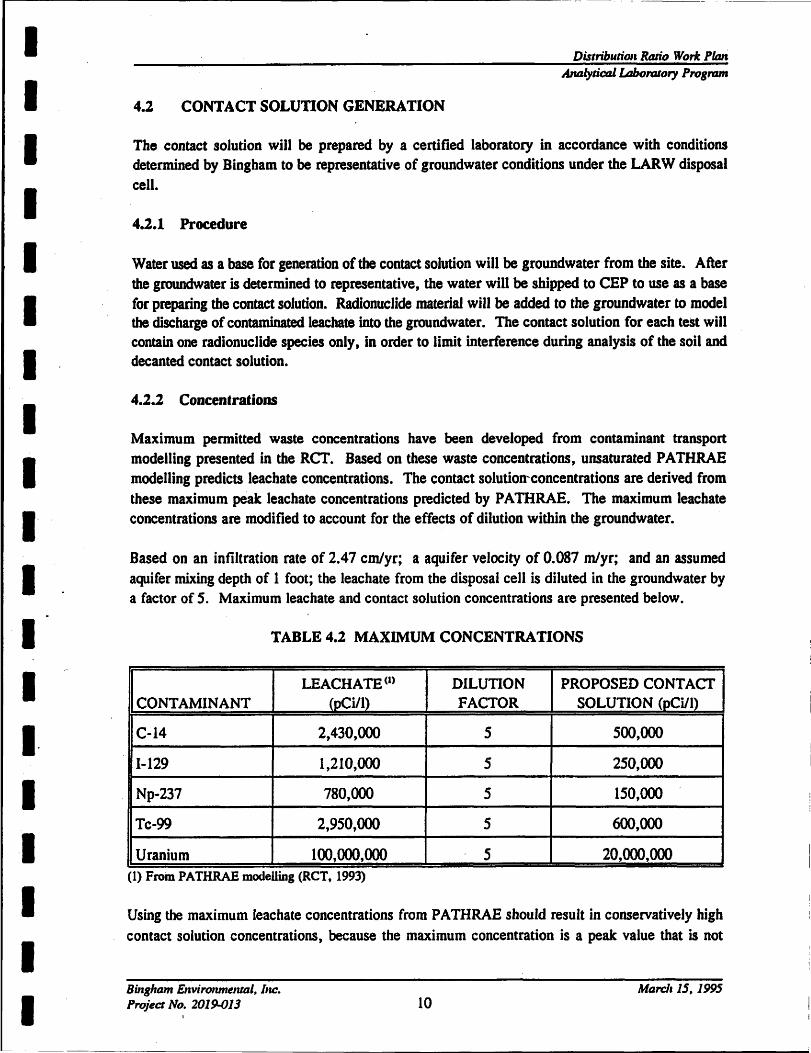
4.2 CONTACT SOLUTION GENERATION
The contact solution will be prepared by a certified laboratory in accordance with conditions determined by Bingham to be representative of groundwater conditions under the LARW disposal cell.
4.2.1 Procedure
Water used as a base for generation of the contact solution will be groundwater from the site. After the groundwater is determined to representative, the water will be shipped to CEP to use as a base for preparing the contact solution. Radionuclide material will be added to the groundwater to model the discharge of contaminated leachate into the groundwater. The contact solution for each test will contain one radionuclide species only, in order to limit interference during analysis of the soil and decanted contact solution.
4.2.2 Concentrations
Maximum permitted waste concentrations have been developed from contaminant transport modelling presented in the RCT. Based on these waste concentrations, unsaturated PATH RAE modelling predicts leachate concentrations. The contact solutioll'concentrations are derived from these maximum peak leachate concentrations predicted by PA THRAE. The maximum leachate concentrations are modified to account for the effects of dilution within the groundwater.
Based on an infiltration rate of 2.47 cm/yr; a aquifer velocity of 0.087 m/yr; and an assumed aquifer mixing depth of 1 foot; the leachate from the disposal cell is diluted in the groundwater by a factor of 5. Maximum leachate and contact solution concentrations are presented below.
TABLE 4.2 MAXIMUM CONCENTRATIONS
LEACH A TE (1) DILUTION PROPOSED CONTAcr CONTAMINANT (pC ill) FACTOR SOLUTION (pCi/l)
C-14 2,430,000 5 500,000
1-129 1,210,000 5 250,000
Np-237 780,000 5 150,000
Tc-99 2,950,000 5 600,000
Uranium 100,000,000 5 20,000,000 (1) From PATHRAE modelling (ReT, 1993)
Using the maximum leachate concentrations from PATHRAE should result in conservatively high contact solution concentrations, because the maximum concentration is a peak value that is not
Bing/ram Environmental, Illc. Project No. 2019-013
I
Marc/.1S, 1995 10
-----------------------------------------------------------------------------------~
I I I I I I I I I I I I" I I. I I I I I
Distribution RtJlio Work Piau AnalytictJllAbortJlory Program
sustained over time. Also, after the leachate has traveled in the groundwater for any significant length the leachate will be diluted due to the addition of groundwater and the effects of dispersion and diffusion.
4.3 ANALYTICAL TESTING
A total of fifteen (IS) batch tests will be pe~ormed utilizing the radionucJide-spiked contact solutions shown in Table 4.2. The soil and contact solution will be analyzed to determine the
concentration of the particular radionuclide in both the soil and in the contact solution. Based on these concentrations, a K.. value for the radionuclide will be calculated. Results from the tests will be reviewed by Bingham to determine if QA/QC guidelines were met.
Biflglram Ellvironnlf!1ltal, Illc. Project No. 2019-013 11
March 15. 1995
I I I I I I I I I I I I" I -I. I I I I-
I
Distribution Ratio Work Pima Quality Assu1'tlllCe Objectives
SECTION 5
QUALITY ASSURANCE OBJECTIVES
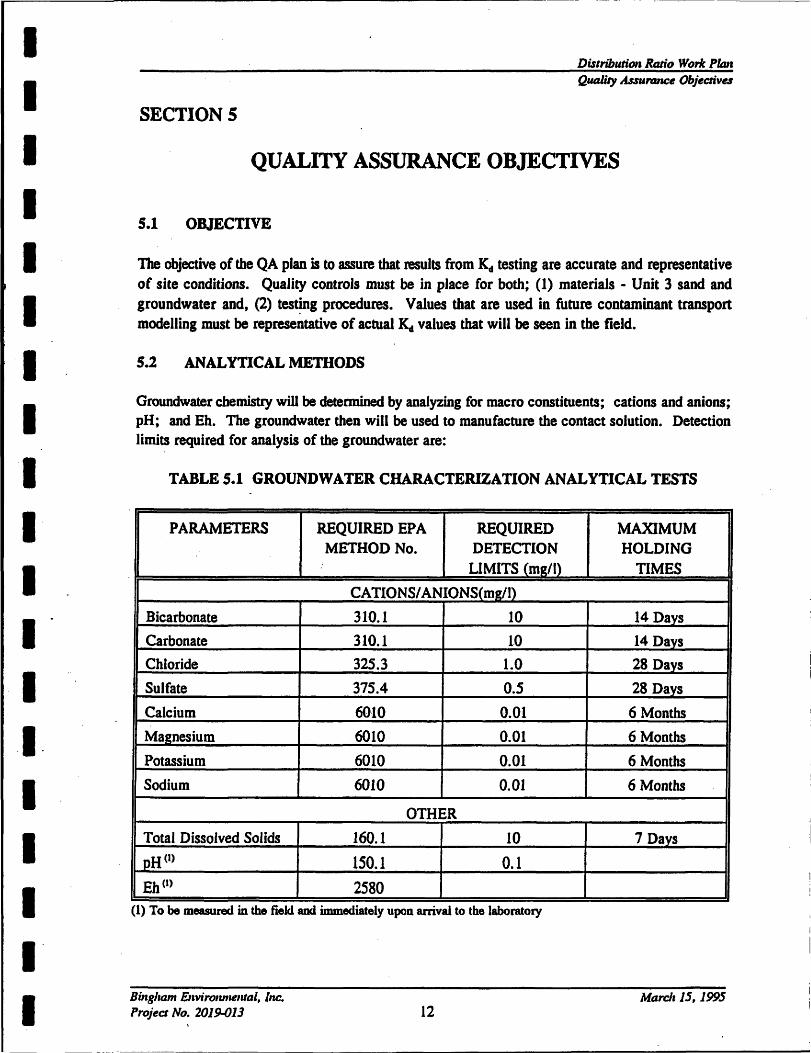
S.1 OBJECTIVE
The objective of the QA plan is to assure that results from Kd testing are accurate and representative of site conditions. Quality controls must be in place for both; (1) materials - Unit 3 sand and groundwater and, (2) tes~g procedures. Values that are used in future contaminant transport modelling must be representative of actual K. values that will be seen in the field.
5.2 ANALYTICAL METHODS
Groundwater chemistry win be detennined by analyzing for macro constituents; cations and anions; pH; and Eh. The groundwater then will be used to manufacture the contact solution. Detection limits required for analysis of the groundwater are:
TABLE 5.1 GROUNDWATER CHARACTERIZATION ANALYTICAL TESTS
PARAMETERS REQUIRED EPA REQUIRED METHOD No. DETECTION
LIMITS (mgtl)
CATIONSI ANIONS(mg/1)
Bicarbonate 310.1 10
Carbonate 310.1 1.0
Chloride 325.3 1.0
Sulfate 375.4 O.S Calcium 6010 0.01
Magnesium 6010 0.01
Potassium 6010 0.01
Sodium 6010 0.01
OTHER
Total Dissolved Solids 160.1 10 pH(t) 150.1 0.1 Eh(l) 2580
(1) To be measured in the field and immediately upon arrival to the laboratory
Binglram Envirollmental, Inc. Project No. 2019-013 12
MAXIMUM HOLDING
TIMES
14 Days
14 Days
28 Days
28 Days
6 Months
6 Months
6 Months
6 Months
7 Davs
March 15, 1995
----_.------------------------------------
I I I I I I I I I I I I-
I I. I-I I I I
Distribution Ralio Work Pima Quality Assurance Objectives
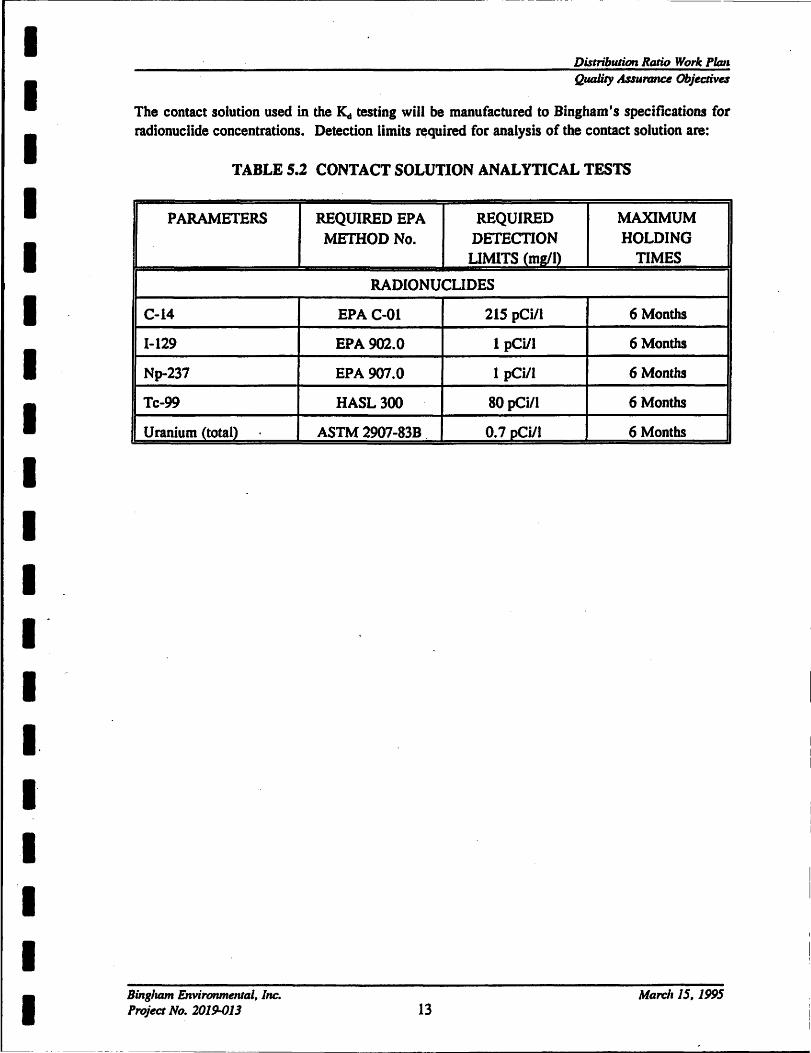
The contact solution used in the Kd testing will be manufactured to Bingham's specifications for radionuclide concentrations. Detection limits ~quired for analysis of the contact solution are:
TABLE 5.2 CONTACT SOLUTION ANALYTICAL TESTS
PARAMETERS
C-14
1-129
Np-237
Tc-99
Uranium (total)
Bingham Environmmtal. Inc. Project No. 2019-013
REQUIRED EPA REQUIRED METHOD No. DETECTION
UMITS (mg/I)
RADIONUCLIDES
EPA C-Ol 215 pCill
EPA 902.0 1 pC ill
EPA 907.0 1 pCill
HASL300 80 pCi/l
ASTM 2907-83B 0.7 pCi/l
13
MAXIMUM HOLDING
TIMES
6 Months
6 Months
6 Months
6 Months
6 Months
Marcia 15. 1995

I I I I I I I I I I I I I I· I I I I I
- --_ .. -- ----
Distribution Ralio Work Pima
SECTION 6
DISPOSAL OF CONTAMINATED MATERIAL
All analytical radionuclide testing of soil and contact solution will be performed by CEP. AU contaminated equipment and clothing will be collected and disposed of in an approved method. Disposal of aU radioactive material and equipment will be performed by CEP. A record of disposal and a record of transfer will be sent to Bingham and retained in our files, with proof of license authority by the recipient. All tranSporting of licensed material to a carrier for transport will be don~ in accordance with- the provisioDS of TItle 10, code of Federal Regulations, Part 71, ·Packaging for Radioactive Material for Transport and Transportation of Radioactive Material Under Certain ConditioDS.
Bing/ram Environm~nral, /IIC.
Proj~CI No. 2019-013 14 Marcil 15, 1995
- --- ----------------------'
I I I I
II II
I I I I I I
I I II
I I I I
OS/ .. /l5 'a\I'ICN\141I\CAD\ZO' ....
~1.7"71
• • .... ., (I)
...., •
.... •
---•
--.... ,. 31131
I pi
ILC-ID'
..... •
" .. (2) DISPOSAL CEU.
~ ........
---• • --II •
sc-tJ
GROUNDWATER SAMPLE
" .. (2) DISPOSAL CELL
.....,
.... .. --' GROUI!1DWATER DISCHARGE PERMIT UGW...sooas AREA
--tJA
Ie ~
Ie
GROUNDWATERSAWPLE __ 11 ... aw-a
'-.11
it --, -m·
~RW DISPOSAL cw.
i
70" 7f1'
~-rr-rJl
i
!2 === SOIL SAWPLES
I I I I I I I I 15 ,-
~ JC
>WI X x. e--"
155.DD' 402..50-
I
.:( I
t-I-IO
•
RCM LANDnLL
AREA DH-JS •
PHASE PHASE 1a 11:1
GW-tI
sc...a e 'I'» DH-I4
I), t-''''
• .-1
.l21D
5\ 4
• LEGEND 50 .•........•••......•.••...........•............•••••••••.. " .........•.... 'j' ....................... . •
GW-ttl Througft ow-u .......... W .... -8Inghcnn EMI,..,."......I (1111-1.13) 30 . ................ ..... .... 2"-r THICK-,\ ................ ~'=DPOSEDES ~) .................... :;,;,;.OO'1lROPGSED'····· .,,,.0. 200 .eGO 100 ...... 111 .• _ ........................ ........ IIOCIC EIOSIOO .. \ ,nr'_ GlllIIIS (1'11'
ThrDutIt DH-I2 ...... at.' ...... / PI""'''~ .",heIm EmlNnmenlal (1.t-I"~ .......... .... f.~.~~.~~ tm.:m(1'lP) -n (1'11'.)" ..................... L ................................................. ~-:\ ... I..... ... .. , • .-
DItta Geotechnlecd CoMuIta .... (1.,,'110) ......................... ".. ............... . \ f J.EN /
INSPEcmDN ~., ..................... . CE ROAD' I ............. .
Jaoobe EnglnMrtng Group. Ina. (1184) _ to.. :'\... ... ..... ..... ........ ... ........... .... . .... ~ I --we ~ ___ ~ ..... ___ . "~.IC ..... " . • I and other GW"c
• SLC-
__ ....••. UDVN . lAIClOP' _ _ .. .. . . . . . . .. .. .. . . . . . _ _OIlLE -' 7' THICK (TYP.) , ~. 'NCii-.au~ ................ J . .LARW. MAtERIAL.
.............................. ; ............................ '::'.: ................ 'JoIfJI. ~~ ... ' ................. .!.. .............. :: : :: :: • SCI)
• Da_ a MooN ('.,-1112)
MonItor Woo. lnoluded In .......
SuotIon LJlllmeterw To ............ 111 ..etw.rtc
SOil SAMPUNG COPE
• '. ContInuo.. SoIl Sampling Hole
m-nttnu0U8 SoIl Sampling Hole
UNIT 3 ........ ..-.. -.. ..-~. - CrCW"'OO" uNiTi 50 , --I -....:" , - -- ..:==--==-
30······· .. ·······:·····································- .•.. ; ............ -..............•.......... ~;.~ ...... ········_~··········~·~~~·~···~····~·_~····_~·_T···· .. ~~., ............ .
SECTION EB ! .., 10 ..... '", ...
DMROCAR£ OF' UTAH
DISTRIBUTION RAnO TESTING
SOIL AND GROUNDWATER SAMPLING LOCATIONS
I I -INGHAM
L- IDINViRONlllNTAL ULT LAKE CITY - (., U2-ZZ1O
, ..... J ., J 0. I ~ .,. MAROI '815 r .... ~' 10'11-013 lDAN
FIGURE 1
I I I I I
'. I I I 'I.'
I I-I I I I I I I
APPENDIXB . .
ASTM METHOD D 4319-83
. I
I I
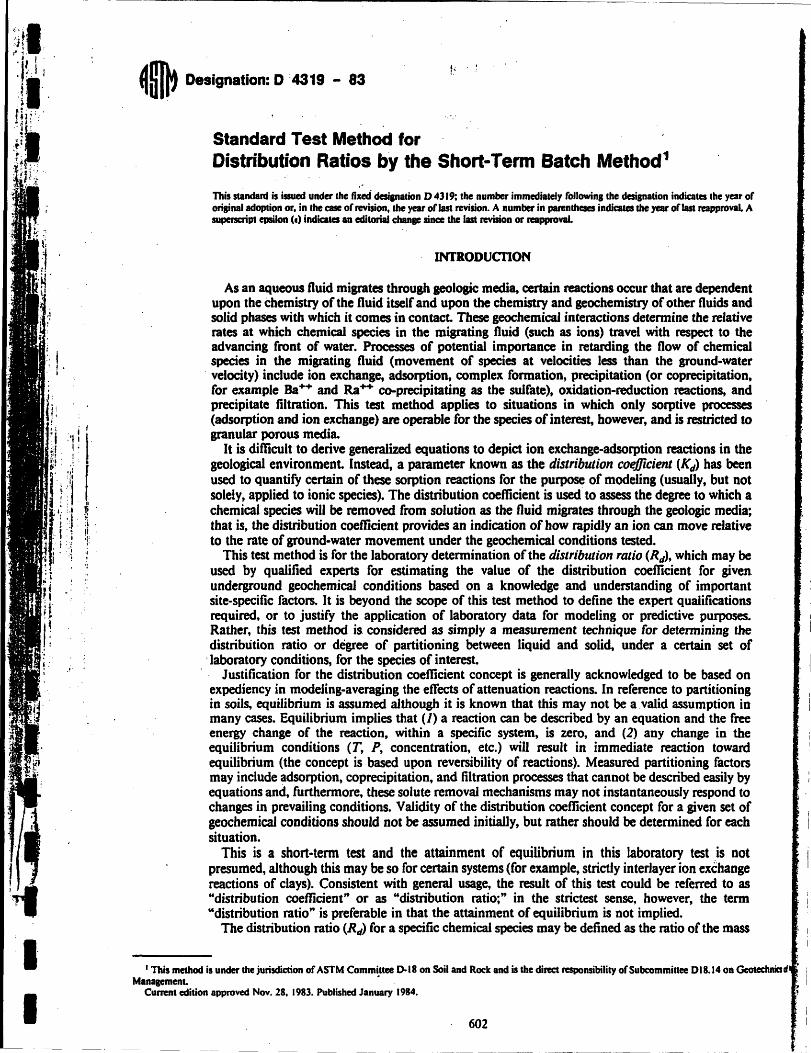
4~ Designation: 04319 - 83
Standard Test Method for Distribution Ratios by the Short-Term Batch Method1
This standard is issued under the fixed desipation D4319; the number immediateJy foJlowin. the desianation indicates the year of oriainal adoption or, in lhe case of revision, the year ofJast revision. A number in parentheses indic:ates the year oflast reapproyaL A superscript epsilon (_) indicates an editorial c:hanlC since the last revision or reapproval.
INTRODUCTION
As an aqueous fluid migrates through geologic media, certain reactions occur that are dependent upon the chemistry of the fluid itself and upon the chemistry and geochemistry of other fluids and solid phases with which it comes in contact. These geochemical interactions detennine the relative rates at which chemical species in the migrating fluid (such as ions) travel with respect to the advancing front of water. Processes of potential imponance in retarding the now of chemical species in the migrating fluid (movement of species at velocities less than the ground-water
. velocity) include ion exchange, adsorption, complex fonnation, precipitation (or coprecipitation, for example Ba++ and Ra++ co-precipitating as the sulfate), oxidation-reduction reactions, and precipitate filtration. This test method applies to situations in which only sorptive processes (adsorption and ion exchange) are operable for the species of interest, however, and is restricted to granular porous media.
It is difficult to derive generalized equations to depict ion exchange-adsorption reactions in the geological environment. Instead, a parameter known as the distribution coefficient (Kd) has been used to quantify certain of these sorption reactions for the purpose of modeling (usually, but not solely, applied to ionic species). The distribution coefficient is used to assess the degree to which a chemical species will be removed from solution as the fluid migrates through the geologic media; that is, the distribution coefficient provides an indication of how rapidly an ion can move relative to the rate of ground-water movement under the geochemical conditions tested.
This test method is for the laboratory detennination of the distribution ratio (Rd), which may be used by qualified experts for estimating the value of the distribution coefficient for given underground geochemical conditions based on a knowledge and understanding of important site-specific factors. It is beyond the scope of this test method to define the expert qualifications required, or to justify the application of laboratory data for modeling or predictive purposes. Rather, this test method is considered as simply a measurement technique for detennining the distribution ratio or degree of partitioning between liquid and solid, under a certain set of
, laboratory conditions, for the species of interest. Justification for the distribution coefficient concept is generally acknowledged to be based on
expediency in modeling-averaging the effects of attenuation reactions. In reference to partitioning in soils, equilibrium is assumed although it is known that this may not be a valid assumption in many cases. Equilibrium implies that (1) a reaction can be described by an equation and the free energy change of the reaction, within a specific system, is zero, and (2) any change in the equilibrium conditions (T, P, concentration, etc.) will result in immediate reaction toward equilibrium (the concept is based upon reversibility of reactions). Measured partitioning factors may include adsorption, coprecipitation, and filtration processes that cannot be described easily by equations and, furthennore, these solute removal mechanisms may not instantaneously respond to changes in prevailing conditions. Validity of the distribution coefficient concept for a given set of geochemical conditions should not be assumed initially, but rather should be determined for each situation.
This is a short-term test and the attainment of equilibrium in this laboratory test is not presumed, although this may be so for certain systems (for example, strictly interJayer ion exchange reactions of clays). Consistent with general usage, the result of this test could be referred to as "distribution coefficient" or as "distribution ratio;" in the strictest sense, however, the tenn "distribution ratio" is preferable in that the attainment of equilibrium is not implied.
The distribution ratio (Rd) for a specific chemical species may be defined as the ratio of the mass . I
I
'This method is under the jurisdiction of ASTM Committee [)Ol8 on Soil and Rock and is the direct responsibility of Subcommittee 018.14 on Geotcchnicsd ManagemenL •
Current edition approved Noy, 28. 1983. Published January 1984.
602
·f
410t D 4319
sorbed onto a solid phase to the mass remaining iii solution, which can be expressed as:
R =- (mass of solute on the solid phase per unit mass of solid phase)
. d (mass of solute in solution per unit volume of the liquid phase) . ;
The usual units of Rd are mL/s (obtained by dividing g solute/g solid by g solute/mL solution, using concentrations obtained in accordance with this test method). . .
Major difficulties exist in the interpretation, application, and meaning of laboratory-determined distribution ratio values relative to a real system of aqueous fluid migrating through geologic media.2 Typically, only reactions between migrating solutions and solid phases are quantified. In general, geochemical reactions that can result from interaction of the migrating fluid with another aqueous phase of a differing chemistry have not been adequately considered (interactions with other liquids can profoundly change the solution chemistry). Additionally, as noted above, the distribution coefficient or Kd concept implies an equilibrium condition for given reactions, which may not realistically apply in the natural situation because of the time-de~ndence or kinetics of specific reactions involved. Also, migrating solutions always follow the more permeable paths of least resistance, such as joints and fractures, and larger sediment grain zones. This tends to allow less time for reactions to occur and less sediment surface exposure to the migrating solution, and may preclude the attainment of local chemical equilibrium. Thus, the distribution coefficient or Kd concept is only directly applicable to problems involving contaminant migration in granular porous material.
Sorption phenomena are also strongly dependent upon the thermodynamic activity of the species of interest in solution (chemical potential). Therefore, experiments performed using only one activity or concentration of a particular chemical species may not be representative of actual in . situ conditions or of other conditions of primary interest.· Similarly, unless experimental· . techniques consider all ionic species anticipated to be present in a migrating solution, adequate attention is not directed to competing ion and ion complexation effects, which may strongly influence the Rd for a particular species.
Many "sorption". ion complexation effects are strongly influenced, if not controlled, by conditions of pH and Eh. Therefore, in situ conditions of pH and redox potential should be ·considered in determinations of Rd! To the extent possible, these pH and Eh conditions should be determined for field locations and must be approximated (for transition elements) in the laboratory procedure.
Other in situ conditions (for example, ionic strength, anoxic conditions, or temperature) could likewise have considerable effect on the Rd and need to be considered for each situation. Additionally, site-specific materials must be used in the measurement of Rd- This is because the . determined Rd values are dependent upon rock and soil properties such as the mineralogy (surface charge and energy), particle size distribution (surface area), and biological conditions (for example, bacterial growth and organic matter). Special precautions may be necessary to assure that the site-specific materials are not significantly changed prior to laboratory testing. . The choice of fluid composition for the ·test may be difficult for certain contaminant transport
studies. In field situations, the contaminant solution moves from the source through the porous medium. As it moves, it displaces the original ground water, with some mixing caused by dispersion. If the contaminant of interest has an Rd of any significant magnitude, the front of the zone containing this containment will be considerably retarded. This means that the porous medium encountered by the contaminant has had many pore volumes of the contaminant source water pass through it. The exchange sites achieve a different population status and this new population status can control the partitioning that occurs when the retarded contaminant reaches the point of interest. It is recommended that ground water representative of the test zone be used as contact liquid in this test; concentrations of potential contaminants of interest used in the contact liquid shouJd be judiciousJy chosen. For studies of interactions with intrusion waters, the site-specific ground water may be substituted by liquids of other compositions.
The distribution ratio for a given chemical species generally assumes a different value when any of the above conditions are altered. Oearly, a very thorough understanding of distribution coefficients and the site-specific conditions that determine their values is required if one is to confidently apply the Kd concept (and the measured Rd values) to migration evaluation and prediction.
The adoption of a standard method for determining distribution ratios, Rdt especially applicable for ionic species, is important in that it will provide a common basis for comparison of
'eab. D. G., and Ramspoct, L. D., "Mipation of Rulhenium-.06 in a Nevada Tesa Site Aquifer: Discrepancy Seaween Field and Laboratory ResuJlS, • Science. Vol • ... 1235-1237, March ,. 1982.
603
I ·1 I I
I· III 'i
l' I I I
41 D4319
experimental results (particularly for near-similar conditions). The most convenient method of determining Rd is probably the batch method (this test method),
in which c,?ncentrations of the chemical species in sOlid and liquid phases, which are in contact with one another, are measured with, time. Other methods include the dynamic test or column flow-through method using (1) continuous input and (2) pulsed input; the in situ dual tracer test, and the thin-layer chromatography (TLe) test.
·In summary, this distribution ratio, Rdt ,is affected by many variables, all of which may not be adequately. controlled or measured by the batch method determination. The application of experimentally determined Rd values for predictive purposes (assuming a functional·relationship such as Rd = Kd) must be done judiciously by qualified experts with a knowledge and understanding of the important· site-specific factors. However, when properly combined with knowledge of the behavior of chemical species under varying physicochemical conditions of the geomedia and the migrating fluid, distribution coefficients (ratios) can be used for assessing the rate of m.igration of chemical species th~ough a saturated geomedium.
;" !
1. Scope 1.1 This test method covers the determination of distribu ..
tion ratios of chemical species for site-specific geological media by a batch sorption technique. It is a short-term laboratory method primarily intended for ionic species subject to migration in granular porous material, and the i ..
application of the results to long-term field behavior is not known,. Distribution ratios for radionuclides in selected : geomedia are commonly detennined for the purpose of. assessing potential migratory behavior at waste repositories. This test method is also applicable to studies of intrusion waters and for parametric_ studies of the effects of variables and of mechanisms which determine the measured distribu .. tion ratios. .
1.2 The values stated in acceptable metric units are to be regarded as the standard.
1.3 This standard may involve hazardous materials, operations. and equipment. This standard does not purport to address all 0/ the safety problems associated with its use. It is the responsibility 0/ whoever uses this standard 10 consult and establish appropriate safety and health practices and determinethe applicability 0/ regulatory limitations prior to use.
2. Referenced Documents
2.1 ASTM Standards: D 422 Method of Particle-Size AnaJysis of Soils3 .
D 2217 Practice for Wet Preparation of Soil Samples for . Particle-Size Analysis and Determination of Soil Con-stan~3 .
D 2488 Practice for Description and Identification of Soils (Visual-Manual Procedure)3
D 3370 Practices for Sampling Water4
3. Description of Terms Specific to This Standard
, 3.2 distribution ratio. Rd-the ratio of the concenlraritt of the species sorbed on the soil or other geomedi~ dhidct by i~ concentration in solution under steady-state coni tions, as follows:
(mass of solute on the solid phase R = per unit mass of solid phase)
. . d (mass of solute in solution per unit . . volume of the liquid phase)
by steady-state· conditions it is meant that the Rd valli! obtained for three different samples exposed to the conLl' liquid for periods ranging. from 3 to at least 14 days, olbe conditions remaining constant, shall differ by not more thzr the expected precision for this test method.
The dimensions of tite expression for Rd reduce to cuti length per mass (L3/M). It is convenient to express Rd' units of millilitres (or cubic centimetres) of solution per gr2
of geomedia. 3.3 species-a distinct chemical entity (such as an ion)i!
which the constituent atoms are in specified oxidation staus
4. Significance and Use 4.1 The distribution ratio, R(/f is an experimentally d~
mined parameter representing the distribution of a chernia species between a given fluid and a geomedium sam~ under certain conditions, including the attainment of I steady state. Based on a knowledge and u.nderstanding or~ important site-specific. factors, Rd values ·may be used '" qualified experts for estimating the value of the distributjcP coefficient, Ktb for a given set of underground geochemia conditions. The Kd concept is used in mass traoSJX" modeling, for example, to assess the degree to which an iot! species will be removed from solution as the solutilt migrates through the geosphere. For applications other thr transport ;modeling, batch Rd measurements also may used, for example, for parametric studies of the effects variables and of mechanisms related to the interactions fluids with geomedia.
3.1 distribution coefficient. Kd-is identicaJly defined as Rd for equilibrium conditions and for ion exchange-ad- . sorption reactions only. To apply Rd values to field situations, an assumption such that Rd = Kd is necessary. The validity of such an assumption can only be determined by informed experts making a judgment (albeit uncertain) based on a detailed study of the specific site.:
.. , S. Apparatus
J Annual Book of ASTM Standards. Vol. 04.08. • Annual Book of ASTM Standards. Vol. J 1.01.
604
5.1 Laboratory Ware (plastic bottles, centrifuge (uta open dishes, pipets, graduates), cleaned in a manner coftii tent with the analyses to be performed and the requ' precision. Where plateout may have significant effect on measurement, certain porous plastics should be avoided
('
,\ r
" 3' \;
n· n' , r~ ~,
fi· r' sit
· r' r'
J'f li&
II' . n,· I
w' r:1I
, P" lit
v' P"
· 7.
· da · lht
lhi · lht . an
I e 04319
::1 of FEP TFE-fluorocarbon containers is recom
~~~entrifilge. capable ,of attaining 1400 g, or filtering ~ratus.
Dlaboratory Shaker/Rotator. ultrasonic cleaner (opaa i,4 Environmental Monitoring Instruments, a pH meter, ';;lrleter and electrodes for Eh determination, conduc-A'C paratus, and thermometer. ' ;,5 nalytical Balance. " ~,6 Appropriate Equipment, necessary to maintain in situ :;dl" ns within the laboratory. , ;,7 nalyticai Instrumentation, appropriate for determi.:ion of the concentration of major constituents (cations J anions) and of the species of interest (for which Rd is Jlltermined) in the contact solutions (and, optionally, th , omedia samples).
;S9ling I)J _he sam'ples of soil, rock, or sediment shall be 'JSidered to be representative of the stratum from which it :h!ained by an appropriately accepted or standard ; re and based on expert judgment. :3.2 he sample shall be carefully identified as to origin in ~rdance with Practice D 2488. : '13 geological description shall be given of the core ~ used for the distribution ratio measurement, in~n particl~-size analysis (Method 0 4~) for ~ncon-
riidated matenal, depth of sample, and bonnS locatIon. ".4ImPling of representative ground water in the test tOC use as the contact liquid in this test method shall be ~'Omplished in accordance with Practices 0 3370, using ~Plg devices that will not change the quality or environ-~n onditions of the waters to be tested. Recommended hm include the use of Kemmerer samplers or inert' gas ;:ssure litis ~pr~vided this does !lot. alter the ~ound-water ~IY stnppmg out carbon dioxide and ralsmg the pH, ~ e pie) or submersible diaphragm-type pumps. Proper ~:cauuons should be taken to preserve- the integrity of in fl!ditions of the sampled water, and in particular to fill' against oxidation-reduction, exposure to light for JlCn periods, and temperature variation. '
I SOlE I-It is reCoanized that sampling is likely to be a major ~Jble aterials (or fractures) that the contaminants pass through are ~ the most difficult pan of the geologic section to sample. In ! " '. proper sampling entails detemrining the path of ground-water r.50 that the critical materials can be sampled. This determination is ;'JulomPIiShed in sufficient detail in normal' geologic site explo-:.M.IR grams. and, if it is attempted in some cases. the exploration 1, gil ay become unacceptably expensive. Specific guidelines are ~,:ilnd the scope of this test method, however, it is recommended that :"J:!J' nd water sampling procedures be carefully considered by the , ~n involved in the site examination. ! ' ... , , ;' Procedure
! 1.1 tiS' test method can be applied directly to consoli:~ll!d re material samples or to disaggregated portions of ;~ core material samples. For the applications intended for l:isl' ethod, however, disaggregation of the samples is l:.t r mended procedure. Disaggregate the sampled soil i_:J fI Ie core materials (this may be done by ultrasonic
I 605
method although it should be noted that the effect of ultrasonics on the ,microstructure of geological material may lead to higher sorption values in certain cases). If a sum:. ciently Jarge";sized sample is available, separate 200-g portions through a "nonbias" rime splitter. Crush competent sedimentary rock materials to' a desired particle size or equivalent soil texture anticipated to result from natural weathering processes (this is because surface area is controlled by sample particle size).',
NOTE 2-A significant source of enor may be introduced by disaggregating the sample in a batch test in that (a) disaggresation can mask a preferred flow path (either horizontal or venical), (b) disagreption can destroy the effect of preferred flow paths caused by fractures or perhaps thin sand stringers, and (e) disaggregation will tend to increase the available surface area of the geologic materials. It is for the purpose, of achieving unifonnity of application. however. that disagregation is recommended for this test method. It should be realized by persons applying results from this method that inclusion of the disaggregating operations may for these reasons tend to maximize the values of the distribution coefficients (ratios) obtained from this test method.
7.2 In some cases, it may be deSirable to remove organic material from the geomedium (soil specimen) for comparative purposes. If this is so indicated, remove the organic material from the composite sample mixtures for selected samples by treatment with concentrated hydrogen peroxide (30 % H20 2), using the procedure given in "Soil Chemical Analysis. "S In such a case, make duplicate runs using samples both with and without pretreatment to remove organics. It should be noted, however, that treatment with concentrated hydrogen peroxide could cause other changes in the geomedium, for example, dissolution of hydrous metal oxides that may be important adsorbents.
7.3 Using standard analytical procedures, characterize the geologic specimen (without, pretreatment and, if so done, with the pretreatment to eliminate organics) as considered appropriate. The analyses may include percent chemical composition of anhydrous oxides (for example. Si02, FeO, MoO, Cao, Na20, etc.), hydrous, oxides (for example. Fe, lvln, and AI hydrous oxides), and minerals that are present, and carbonate content, surface area (m2/g), and cation and anion exchange capacity (at specified pHs). Similarly, characterize the contact liquid obtained from the test zone as appropriate for interpreti~g the results. Chemical analysis of the liquid should include macro constituents (for example, Na+, Ca++, K+, Mg++, CI-, HC03 -IC03=, Si02, etc.) and redox-active and hydrolyzable species such as Fe and Mn ions. Likewise, determine the pH and Eh of the contact liquid, as well as the concentration (if present) of the chemical species of interest. Specific instructions for the Eh determination are not part of this test method, however, use of a referenced technique is advised (such as a platinum versus standard calomel electrode measurement). If the species of interest may exist' in the contact liquid in a variety of valence or chemical stat~s (for' example, with studies of actinides), a method of determining speciation should be applied.
7.4 Pass each of the soil and rock (core sediments) fractions again through a "nonbias" rime splitter and place
'Jackson, M •• Soil Chemical AnalysiS, Prentice Hall. Englewood OifTs. NJ, 19S4,
-------------
• I I I I .,.
,~
I
II· :. i: "
I' I.
I I
. i
.;
41 D4319
four 5- to 2s-g portions (record weight to nearest 0.1 g) in centrifuge tubes or bottles.'; ,
NorE 3-Unless it is decided that the samples may be allowed to dry by exposure to the open air, record a moisture weight (for comparative purposes. a moisture content determination should be done with a separate sample). Some soils never dry in nature, and characteristics may be gready altered when dried. This is especially true for originally anoxic sediments. If the samples are not to be allowed io dry before testing, fonow Practice 0 2217 (Procedure B) for maintaining a moisture content equal to or greater than the natural moisture content In all cases. the contact liquid used in this test is the sampled ground water . from the site test zone.
7.5 If a radiotracer or spiked stable tracer determination of the distribution ratio is desired, pretreat the composite samples with exact solution (contact liquid) used in the determination but without the tracer present. This solution will be either the site-specific ground water or a selected intrusion water. Wash the composite soil and rock samples four times with the pretreatment solution. For the first three washes, stir the mixtures of soil and rock and pretreatment solution several times over a IS-min period, allow to settle, centrifuge at 1000 g or more for S min, and decant ofT the wash. Apply the fourth wash for at least 24 h with occasional stirring, and again separate the wash from the composite
mple by centrifugation and decantation as before. 7.6 It may be advisable to pre-equilibrate the treatment
solution (contact liquid) with the geomedia prior to the start of this test method. Proceed as in 7.5, using the fourth wash after centrifugation and decantation as the treatment solution. Unless otherwise noted,. add 20 to 100 mL.(exact value should be equal to four times the weight in g of the geomedia) to each 100 to 250 mL centrifuge tube or bottle, and thoroughly mix the contents by stirring action. Prior to contact, the treatment solution should contain the species of interest at a known concentration prepared by the addition of chemically pure reagents to the site-specific ground-water .
mple. (The species of interest may be at trace concentration; if it is a radioactive or stable tracer added to the treatment solution, the elemental concentration as well as the isotopic concentration must be known.) If tracers are used, firSt equilibrate the tracer with the ground-water (or intrusion-water) sample by allowing to stand overnight and then filter using a sO.4S J.l.m pore size membrane filter. Following this step, analyze the contact solution and add to the soil and rock composite samples as indicated above. Measure the pH of the soil/rock-solution system; if the pH has changed or if other than the natural pH is desired, adjust by addition of N NaOH solution or HCI, or by'an appropriate buffer. The in situ Eh should be maintained, if necessary, under an inert atmosphere. '
Non 4-Experiments have shown that Rd wiU vary depending on the solution-to-geomedium ratio used in the lest. If other ratios are indicated (which would more closely approximate the normal field situation), duplicate runs should be made. however, the ratio prescribed here should also be run as the reference case. Because Rd varies with the solution/medium ratio, it is strongly recommended that this measurement include'determination of the isotherm by making several runs with different ratios of solution-to-geomedium than specified above.
Non S-Some analytical techniques may require larger volumes of sampl~ fluid. Increased volume can be obtained by compositing samples or by scale-up using larger centrifuge tubes.
7.7 Determine the specific conductance of each solution and report in units of micromhos per centimetre at 20°C.
7.8 Run each set of samples at least in triplicate r demonstrate that steady state is attained in this short-t~ test. Stir the contents of each contact tube, then gently sh3l: all of the soil/rock solution mixtures on a laborat(l!' shaker/rotator for a minimum of 6 h for every 3-day poJtiP. of the contact period. The contact periods shall be for I minimum of 3 days, and the longest shall extend to 14 ~ or longer. The contact periods shall differ by at least a J.dJ. period. During the latter I or 2 days of the contact peri~ allow all mixtures to stand and settle. If the variation of l: with exposure time for these three or more contact periodu greater than the precision expected for this experiment. lM the determination should be repeated for longer times u£ such a consistency is obtained. This is taken to be r indication that steady state has been established. In cal!
where the steady-state situation is not achieved, the extm sion of Rd values to the prediction of migratory beha\. becomes of dubious value and requires clear reference to III inexactness of the application.
7.9 Measure and report the pH and Eh of all mixturesli! many investigations, pH and Eh will not vary greatly, 50 i . might not be necessary to measure them on all samplest
7.10 Centrifuge each mixture for 20 min at a minimum setting of 1400 g. Controlled temperature centrifugation ~ be advised, particularly in the case of experiments run belli' ambient temperature. Carefully separate the phases. For tIr supernatant, the concentration of the species of interest as be directly determined using the appropriate standard aD
lytical method. 7.11 If filtering is necessary or if desired for comparatilt
purposes, use polycarbonate member filters (0.002 to 0,0: J.lm pore size), or the equivalent. Pretreat the filter disc ~ passing through it approximately SO mL of J.O N HO followed by 50 mL of distilled water, by gravity flow (I
suction to near dryness. Check the poSsibility of sorption d tracers onto the filter by a standard "double filter" techniqll using the original contact solution.
7.12 Filter the supernate from each soil/rock-solutict mixture by gravity flow or suction to near dryness. Deuf. mine the concentration and speciation (chemical state). ifi is variable, of the species of interest in this solution by tit appropriate standard analytical method. Make a blm determination using the equivalent procedure outlined be! (7.6 through 7.12, except do not add the soil/rock samp/t with treatment solution only. The use of tracers invoht!
~partiCUlar attention to corrections for blanks and potentii plateout of the tracer on container walls, filters, and otflr surfaces as well as other losses. For example, it should it ascertained that loss of tracer to the blank vial walls is ~ same as for the walls of the sample vial, etc.
7.13 If necessary or if desired for comparative pUrpo5CSIJ
for a mass-balance determination, determine the concentl) tion of the species of interest for each filtered solid residue. h this case, note the necessity of removing the residual solutitt from the solid phase, or correcting for . it, particularly ra solids with low Rd values. If this determination is madt. correction is required for the amount (if any) of the speciesd interest to be found naturally present in the soil/rock sampi Provided a satisfactory analysis is accomplished for IIr species concentration in the soil/rock residue, calculate Rd~ dividing this value (g solute per g solid residue) by the filii
606
~',
"
Itt D4319
TABLE 1 Example Calculation Sheet
1be distribution ratio Is given by:
where: Ref • distribution rallo, mL/g,
R _ (F"J.VJ d (F.)(W"J
F. • fraction of total activity In solution, which equals the total concentration In solution, assuming the acdvtty coefftcients of a given Ian were the same before and aftar steady stata was attained In contact of the solutiOn ~ the SOiI/rOCk materials (that la, the ionic strenglh Is LI1dlanged). Makln9 this assumption, F. Is found by diYIdIng the concentration of Iha iOn alter the solution has coma to .equiIIbnum- (raac:has steady state) with Ihe soiI/I'OCk tractJan by the concentration (of sarna units) of the Ion beIore Ihe solution was allowed to coma to aquiIibrium with the soli fraction,
F,. - fractian of activity sorbed onto the mIneraf or solid residue (corractIng far the natural content of Iha species of interest Ini1IaIIy present), or, maJdng Iha same assumption as to activity coefficlants,
F", -1 - F.
v, - volume of SOlutIon -equilibrated- with W",. mL. and W,. - weight of mineral or SOld residue, g. kllhe case of a radioactive spacIea of 1nter88t. where the radioacIIvitIas of th8 saIutIan and sold residue are datermInad, the dIsIr1buUon coafftcIent Is given by:
R _ CAmXV'> d CAaXW"J
Whn: A,. - actMty of the miMIraI or solid residua, rna, and A, • activity of the solution -equilibrated- with W_ rna.
concentration in the contact solution (g solute per mL solution), assuming the filter did not remove tracer from the solution. An alternative method is to compute Rd as shown on the Example Calculation Sheet (Table I).
8. Precision and Bias· .
8.1 In following this method with usual care in analytical determinations, it is estimated that an overall precision or reproducibility of 10 to 25 % should be obtained. In many cases, this may be limited at very high or very low Rd values
, by the difficulty in measuring either very small residual concentrations or very small changes in a higher concentration. In such cases, constancy of Rd to within an order of magnitude may be acceptable for certain applications. It should be noted, however, that sampling difficulties and inability to properly measure or control the relevant in situ factors for determining the Rd of interest can inject a substantial uncertainty into the application of the obtained values in mass transport or solute modeli~g-prcdictive exercises.
TABLE 2 Example Report Sheat Tabulated Results lor DIstribution Ratio Oetarrnlnatlon of Sample Nwnbar __ _
Contact liquid: Site-Spac:ific Ground Wat. ___ Ottw (intrusion) Wata' ___ initial pH ___ initial Eh -: methOd of determining Ell ___ ' final pH _ final Eh temperatura __ oC specific conductance ttmhOS/cm sotid-to-liquid ratio __ gJml
ccntact time da equiBbrating atmosphere ___ ai' other (specify) c:ontact sotution fiItnd after cantrifuga1lon? __ yes -' _ no disaggregatad? ___ yes ___ no particle size mm ti:r02 treatment to remova organics? --- yes _ no calculated dry weight of solid _' __ 9 volume of contact liquid ___ mL species of Interest methOd of analyzing for
.,.. of Interest
(use ~ta sheet If necessary)
Siie description, sampting methodology and core material desc:rtptJon, analysis of core materials and of Sit.spec:ific ground wat. or other contact liquid:
ATTACH SHEET
Spec:Ies (Ion) of Interest Initial Cone. In Sold (unHa) initial Cone. in Solution (unItS) (ml/g)
TIre Amerft:IIn SocIety lor T8SI/ng and Materials talc. no posilion respecting the validity of any patent rights assetted In connection with any item mentioned In this standard. USeta 01 this standard are upressly advised that determinalion 01 the validity of any such patent rights, and the risk of Infringement 01 such rights, are entirely their own responsibility.
This standard Is sub/eCI to lWVisIon at any tlma by the responsible technical committee SlId must be reviewed every live years and il not revised, either reapproved 01 withdrawn. Your comments are invited either lot revision 01 this standard or for additional standards , and should be addressed to ASTM Haactquarters. Your comments wlU receive careful consJd8f8lion at a meeting of the responsible ' technical committee, which you may alIend. /I you feel that your comments have not received a fair hearing you should make your viewS known to the ASTM CQmmilt8e on StandSrds, 1916 Race St., Philadelphia, PA 19103.
607
-
I ·1
I I
•• I I I I I I . I I I· I ·1 I I I
APPENDIXC
SOIL TESTING
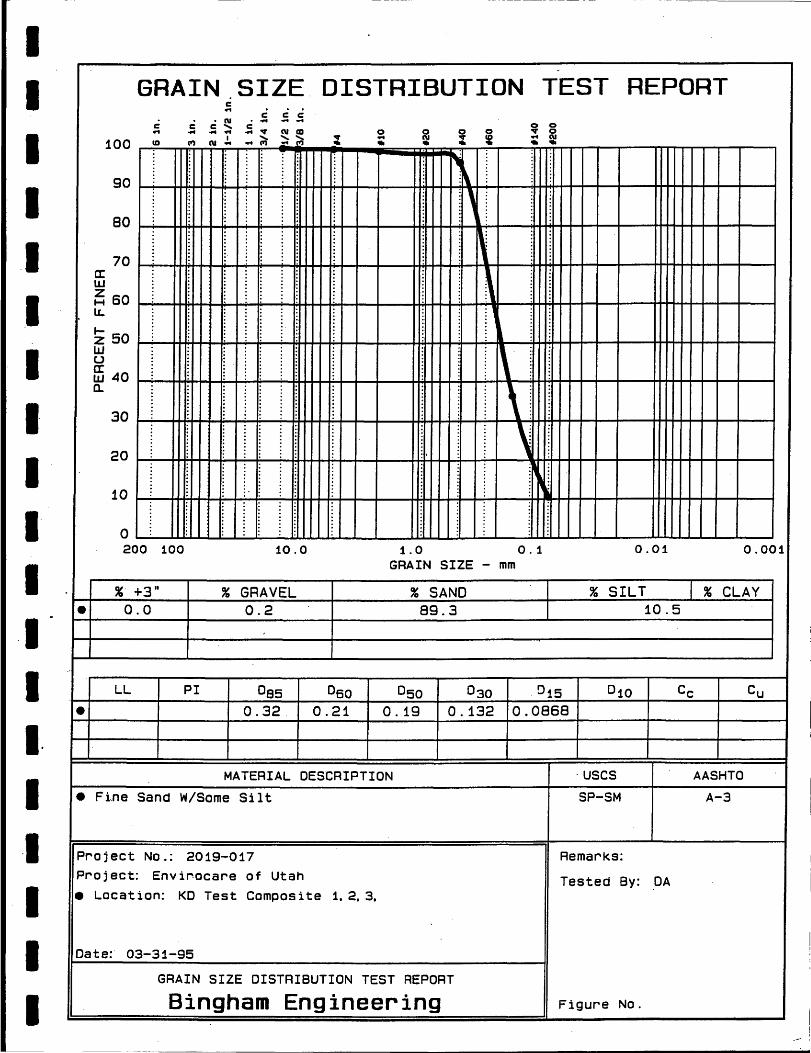
I I I I I .1 I I I I I I I I· I
•• I I I
•
•
GRAIN SIZE. DISTRIBUTION TEST REPORT c c c
• N ............. c c ..... coo ................ ~NCD 0 000 ~o
100 rf~~n~iTfN~!-r .... :t~~~~ ..... ~~~~~.; __ ~~~~:rT~~~--;TIT~tnrr,-tr--TnTTTT-r-r~ , 90 t-~*H++~~~~~~+-~~~~~\~~~~++~~--~~~+-+-~
i' 80 ~~~++~~*-~~~H-~~--~~~~.~:~--~~~~~--~~++~~--~
70~~~~~~~~~,~~ ~~~~~~~ ffi r:\ ~ 60 ~~H*++~~~~~~4-~~--~~~~~~~~~~~--+H++~~~~ LL ~ ,
~ 50 ~ ~~~~~~~~~~~~~~\-. ~+H~+--*~~~~
ffi 40 , ~ ~~H*++~~~~+H~~~+---~~~~~~~~~~~--+H++~~~~
30 ~~~++~~~~~~~~~--~~~~4-~~~~~~--~~++~~--~
20~~~~~~~~~~~~!~~~~~~
o ~~~~~~~~~~~~~ __ ~~~~~ __ ~~~~~ __ ~~~~~ __ ~ 200 100 10.0 1.0 0.1 0.01 0.001
GRAIN SIZE - mm
%. +3" % GRAVEL % SAND % SILT % CLAY 0.0 0.2 89.3 10.5
LL PI 060 0.32. 0.21 0.19 0.132 0.0868
MATERIAL DESCRIPTION . uses AASHTO
• Fine Sand W/Some Silt SP-SM A-3
Project No.: 2019-017 Project: Envirocare of Utah
Remarks:
Tested By: OA • Location: KD Test Composite 1.2.3.
Date: 03-31-95
GRAIN SIZE DISTRIBUTION TEST REPORT
Bingham Engineering Figure No.
-- ... _-----------------------------------------------
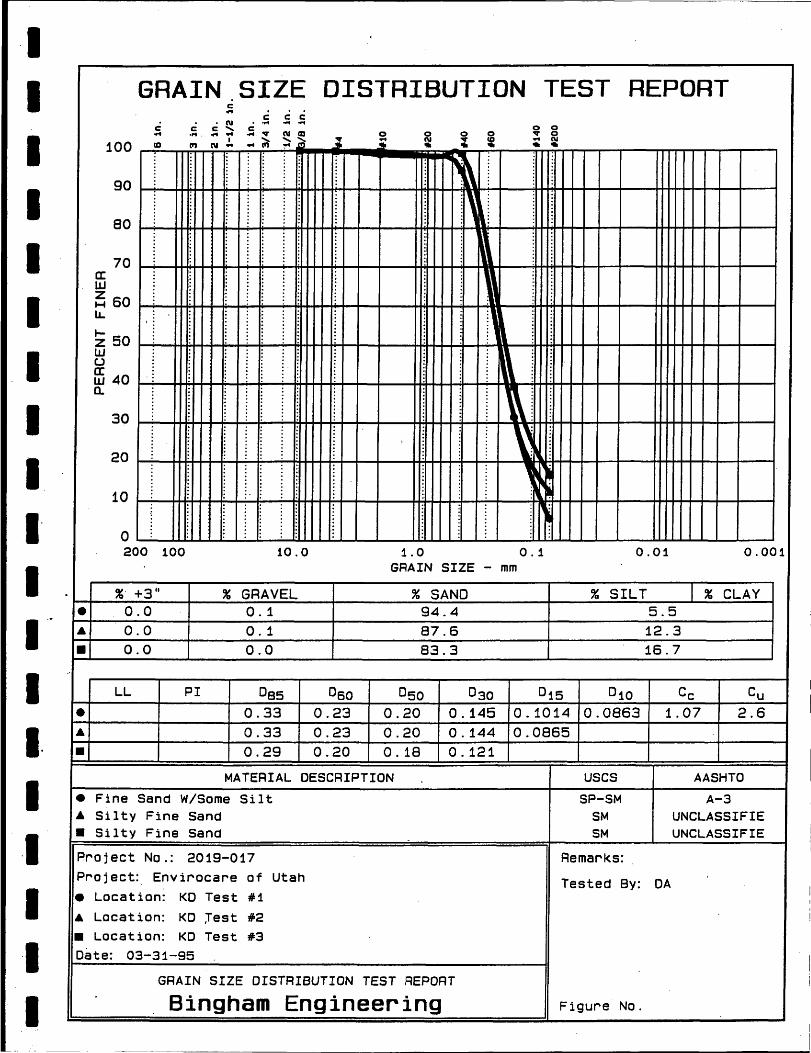
I I I I I I I I I I I I I I· I I I ·1 I
• •
• •
GRAIN SIZE DISTRIBUTION TEST c ....
c .... c: c: .... '" • N • .s
c c....... coo ................... NaJ 0 000 ... 0
REPORT
100 rf~~TH~TfN, ... ;'TT ... T:~~~~· ~ ....... ~~]~ .. -_~ .. ~~~~:tT7~~--~;~~TrrTJr-r---rrnnllrT~--~
90 ~~~+--+--+-~~H-!-+-JI: --+H+++-+-+--t---+t++-t-t-+-+--t-----1
~ :" ' 80 ~~+M~~~~~~~~~~--~~~~~--~~~~~~~~~~+_~~
70 ~~+M~~~~~~~~~~--~~~~~--~~~~~~~~~-r+-~--; a: UJ
~ 60 ~~+M++~~~~~~~~~--~~~-+~--~~~~~~~~~-r+-~--; lJ...
~ 50 UJ ~~~~~~~--~+r~~~--~~~~~'--+~~~~r---~~~+-~~
u ffi 40 ~ ~~+H++~~~~~~~~~--~~~_+~~~~~~~~~~~~+_~~
30 ~~+H~~~~~~~~~~~~~~~\H~~~~_+---~H+~~~~ ~ ~ 20 ~~+H++~~~~~~~~~--~~~_+~--~~~~~~--~~~+_~~
10~~~++~.~.~~~~~~~~~~,~:~~+_~*+H_~~ a ~~~~~~~~~~~~~ __ ~~~~~ __ ~~~~~~ __ ~~~~~~ 200 100 10.0 1.0 0.1 0.01 0.001
GRAIN SIZE - mm
%. +3 11 % GRAVEL % SAND % SILT % CLAY 0.0 0.1 94.4 5.5 0.0 0.1 87.6 12.3 0.0 0.0 83.3 16.7
LL PI 085 0 60 0.33 0.23 0.20 0.145 0.1014 0.0863 1.07 2.6 0.33 0.23 0.20 o . 144 0 .0865
0.29 0.20 0.18 0.121
MATERIAL DESCRIPTION uses AASHTO
• Fine Sand W/Some Silt SP-SM A-3 • Silty Fine Sand • Silty Fine Sand
Project No.: 2019-017
Project: Envirocare of Utah • Location: KD Test #1
• Location: KD Jest #2
• Location: KD Test #3 Date: 03-31-95
GRAIN SIZE DISTRIBUTION TEST REPOAT
Bingham Engineering
SM UNCLASSIFIE SM UNCLASSIFIE
Remarks:
Tested By: DA
Figure No.
I
. I
• • • • • • • • • • • -.-• --••
• •• • • •
APPENDIXD
BARIUNGER LABORATORY REPORT
I I I I I I I I I I I I" I I. I I I I I
BARRINGER LABORATORIES INC 15000 W. 8TH. AVE., SUITE ~ GOLDEN, CO 80401 (303) m-16111 FAX (303)'217-1889
David Cline Bingham Environmental, Inc. 5160 Wiley Post Way . Salt Lake City, UT 84i16
7-Jun-95
Attn: Received: 30-Mar-95 09:25 Project: COC 00107 PO #:
Job: 951671E Status: Final
iAHALYTICAL REPORT PACKAGE
CASE N.ARRATIvB •.••••.••••••.•.••..•.•.•••....•• i
~YTICAL RESOLTS ........................... R-1 I
QUALITY COHTRQL REPORT ....................... Q-l
I
Meet~ng The Analytical Challenges Of A Changing World I
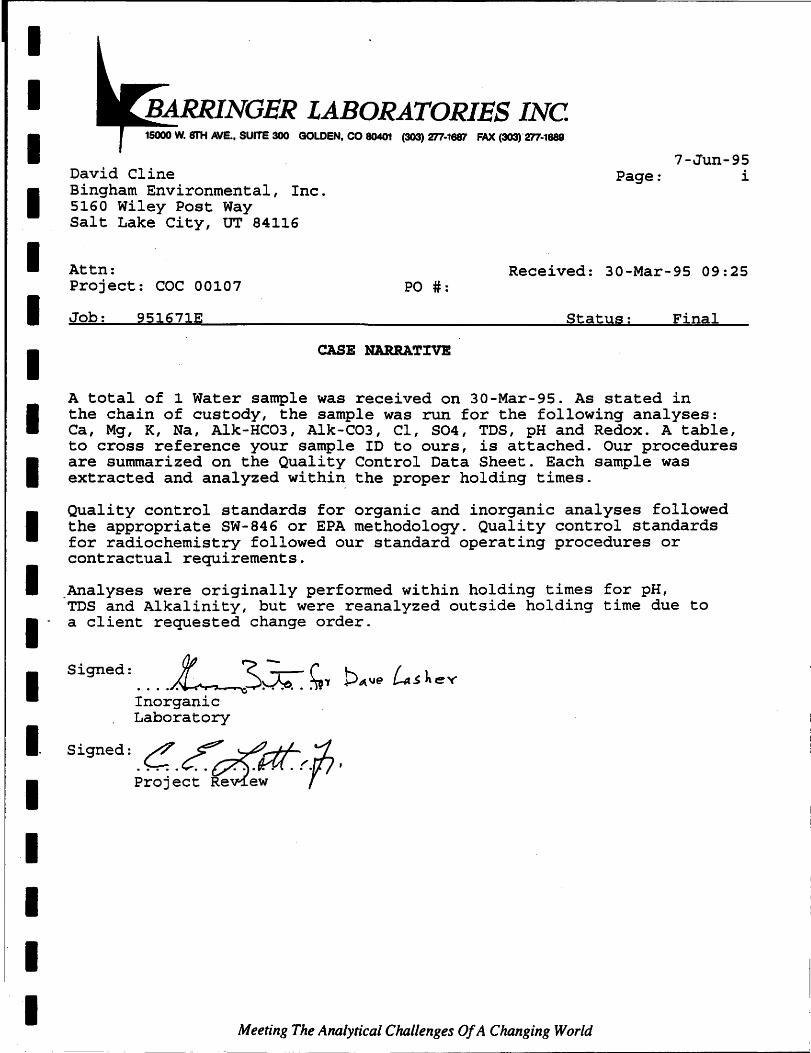
I I I I I I 1 I 1 1 1 I
I I. I .1 I I I
BARRINGER LABORATORIES INC GOLDEN, CO 80401 (303) 'Z17-16fI1 FAX (303)''Z17-1889
7-Jun-95 David Cline Bingham Environmental, Inc. 5160 Wiley Post Way
Page: i
Salt Lake City, UT 84116
Attn: Received: 30-Mar-95 09:25 Project: COC 00107 PO #:
Job: 951671E Status: Final
CASE NARRATIVE
A total of 1 Water sample was received on 30-Mar-95. As stated in the chain of custody, the sample was run for the following analyses: Ca, Mg, K, Na, Alk-HC03, Alk-C03, CI, S04, TDS, pH and Redox. A table, to cross reference your sample ID to ours, is attached. Our procedures are summarized on the Quality Control Data Sheet. Each sample was extracted and analyzed within the proper holding times.
Quality control standards for organic and inorganic analyses followed the appropriate SW-846 or EPA methodology. Quality control standards for radiochemistry followed our standard operating procedures or contractual requirements.
_Analyses were originally performed within holding times for pH, TDS and Alkalinity, but were reanalyzed outside holding time due to a client requested change order.
Signed: ... . L~ . ~~ j)","l? ~s"ev Inorganic Laboratory
Signed: .c..?~at!'.'j." Proj ect Ve,J~~ r I
Meeting The Analytical Challenges Of A Changing World
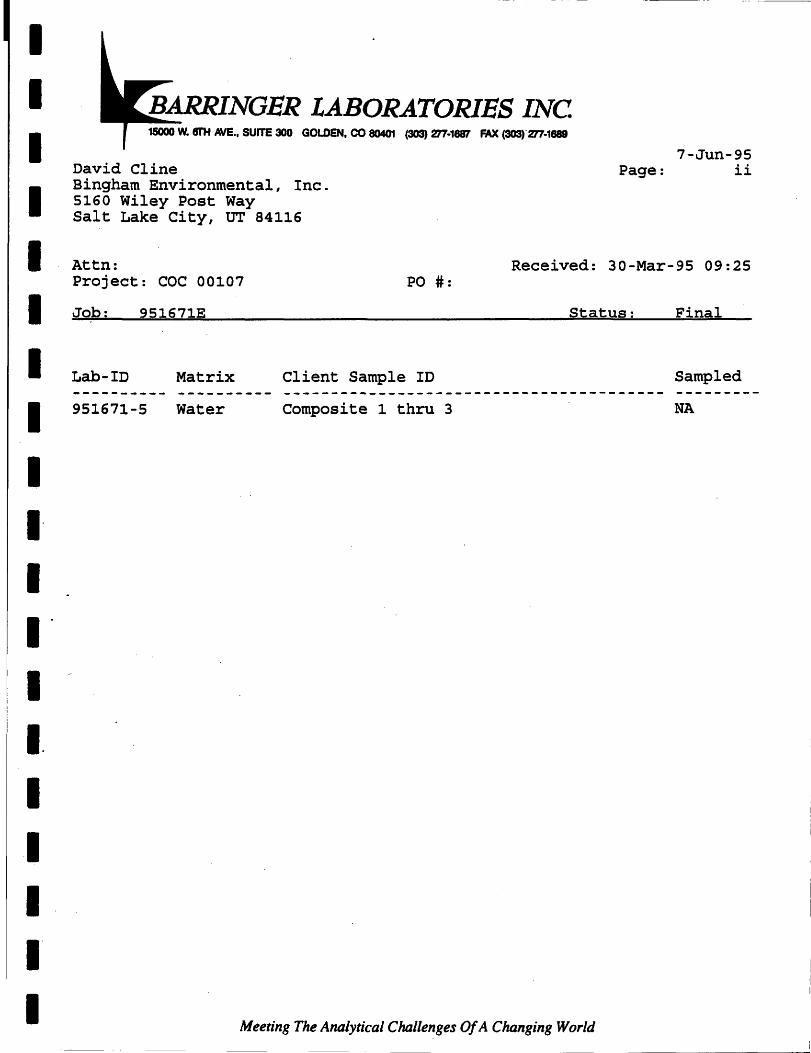
I I I I I I I I I I· I I" I I. I .1 I I·
I
BARRINGER LABORATORIES INC
David Cline Bingham Environmental, Inc. 5160 Wiley Post Way Salt Lake City, UT 84116
(303) 277-1887 FAX (303)·277-1889
Page: 7-Jun-95
ii
Attn: Received: 30-Mar-95 09:25 Project: COC 00107 PO #:
Job: 951671E Status: Final
Lab-ID Matrix Client Sample ID Sampled
951671-5 Water Composite 1 thru 3 NA
Meeting The Analytical Challenges Of A Changing World
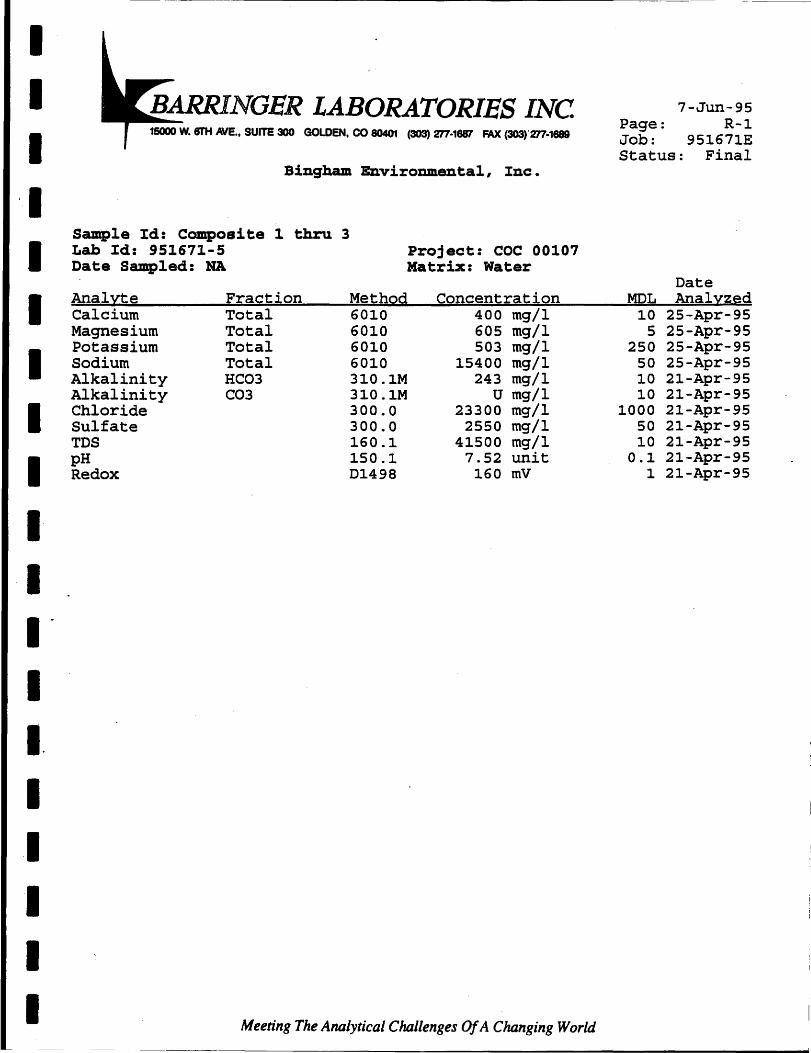
---------------------------------~--~~
• • • '. • • • • • • • .-• I.
• '. • • •
BARRINGER LABORATORIES INC 15000 W. 6I'H AVE., SUITE 300 GOLDEN, CO 80401 (303) 277-1887 FAX (303)"277-1889
Bingham Environmental, Inc.
Sample Id: Composite 1 thru 3 Lab Id: 951671-5 Date Sampled: NA
Analyte Calcium Magnesium Potassium Sodium Alkalinity Alkalinity Chloride Sulfate TDS pH Redox
Fraction Total Total Total Total BC03 C03
Project: COC 00107 Matrix: Water
Method Concentration 6010 6010 6010 6010 310.1M 310.1M 300.0 300.0 160.1 150.1 D1498
400 mg/l 605 mg/l 503 mg/l
15400 mg/l 243 mg/l
U mg/l 23300 mg/l
2550 mg/l 41500 mg/l
7.52 unit 160 mV
Meeting The Analytical Challenges Of A Changing World
7-Jun-95 Page: R-1 Job: 951671E Status: Final
MDL 10
5 250
50 10 10
1000 50 10
0.1 1
Date Analyzed
25-Apr-95 25-Apr-95 25-Apr-95 25-Apr-95 21-Apr-95 21-Apr-95 21-Apr-95 21-Apr-95 21-Apr-95 21-Apr-95 21-Apr-95
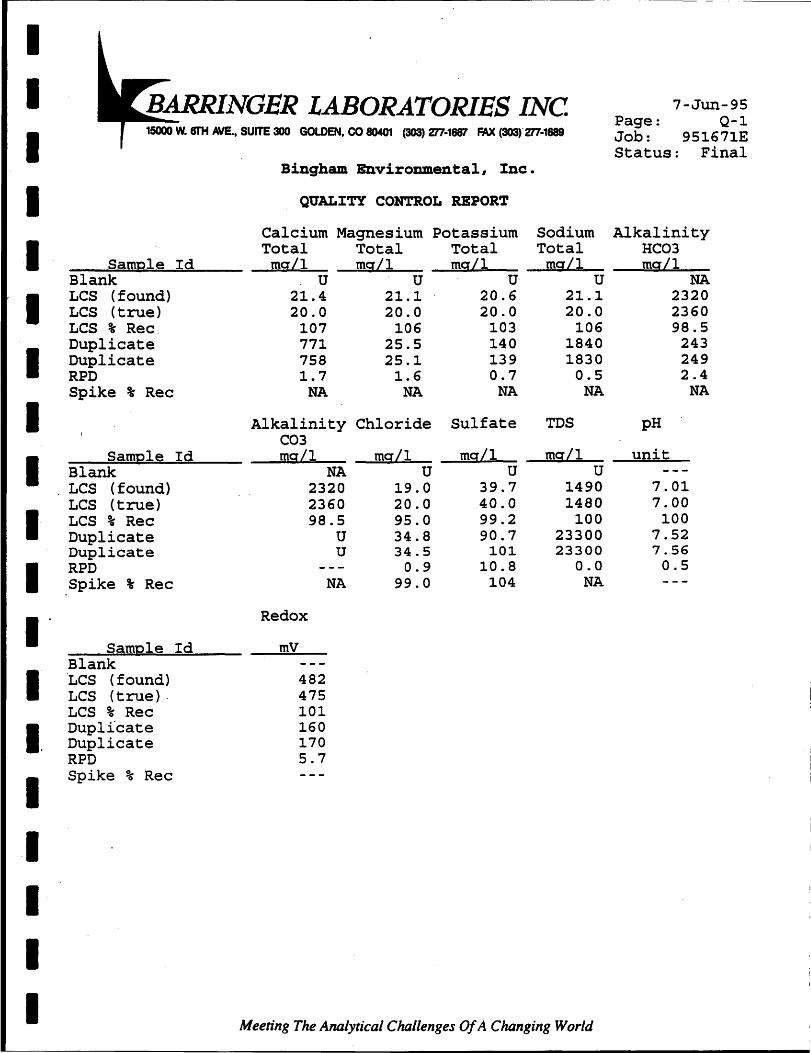
I I I I I I I I I I· I I" I I. I .1 I I I
BARRINGER LABORATORIES INC 7-Jun-95 Page: Q-1 Job: 951671E Status: Final
15000 W. 6TH AVE., SUITE 300 GOLDEN, CO 80401 (303) 277-1887 FAX (303)'277-1689
Sample Id Blank LCS (found) LCS (true) LCS % Rec. Duplicate Duplicate RPD Spike % Rec
Sample Id Blank LCS (found) LCS (true) LCS % Rec Duplicate Duplicate RPD Spike % Rec
Sample Id Blank ·LCS ( found) LCS (true), LCS % Rec Duplicate Duplicate RPD Spike % Rec
Bingham Enviroumental, Inc.
QUALITY CONTROL REPORT
Calcium Magnesium Potassium Total Total Total mgll mgll mgll
U 21.4 20.0
107 771 758 1.7
NA
Alkalinity C03 mgll
NA 2320 2360 98.5
U U
NA
Redox
mV
482 475 101 160 170 5.7
U 21.1 20.0
106 25.5 25.1 1.6
NA
Chloride
mgLI U
19.0 20.0 95.0 34.8 34.5
0.9 99.0
U 20.6 20.0
103 140 139 0.7
NA
Sulfate
mgLI U
39.7 40.0 99.2 90.7
101 10.8
104
Sodium Alkalinity Total HC03 mgll mgll
U NA 21.1 2320 20.0 2360
106 98.5 1840 243 1830 249
0.5 2.4 NA NA
TOS
mgLI U
1490 1480
100 23300 23300
0.0 NA
pH
unit
7.01 7.00
100 7.52 7.56 0.5
Meeting The Analytical Challenges Of A Changing World
. ;
I I i
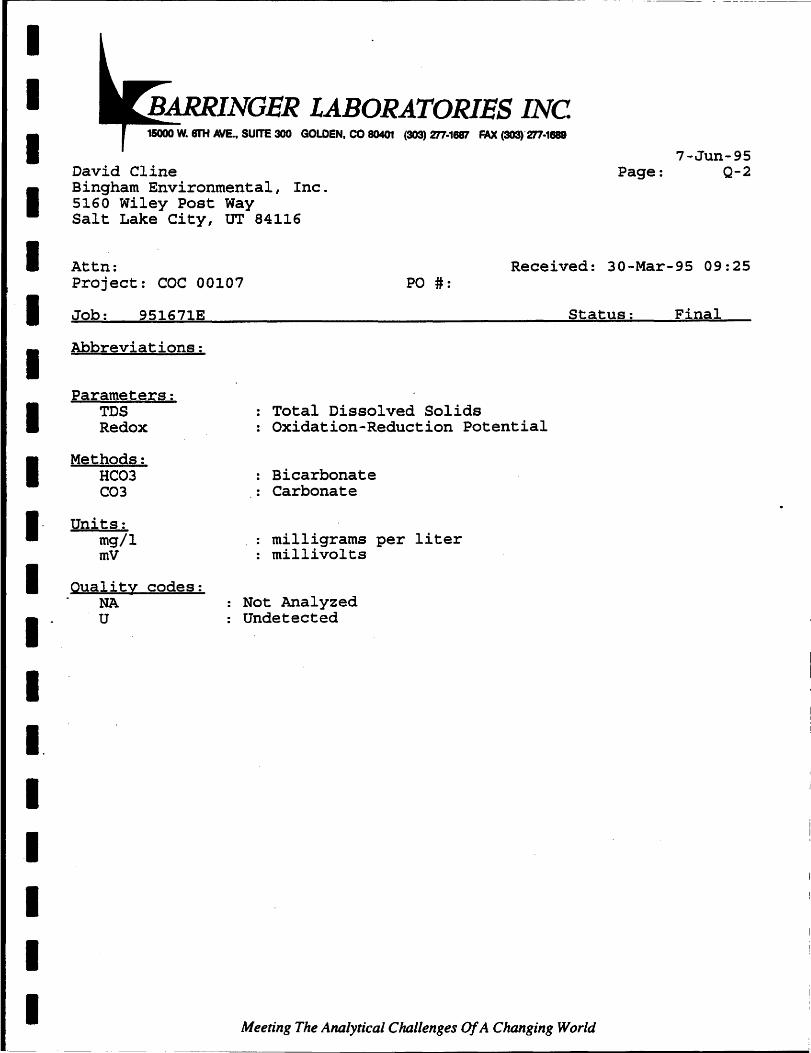
-----------------------------~-- --- - ---------
I I I I I I I I I I I I I I. I I I I I
BARRINGER LABORATORIES INC GOLDEN. CO 80401 (303) Z17-1& FAX (303)"277-1888
David Cline Bingham Environmental, Inc. 5160 Wiley Post Way Salt Lake City, UT 84116
7-Jun-95 Page: Q-2
Attn: Received: 30-Mar-95 09:25 Project: COC 00107 PO #:
Job: 951671E
Abbreviations:
Parameters: TDS Redox
Methods: HC03 C03
Units: mg/l mV
Quality codes: NA U
Total Dissolved Solids Oxidation-Reduction Potential
Bicarbonate Carbonate
milligrams per liter millivolts
Not Analyzed Undetected
Status:
Meeting The Analytical Challenges Of A Changing World
Final
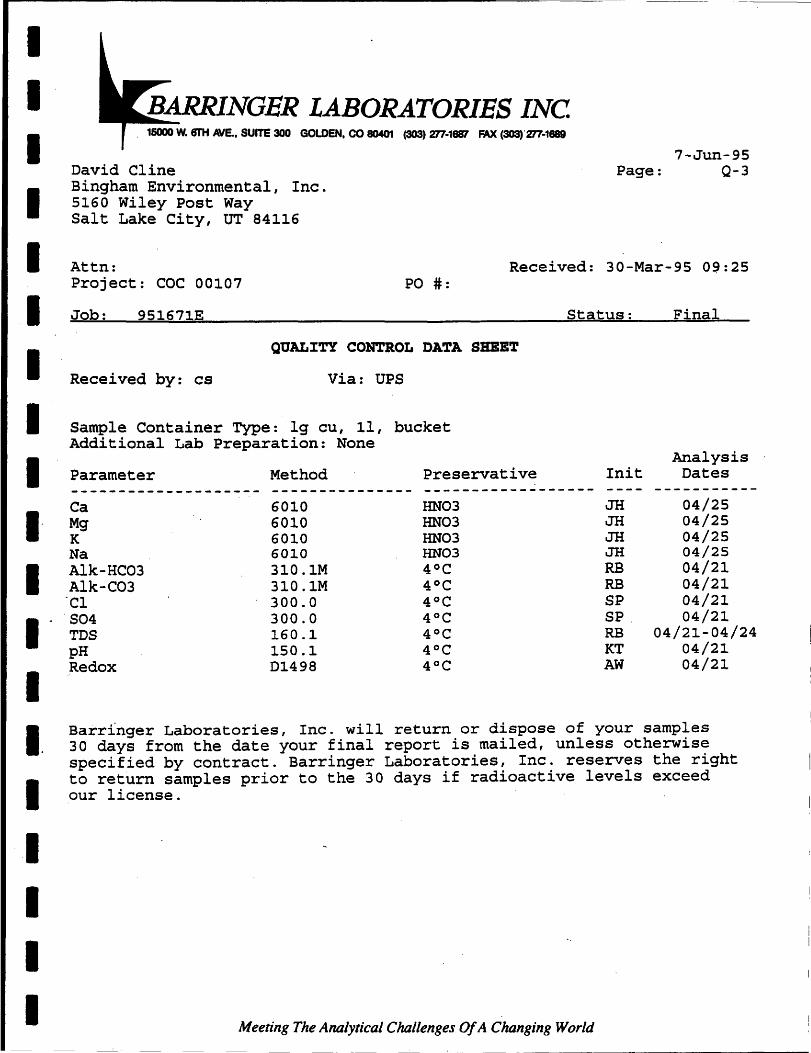
I I I I I I I I I I" I I-I I. I . 1 I I I
BARRINGER LABORATORIES INC GOLDEN. CO 80401 (303) 277-1687 FAX (303)"277-1889
David Cline Bingham Environmental, Inc. 5160 Wiley Post Way Salt Lake City, UT 84116
7-Jun-95 Page: Q-3
Attn: Received: 30-Mar-95 0~:25 Project: COC 00107
Job: 951671E
Received by: cs
PO #:
QUAL~TY CONTROL DATA SHEET
Via: UPS
Sample Container Type: 19 CU, 11, bucket Additional Lab Preparation: None
Parameter Method Preservative
Status:
Init -------------------- --------------- ------------------Ca 6010 HN03 JH Mg 6010 HN03 JH K 6010 HN03 JH Na 6010 HN03 JH
Alk-HC03 310.1M 4°C RB Alk-C03 310.1M 4°C RB ·Cl 300.0 4°C SP S04 300.0 4°C SP . TDS 160.1 4°C RB pH 150.1 4°C KT Redox D1498 4°C AW
Final
Analysis Dates
-----------04/25 04/25 04/25 04/25 04/21 04/21 04/21 04/21
04/21-04/24 04/21 04/21
Barr{nger Laboratories, Inc. will return or dispose of your samples 30 days from the date your final report is mailed, unless otherwise specified by contract. Barringer Laboratories, Inc. reserves the right to return samples prior to the 30 days if radioactive levels exceed our license .
Meeting The Analytical Challenges Of A Changing World

• • • • • • • • •
LABORATORIES INC 15000 W. 6Ilf INE.. SUITE 300 GOLDEN. CO 8040t (303) 277-1887 FAX (303)'277-1888
DISTRIBUTION RATIOS
RADIONUCUDE_ll2i PROPOSED ACTIVIT 10000 pCl/I ACruAL ACTIVITY _ 8052 pClD
(AFTER CONTACT EQUIUBRIUM)
ANALYSIS PERIOD_ 4124/95 - 5/8/95 ANALYST PRESTON CALCULATED ~~ DATE~ CHECKED BY 0:Z DA~-z':iiS APPROVED BY lr: DATE·, O'
• i 129 I HEAD SAMPLE Jg IN SOL IUNCERTAINTY 10K I I 1.82E-06 I 1.17E-07 I
• DAY 3 DAY
• 7 DAY 14 DAY
• •• • I
• I
•
DAY 3 DAY 7 DAY 7DAYDU 14 DAY 14 DAY D
DAY 3 DAY 7 DAY 7DAYDU 14 DAY 14 DAY 0
OF SAND 10.0015 10.0015 10.002
g IglNSOL UNCERTAINTY ON SAND 1.53E-06 8. 15E-08 2.91E-07 1.73E-06 9.13E-08 9.10E..Q8
NA NA NA 1.54E-06 8. 79E-08 2.85E-07
NA NA NA
Ig SOLUTElml Ig SOLUTEIg SAND 3.83E-08 2.71E-08 4.33E-08 9.10E-09
NA NA 3.85E-08 2.SSE-OS
NA NA
I
UNCERTAINTY 1.98E-07 2.08E-07
NA 2.05E-07
NA
KDRATIO I (mllg) 0.76 0.21 NA
0.74 NA
I
1
Meeting The Antllytical Challenges Of A Changing World
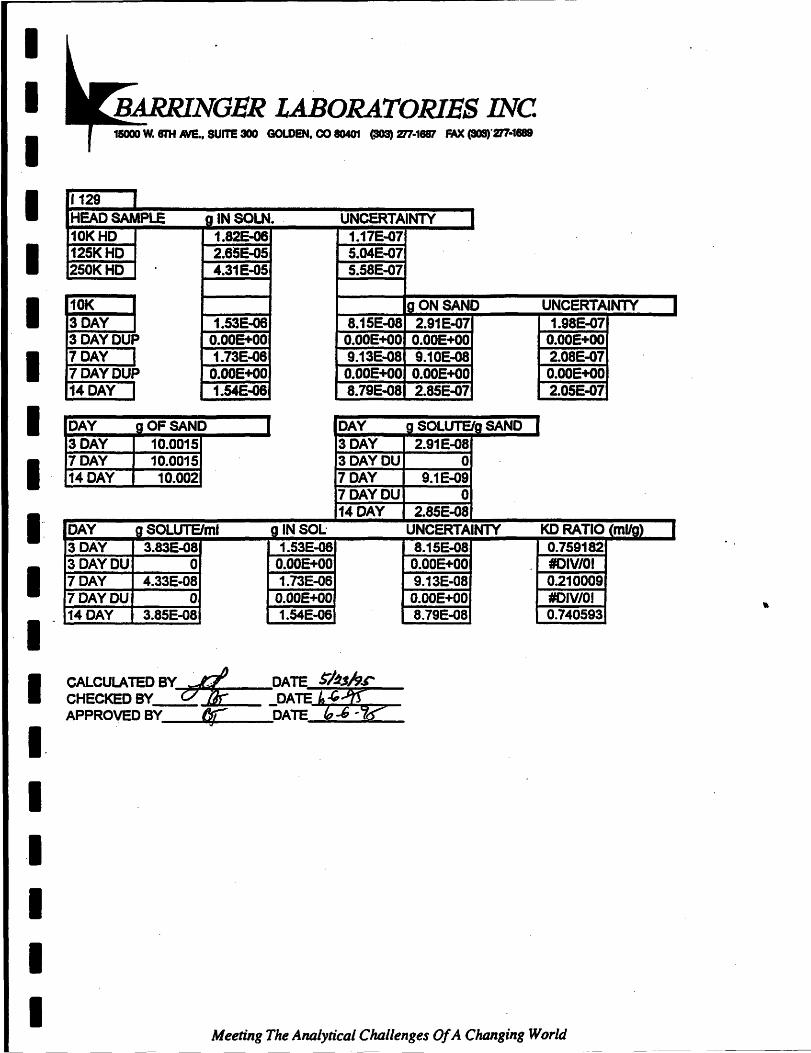
~------------------------------------------------------------~--------------
I I I I I I I I I I': I 1-
- ...... -,. LABORATORIES INC 15000 W. SIlt /NE., SUITE 300 GOLDEN. CO 80401 (a03) 277·1887 FAX (303)'277-1888
10K I 3 DAY I 3DAYDUP 7 DAY I 7DAYDUP 14 DAY I
IN SOLN. 1.82E..Q6 2.65E..CJS 4.31E-OS
1.S3E..Q6 O.OOE+OO 1.73E..Q6
O.OOE+OO 1.54E..Q6
DAY gOFSAND I 3 DAY 10.0015 7 DAY 10.0015 14 DAY 10.002
DAY SOLUTElml 3 DAY 3.83E-08 3DAYDU o 7 DAY 4.33E-08 7DAYDU o 14 DAY 3.85E-08
IN SOL· 1.53E-08
O.OOE+OO 1.73E-06
O.OOE+OO 1.54E-06
UNCERTAINTY 1.17E..Q7 S.D4E..Q7 S.S8E..Q7
ON SAND 8.1SE-08 2.91 E-07
O.OOE+OO O.OOE+OO 9.13E-08 9.10E-08
O.OOE+OO O.OOE+OO 8.79E-oa 2.85E..Q7
DAY 3 DAY 3DAYDU 7 DAY 7DAYDU 14 DAY
8.15E-08 O.OOE+OO 9.13E-08
O.OOE+OO 8.79E-08
UNCERTAINTY 1.98E-07
O.OOE+OO 2.08E-07
O.OOE+OO 2.0SE-07
0.759182 #CIV/OI 0.210009 #CIV/OJ 0.740593
I CAlCULATED BY -'!!:- DATE $1~.r CHECKED BY c:/1JF~_~_ DATE 4-'2ft APPROyeDBY 0;: DATE "n?
I-I I I I I
Meeting The Analytical Challenges Of A Changing World
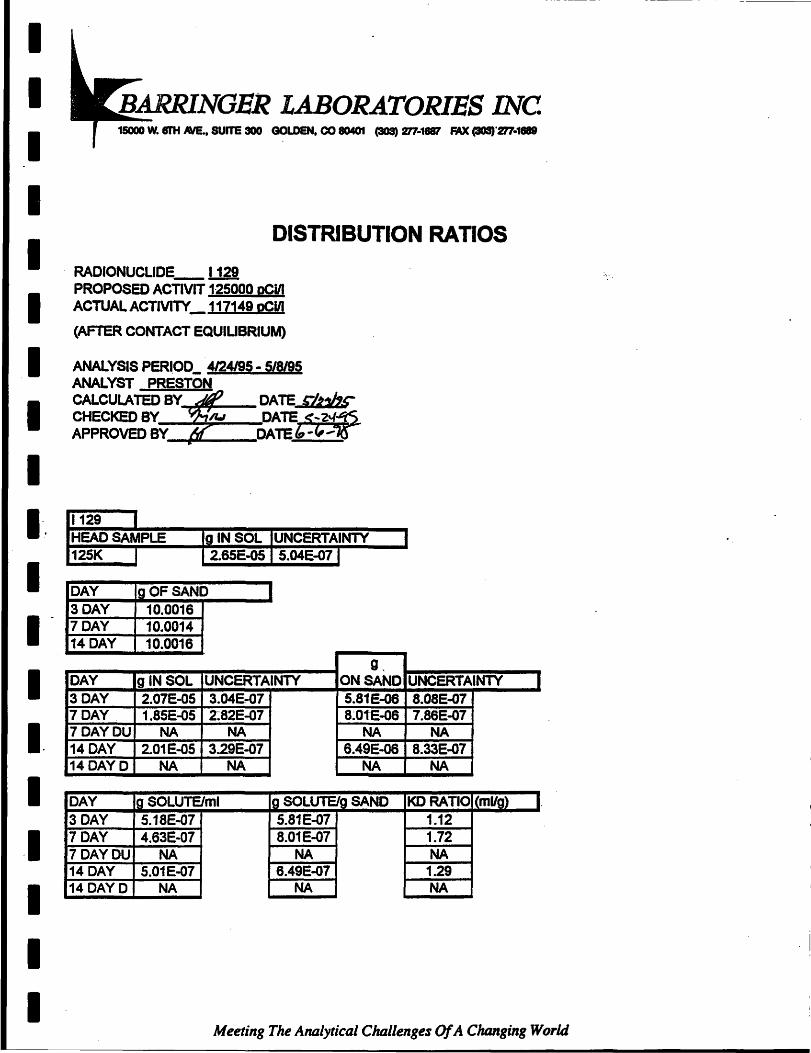
I I I I I I I I I I", I I-
I I. I I I I I
LABORATORIES INC 15000 W. 8I'H NE., SUITE 300 GOLDEN, CO 80401 (303) m-18fJ1 FAX (303)'277-1-
DISTRIBUTION RATIOS
RADIONUCLIDE_ 1129 PROPOSED ACTIVIT 125000 oCiII ACTUAL ACTIVITY _'17149 oClll (AFTER CONTACT EQUIUBRIUM)
ANALYSIS PERI,OD_ 4124195 - 5/8/95 ANALYST PRESTON CALCUl.ATED~Y DATE p,,J,r CHECKED BY /IJ DATE S ... zf1S.. APPROVED BY DATEff.1-"-1()"
1129 I HEAD SAMPLE Ig IN SOL UNCERTAINTY 125K I 2.65E..Q5 5.D4E..Q7 J
DAY OF SAND 3 DAY 10.0016 7 DAY 10.0014 14 DAY 10.0016
g, DAY 9 IN SOL UNCERTAINTY ON SAND 3 DAY 2.07E-05 3.D4E-07 5.81E-06 7 DAY , 1.85E~5 2:82E-07 8~OtE-06
7DAYDU NA NA NA 14 DAY 2.01E-05 3.29E-07 6.49E-06 14 DAY D NA NA NA
DAY Ig SOLUTElml 9 SOLUTEIg SAND 3 DAY 5.18E-07 5.81E-07 7 DAY 4.63E-07 8.01E-07 7DAYDU NA NA 14 DAY 5.01E-07 6.49E-07 14 DAVD NA NA
I
UNCERTAINTY 8.08E-07 7. 86E-07
NA 8. 33E-07
NA
KDRATIO 1 (mUg) 1.12 1.72 NA
1.29 NA
I
I
Meeting The Analytical Challenges Of A Changing World
, I
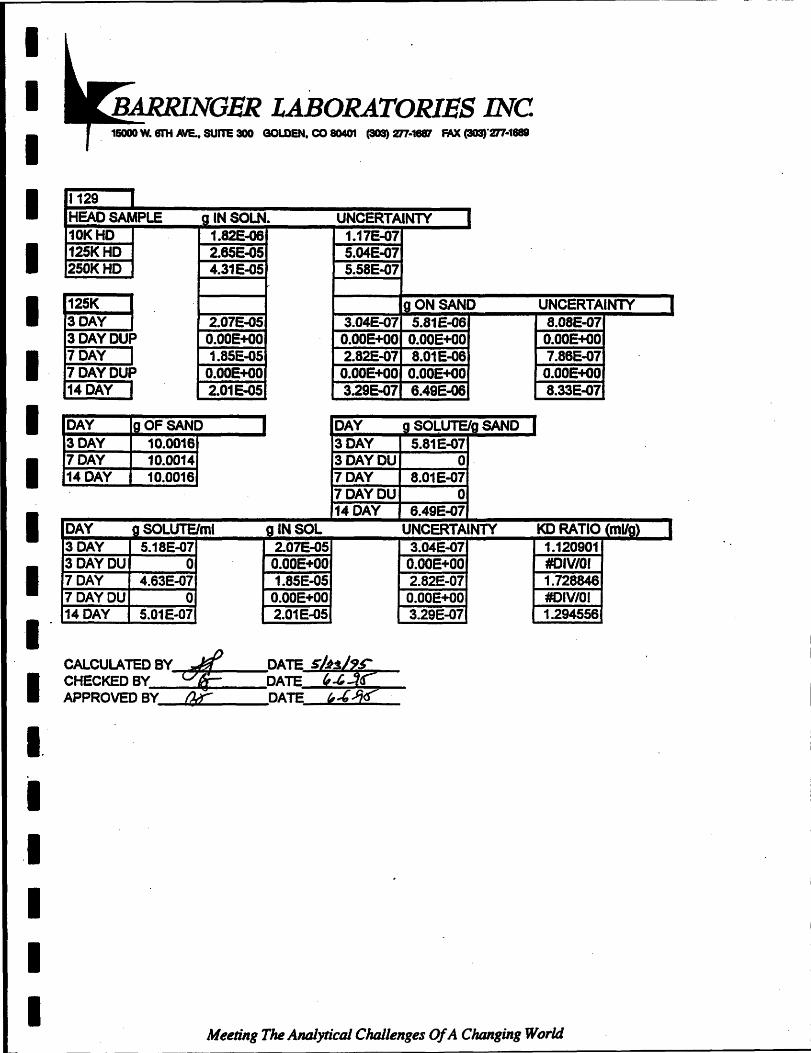
I' I I I I I I I I I I I I I. I .1 I I I
LABORATORIES INC . 16000 W. 8I'H AVE., SUITE 300 GOLDEN, CO 80401 (303) 277-1887 FAX (303)°277-1888
1129 HEAOSAMPLE giN SOLN. 10KHD 1.82E.Q6 125KHD 2.65E-05 250KHD 4.31E-05
125K 3 DAY 2.07E-QS 3DAYDUP O.OOE+OO 7 DAY 1.85E-05 7DAYDUP O.OOE+OO 14 DAY 2.01E-OS
DAY IgOFSAND 3 DAY 10.0016 7 DAY 10.0014 14 DAY 10.0016
DAY gSOLUTElml 3 DAY S.18E-07 3DAYDU 0 7 DAY 4.63E-07 7DAYDU 0 14 DAY S.01E-07
CALCULATED BY Ji!. CHECKED BY Ve APPROVED BY ru:
glNSOL 2.07E-05
O.OOE+OO 1.8SE-OS
O.OOE+OO 2.01E-OS
UNCERTAINTY 1.17E-Q7 5.04E-07 5. 58E-Q7
IgONSAND 3.04E-07 S.81E-oe
O.OOE+OO O.OOE+OO 2.82E-07 8.01E-06
O.OOE+OO O.OOE+OO 3.29E-07 6.49E-06
DAY g SOLUTEIg SAND 3 DAY S.81E-07 3DAYDU O· 7 DAY 8.01E-07 7 DAY DU 0 14 DAY 6.49E-07
UNCERTAINTY 3.04E-07
O.OOE+OO 2.82E-07
O.OOE+OO 3.29E-07
UNCERTAINTY 8.08E-07
O.OOE+OO 7.86E-07
O.OOE+OO 8.33E-07
KD RATIO (mUg) 1.120901 #CIV/Of 1.728846 #CIV/OI 1.294556
Meeting The Analytical Challenges Of A Changing World
I
I

I I I I I I I I I I
LABORATORIES INC 16000 w. 6I'H AlE.. SUITE 300 GOLDEN. CO 80401 (303) Z!7-18W MX (303)'Z!7-1_
DISTRIBUTION RATIOS
RADIONUCLIDE_ 1129 PROPOSED ACTIVIT 250000 pCi/I ACTUAL ACTlVlTY_ 190440 pClD
(AFTER CONTACT EQUIUBRIUM)
ANALYSIS PERIOD_ 4124195 - 5/8/95 ANALYST PRESTON
CALCULATED BY ~ DATE. CHECKED BY ~ DATES APPROVED BY f§4: DATE /J- r
1129 I HEAD SAMPLE Ig IN SOL UNCERTAINTY I
I DAY OF SAND
250K I 14.31E-05 5.58E-071
I -.13_DD~ArY~t--10_.0~02 ..... 5~ .- 10.0023 14 DAY 10.0012
I g
DAY IglNSOL UNCERTAINTY ON SAND UNCERTAINTY I 3 DAY 4.21E-05 8. 77E-07 1.05E-06 1.43E-06 7 DAY 4.15E-05 8.87E-07 1.65E-06 1.44E-06
I. 7DAYOU 5. 14E-05 1.04E-06 -8.25E-06 1.59E-06 14 DAY 3.77E-05 8.79E-07 5.4SE-06 1.44E-06 14 DAYD NA NA NA NA
I I I I
DAY g SOlUTElm' Ig SOLUTElg SAND KDRATIO I (mUg) I 3 DAY 1.05E-06 1.0SE-07 0.1 7 DAY 1.04E-06 1.6SE-07 0.16 7DAYDU 1.28E-06 -8.20E-07 -0.64 14 DAY 9.42E-07 5.45E-07 0.58 14 DAY 0 NA NA NA
I Meeting The A1IIlJyticaJ Clulllenges Of A Changing World

• • • • • • • • • • • ." • I
• •• I I
•
LABORATORIES INC 15000 W. srH ME.. SUITE 300 GOLDEN, co 8040t (3OS) 277-1887 FAX (303)"277-1888
1129 HEAD SAMPLE g INSOLN. UNCERTAINTY 10KHD 1.82E-Q6 1.17E-07 12SKHD 2.85E-OS 5.04E-07 2S0KHD 4.31E-OS S.58E-07
-
2S0K 3 DAY 4.21E-05 8.nE-07 3DAYDUP O.OOE+OO O.OOE+OO 7 DAY 4.1SE-05 8.87E-07 7DAYDUP 5.14E-05 1.04E-06 14 DAY 3.'17E-05 8.79E-07
DAY Ig OF SAND I DAY 3 DAY 10.0025 3 DAY 7 DAY 10.0023 3DAYDU 14 DAY 10.0012 7 DAY
7DAYDU 14 DAY
DAY gSOLUTElml g IN SOL 3 DAY 1.05E-06 4.21E-05 3DAYDU 0 O.OOE+OO 7 DAY 1.D4E-06 4.1SE-OS 7DAYDU 1.28E-06 S.14E-OS 14 DAY 9.42E-07 3.nE-OS
CALCULATED BY tt DATE SIW9SCHECKED BY_---ft~~_--..:DATE k--' -Cjj-APPROVED BY DATE h. -'i?:
IgONSAND 1.0SE-06
O.OOE+OO 1.65E-06
-8.25E-06 5.45E-06
g SOLUTEIg SAND 1.05E-07
0 1.65E-07 -8.2E-07 5.45E-07
UNCERTAINTY 8.nE-07
O.OOE+OO 8. 87E-07 1.04E-06 8. 79E-07
UNCERTAINTY 1.43E-08
O.OOE+OO 1.44E-06 1.59E-06 1.44E-06
KD RATIO <mUg) 0.099785 #CIV/OI 0.159076 -0.64213 0.578487
Meeting The Analytical ChIllienges Of A CJumging World
1
I
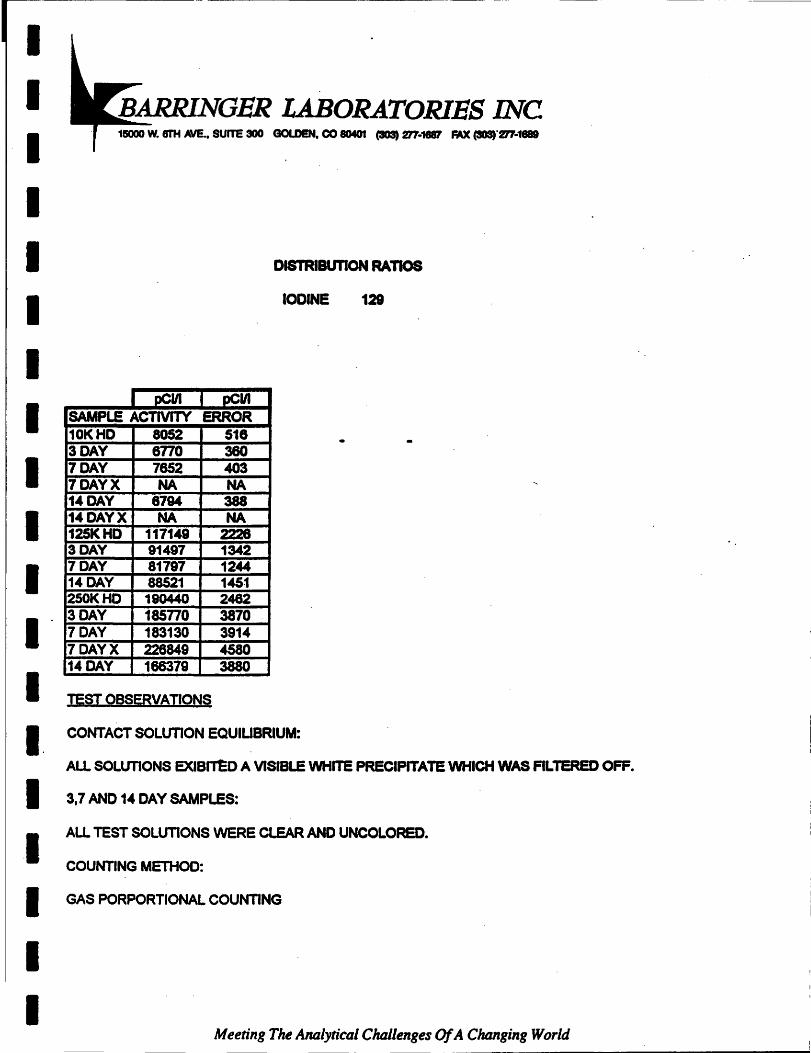
I I I I I I I I I I I I" I I. I . 1 I I I
BARRINGER LABORATORIES INC 15000 W. 8TH AVE •• SUITE 300 GOLDEN. CO 8040t (303) 277-1887 FAX (303)'277-1-
DISTRIBUTION RAnoa
IODINE 129
pCUI pClII
SAMPLE ACTIVITY ERROR 10KHD 8052 518 3 DAY 6770 360 7 DAY 7852 403 7 DAY X NA NA 14 DAY 6794 388 14 DAY X NA NA 125KHD 117149 2228 3 DAY 91497 1342 7 DAY 81797 1244 14 DAY 88521 1451 250KHD 190440 2482 3 DAY 185770 3870 7 DAY 183130 3914 7 DAY X 226849 4580 14 DAY 168379 3880
TEST OBSERVATIONS
CONTACT SOLUTION EQUIUBRlUM:
ALL SOLUTIONS EXlB~D A VISIBLE WHITE PRECIPITATE WHICH WAS FILTERED OFF.
3,7 AND 14 DAY SAMPLES:
ALL TEST SOLUTIONS WERE CLEAR AND UNCOLORED •
COUNTING METHOD:
GAS PORPORTIONAL COUNTING
Meeting The Analytical Challenges Of A Clumging World
I I I I I I I I I I I I·~
I I, I
•• I
• I
LABORATORIES INC· 15000 W. 8TH NE.. SUITE 300 GOLDEN. co 8040t (303) 277-1687 FAX (303)'277-1888
CONCLUSIONS
ALL OF THE TEST SOLUTIONS FOR EACH OF THE THREE DIFFERENT AcnVITIES EXHIBITED POSITIVE (KD) VALUES WITH THE EXCEPTION OF THE 250K 7 DAY DUP. WITHOUT ANAL VZlNG THE SOIL PORTION OF THIS SAMPLE IT 18 DIFFICULT TO DETERMINE IF THIS IS AN ANOMOL Y OR NOT.
Meeting The AlUliytical Challenges Of A Changing World
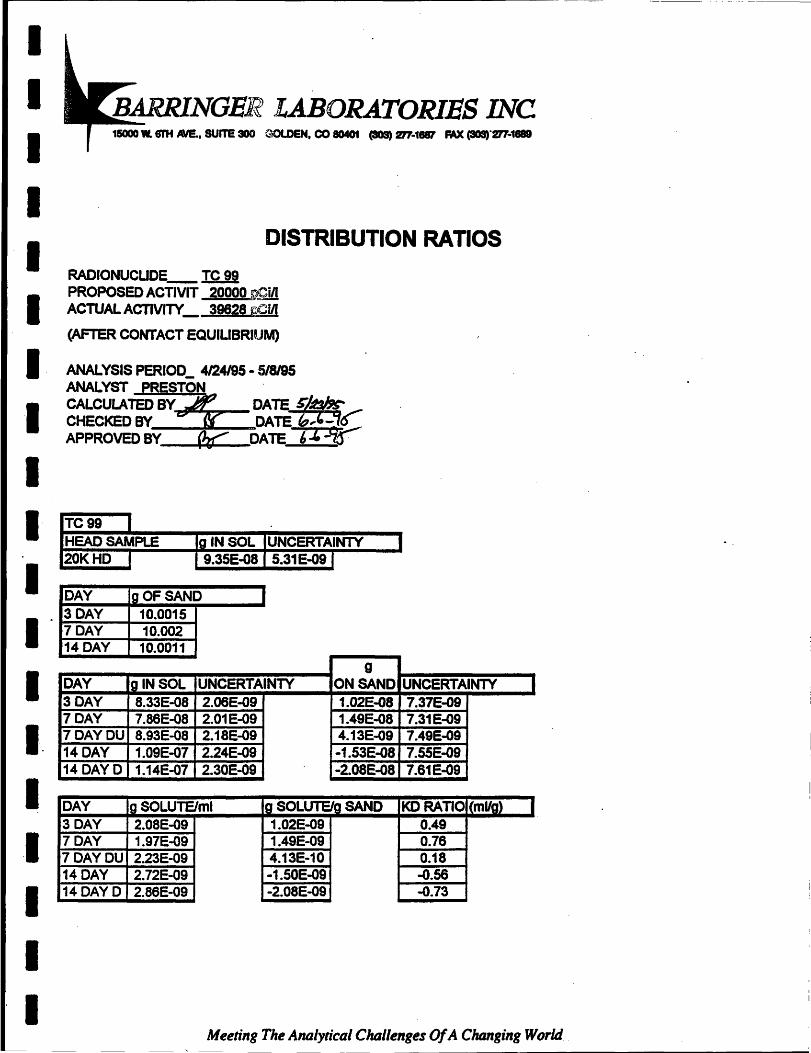
----------------------------~
I I I I I I I I I I
LABORATORIES INC 15000 .. 6rH ME.. SUITE 300 OOLDEN. CO 8040t (3OS) 277-1887 FAX (303)"277-1-
DISTRIBUTION RATIOS
RADIONUCUDE_ TC 99 PROPOSED ACTIVIT 20000!Q&1ll ACTUAL ACTIVITY 39628 pCUI (AFTER CONTACT EQUILIBRIUM)
ANALYSIS PERIOD_ 4124195 - 5/8195 ANALYST PRESTON .
CALCULATEDBY ~ DATE ~kf'f. CHECKED BY == DATE to, - '6 APPROVED BY (kC: DATE' 1-90--°
TC99 I HEAOSAMPLE 10 IN SOL IUNCERTAINTY I
I DAY OF SAND
20KHD I I 9.35E-OSI 5.31E-091
I "~~~~~~~~ ___ ~~~~.~~~1;.;.25~ 14 DAY 10.0011
I g
DAY la IN SOL UNCERTAINTY ON SAND UNCERTAINTY I 3 DAY S.33E-08 2.06E-09 1.02E-08 7. 37E-09 7 DAY 7.86E-OB 2.01E-09 1.49E-OS 7.31E-09
I·. 7DAYDU 8.93E-OB 2.1BE-09 4.13E-09 7.49E-09 14 DAY 1.09E-07 2.24E-09 -1.53E-08 7.55E-09 14 DAYD 1.14E-07 2.30E-09 -2.0SE-OS 7.61E-09
I I I I
DAY Ig SOLUTElml Ig SOLUTE/a SAND KeRATIO I (mUg) 1 3 DAY 2.0SE-09 1.02E-09 0.49 7 DAY 1.97E-09 1.49E-09 0.76 7DAYDU 2.23E-09 4.13E-10 0.1S 14 DAY 2.72E-09 -1.50E-09 -0.56 14 DAY D 2. 86E-09 -2.0BE-09 -0.73
I Meeting The Analytical Challenges Of A Clumging World
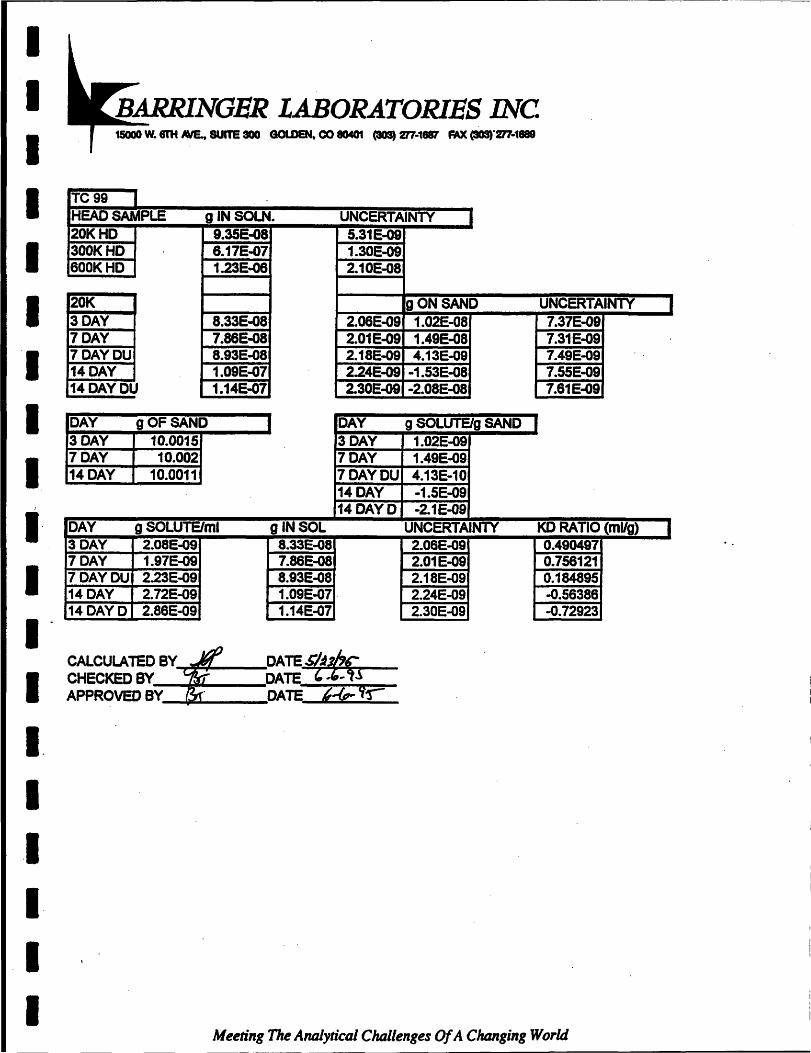
I I I I I I I I I
J
I I I" I I. I I I I I
LABORATORIES INC 15000 W. 8TH ME.. SUITE 300 GOlDEN. co 8040t (3OS) 277-1887 FAX (303)°277-1889
TC99 HEAD SAMPLE giN SOLN. UNCERTAINTY 20KHD 9.35E..Q8 5.31E..Q9 300KHD 6. 17E-07 1.30E-09 600KHD 1.23E-06 2.10E-08
20K gONSAND UNCERTAINTY -I 3 DAY 8.33E"()8 2.06E"()9 1.02E-08 7.37E-09 7 DAY 7.86E..Q8 2.01E"()9 1.49E-08 7.31E"()9 7DAYDU 8.93E-08 2.18E-09 4.13E-09 7.49E-09 14 DAY 1.09E..Q7 2.24E-09 -1.53E-08 7.55E-09 14DAYDU 1.14E"()7 2.30E-09 -2.08E-08 7.61E-09
DAY gOFSAND DAY g SOLUTEIg SAND I 3 DAY 10.0015 3 DAY 1.02E-09 7 DAY 10.002 7 DAY 1.49E-09 14 DAY 10.0011 7DAYDU 4.13E-10
14 DAY -1.5E-09 14 DAY 0 -2.1E-09
DAY g SOLUTElml g IN SOL UNCERTAINTY KD RATIO (mUg) I 3 DAY 2.08E-09 8.33E-08 2.06E-09 0.490497 7 DAY 1.97E-Q9 7.86E-08 2.01E-09 0.756121 7DAYDU 2.23E-09 8.93E-08 2.18E-09 0.184895 .14 DAY 2.72E-09 1.09E-07 2.24E-09 -0.56386 14 DAY 0 2.86E-09 1.14E-07 2.30E-09 -0.72923
CALCULATED BY~~ __ DATE$/~mC CHECKED BY DATE ,~ APPROVED BY DATE t,(, Yr
Meeting The AfIIllyt;cal Clulllenges Of A CJumg;ng World --.--- ----~-------------------
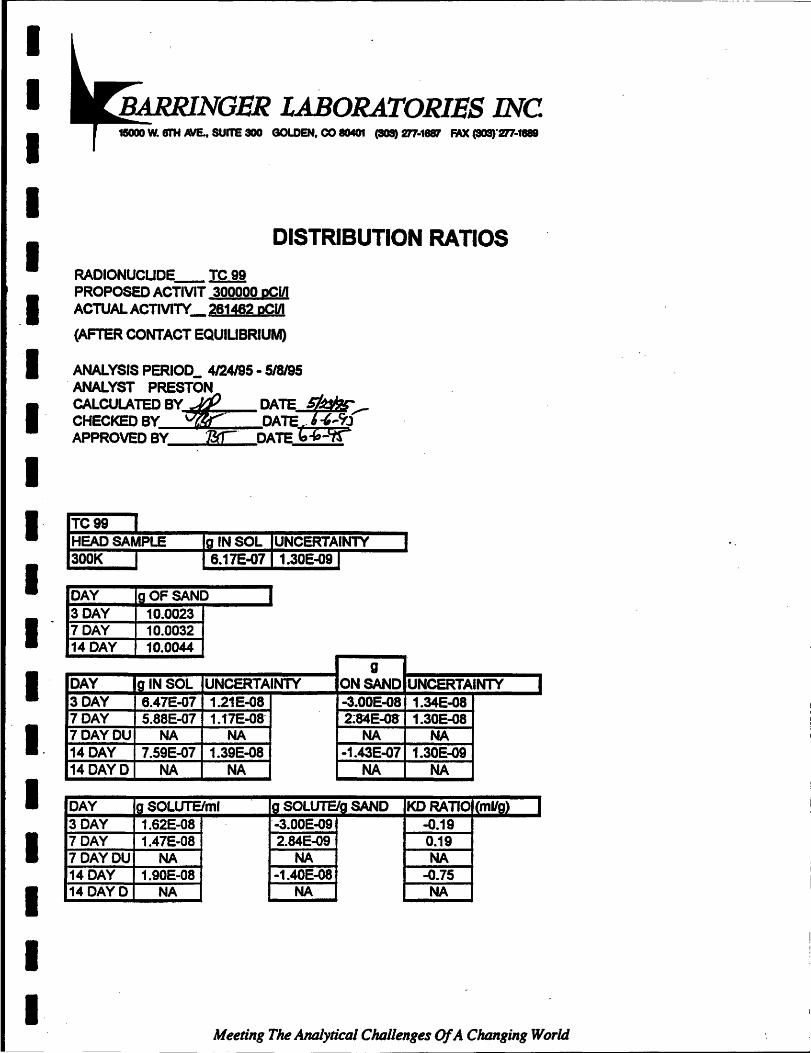
I I I I I I I I I I I I-I I I I I I I
LABORATORIES INC 1SOOO w. 81'H ME.. SUITE 300 GOLDEN, co 8040t (303) 277·1887 FI'X (303)'277.1_
DISTRIBUTION RATIOS
RADIONUCLlDE_ TC 99 PROPOSED ACTIVIT 300000 pCID ACTUAL ACTlVlTY_ 281482 pCi/I
(AFTER CONTACT EQUIUBRIUM)
ANALYSIS PERIOD_ 4124195 - 5/8195 " ANALYST PRESTON CALCUlATED BY 6/ifo DATE ~_ CHECKED BY ~ DATE~i APPROVED BY :t3ti:" DATE :{I;-Cfr
TC99 I HEAD SAMPLE la IN SOL IUNCERTAINTY 300K I I 6.17E-07 I 1.30E-09 I
DAY OF SAND 3 DAY 10.0023 7 DAY 10.0032 14 DAY 10.0044
g DAY laiN SOL UNCERTAINTY ON SAND 3 DAY 6.47E-07 1.21E-08 -3.00E-Q8 7 DAY 5.8SE-07 1.17E-OS- 2:~E-08
7DAYDU NA NA NA 14 DAY 7.59E-07 1.39E-08 -1.43E-07 14 DAY 0 NA NA NA
DAY la SOLUTEIm' Ig SOLUTEIg SAND 3 DAY 1.62E-OS "-3.00E-09 7 DAY 1.47E-08 2.84E-09 70AYDU NA NA 14 DAY 1.90E-08 -1.40E-08 14 DAYD NA NA
I
UNCERTAINTY 1.34E-08 1.30E-OS
NA 1.30E-09
NA
KDRATIO I (mllg) -0.19 0.19 NA
-0.75 NA
I
I
Meeting The Analytical Challenges Of A Chilnging World
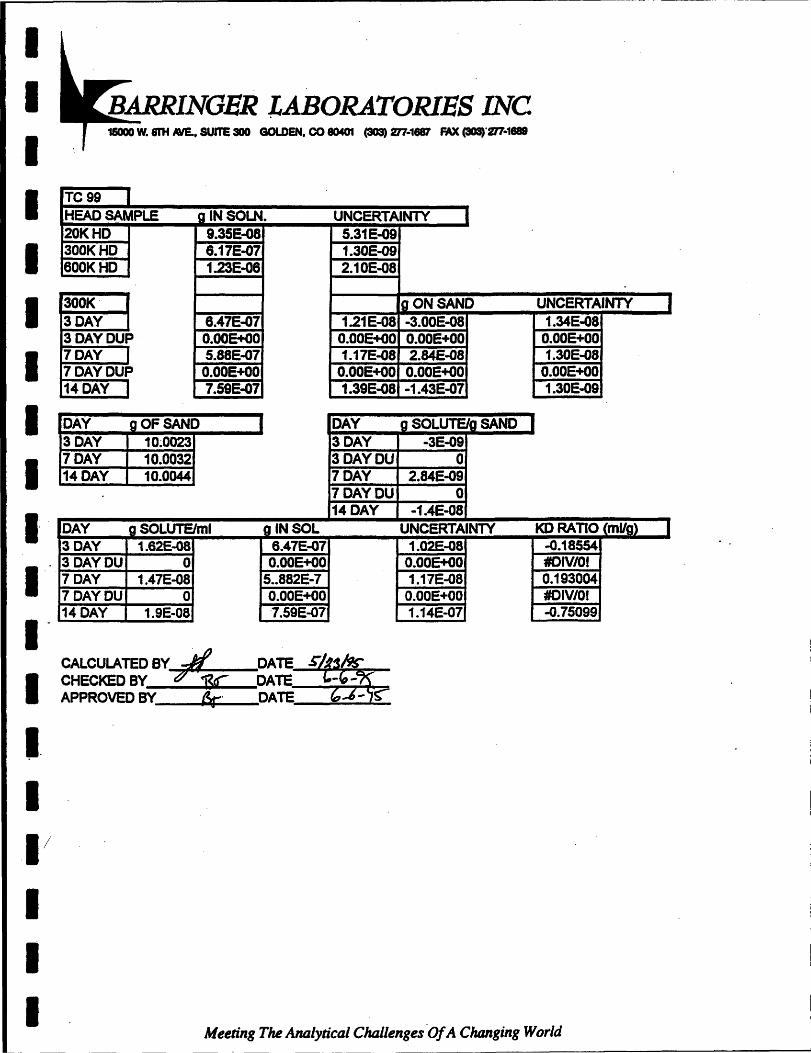
I I I I I I I I I I: I I-
I II II
I I I
~ABORATORIES INC 1SOOO W. 8TH ME.. SUITE 300 GOLDEN. CO 80401 (303) 277-1881 FAX (303)°277-1888
TC99 HEAD SAMPLE g INSOLN. UNCERTAINlY 20KHD 9.35E..Q8 5.31E-09 300KHD 6.17E-07 1.30E-09 600KHD 1.23E-06 2.10E-08
300K" gONSAND UNCERTAINTY I 3 DAY 6.47E-07 1.21E-08 -3.00E-08 1.34E-08 3DAYDUP o.ooaoo O.OOE+OO O.OOE+OO O.OOE+OO 7 DAY 5.88E-07 1.17E-08 2.84E-08 1.30E-08 7DAYDUP O.OOE+OO O.OOE+OO O.OOE+OO O.OOE+OO 14 DAY 7.59E-07 1.39E-08 -1.43E-07 1.30E-09
DAY gOFSAND DAY g SOLUTEIg SAND 3 DAY 10~0023 3 DAY -3E-09 7 DAY 10.0032 3DAYDU 0 14 DAY 10.0044 7 DAY 2.84E-09
7DAYDU 0 14 DAY -1.4E-08
DAY gSOLUTElml glNSOL UNCERTAINTY KD RATIO (mUg) I 3 DAY 1.62E-08 6.47E-07 1.02E-08 -0.18554 3DAYDU 0 O.OOE+OO O.OOE+OO #Dlv/or 7 DAY 1.47E-08 5 •• 882E-7 1.17E-08 0.193004 7DAYDU 0 O.OOE+OO O.OOE+OO #Dlv/or 14 DAY i.9E-08 7.59E-07 1.14E-07 -0.75099
CALCULATED By~;/l'lfll6~~ __ D"ATE~ CHECKED BY ~:gc DATE - - " APPROVED BY 6r DATE - S-
Meeting The Analytical Challenges "Of A Clumging World

------------------------~----- ---
I I I I I I I I I I
LABORATORIES INC 15000 W. 8fH INE., SUITE 300 GOLDEN, CO 8040t (303) 277-1887 FAX (308)'277-1&
DISTRIBUTION RATIOS
RAOrONUCUDE~ TC 99 PROPOSED ACTIVIT 600000 pCl/I ACTUAl ACTIVITY 522151 oCl/l
(AFTER CONTACT EQUIUBRIUM)
ANALYSIS PERIOD_ 4124195 - 5/8195 ANALYST PRESTON -
CALCULATED~Y DATE ttl CHECKED BY DATE'" APPROVED BY DATE· ..,.
TC99 I HEAD SAMPLE la IN SOL UNCERTAINTY 600K J 1.23E-08 2.10E-QSI
I
I DAY OF SAND 3 DAY 10.0013
I -1""!'7~D~A~Y~~10~.0~0~13~ 14 DAY 10.0025
I I.
DAY 3 DAY 7 DAY 7DAYDU 14 DAY 14DAYD
Ig IN SOL 1.21E-06 1.31E-06 1.65E-06 1.59E-06
NA
UNCERTAINTY 2.33E-OS 2.43E~6 3.15E-08 3.06E-08
NA
g ON SAND UNCERTAINTY I 2.00E-08 4.43E-08 -7.50E-OS 4.53E-Q8 -4.18E-07 5.25E-OS -3.61E-07 5.16E-08
NA NA
I I I I
DAY Ig SOLUTElml g SOLUTEIg SAND KDRATIO (mUg) I 3 DAY 3.03E-08 2.00E-09 0.07 7 DAY 3.27E-08 -7.S0E-09 -0.23 7DAYDU 4.12E-08 -4.20E-08 -1.01 14 DAY 3.98E-08 -3.60E-08 -0.91 14 DAY 0 NA NA NA
I Meeting The Analytical Challenge$ Of A Changing World
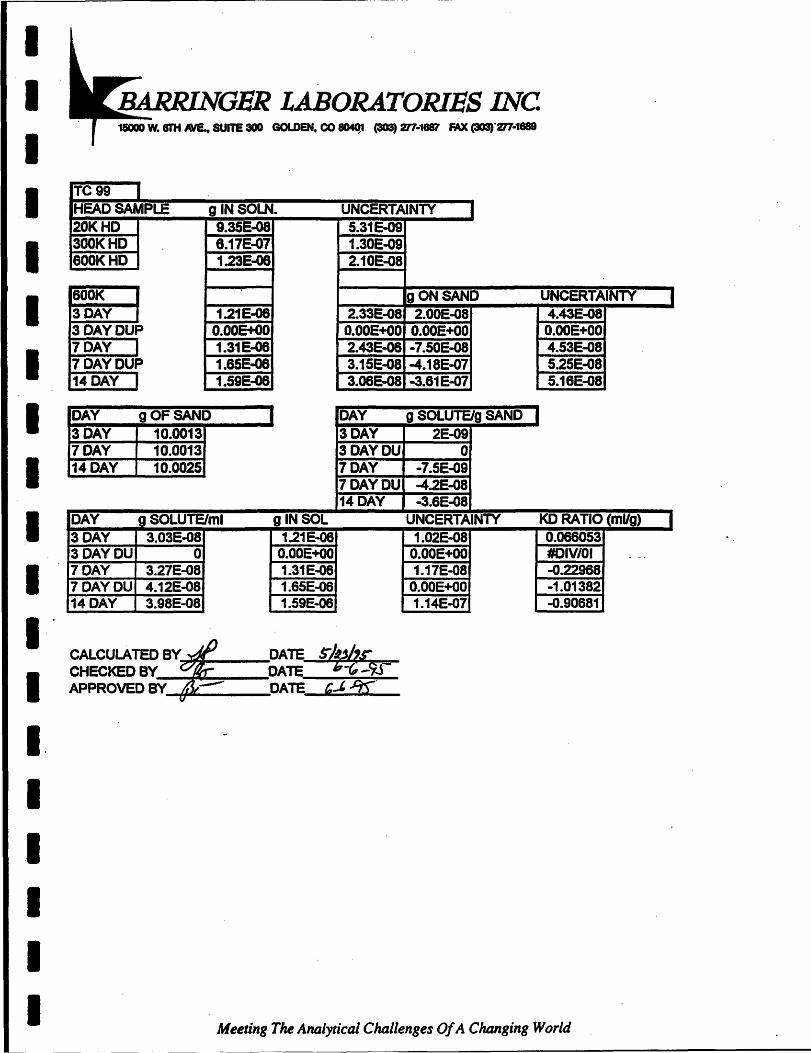
~----------------------------------------------------
I I I I I I I I I I I I-
I II I I I I
"' .... -,. LABORATORIES INC 1SOOO W. srH ME.. SUITE 300 GOLDEN. co 804q1 (303) 217-1887 FAX (303)'277-1888
TC99 HEAD SAMPLE g INSOLN. UNCERTAINTY 20KHD 9.35E..Q8 5.31E-09 300KHD 8.17E-07 1.30E-09 600KHD 1.23E-08 2.10E-OS
600K gONSAND UNCERTAINTY 3 DAY 1.21E-06 2.33E-08 2.00E-08 4.43E-08 30AYDUP O.OOE+OO O.OOE+OO O.OOE+OO O.OOE+OO 7 DAY 1.31E-06 2.43E-06 -7.50E-08 4.53E-08 7DAYDUP 1.65E-06 3.15E-OS -4.1SE-07 5.25E-OS 14 DAY 1.59E-06 3.06E.Q8 -3.61E-07 5.16E-OS
DAY gOFSAND DAY g SOLUTElg SAND 3 DAY 10.0013 3 DAY 2E-09 7 DAY 10.0013 3DAYDU 0 14 DAY 10.0025 7 DAY -7.5E-09
7DAYDU -4.2E-OS 14 DAY -3.6E-OS
DAY gSOLUTElml g IN SOL UNCERTAINTY KD RATIO (mUg) 3 DAY 3.03E-OS 1.21E-08 1.02E-OS 0.066053 3DAYDU 0 O.OOE+OO O.OOE+OO #DIV/OI - _.
7 DAY 3.27E-08 1.31E-08 1.17E-08 -0.22968 7DAYDU 4.12E-08 1.65E..Q6 O.OOE+OO -1.01382 14 DAY 3.98E-08 1.59E-06 1.14E-07 -O.906S1
CALCULATED BY-¥JI--__ DATE S-/IJQr CHECKED BY ~ DATE b~ -93-APPROVED BY DATE ,-" ;'b:-
Meeting The Analytical Challenges Of A Changing World
I
I
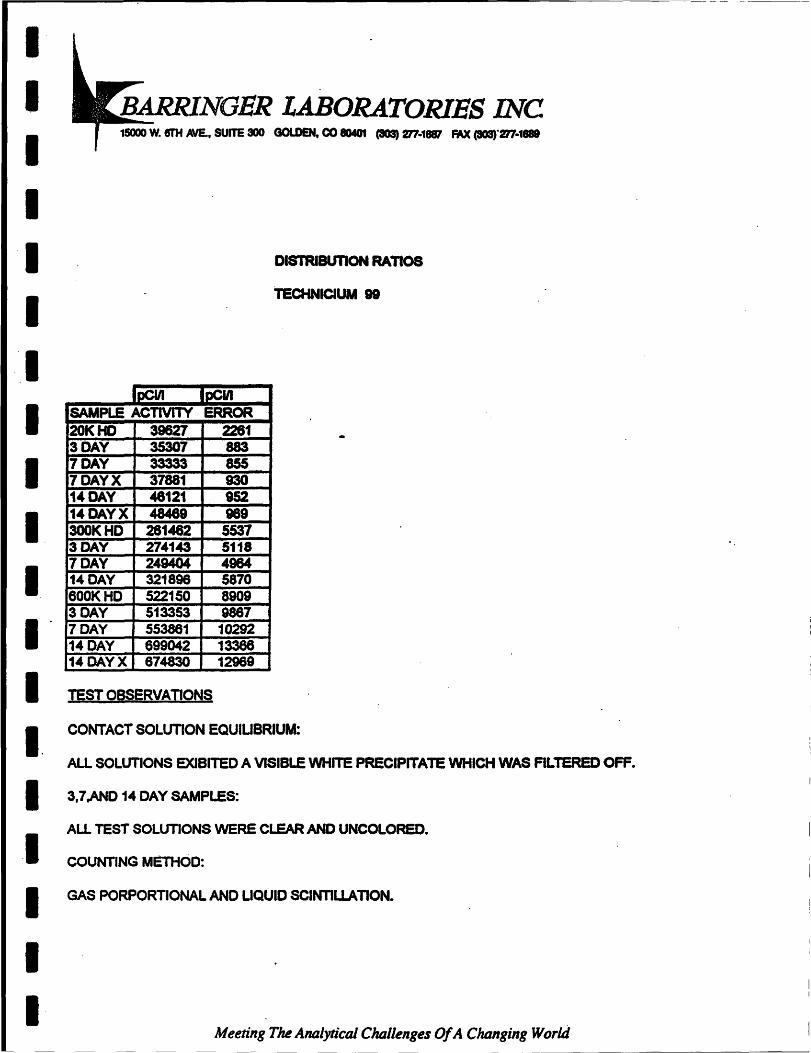
------""'!""----------------------------- ~----
I I I I I I I I I I I I I I. I . 1 I I I
BARRINGER LABORATORIES INC 15000 W. 6I'H AVE., SUITE 300 GOlDEN, CO 80401 (303) 277·1887 FAX (303)'277-1-
IpCiII IpClII SAMPLE ACTIVITY ERROR 20KHD 39627 2281 3 DAY 35307 883 7 DAY 33333 855 7 DAY X 37881 930 14 DAY 48121 952 14 DAY X 48489 989 300KHD 281462 5537 3 DAY 274143 5118 7 DAY 249404 4964 14 DAY 321896 5870 eOOKHO 522150 8909 3 DAY 513353 9887 7 DAY 553861 10292 14 DAY 699042 13366 14 DAY X 674830 12969
TEST OBSERVATIONS
DISTRIBUTION RAnos
TECHNICIUM 88
CONTACT SOLUTION EQUIUBRlUM:
ALL SOLUTIONS EXlBITED A VISIBLE WHITE PRECIPITATE WHICH WAS FILTERED OFF.
3,7.AND 14 DAY SAMPLES:
ALL TEST SOLUTIONS WERE ClEAR AND UNCOLORED •
COUNTING METHOD:
GAS PORPORTIONAL AND LIQUID SCINTILLATION.
Meeting The Analytical Challenges Of A Changing World
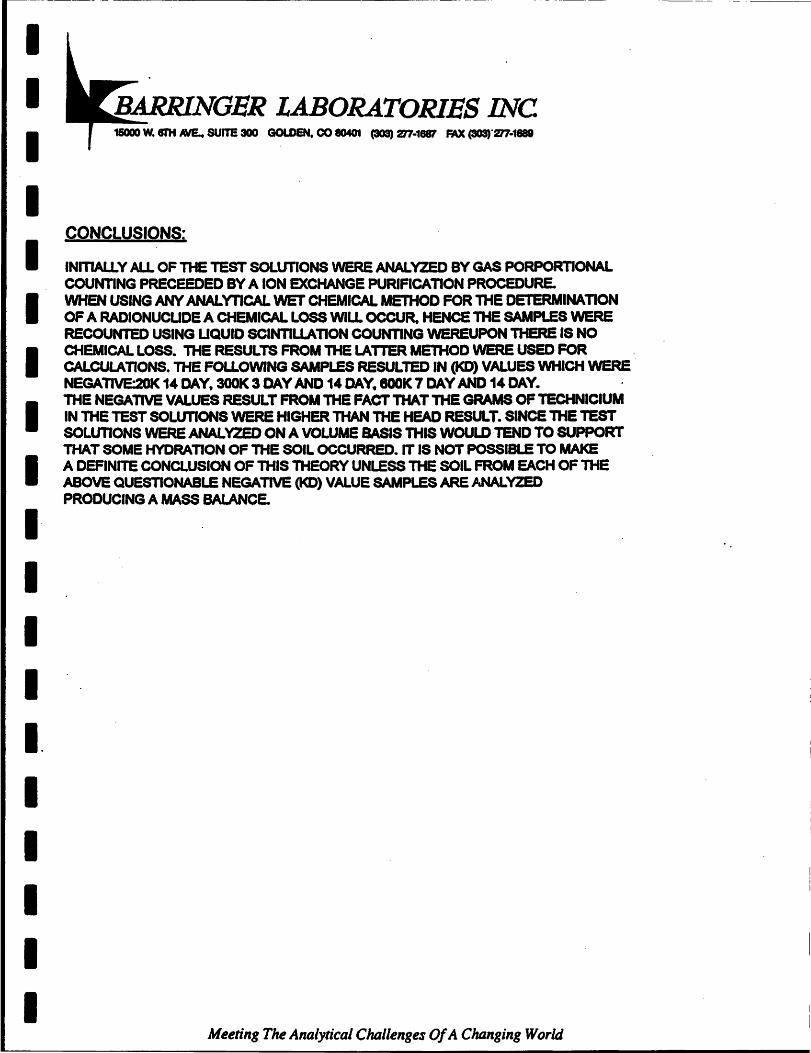
I I I I I I I I I I· I I I I. I I I I I
LABORATORIES INC 1&000 W. 8I'H ME.. SUITE 300 GOLDEN, co 80401 (303) 2'17-1887 FAX (303)'2'17-1888
CONCLUSIONS;
INITIALlY ALL OF THE TEST SOLUTIONS WERE ANAL VZED BY GAS PORPORTIONAL COUNTING PRECEEDED BY A ION EXCHANGE PURIFICATION PROCEDURE. WHEN USING ANY ANALYTICAL WET CHEMICAL METHOD FOR THE DETERMINATION OF A RADIONUCUDE A CHEMICAL LOSS WILL OCCUR, HENCE THE SAMPLES WERE RECOUNTED USING UQUID SCINTILLATION COUNTING WEREUPON THERE IS NO CHEMICAL LOSS. THE RESULTS FROM THE LATTER METHOD WERE USED FOR CALCULATIONS. THE FOLLOWING SAMPLES RESULTED IN (1<0) VALUES WHICH WERE . NEGATIVE:2OK 14 DAY, 300K 3 DAY AND 14 DAY. 800K 7 DAY AND 14 DAY. THE NEGATIVE VALUES RESULT FROM THE FACT THAT THE GRAMS OF TECHNICIUM IN THE TEST SOLUTIONS WERE HIGHER THAN THE HEAD RESULT. SINCE THE TEST SOLunONS WERE ANAL VZED ON A VOLUME BASIS THIS WOULD TEND TO SUPPORT THAT SOME HYDRATION OF THE SOIL OCCURRED. IT IS NOT POSSIBLE TO MAKE A DEFINITE CONCLUSION OF THIS THEORY UNLESS THE SOIL FROM EACH OF THE ABOVE QUESTIONABLE NEGATIVE (1<0) VALUE SAMPLES ARE ANAL VZED PRODUCING A MASS BALANCE.
Meeting The Analytical ChlJllenges Of A ChlJnging World
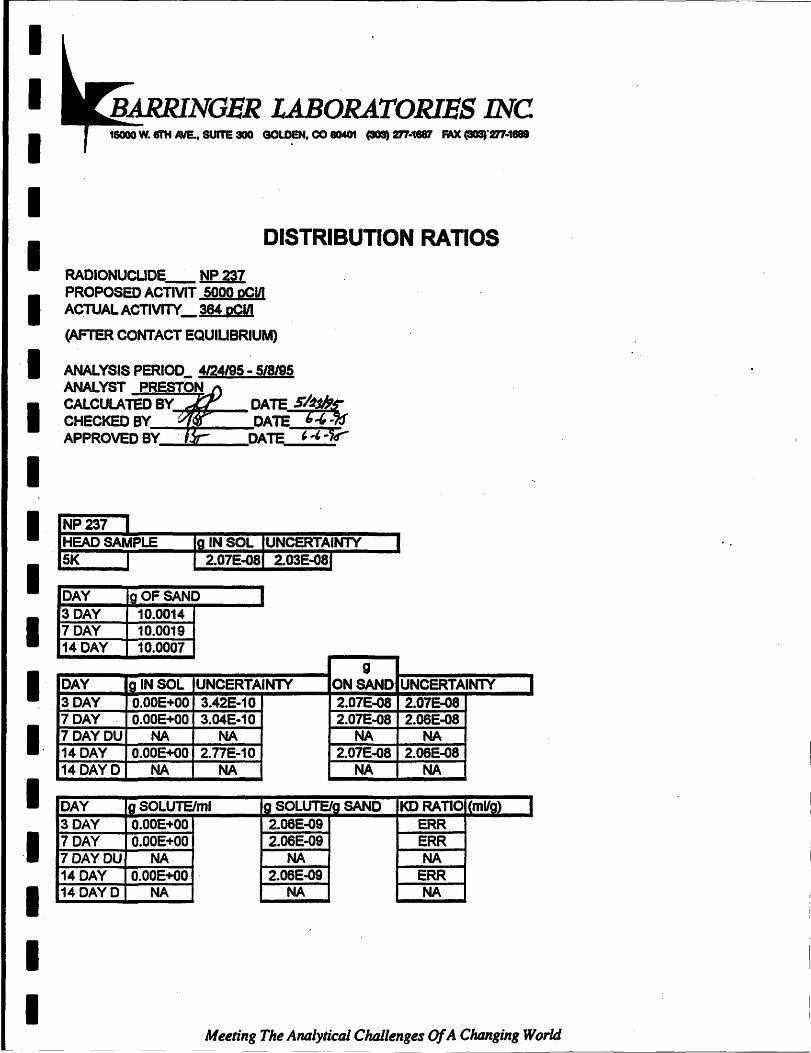
I I I I I I I I I I
BARRINGER LABORATORIES INC 16000 W. S1'H NE.. SUITE 300 GOlDEN. CO 8040t (3OS) %17-16111 FAX (SOS)'277-1889
DISTRIBUTION RATIOS
RADIONUCUDE_ NP 237 PROPOSED ACTIVIT 5000 pCW ACTUAL ACTIVITY _ 384 pCl/I
(AFTER CONTACT EQUIUBRIUM)
ANALYSIS PERIOD_ 4/24/95 - 5/8/95 ANALYST PR S ON CALCULATED BY~F60-_DATE S~~ CHECKED BY DATE ""' ... APPROVED BY . DATE , ... ~ -'r
NP 2371 HEAD SAMPLE Ig IN SOL UNCERTAINlY I I SK I
DAY gOFSAND
I 2.07E-08 2.03E-081
I 3 DAY 10.0014 7 DAY 10.0019 14 DAY 10.0007
I g
DAY IglNSOL UNCERTAINTY ON SAND UNCERTAINTY I 3 DAY O.OOE+OO 3.42E-10 2.07E-08 2.07E-08 7 DAY O.OOE+OO 3.04E-10 2.07E-08 2.06E-08 7DAYDU NA NA NA NA 14 DAY O.OOE+OO 2.nE-10 2.07E-08 2.06E-08 14 DAYD NA NA NA NA
I. I I I
DAY gSOLUTElml Ig SOLUTEIg SAND KDRATIO I (mUg) I
I I
3 DAY 7 DAY 7DAYDU 14 DAY 14 DAYD
O.OOE+OO O.OOE+OO
NA O.OOE+OO
NA
2.06E-09 ERR 2.06E-09 ERR
NA NA 2.06E-09 ERR
NA NA
Meeting The A1IIllyticai Challenges Of A Changing World
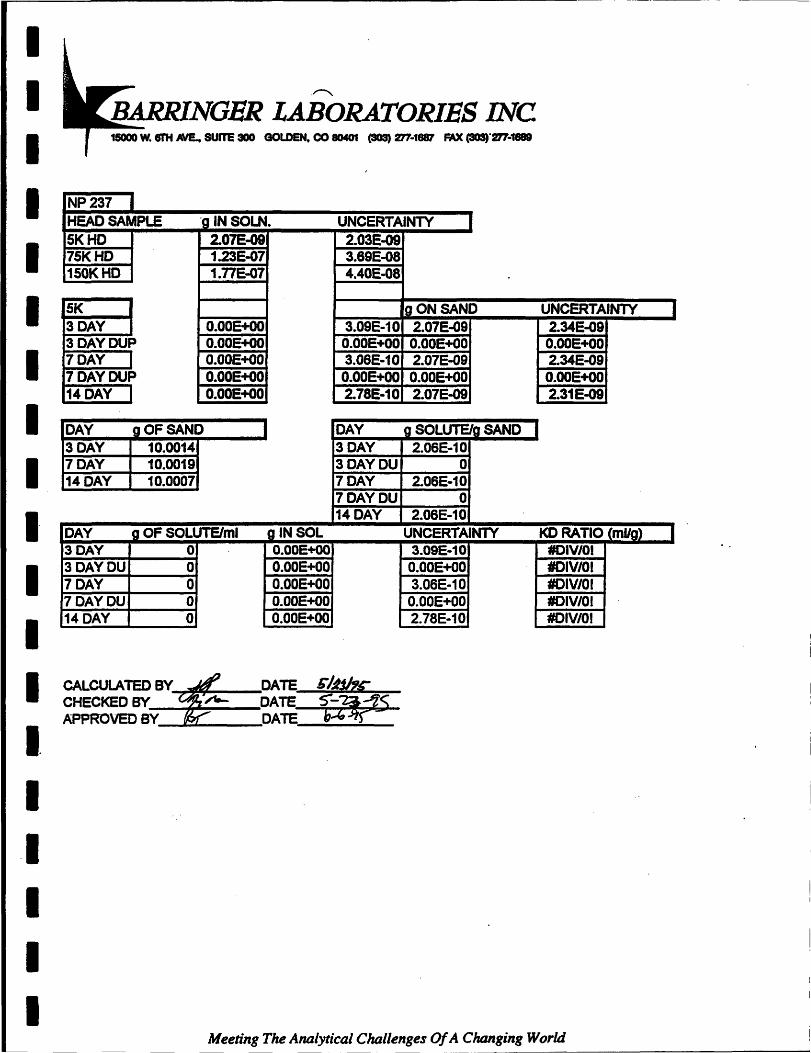
I I I I I I I I I I· I I I I. I .1 I I I
.~
LABORATORIES INC 15000 W. 8I'H AVE.. SUITE 300 GOLDEN, CO 80401 (S03) 277-1887 FAX (303)'277-1888
NP237 HEAD SAMPLE -g INSOLN. UNCERTAINTY 5KHD 2.07E-09 2.03E-09 75KHD 1.23E-07 3.89E-OS 150KHD 1.77E-07 4.40E-OS
5K gONSAND UNCERTAIN1Y I 3 DAY O.OOE+OO 3.09E-10 2.07E-09 2.34E-09 3DAYDUP O.OOE+OO O.OOE+OO O.OOE+OO O.OOE+OO 7 DAY O.OOE+OO 3.06E-10 2.07E-09 2.34E-09 7DAYDUP O.OOE+OO O.OOE+OO O.OOE+OO O.OOE+OO 14 DAY O.OOE+OO 2.7SE·10 2.07E-09 2.31E-09
DAY gOFSAND DAY g SOlUTElg SAND 3 DAY 10.0014 3 DAY 2.06E-10 7 DAY 10.0019 3DAYDU 0 14 DAY 10.0007 7 DAY 2.06E-10
7DAYDU 0 14 DAY 2.06E-10
DAY g OF SOLUTElml g IN SOL UNCERTAINlY KD RATIO (mUg) I 3 DAY 0 O.OOE+OO 3.09E-10 tlDlV/OI 3DAYDU 0 O.OOE+OO O.OOE+OO #CIV/OI 7 DAY 0 O.OOE+OO 3.0SE-10 #CIV/OI 7DAVDU 0 O.OOE+OO O.OOE+OO #CIV/OI 14 DAY 0 O.OOE+OO 2.7SE-10 #CIV/OI
CALCULATED BY ~ DATE &'14*£ CHECKED BY ~ DATE S--1a=~ APPROVEDBY_,,&.,;;."-___ DATE~ ....... b_~__=r~_
Meeting The Analytical Challenges Of A Changing World ----------------

1 1 1 1 1 1 1 1 I I· I I I I. I I I I I'
"""' ..... -, LABORATORIES INC 1&000 w. 6I'H NE.. SUITE 300 GOlDEN. co 80401 (303) m·1_ FAX (30Srm·1888
DISTRIBUTION RATIOS
RADIONUCLIDE_ NP 237 PROPOSED ACTIVIT 75000 pCI/I ACTUAL ACTIVfN _ 2192 pCI/I
(AFTER CONTACT EQUIUBRIUM)
ANALYSIS PERIOD_ 4124195 - 5/8/95 ANALYST PRESTON CALCULATEDBY ~ DATEstWrs __ CHECKEDBY 7.ff.. DATE b"'-~ APPROVED BY DATE "'" ·2~
NP237 I HEAD SAMPLE IglN SOL IUNCERTAINTY 75K I J 1.23E-071 3.69E-081
DAY OF SAND 3 DAY 10.0014 7 DAY 10.0011 ·'4-DAY 10~0013
g DAY ,g IN SOL UNCERTAINTY ON SAND 3 DAY 1.25E-09 1.93E-09 1.22E-07 7DAY. 9~08E-l0 2.10E-l0 1.22E-07 7DAYDU NA NA NA 140AY 7.94E-10 2. 55E-09 1.23E-07 14 DAY 0 NA NA NA
DAY Ig SOLUTElml Ig SOLUTEIg SAND 3 DAY 3.12E-11 1.22E-08 7 DAY 2.27E-l1 1.22E-08 7DAYDU NA NA 14 DAY 1.99E-ll 1.23E-08 14 DAY 0 NA NA
I
UNCERTAINlY 3.88E-08 3.71E-08
NA 3.94E-08
NA
KDRATIO I (mUg) 391.46 539.67
NA 617.35
NA
J
I
Meeting The Analytical Challenges Of A Changing World
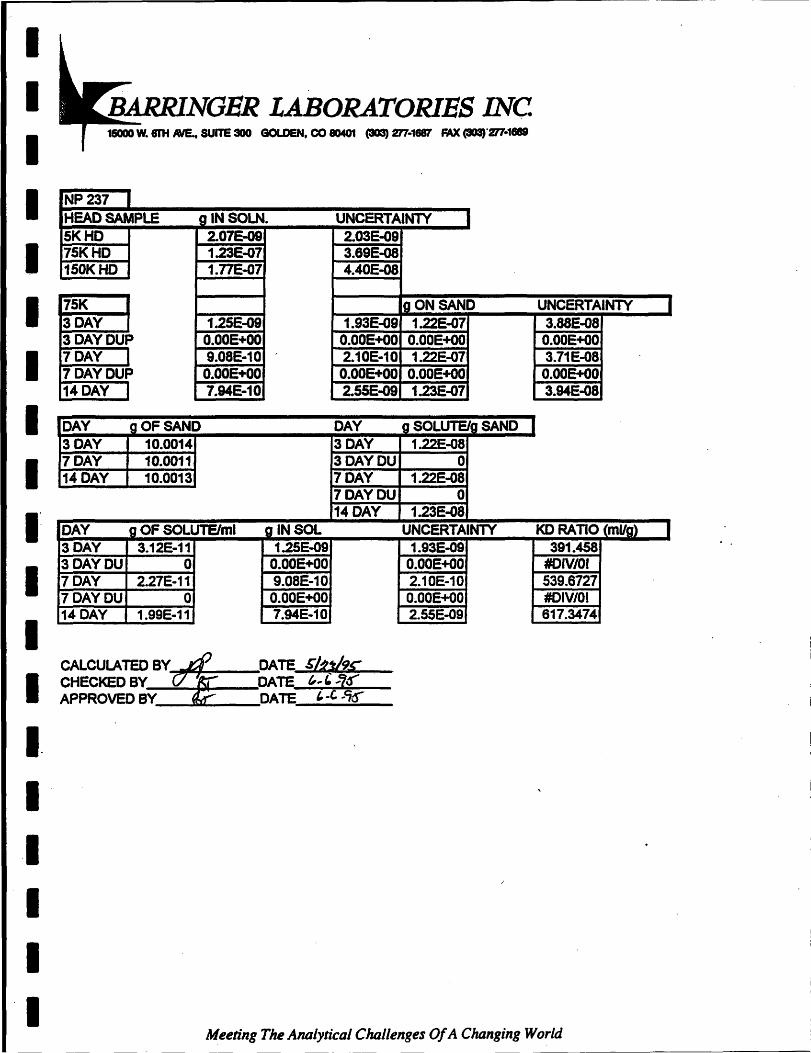
--------------------------------- ------
I I I I I I I I I I:
I I I I. I ,I I I I
LABORATORIES INC 15000 W. 8I'H ME.. SUITE 300 GOLDEN, CO 80401 (303) m-16f11 FAX (303)·277-1-
NP237 HEAD SAMPLE giN SOLN. UNCERTAINTY 5KHD 2.07E-OS 2.03E-OS 75KHD 1.23E-07 3.69E-OS 150KHD 1.77E-07 4.40E-OS
75K 1l0N SAND UNCERTAINTY J 3 DAY 1.25E-OS 1.93E-OS 1.22E-07 3.88E-08 3DAYDUP O.OOE+OO O.OOE+OO O.OOE+OO O.OOE+OO 7 DAY S.OSE-i0 2.10E-10 i.22E-07 3.7iE-OS 7DAYDUP O.OOE+OO O.OOE+OO O.OOE+OO O.OOE+OO 14 DAY 7.94E-10 2.55E-OS 1.23E-07 3.94E-OS
DAY gOFSAND DAY g SOLUTEIg SAND 3 DAY 10.0014 3 DAY 1.22E-OS 7 DAY 10.0011 3DAYDU 0 14 DAY 10.0013 7 DAY 1.22E-OS
7DAYDU 0 14 DAY 1.23E-Oa
DAY g OF SOLUTElml g IN SOL UNCERTAINTY KD RATIO (mUg) I 3 DAY 3.12E-11 1.25E-09 1.93E-09 391.45S 3DAYDU 0 O.OOE+OO O.OOE+OO #CIV/OI 7 DAY 2.27E-1i 9.0SE-i0 2.1 OE .. 1 0 539.6727 7DAYDU 0 O.OOE+OO O.OOE+OO #CIV/OI 14 DAY 1.99E-11 7.94E-10 2. 55E-09 617.3474
CALCULATED BY~A~ ___ DATE $/1,19s= CHECKED BY C7lr:: DATE (", ... 7~ APPROVED BY e;: DATE f, -c ~Cjo
Meeting The Analytical Challenges Of A Changing World

I I I I I I I I I I I I I I. I I I I I
,....,. ..... -, LABORATORIES INC 1SOOO W. 8TH NE... SUITE 300 GOLDEN, co 8040t (301) 277-1887 FI\X (308)°277-1-
DISTRIBUTION RATIOS
RADIONUCLlDE_ NP 237 PROPOSED ACTIVIT 150000 pCUI ACTUAL ACTIVITY 3135 pClD
(AFTER CONTACT EQUILIBRIUM)
ANALYSIS PERIOD_ 4124/95 - 5/8/95 ANALYST PRESTON . CALCU~TED BY ~ DATE~ . CHECKEOBY ~ DATE~. APPROVED BY DATE (£ -" .. ,r
NP 237 I HEAD SAMPLE Ig IN SOL IUNCERTAINTY 150K I I 1.77E-071 4.40E-OSI
DAY OF SAND 3 DAY 10.0022 7 DAY 10.0034 14 DAY 10.003
9 DAY IglNSOL UNCERTAINTY ON SAND 3 DAY 4.71E-09 3.46E-09 1.73E-07 7 DAY 1.S9E-09 2.04E-09 1.76E-07 7DAYDU O.OOE+OO 1.93E-09 1 ... ne-07 14 DAY 1.S7E-09 2.33E-09 1.7SE-07 14 DAYD 1.25E-09 2.16E-09 1.76E-07
DAY Ig SOLUTElml ig SOLUTElg SAND 3 DAY 1.1SE-10 1.73E-08 7 DAY 3.97E-11 1.76E-08 7DAYDU O.OOE+OO 1.77E-OS 14 DAY 4.6SE-11 1.75E-08 14 DAYD 3.12E-11 1.76E-08
I
UNCERTAINTY 4. 74E-OS 4.60E-OS . 4.S9E-OS 4.63E-08 4.61E-OS
KDRATIO I (mllg) 146.57 442.17 ERR
374.73 564.1
I
I
Meeting The Analytical ChIlllenges Of A Changing World
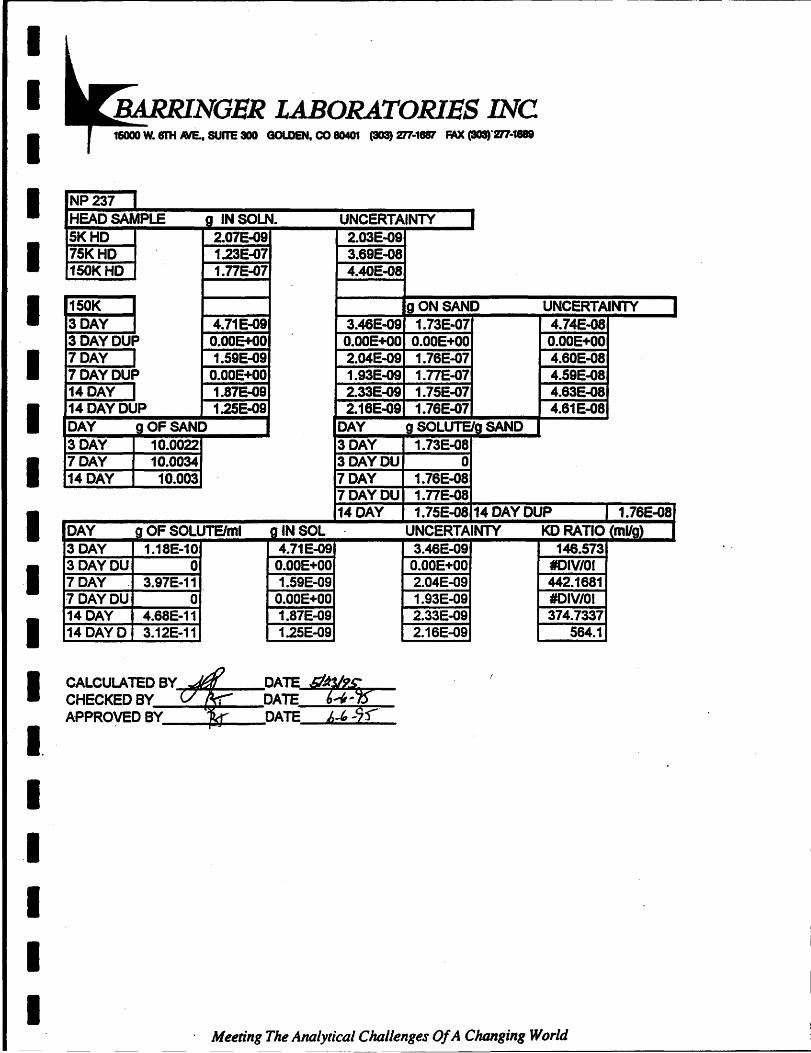
I I I I I I I I I I I I I I I I I I I
LABORATORIES INC 1&000 W. 8TH NE.. SUITE 300 GOLDEN. CO 80401 (303) 277-1887 FAX (308)'277-1-
NP237 HEAOSAMPLE g IN SOLN. UNCERTAINTY 5KHD 2.07E-09 2.03E-09 75KHD 1.23E-07 3.69E-08 150KHD 1.77E-07 4.40E-08
150K gONSAND UNCERTAINTY 3 DAY 4.71E-09 3.46E-09 1.73E-07 4.74E-08 3DAYDUP O.OOE+OO O.OOE+OO O.OOE+OO O.OOE+OO 7 DAY 1.59E-09 2.04E-09 1.76E-07 4.60E-08 7DAYDUP O.OOE+OO 1.93E-09 1.nE-07 4.59E-08 14 DAY 1.87&09 2.33E-09 1.75E-07 4.63E-08 14DAYDUP 1.25E-09 2.16E-09 1.76E-07 4.61E-08 DAY gOFSAND DAY g SOLUTElg SAND 3 DAY 10.0022 3 DAY 1.73E-OS 7 DAY 10.0034 3DAYDU 0 14 DAY 10.003 7 DAY 1.76E-OS
7DAYDU 1.nE-OS 14 DAY 1.75E-08 14DAYDUP 1.76E-08
DAY g OF SOLUTElml glNSOL UNCERTAINTY KD RATIO (mllg) 3 DAY 1.1SE-10 4.71E-09 3.46E-09 146.573 3DAYDU 0 O.OOE+OO O.OOE+OO #CIV/OI 7 DAY 3.97E-11 1.59E-09 2.04E-09 442.16S1 7DAYDU 0 O.OOE+OO 1.93E-09 #DIV/OI 14 DAY 4.68E-11 1.87E-09 2.33E-09 374.7337 14 DAY 0 3.12E-11 1.25E-09 2.16E-09 564.1
CALCULATED BY~~_~DATE d.41If-%? CHECKED BY DATE ~~ 0
APPROVED BY DATE A-' --9)
Meeting The Analytical Challenges Of A ChDnging World
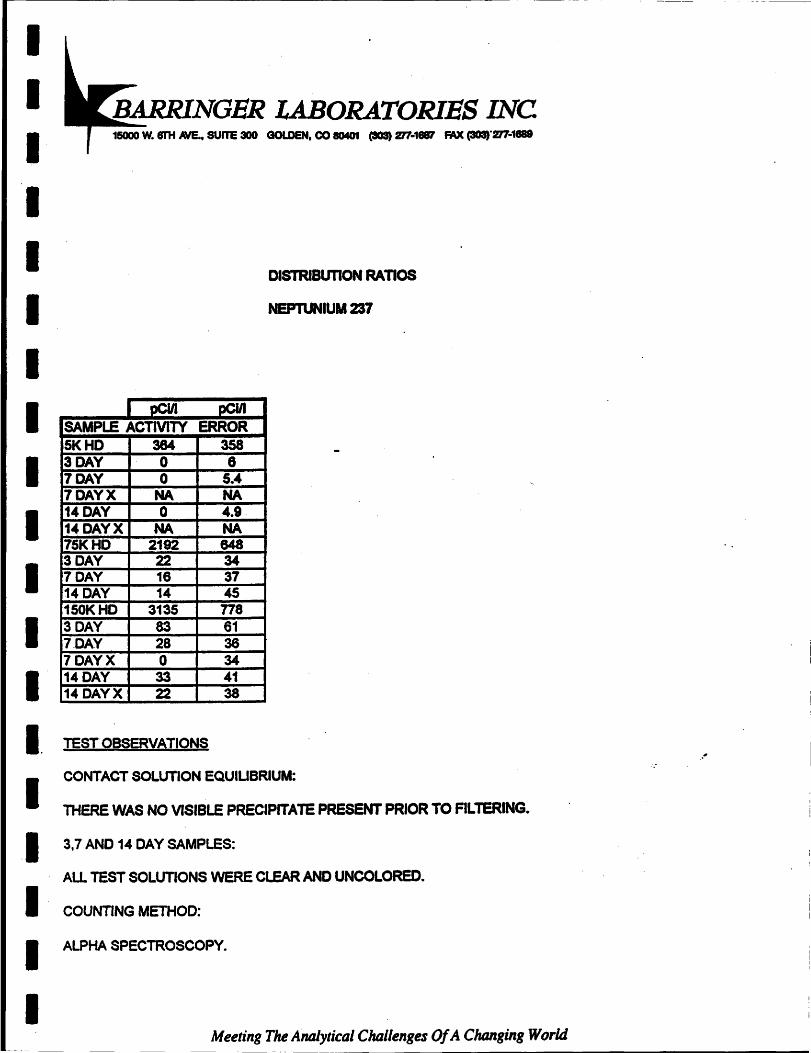
I 1 I I I I 1 I 1 1 1 I I
LABORATORIES INC 16000 W. 8TH NE., SUITE 300 GOLDEN, CO 80401 (303) ZT7-18f11 FAX (303)°277-1889
pCUI SAMPLE ACTIVITY 5KHD 384 3 DAY 0 7 DAY 0 7 DAY X NA 14 DAY 0 14 DAY X NA 75KHD 2192 3 DAY 22 7 DAY 16 14 DAY 14 150KHD 3135 3 DAY 83 7-DAY 28 7 DAY X 0 14 DAY 33 14 DAY X 22
pCUI ERROR
358 8
5.4 NA 4.9. NA 848 34 37 45 n8 61 36 34 41 38
DISTRIBUTION RATIOS
NEPTUNIUM 237
I. TEST OBSERVATIONS
I . 1 I I I
CONTACT SOLUTION EQUILIBRIUM:
THERE WAS NO VISIBLE PRECIPITATE PRESENT PRIOR TO FILTERING •
3.7 AND 14 DAY SAMPLES:
ALL TEST SOLUTIONS WERE CLEAR AND UNCOLORED.
COUNTING METHOD:
ALPHA SPECTROSCOPY.
Meeting The AlIfllytical Challenges Of A Changing World
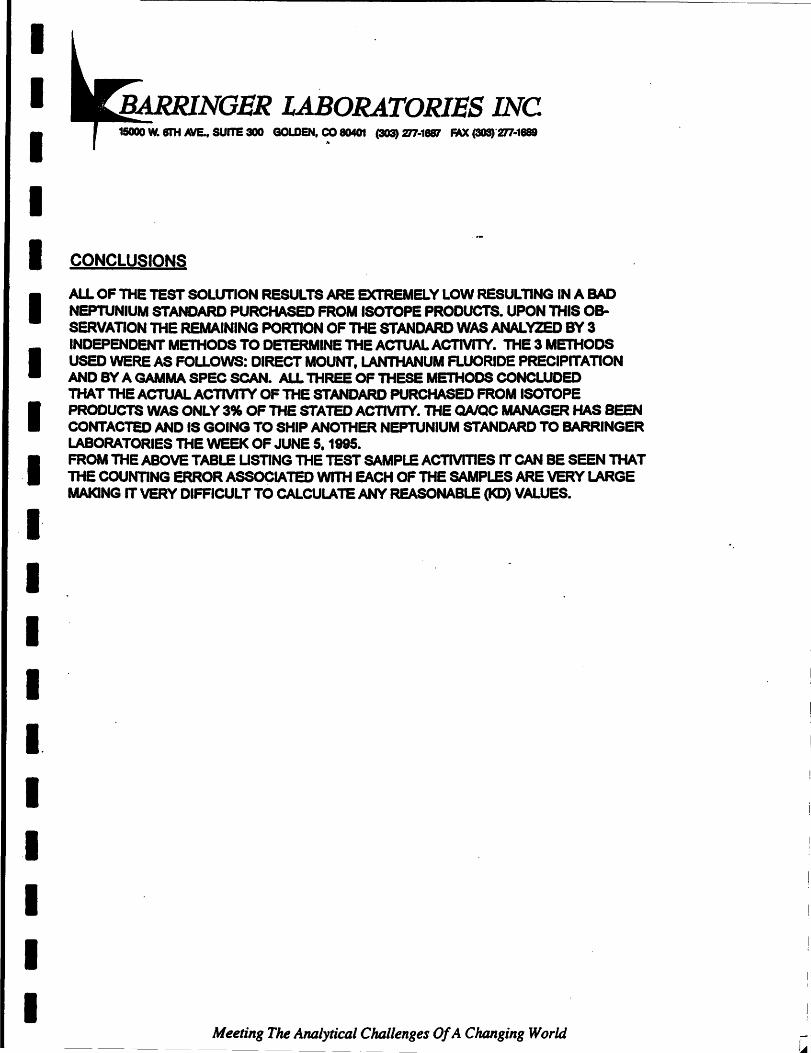
I I I I I I I I I I I I I I. I .1 I I I
LABORATORIES INC 15000 W. 8I'H INE.. SUITE 300 GOLDEN. CO 80401 (303) m-18111 MX (303)'m-1889
.~
CONCLUSIONS
ALL OF THE TEST SOLUTION RESULTS ARE EXTREMELY LOW RESULTING IN A BAD NEPTUNIUM STANDARD PURCHASED FROM ISOTOPE PRODUCTS. UPON THIS OBSERVATION THE REMAINING PORTION OF THE STANDARD WAS ANALVZED BY 3 INDEPENDENT METHODS TO DETERMINE THE ACTUAL ACTIVI1Y. THE 3 METHODS USED WERE AS FOLLOWS: DIRECT MOUNT. LANTHANUM FLUORIDE PRECIPITAnON AND BY A GAMMA SPEC SCAN. ALL THREE OF THESE METHODS CONCLUDED THAT THE ACTUAL ACnvrrv OF THE STANDARD PURCHASED FROM ISOTOPE PRODUCTS WAS ONLY 39ft OF THE STATED AC"nVITY. THE QA/QC MANAGER HAS BEEN CONTACTED AND IS GOING TO SHIP ANOTHER NEPTUNIUM STANDARD TO BARRINGER LABORATORIES THE WEEK OF JUNE 5, 1895. FROM THE ABOVE TABLE USTING THE TEST SAMPLE ACnvITIES IT CAN BE SEEN mAT THE COUNTING ERROR ASSOCIATED WITH EACH OF THE SAMPLES ARE VERY LARGE MAKING IT VERY DIFFICULT TO CALCULATE ANY REASONABLE (1<0) VALUES.
Meeting The ATUllytical Challenges Of A Changing World

I I I I I I I I I I I I I II I" I I I
\
"""" ..... -" LABORATORIES INC 15000 W. SJ'H ME.. SUITE 300 GOLDEN. CO 8040'1 (303) 277-1887 FAX (303)·277-1.
DISTRIBUTION RATIOS
RADIONUCLlOE_ C 14 PROPOSED ACTIVIT 10000 pCID ACTUAL ACTIVITY_ 10304 pClII
(AFTER CONTACT EQUIUBRIUM)
ANALYSIS PERIOD_ 4121/95 - 5/5195 ANALYST PRESTON
CALCULATED BY r!!1 DATE ~ CHECKED BY ~ DATE t,-S'Jf5 APPROVED BY 7tc:- DATE f Ie ... '1r
C14 I HEAD SAMPLE IglNSOL UNCERTAINTY 10K I 9.24E-11 2.89E-12I
DAY OF SAND 3 DAY 10.0009 7 DAY 10.0013 14 DAY 10.0023
g DAY IglNSOL UNCERTAINTY ON SAND 3 DAY 2.04E-11 2.47E-12 7.20E-11 7 DAY 2.S6E-11 2.69E-12 6.68E .. 11 7DAYDU NA NA NA 14 DAY 2.S8E-11 2.69E-12 6.66E-11 14 DAYD NA NA NA
DAY Ig SOLUTElml Ig SOLUTEIg SAND 3 DAY S.10E-13 7.20E-12 7 DAY 6.39E-13 6.68E-12 70AYOU NA NA 14 DAY 6.4SE-13 6.66E-12 14 DAY D NA NA
I
UNCERTAINTY 5.16E-12 5.38E-1-2
NA 5.38E-12
NA
KDRATIO i(mUg) 14.11 10.46 NA
10.33 NA
I
I
\
'-
--------
I Meeting The Analytical Challenges Of A Chtmging World _____________________________ ..... C
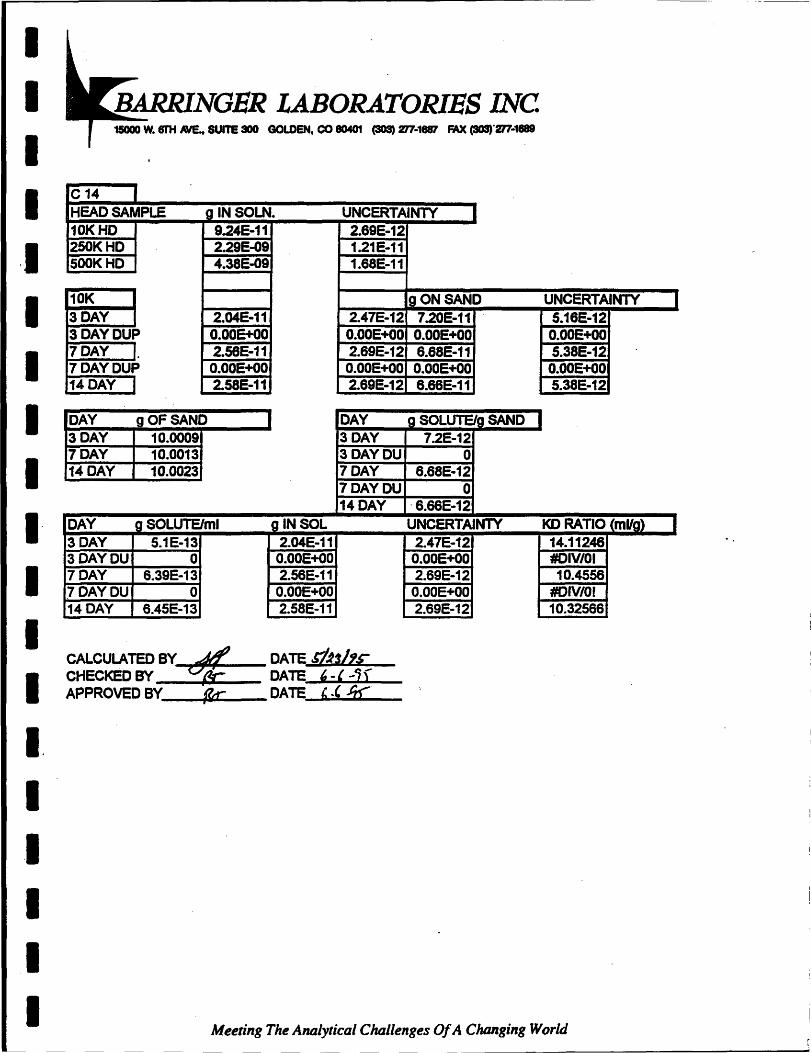
-----------------------------
I I I I I I I I I I I I I I. I I I I I
LABORATORIES INC 15000 W. snt INE.. SUITE 300 GOLDEN, CO 80401 (303) 277-1887 IWC (303)'277-1-
C 14 HEAD SAMPLE giN SOLN. UNCERTAINTY I 10KHD 9.24E-11 2.69E-12 250KHD 2.29E-09 1.21E-11 500KHD 4.38E-09 1.68E-11
10K _g_ONSAND UNCERTAINTY 3 DAY 2.04E-11 2.47E-12 7.20E-11 5.16E-12 3DAYDUP O.OOE+OO O.OOE+OO O.OOE+OO O.OOE+OO 7 DAY 2.56E-11 2.69E-12 6.68E-11 5.38E-12 7DAYDUP O.OOE+OO O.OOE+OO O.OOE+OO O.OOE+OO 14 DAY 2.58E-11 2.69E-12 8.68E-11 5.38E-12
DAY gOFSAND DAY g SOLUTEIg SAND 3 DAY 10.0009 3 DAY 7.2E-12 7 DAY 10.0013 3DAYDU 0 14 DAY 10.0023 7 DAY 6.68E-12
7DAYDU 0 14 DAY , 6.66E-12
DAY g SOLUTElml glNSOL UNCERTAINTY KD RATIO (mUg) 3 DAY 5.1E-13 2.04E-11 2.47E-12 14.11248 3DAYDU 0 O.OOE+OO O.OOE+OO #DIV/OI 7 DAY 6.39E-13 2.58E-11 2.69E-12 10.4556 7DAYDU 0 O.OOE+OO O.OOE+OO #Dlv/or 14 DAY 6.45E-13 2.58E-11 2.69E-12 10.32566
CALCULATED BY--,.i~""' __ DATE .rhsltc CHECKEDBY ~ DATE ,-, -" APPROVED BY Ik" DATE'.' .t;c"
Meeting The Analytical Challenges Of A Changing World
I
I

I I I I I I I I I I I I I I. I .1 I I I
"""' .......... LABORATORIBS INC 1SOOO W. mt ME.. SUITE 300 GOLDEN, CO 80401 (103) 277-1887 FAX (303)'277-1-
DISTRIBUTION RATIOS
RADIONUCLlDE_ C 14 PROPOSED ACTIVIT 250000 pClD ACTUAL ACTIVITY _ 254910 pCl/I,
(AFTER CONTACT EQUIUBRIUM)
ANALYSIS PERIOD_ 4121/95 - 5/5/95 ANALYST PRESTON
CALCUlATED BY ""iff!!:. DATEd!t/tr CHECKED BY ~ DATE ' .. '5:r APPROVED BY fV:= DATE ,-'-~
C14 I HEAD SAMPLE IglN SOL UNCERTAINTY 250K I 2.29E-09 1.21E-11I
DAY OF SAND 3·DAY 10.0027 7 DAY 10.0019 14 DAY 10.0024
g DAY IglNSOL UNCERTAINTY ON SAND 3 DAY 5.39E-l0 5.83E-12 1.75E-09 7 DAY 7.59E-10 6.95E-12 1.53E-09 7DAYDU NA NA NA 14 DAY 7.64E-10 6.95E-12 1.52E-09 14 DAY 0 NA NA NA
DAY Ig SOLUTElml Ig SOLUTEIg SAND 3 DAY 1.35E-l1 1.75E-l0 7 DAY 1.90E-l1 1.53E-l0 7DAYDU NA NA 14 DAY 1.91E-11 1.52E-10 14·DAYD NA NA
I
UNCERTAINTY 1.79E-11 1.91E-11
NA 1.91E-11
NA
KDRATIO I (mllg) 12.95 8.05 NA
7.97 NA
I
I
Meeting The Analytical Challenges Of A Clumging World

------------------------------~
I I I I I I I I I I· I I I I
.1
I I I I
LABORATORIES INC 15000 W. 8TH ME.. SUITE 300 GOLDEN. CO 80401 (303) m·16f11 IW( (303)"m·1888
C 14 HEAD SAMPLE giN SOLN. UNCERTAINTY 10KHD 9.24E-11 2.69E-12 2S0KHD 2.29E-09 1.21E·11 SOOKHD 4.38E-09 1.68E-11
250K Ig ON SAND UNCERTAINTY 3 DAY S.39E-10 5.83E·12 1.75E-09 1.79E-11 3DAYDUP O.OOE+OO O.OOE+OO O.OOE+OO O.OOE+OO 7 DAY 7.59E-10 6.95E·12 1.53E-09 1.91E-11 7DAYDUP O.OOE+OO O.OOE+OO O.OOE+OO O.OOE+OO 14 DAY 7.64E-10 6.95E-12 1.52E-09 1.91E-11
DAY gOFSAND DAY g SOlUTElg SAND 3 DAY 10.0027 3 DAY 1.7SE-10 7 DAY 10.0019 3DAYDU 0 14 DAY 10.0024 7 DAY 1.53E-10
7DAYDU 0 14 DAY 1.S2E-10
DAY g SOLUTElml glNSOl UNCERTAINTY KD RATIO (mllg) 3 DAY 1.3SE-11 S.39E-10 2.47E-12 12.95496 3DAYDU 0 O.OOE+OO O.OOE+OO #DIV/Of 7 DAY 1.9E-11 7.S9E-10 2.69E-12 8.045902 .7DAYDU 0 O.OOE+OO O.OOE+OO #DIV/OI 14 DAY 1.91E-11 7.ME-10 2.69E-12 7.968241
CALCULATED BY....,....".~~_ DATE S/l~/~ CHECKEOBY DATE ,,~. APPROVED BY DATE Lt-'-s ".04.4
Meeting The Analytical Challenges Of A Changing World
I
I

I I I I I I I I I I I 'I I I. I ·1 I I I
BARRINQER LABORATORIES INC 16000 W. 6rH ME., SUITE 300 GOLDEN, CO 80401 (303) :t17-1881 fi'X (303)°2'17-1-
DISTRIBUTION RATIOS
RADIONUCUDE_ ~ PROPOSED ACTIVIT 500000pCi/I ACTUAL ACTIVITY _ 488872 PCW· .
(AFTER CONTACT EQUIUBRIUM)
ANALYSIS PERIOD_ 4121/95 - 5/5/95 ANALYST PRESTON CALCULATED BY Jt. DATE g~ CHECKEDBY &7~ DATE ,~ APPROVED BY _ DATE b=i -'1Cr
C14 I HEAD SAMPLE 10 IN SOL UNCERTAINTY SOOK I 4.38E-Q9 1.68E-11 I
DAY OF SAND 3 DAY 10.0023 7 DAY 10.0009 14 DAY 10.0015
g DAY 10 IN SOL UNCERTAINTY ON SAND 3 DAY 1.34E-09 9.19E-12 3.04E~9
7 DAY 1.41E-09 9.42E-09 2.98E-09-7DAYDU NA NA NA 14 DAY 1.48E-09 2.91E-09 2.91E-09 14 DAY D NA NA NA
DAY 10 SOLUTElml Ig SOLUTElg SAND 3 DAY 3.36E .. 11 3.04E .. 10 7 DAY 3.52E-11 2.98E .. 10 7 DAYDU NA NA 14 DAY 3.70E .. 11 2.90E-10 14 DAY 0 NA NA
I
UNCERTAINlY 2~60E-11
9.43E-09-NA
1.49E-09 NA
KDRATIO I (mUg) 9.06 8.46 NA
7.86 NA
1
I
Meeting The Analytical Challenges Of A Changing World
- ----------------------------------------------
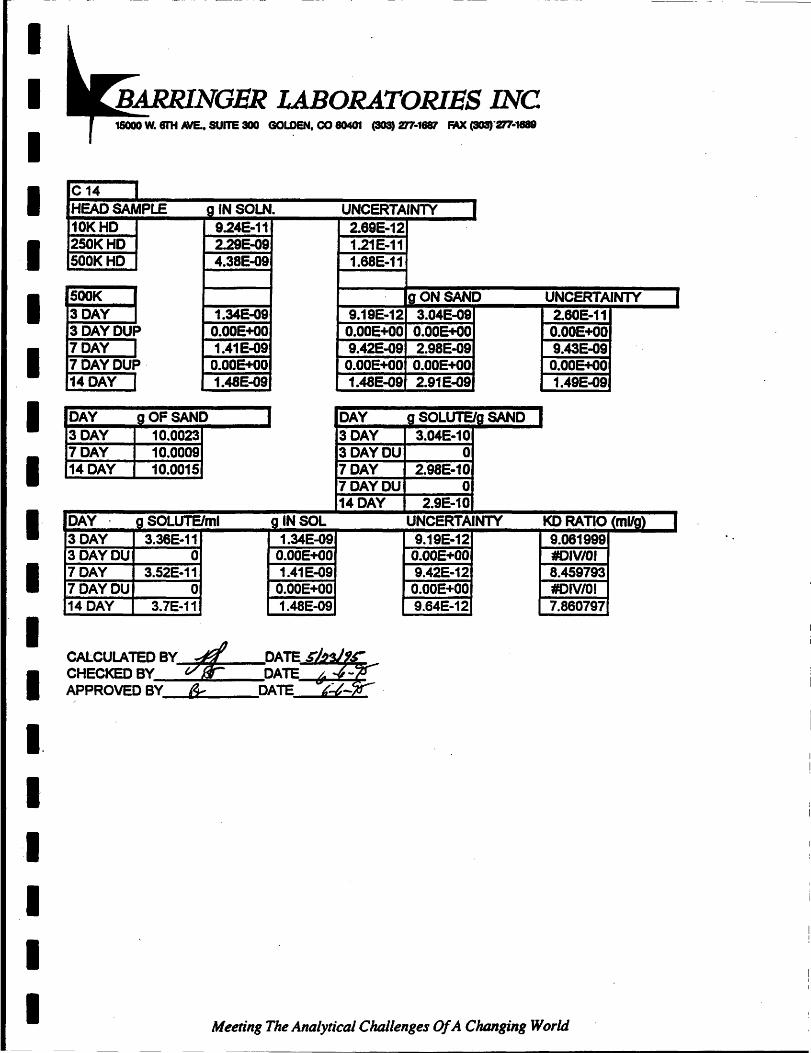
I I I I I I I I I I· I I I
I" I .1 I I I
BARRINGER LABORATORIES INC 15000 W. 6TH NE.. SUITE 300 GOLDEN. co 80401 (303) 217-1_ FAX (308)"217-1888
C14 HEAD SAMPLE giN SOLN. UNCERTAINTY 10KHD 9.24E-11 2.69E-12 2S0KHD 2.29E-09 1.21E-11 500KHD 4.38E-09 1.68E-11
SOOK Ig ON SAND UNCERTAINTY I 3 DAY 1.34E-Oa 9.19E-12 3.04E-09 2.60E-11 3DAYDUP O.OOE+OO O.OOE+OO O.OOE+OO O.OOE+OO 7 DAY 1.41E-09 9.42E-OS 2.98E-09 9.43E-09 7 DAYDUp· O.OOE+OO O.OOE+OO O.OOE+OO O.OOE+OO 14 DAY 1.48E-oS 1.48E-OS . 2.91E-09 1.4SE-OS
DAY gOFSAND DAY g SOLUTEIg SAND 3 DAY 10.0023 3 DAY 3.04E-10 7 DAY 10.0009 3DAYDU 0 14 DAY 10.0015 7 DAY 2.98E-10
7DAYDU 0 14 DAY 2.9E-10
DAY " g SOLUTElml glNSOL UNCERTAINTY KD RATIO (mllg) I 3 DAY 3.36E-11 1.34E-OS 9.19E-12 9.061S99 3DAYDU 0 O.OOE+OO O.OOE+OO #DIV/Of 7 DAY 3.52E-11 1.41E-09 9.42E-12 8.459793 .7DAYDU 0 O.OOE+OO O.OOE+OO #DIV/OI 14 DAY 3.7E-11 1.48E-09 9.64E-12 7.860797
~~~~BY 4' :~ r~1t APPROVED BY_ ... & ...... __ D.ATE . - .
Meeting The Analytical Challenges Of A Changing World
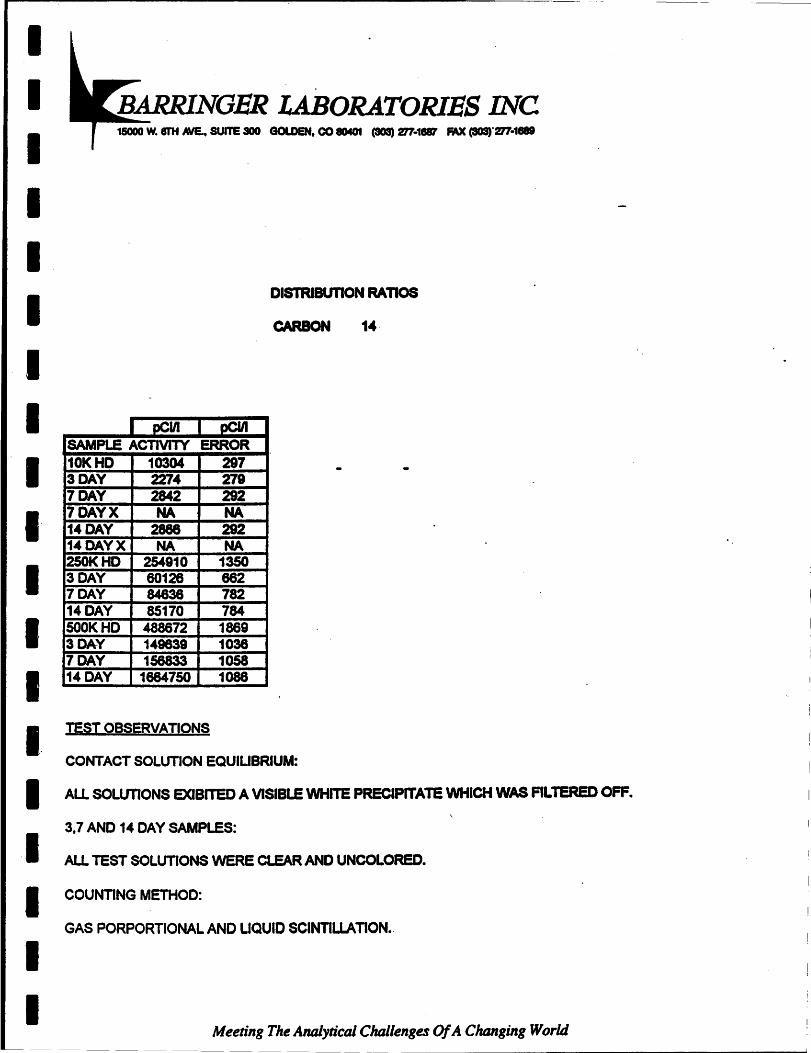
r--------------~------------ .. -
I I I I I I I I I I I I I I. I ·1 I I I
LABORATORIBS INC 15000 W. 8T'H AVE., SUITE 300 GOLDEN, CO 8040'1 (303) %17-18111 FAX (303)"%17-1-
DISTRIBUTION RAnos
CARBON 14·
pClII pCUI
SAMPLE ACTIVITY ERROR 10KHD 10304 297 3 DAY 2274 278 7 DAY 2842 292 7 DAY X NA NA 14 DAY 2888 282 14 DAY X NA NA 250KHD 254810 1350 3 DAY 60126 662 7 DAY 84838 782 14 DAY 85170 784 SOOKHD 488672 1869 3DA-Y 149638 1038 7 DAY 158833 1058 14 DAY 1684750 1088
TEST OBSERVATIONS
CONTACT SOLUTION EQUILIBRIUM:
ALL SOLUTIONS EXlBITED A VISIBLE WHITE PRECIPITATE WHICH WAS FILTERED OFF.
3,7 AND 14 DAY SAMPLES:
ALL TEST SOLUTIONS WERE CLEAR AND UNCOLORED.
COUNTING METHOD:
GAS PORPORTIONALAND LIQUID SCINTILLATION •.
Meeting The Analytical Challenges Of A Changing World
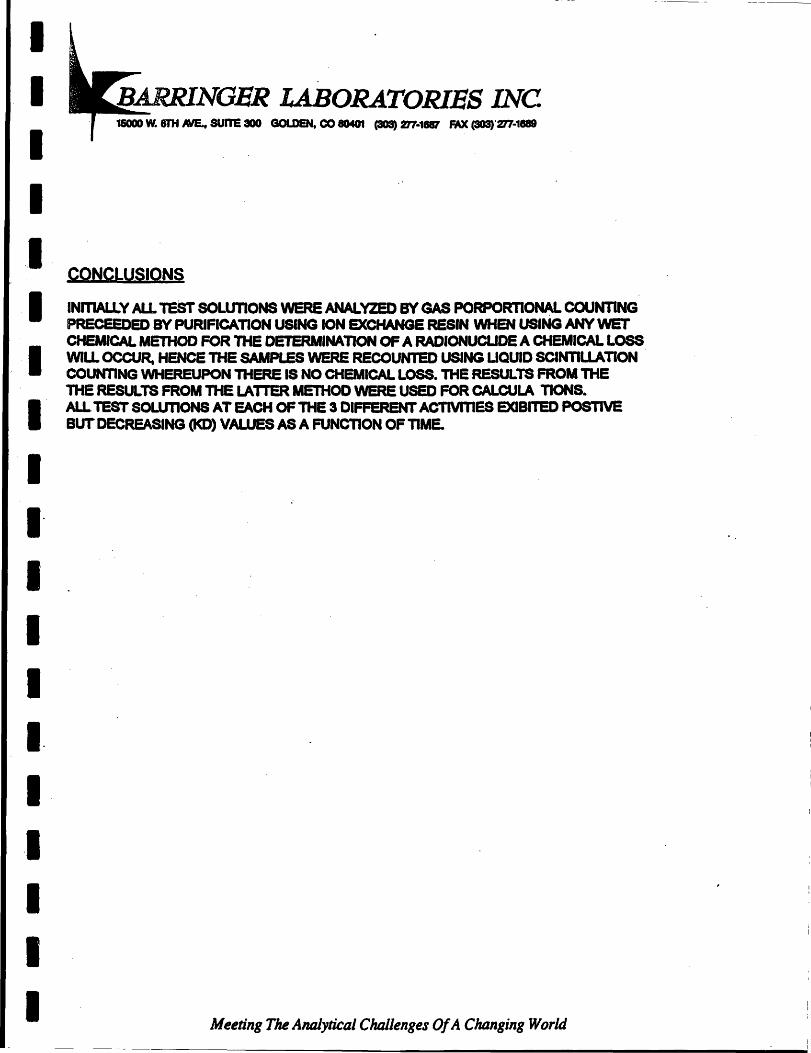
I I I I I I I I I I' I I
• I. I
•• I I I
LABORATORIES INC 1&000 W. 8J'H ME.. SUITE 300 GOLDEN, co 80401 (303) 277-1887 MX (303)'277-1888
CONCLUSIONS
INITIALlY ALL TEST SOLunONS WERE ANALVZED BY GAS PORPORTIONAL COUNTING PRECEEDED BY PURIFICATION USING ION EXCHANGE RESIN WHEN USING ANY WET CHEMICAL METHOD FOR THE DETERMINAnON OF A RADIONUCUDe A CHEMICAL LOSS WILL OCCUR. HENCE THE SAMPLES WERE RECOUNTED USING UQUID SCINTIUAnON . COUNTING WHEREUPON THERE IS NO CHEMICAL LOSS. THE RESULTS FROM THE THE RESULTS FROM THE LATTER METHOD WERE USED FOR CALCULA TlONS. ALL TEST SOLUTIONS AT EACH OF THE 3 DIFFERENT ACTMTIES EXlBITED POSTIVE BUT DECREASING (1<0) VALUES AS A FUNCTION OF TIME.
Meeting The Analytical Challenges Of A Changing World
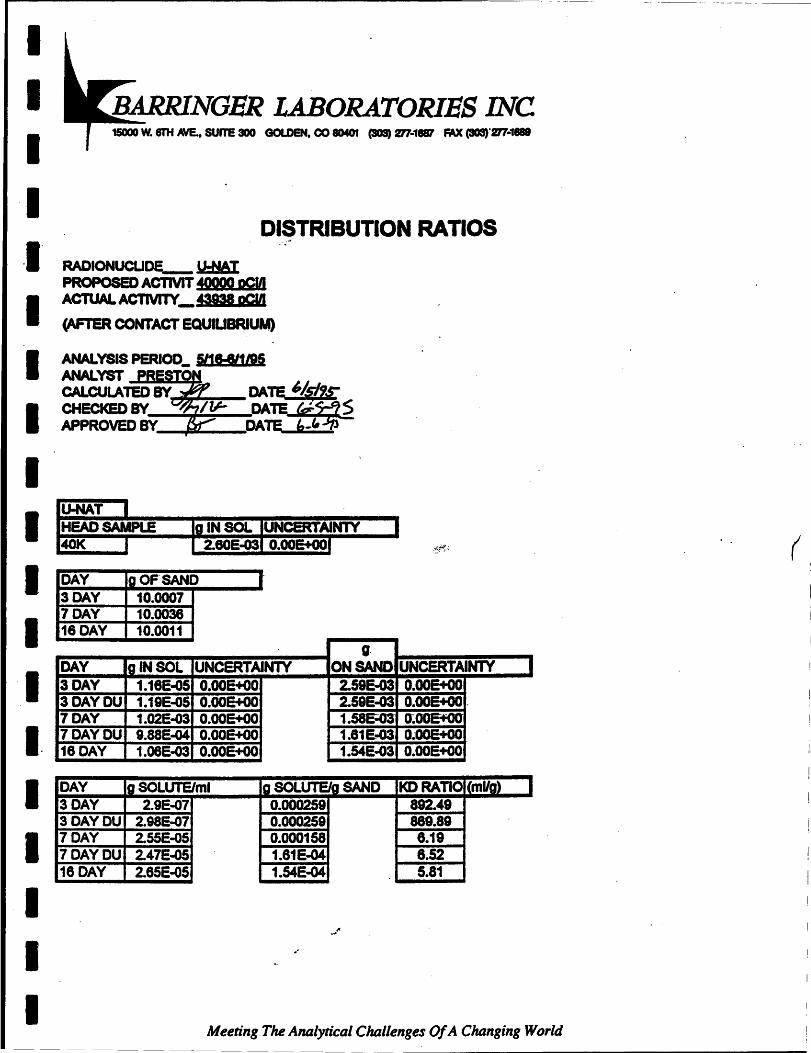
------------------------ - --.-.
I I I
LABORATORIES INC 15000 W. 8TH AVE.. SUITE 300 GOLDEN. co 80401 (3OS) m-11fl1 IWC (303)'m-1-
I DISTRIBUTION RATIOS
·1 RADIONUCUDIL- !J.NAT PROPOSED Acnvrr 40QQQ pCID
I ACTUAL Acnvrrv_ 43Q38 pCIII
(AFTER CONTACT EQUIUBRlUM)
I I I I
ANALYSIS PERIOD_ 5118:811195 ANALYST 0 CALCULATED BY~~~DATE 'tl9s-CHECKED BY DATE <eZ1S APPROVED BY DATE k-Pfl
lJ.NAT I HEAD SAMPLE lalNSOL I UNCERTAINlY 40K I 2.80E-G31 O.OOE+OOI
I
I DAY 3 DAY
OF' SAND 10.0007
7 DAY I 18 DAY
I I. I I I I I
DAY 3 DAY 3 DAY DU 7 DAY 7DAYDU 18 DAY
DAY 3 DAY 3DAYDU 7 DAY 7DAYOU 18 DAY
10.0038 10.0011
G· a IN SOL UNCERTAINTY ON lAND
1.18E..(JS O.OOE+OO 2.59E-G3 1.19E..(JS O.OOE+OO 2.59E-G3 1.02E..(J3 O.OOE+OO 1.58C-03 9.88E.Q4 O.OOE+OO 1.81E..Q3 1.06E-03 O.OOE+OO 1.54E-G3
Ig SOLUTE/m. Ig SOLUTEIg SAND 2.9E-G7 0.000259
2.98E..o7 0.000259 2.55E-05 0.000158 2.47E-05 1.81E-04 2.85E..(J5 1.54E.()4
.. i'
.'
UNCERTAINTY O.OOE+OO O.OOE+OO . 0: ___ 0 ••
CLOOE+OO O.OOE+OO
KDRATIO I (mUg) 892.49 889.89 8.19 8.52 5.81
J
I
Meeting The Analytical ChIllienges Of A Chilnging World
_ .. __ .... _-------
(
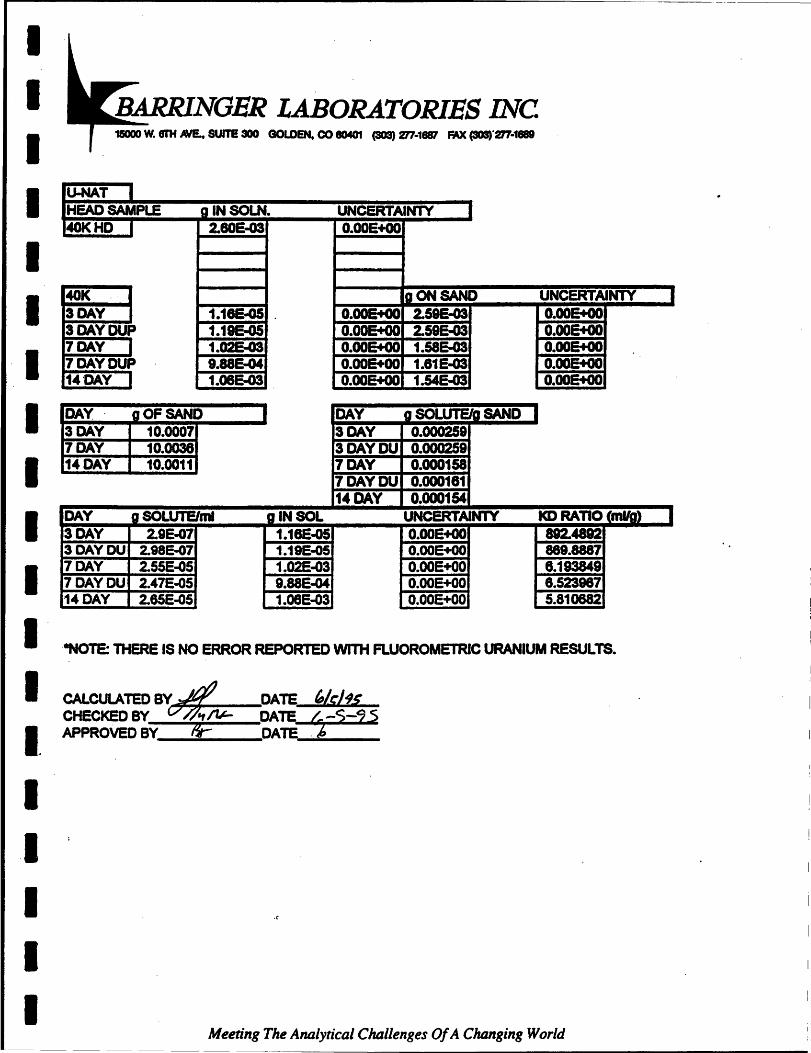
I I I I I I I I I I I 1 I
LABORATORIES INC 1&000 w. 8I'H AVE.. SUITE 300 GOLDEN. co 80401 (303) %17-18111 FAX (303'-%17-1-
U-NAT I HEAD SAMPLE g INSOLN. UNCERTAINTY 40KHD I 2.80E-03 O.OOE+OO
40K . I laONSAND UNCERTAINTY 3 DAY I 1.18E-OS O.OOE+OO 2.S8E-03 O.OOE+OO 3DAYDUP 1.18E-05 O.OOE+OO 2.58E-03 O.OOE+OO 7 DAY I i.02E-03 O.OOE+OO 1.58E-03 O.OOE+OO 7DAYDUP 9.8815-04 O.OOE+OO 1.81E.(J3 O.OOE+OO i4·DAY I i.08E.Q3 O.OOE+OO i.54E.Q3 O.OOE+OO
DAY gOFSAND I DAY g SOLUTElg SAND J 3 DAY 10.0007 3 DAY 0.000258 7 DAY 10.0038 3DAYDU 0.000258 14 DAY 10.0011 7 DAY 0.000158
7DAYDU 0.000181 14 DAY 0.000154
DAY gSOLUTElml g IN SOL UNCERTAINlY KD RAnO (mUg)
3 DAY 2.8E-07 1.18E.(JS O.OOE+OO 882.4892 3DAYDU 2.98E-G7 1.19E-GS O.OOE+OO 889.8887 7 DAY 2.55E~5 1.02E.Q3 O.OOE+OO 8.193849 7DAYDU 2.47E~5 9.88E..Q4 O.OOE+OO 8.523987 ·14 DAY 2.85E~5 1.oeE~3 O.OOE+OO 5.810682
-NOTE: THERE IS NO ERROR REPORTED WITH FLUOROMETRIC URANIUM RESULTS.
CALCULATED BY ~ CHECKED BY ~11-'-
I
I
I. APPROVED BY IF
DATE "{I'9$ DATE ~ -5-:Z 5 DATE~~% ___ _
I I I I I
Meeting The Analytical Challenges Of A Changing World - ----------------------------
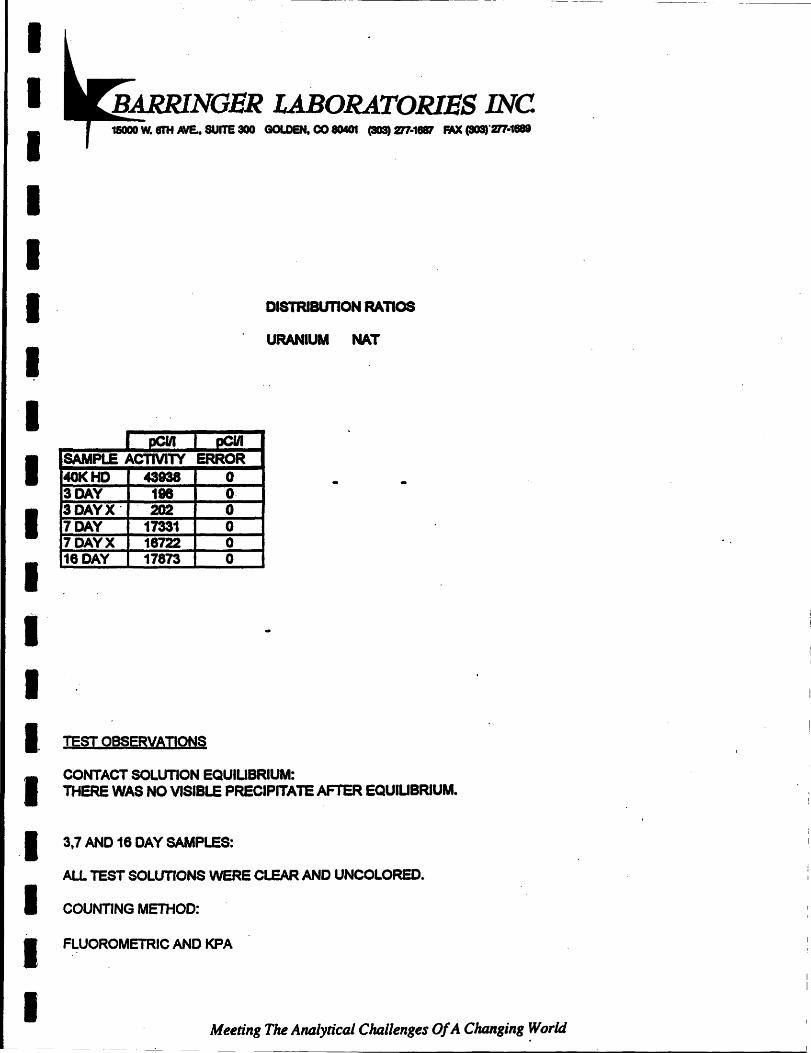
I I I I I I I I I I I I I I. I
•• • I I
LABORATORIES INC 15000 w. 81'H ME... SUITE 300 GOLDEN. co 8040t (303) m·18f11 FAX (308)'217-1-
DISTRIBUTION RAnos
URANIUM NAT
I pCUI oCUi SAMPLE ACTIVITY ERROR 40KHD 43938 0 3 DAY 198 0: 3 DAY X . 202 0 7 DAY 17331 0 7 DAY X 18722 0 16 DAY 17873 0
TEST OBSERVATIONS
CONTACT SOLUTION EQUIUBRIUM: THERE WAS NO VISIBLE PRECIPITATE AFTER EQUIUBRIUM •
3.7 AND 16 DAY SAMPLES:
ALL TEST SOLUTIONS WERE CLEAR AND UNCOLORED •
COUNTING METHOD:
FLUOROMETRIC AND KPA
Meeting The Analytical Challenges Of A Changing World
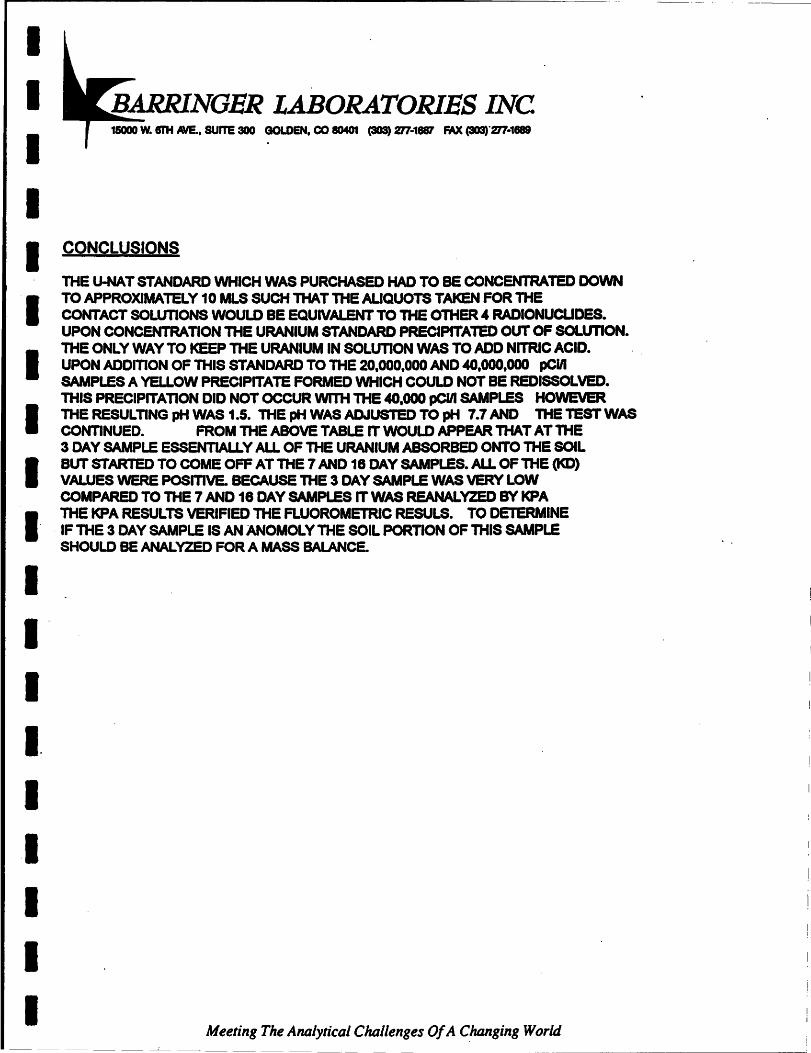
I I I I I I I
BARRINGER LABORATORIES INC 15000 W. SI'H ME.. SUITE 300 GOLDEN. CO 8040'1 (303) ZT7-18f11 FAX (303,-ZT7-1889
CONCLUSIONS
THE U-NAT STANDARD WHICH WAS PURCHASED HAD TO BE CONCENTRATED DOWN TO APPROXIMATELY 10 MLS SUCH THAT THE ALlQUOTS TAKEN FOR THE CONTACT SOLUTIONS WOULD BE EQUIVALENT TO THE OTHER 4 RADIONUCUDES. UPON CONCENTRATION THE URANIUM STANDARD PRECIPITATED OUT OF SOLUTION. THE ONLY WAY TO KEEP THE URANIUM IN SOLUTION WAS TO ADD NITRIC ACID. UPON ADDmON OF THIS STANDARD TO THE 20,000,000 AND 40,000,000 pClII SAMPLES A YELLOW PRECIPITATE FORMED WHICH COULD NOT BE REDISSOLVED. THIS PRECIPITATION DID NOT OCCUR WITH THE 40,000 pCIII SAMPLES HOWEVER
I THE RESULTING pH WAS 1.5. THE pH WASADJUSTEO TO pH 7.7AND THETESTWAS CONTINUED. FROM THE ABOVE TABLE IT WOULD APPEAR THAT AT THE 3 DAY SAMPLE ESSENTIALLY ALL OF THE URANIUM ABSORBED ONTO THE SOIL
I BUT STARTED TO COME OFF AT THE 7 AND 18 DAY SAMPLES. ALL OF THE (1<0) VALUES WERE POSITIVE. BECAUSE THE 3 DAY SAMPLE WAS VERY LOW COMPARED TO THE 7 AND 18 DAY SAMPLES IT WAS REANAL VZED BY KPA
I THE KPA RESULTS VERIFIED THE FLUOROMETRIC RESULS. TO DETERMINE " "IF THE 3 DAY SAMPLE IS AN ANOMOL Y THE SOIL PORTION OF ntiS SAMPLE
SHOULD BE ANAL VZED FOR A MASS BAlANCE.
I
." I I .
• I I I I
Meeting The Analytical Challenges Of A ~hanging World
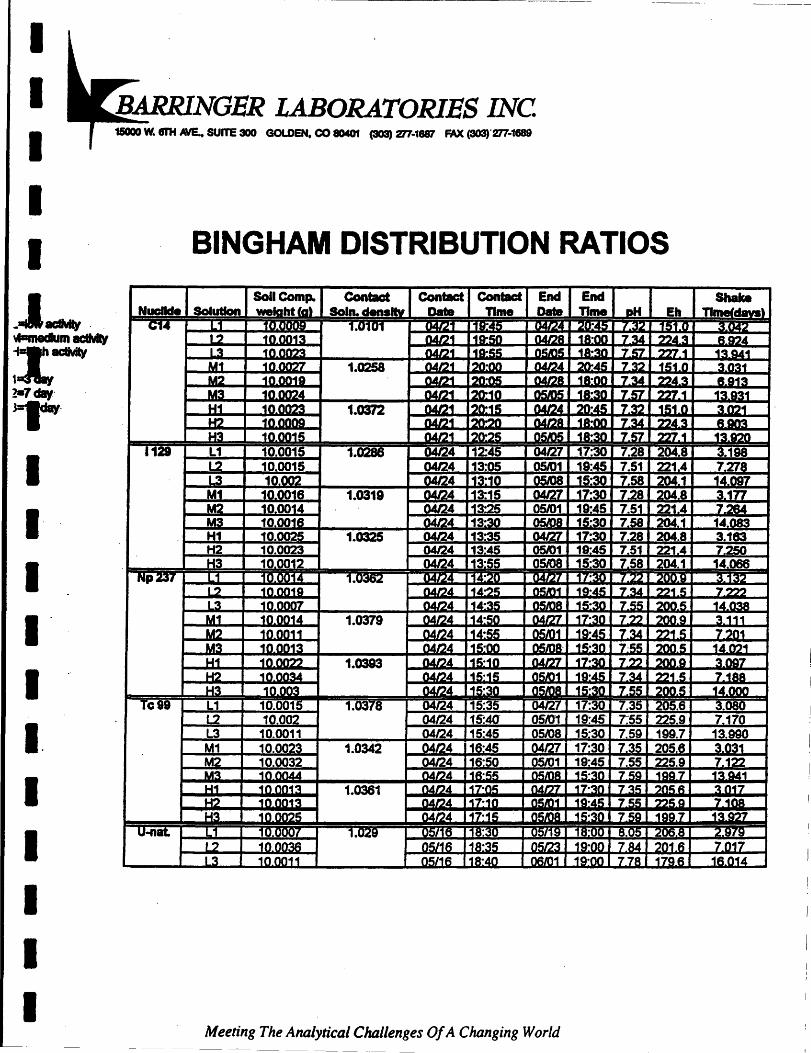
I I I I I
.JaaMr . \4IImecIum actMly XacMy '!a7*t,
J1-'
I I· I I I I. I I I I I
LABORATORIES INC GOLDEN. co 8040'1 (303) UT-18fR FAX (303)'277-1689
BINGHAM DISTRIBUTION RATIOS
Soil Comp. Contact Contact Contact End End Nuclide Solution wetaht~' Soln. densItY Data Time Data Time DH Eh
C;;14 L 1 ," r 1.U1Ul tJ4~r.; 1.32 1~1.0
-.2 _10," 04111 1'''~ 04111 itt! 1 ill • ,. 7.57 2'27.1
M1 10.00z 1.0258 04111 20:00 o.u:.:~4 • t:4! 7.~ 151.0 ~12 _10.0019 04111 120:05 04128 1. ~oo 7.34 224.3
05m5 ~3t7.51 227.1 1nn~ 1.0372 04121 120:15 04114 • J~4l 7.32 151.0
» 1nMna 04f11 120~
H: _10.0015 04121 • 20:25 05m5 18~~0 7.57 7II.1 1121 L 1 10.0015 1.0286 04124 12:45 04f1.7 17:30 7.28 204.8
U 100015 04f24 13:05 05101 19:45 7.51 2214 -: 10.002 • .,. 4 '13:10 05108 15:30 ' 58 .,. 1
M 10.00' 8 1.0319 04127 17:30 ~~28 • ~.8 M: 1000' 4 4 • 3:25 05101 19'45 .51 • 4 M~ 100018 ~4 13:30 05108 15:30 7.58 • .1 Hi 10.0025 1.0325 04f1.4 13:35 04fZI 17'30 7.28 204.8 H2 10.0023 04124 13"45 05J01 19"45 7 51 221 4 H3 1000.12 04124 13:55 05108 15:30 7.58 204.1
1.0362 04124 14:20 04127 17:30 7.22 200.9 04124 14~5 05101 19:45 7.!W 221.5
_3 10.0007 04114 14:35 OSJOSt ;:30 7.55 200.5 "1110.0014 1.0379 04124 14~' ().4 ~m 1 :~t 7.22. 200.9 YI2 10.0011 04124 1~" OHJ01 141'4! 7.34 221.5 ~I~ 10.0013 04114 1 01 , 0!iJ08- 1 ,~~t 7~55 200_5
1.0393 04114 1 :10 GAm 17:~ 7.22 2M.A H2 1 n nn"-d. 04114 1S:15 osm1 19:4! '.!W Z~1.S
H3 10.00~ 04124 15:30 05ms 15:30 "'.55 2(IO.S Tc 99 t--~L~1_+--~1 0~.0~0~15~
12 10.002 1.0378 04f1.4 15:35
04124 15:4(1 04f2.7 17:30 .35 2« 5.6 0510"1 19:451.55 225.9
L3 10.0011 04f1.4 15:45 05108 15'30 7.59 199.7 M1 10.0023 1.0342 04124 16:45 04127 17·30 7.35 2058 M2 10.0032 04f24 16:50 05101 19:45 7.55 225.9
11 ,..1: 1.0361 ,~ .(1 I • O~I 7 • ~ • t1: , . ~
. ..,1 7 ,
1.029 , 05/16 18:35 05123 19:00 7.84 201.6
.3 10.0011 05/16 1S:40 06/01 _19:00 7.78 179.6
Meeting The Analytical Challenges Of A Changing World
Shake Tlmeldays)
UJ42
1~_Q41
-.031
13.31
1 !~~O
3.198 7.718 14. 7 3.~ '7
14 83 3.183 7.250 14066 3.132
14.038 3.111 7.201 14_021
.M7 7 se
14. MX]
3,( SO 7"70 13.990 3.031 7.1'2:
13. ~1
l.sn .Ofj
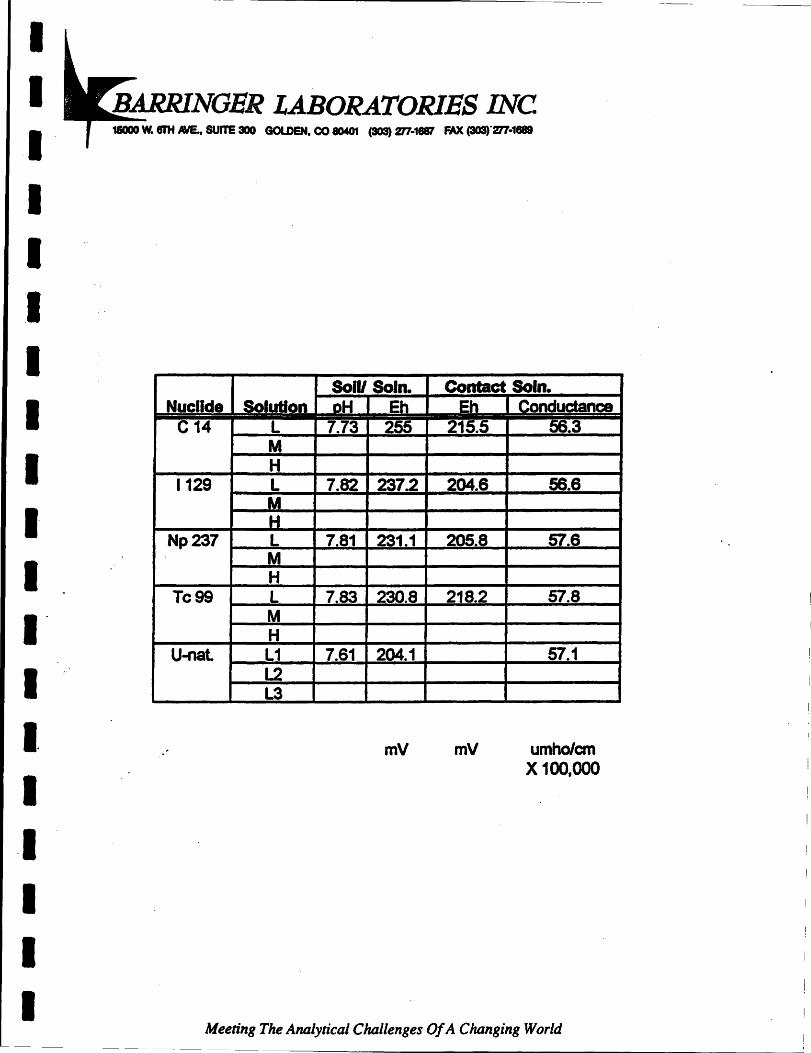
I I I I I I I I I I· I I" I I. I I I I I
.... .......,.~ ....... '-A,~.A. ""'-... -" LABORATORIES INC 1&000 W. 8I'H NE.. SUITE 300 GOLDEN. co 80401 (303) m-16111 FAX (303)"277-1888
."
Nuclide Solution C 14 L
M H
1129 L M H
Np237 L M H
Te99 L M H
U-nal L1 L2 L3
SoIU Soln. DH Eh
7.73 255
7.82 237.2
7.81 231.1
7.83 230.8
7.61 204.1
mV
Contact Soln. Eh
215.5
204.6
205.8
218.2
mV
Conductance 56.3
56.6
57.6
57.8
57.1
umhoJan X 100,000
Meeting The Analytical Challenges Of A Changing World
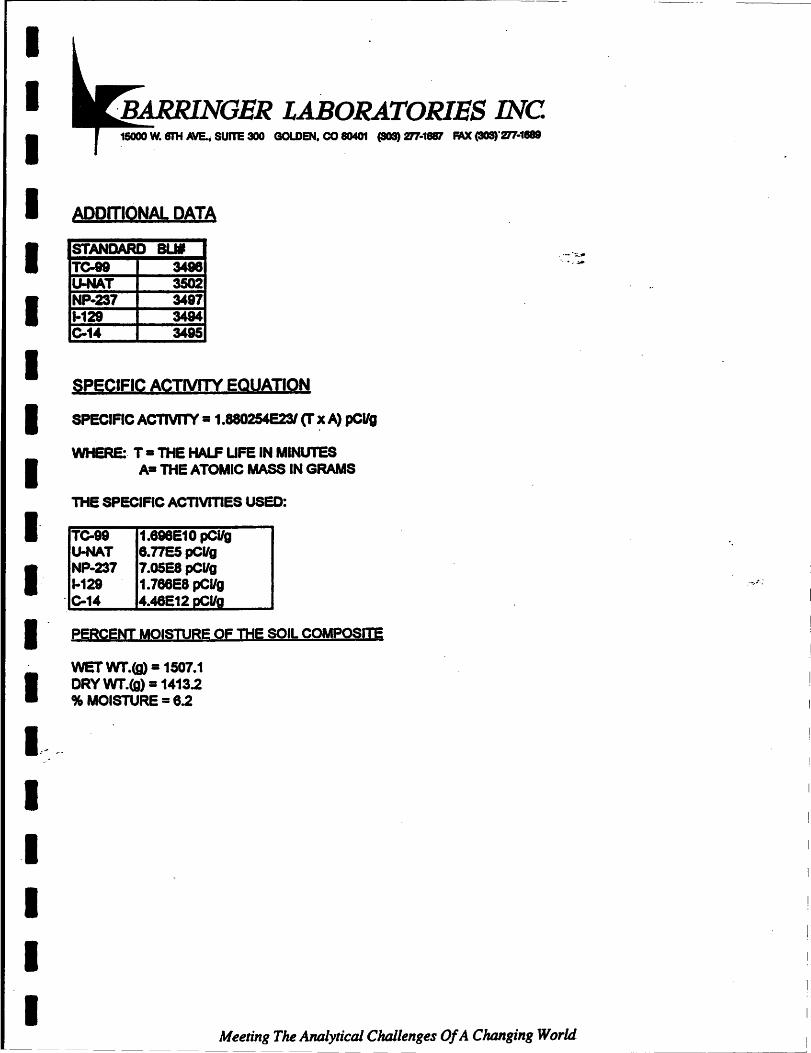
~-------------------------
I I I I I I I I I I-I I-I IOJ r-
I -I I I I
LABORATORIES INC 15000 W. S11f AVE.; SUITE 300 GOLDEN. CO 80401 (S03) m-18111 MX (303)'m-1888
ADDITIONAL DATA
STANDARD BUt Tc-88 3498 u-NAT 3502 Np·237 3487 1-129 3494 C-14 3485
SPECIFIC ACTIVITY EQUATION
SPECIFIC AcnvrrY = 1.880254E23I (T x A) pCl/g
WHERE:- T" THE HALF UFE IN MINUTES A= THE ATOMIC MASS IN GRAMS
THE SPECIFIC AcnvmES USED:
TC-88 u-NAT NP-237 1-128
- C-14
1.898E10 pCUg 8.77ESpCUg 7.OSES pCUg 1.768E8 pCUg 4.48E12 gCUa
PERCENT MOISTURE OF THE SOil COMPOSITE
WETWT.(g) = 1507.1 DRY WT.(g) = 1413.2 % MOISTURE = 8.2
..... ~ . .",
Meeting The Analytical Challenges Of A Changing World
'.
.'~,"".
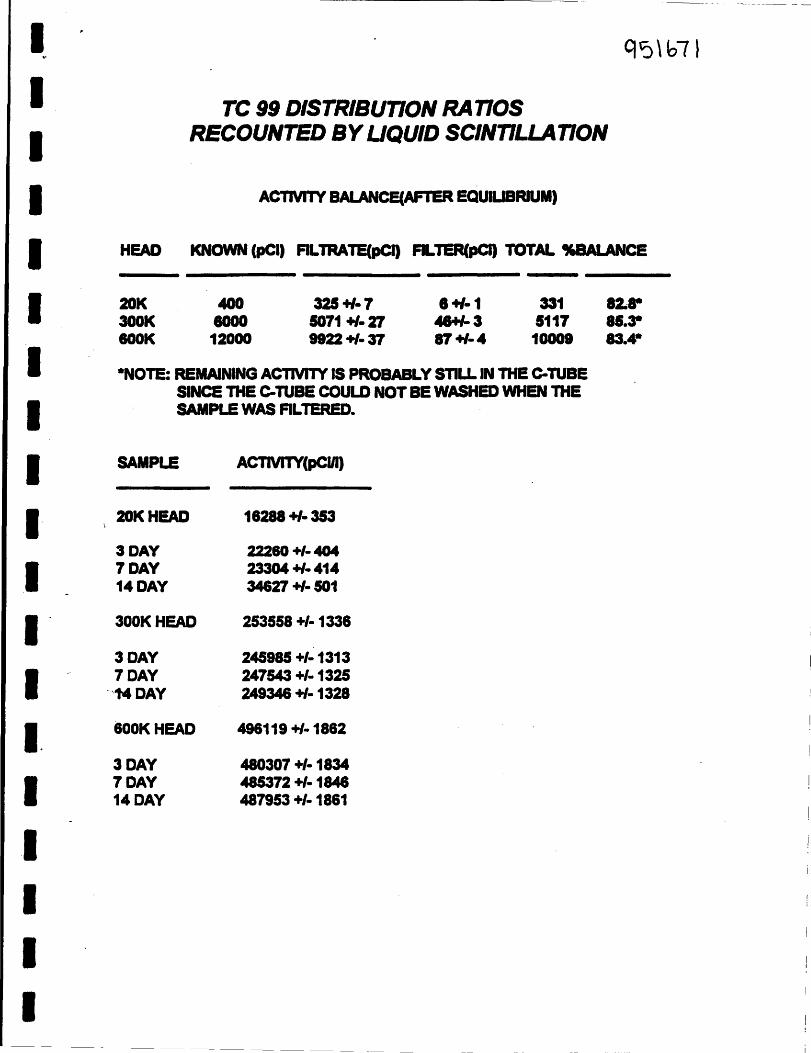
I I I I I I I I I I-I I I I. I I I I I
TC 99 DISTRIBUTION RA TlOS RECOUNTED BY UQUID SCINTILLA TlON
Acnvrrv BALANCE(AFTER EQUIUBRlUM)
HEAD KNOWN (pCl, FlL TRATE(pCI) FlL TER(pCI) TOTAL %BALANCE
20K 300K lOOK
400 8000 12000
325+1·7 5071 +1·27 1122+1·37
8+1·1 48+1-3 87+1-4
331 82.8* 5117 85.3*
10001 83.4*
-NOTE: REMAINING Acnvrrv IS PROBABLY STILL IN THE C-TUBE SINCE THE C-TUBE COULD NOT BE WASHED WHEN THE SAMPLE WAS FILTERED.
SAMPLE
20KHEAD
3 DAY 7 DAY 14 DAY
300KHEAD
3 DAY 7 DAY
-'-MDAY
600KHEAD
3 DAY 7 DAY 14 DAY
Acnvrrv(pCUI)
16288 +1· 353
22280 +1- 404 23304 +1·414 34627 +1- 501
253558 +1- 1336
245985 +1-1313 247543 +1-1325 249346 +I. 1328
496119 +1-1862
480307 +1- 1834 485372 +1- 1846 487953 +/. 1861
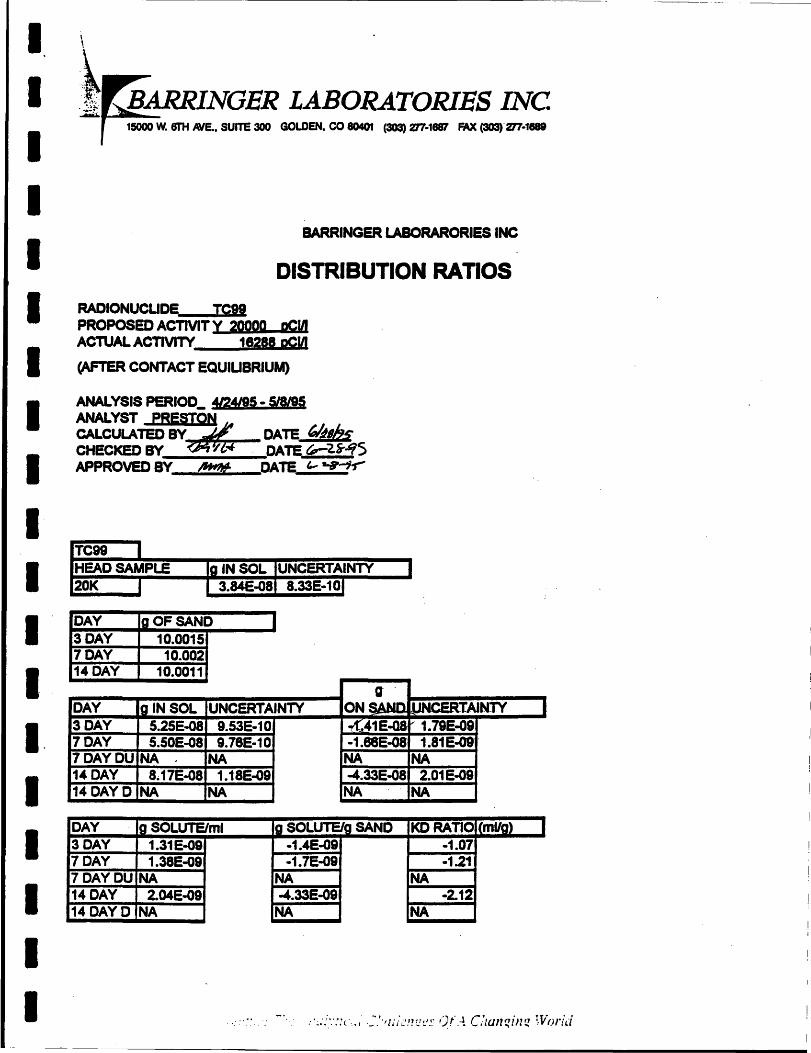
I I I I I I I I I I I I I I. I I I I I
\ \
~~!ARRINGER LABORATORIES INC .-. 15000 W. 8TH AVE.. SUITE 300 GOLDEN. CO 80401 (303) 277-1887 FAX (303)"277-1-
BARRINGER LABORARORIES INC
DISTRIBUTION RATIOS
RADIONUCUDE TC99 PROPOSED ACTIVIT Y 20QQQ pClD ACTUAL ACnVI'TY 18288 pClD (AFTER CONTACT EQUIUBRIUM)
ANALYSIS PERIOD_ 4124195 - 518195 ANALYST PRESTON CALCUlATED BY ~ DATE ~. CHECJ<ED BY ;y,; DATE ~'H5 APPROVED BY /hI'IJf DATE" -.,-1-r'
TCS9 I HEAD SAMPLE la IN SOL UNCERTAINTY 20K 3.84E-OS 8.33E-10
DAY Ig OF SAND 3 DAY 10.0015 7 DAY 10.002 14 DAY 10.0011
DAY Ig IN SOL UNCERTAINTY 3 DAY 5.25E.QS 9.53E-10 7 DAY 5.50E-OS 9.78E-10 7DAYDU NA NA 14 DAY 8.17E-OS 1.1SE.Q9 14DAYD NA NA
g-" ON ~ANn UNCERTAIN-TV ~41 E.QS ,," 1.79E.Q9 -1.88E-08 1.81 E-09 "
NA NA -4.33E-OS 2.01 E-09
NA NA
DAY Ig SOLUTElml la SOLUTElg SAND KD RATlOI(mUa) 3 DAY 1.31E-OS 7 DAY 1.38E-D9 7DAYDU NA 14 DAY 2.04E-09 14DAYD NA
-1.4E-09 -1.7E-09
NA -4. 33E-09
NA
-1.07 -1.21
NA -2.12
NA
I
1
-----
~----" --------------------------------------------------------------------
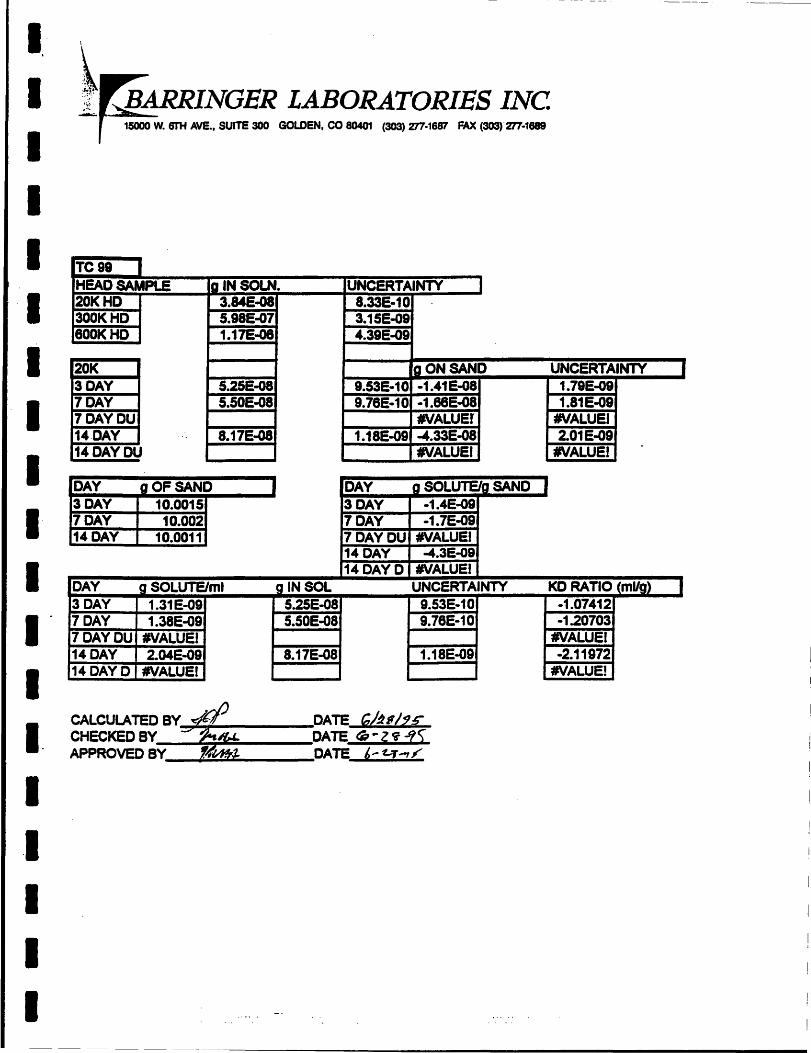
.---------------------~-~~- - ._-
I. I I I I
~rARRINGER LABORATORIES INC ~ 15000 W. 6TH AVE., SUITE 300 GOLDEN, CO 80401 (303) 277-1687 FAX (303)"277-1889
I I I I I I I I
TC9S HEAD SAMPLE Ig IN SOLN. 20KHD 3.84E-08 300KHD 5.9SE-G7 800KHD 1.17E..Q8
20K 3 DAY 5.25E-08 7 DAY 5.50E-G8 7DAYDU 14 DAY ... 8.17E..Q8 14DAYDU
DAY gOFSAND 3 DAY 10.0015 7 DAY 10.002 14 DAY 10.0011
DAY g SOLUTE/ml g IN SOL 3 DAY 1.31E..Q9 5.2SE..Q8 7 DAY 1.38E-09 5.50E..Q8 7DAYOU #VALUEI 14 DAY 2.D4E..Q9 8.17E-08 14 DAY D #VALUE I
UNCERTAINTY 8.33E-10 3.15E-G9 4.39E..Q9
'gONSAND 9.53E-10 -1.41E-GS 9.78E-10 -1.68E..Qa
#VALUEr 1.1SE..Q9 -4.33E..Q8
#VALUEI
DAY g SOLUTEIg SAND 3 DAY -1.4E-09 7 DAY -1.7E-09 7DAYDU #VALUE I 14 DAY -4.3E-09 14 DAY 0 #VALUE I
UNCERTAINTY 9.S3E-10 9.78E-10
1.18E-09
CALCULATED BY-9'o~' _______ DATE G/~'/?S-I CHECKED BY ~ DATE c2J"Z91<; . APPROVED BylJiii DATE , ... 'L.-T -"
I I I I I
UNCERTAINTY 1.79E-09 1.81E..Q9
#VALUEI 2.01E..Q9
#VALUEI
KD RATIO (mUg) -1.07412 -1.20703
#VALUEI -2.11972
#VALUE!
I
I
- ~----------------------------
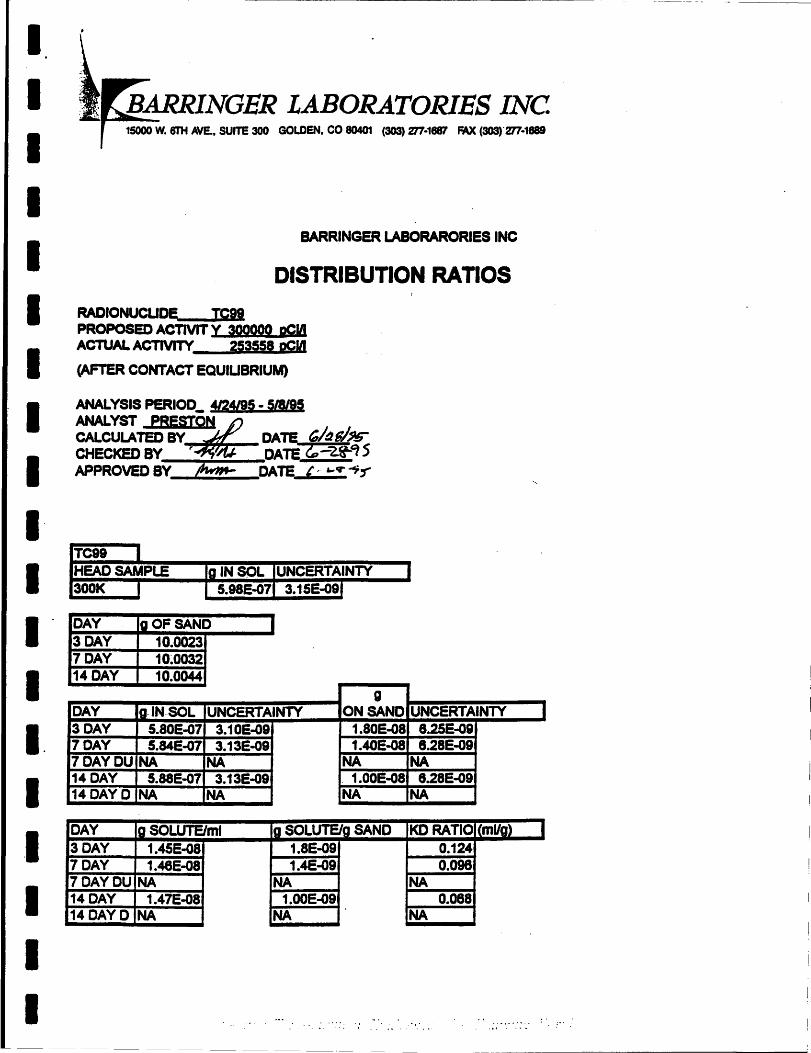
I I I I I I I I I I I I-
I I. I I I I I
-.
~ tf!,ARRINGER LABORATORIES INC ...., 15000 W. 6TH AVE •• SUITE 300 GOLDEN. CO 80401 (303) 'ZI7-18ff1 FAX (303)"'ZI7-1889
BARRINGER LABORARORIES INC
DISTRIBUTION RATIOS
RADIONUCUCE TCS9 PROPOSED ACTIVIT Y 3OQQOQ pClD ACTUAL ACTIVITY 253558 pClD (AFTER CONTACT EQUIUBRIUM)
ANALYSIS PERIOD_ 4I24l95 - 5/8/95
ANALYST E'RE~ CALCULATED BY DATE '/!Jg/~ CHECKED BY" DATE Z;-2~15 APPROVED BY thrm: DATE (,. &.0" ~'r
TCS9 I HEAOSAMPLE la IN SOL UNCERTAINTY 300K 5.98E-G7 3.15E-G9
DAY !gOFSAND 3 DAY 10.0023 7 DAY 10~0032 14 DAY 10.0044
g DAY la·tN-SOL UNCERTAINTY ON SAND UNCERTAINTY 3 DAY 5.80E-07 3.10E-09 7 DAY 5.84E-07 3.13E-09 7 DAY DU NA NA 14 DAY 5.88E-G7 3.13E-GS 14 DAY 0 NA NA
DAY la SOLUTElml 3 DAY 1.45E·OS 7 DAY 1.48E-OS 70AYOU NA 14 DAY 1.47E-OS 14 DAY 0 NA
1.80E-08 8.25E-09 1.40E-08 8.28E-09
NA NA . 1.00E-G8 8.28E-G9 NA NA
g SOLUTEIg SAND KDRATIO 1.8E-09 0.124 1.4E-09 0.098
NA NA 1.00E-09 O.08S
NA NA
I (mUg)
J
I

I I I I I I I I I I I I· I I. I I I I I
tp~Ii?INGER LABORATORIES INC 15000 W. 6TH AVE •• SUITE 300 GOLDEN. CO 80401 (303) 277·1687 FAX (303)"277·1889
Teas I HEAD SAMPLE 20KHD 300KHD 800KHD
300K 3 DAY 7 DAY 7DAYDU 14 DAY 14DAYDU
la IN SOLN. 3.84Ea@8 5.98e..q7 1.17E.{J6
5.80~..Q1-
5.841:-07
5. 88E...o7
DAY aOFSAND 3 DAY 1!1;t0023 7 DAY 1a:t0032 14 DAY 10.0044
UNCERTAINTY 8.33E·10 3.15E-09 4.3aE.Qa
~~~~la~O~N~SA~N~D ____ ~U~NCERT~NTY 3.10E..Qa 1.S0E..QS ....... 8.25E..Qa 3.13E..Q9 1.40E-oS J-,.,;;8.28E-09
#VALUEI #VALUEI 3.13E..Qa 1.00E-oa ...... 8.28E..Qa
#VALUE I #VALUE!
DAY g SOLUTE/a SAND 3 DAY 1.8E.Q9 7 DAY 1.4E-QS 7 DAY DU #VALUEI 14 DAY 1E..Q9 14-DAY D#VALUEI
DAY g SOLUTElml g IN SOL UNCERTAINTY KD RATIO m~ ~3~D~A~Y~""'1~.4~5~E~-O.;;i8"""--~5~.8!-!0~E~..Q~7"'---.....-.!!3~.1~0~E.Q~S~----~0.12410S 7 DAY 1.48E-08 5. 84E-07 3.13E-09 1--0.oa586 7 DAY DU #VALUE! #VALUE! 14 DAY 1.47E-08 5.88E..Q7 3.13E-09 ~0.0879a7 14 DAY 0 #VALUE! #VALUE!
CALCULATED BY Y CHECKED BY ~~~ APPROVED BY ,..,.",.
... ~ . l . :. .. . ~
DATE &/~II95' DATE ~-£.r--'l5 DATE "--l,~ -?r
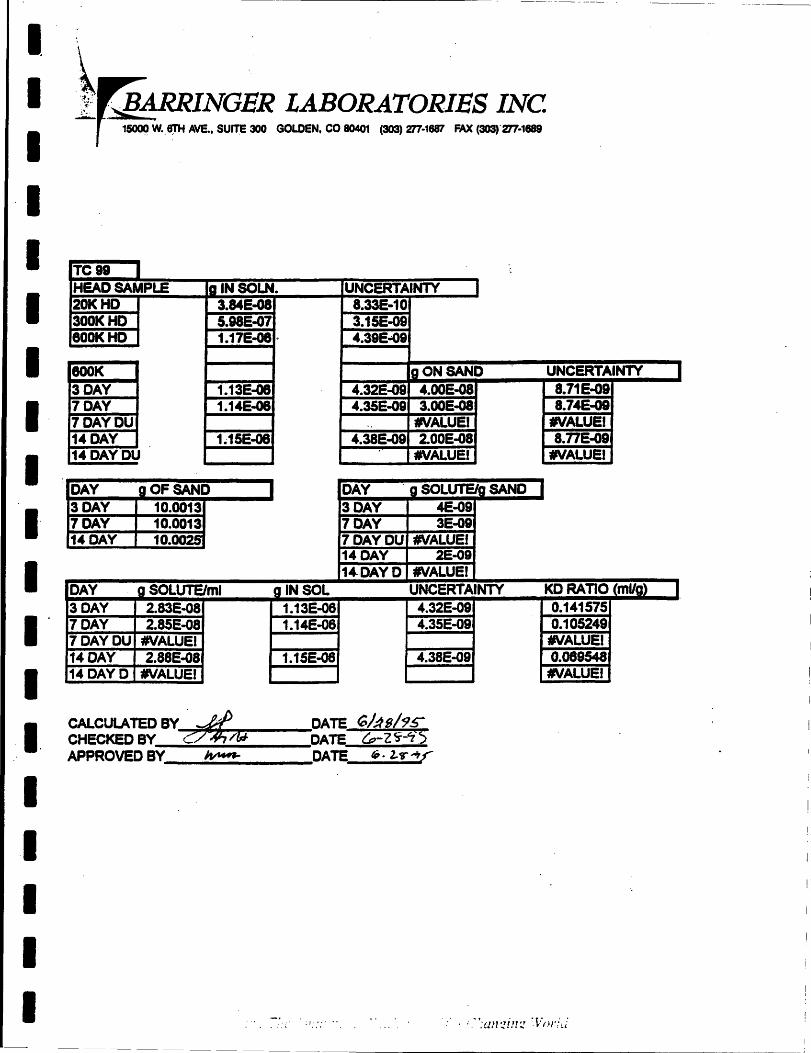
I . I I I I I I I I I,
I I-
I I. I ,I
I I I
----_._--------------
. ~~ ,.' ,
1 >~ARRINGER LABORATORIES INC 15OQC) W.6,TH AVE •• SUITE 300 GOLDEN. CO 80401 (303) m-1887 FAX (303)'277-1889
TCSS I HEAD SAMPLE la IN SOLN. UNCERTAINTY 20KHD 3.84E.Qa 8.33E-10 300KHD S.98E.Q7 3.1SE.Q9 eOOKHD 1.17E.Q8 " 4.3SEwOS
SOOK IgONSAND UNCERTAINTY I 3 DAY 1.13E-08 4.32E.Q9 4.00E.Qa 8.71E..QS 7 DAY 1.14E-08 4.35E..Qa 3.ooE.Q8 8.74E.Q9 7DAYDU " #VALUEI #VALUEI 14 DAY 1.15E-08 4.3aE..QS 2.00E-Oa 8.77E..QS 14DAYDU #VALUEr #VALUEI
DAY gOFSAND I DAY , g SOLUTEIa SAND 3 DAY 10.0013 3 DAY 4E.Qa 7 DAY 10.0013 7 DAY 3E..Qa 14 DAY 10.0025 7DAYDU #VALUE!
14 DAY 2E..Q9 14 DAY 0 #VALUE I
DAY Cl SOLUTElml g IN SOL UNCERTAINTY KD.RAno (mUm I 3 DAY 2.83E..Qa 1.13E..Q8 4.32E-09 0.141575 7 DAY 2. 85E-Oa 1.14E.Q8 4.35E-Q9 0.105249 7DAYDU #VALUEr #VALUEI 14 DAY 2.88E-Qa 1.15E-08 4.38E-Q9 0.089548 ' 14 DAY 0 #VALUEI #VALUEI
g~~~~~ BY-c.,~~·/.-/&J.~---:~ ~::,~ APPROVED BY WIIWI- DATE';· L.,. ~ r
;7::,'· ..
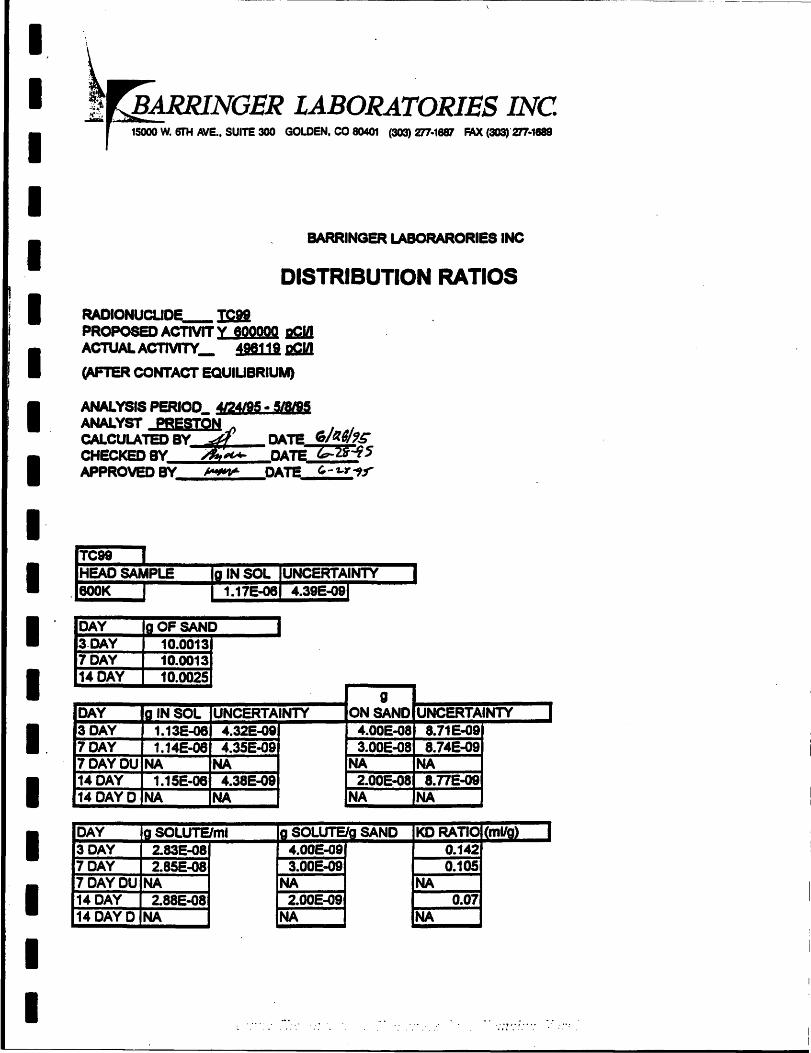
........---------------------------------~---
! I !
I I I I I I I I I I I I I I. I I I I I
~P.ARRINGER LABORATORIES INC ...... - 15000 W. 6TH AVE., SUITE 300 GOLDEN, CO 80401 (303) 277-1887 FAX (303)'277-1889
BARRINGER LABORARORIES INC
DISTRIBUTION RATIOS
RADIONUCUDE_ EiI PROPOSED ACTIVIT Y aooooo ~ ACTUALACTIVITY_ 418119 ACI4 (AFTER CONTACT EQUIUBRIUM)
ANALYSIS PERIOD_ 4124195 • 5J8lI5
=~TEDee:v~ DATE fi#/RI;'~ CHECKEDSY . ~ DATE Z;:S=f5 APPROVED BY ~ DATE "-1--"..,f
TC98 HEAD SAMPLE la IN SOL UNCERTAINTY I 800K 1.17E-Q8 4.3&E..Q&
DAY 10 OF SAND f3-DAY 10.0013 7 DAY 10.0013 14 DAY 10.0025
g DAY tg IN SOL UNCERTAINTY ON SAND UNCERTAINTY 3 DAY 1.13E-Q8 4.32E..Q& 7 DAY 1.14E-06 4.35E-09 7DAYDU NA NA 14 DAY 1.15E·06 4.38E-09 , .. DAYD NA NA
DAY 10 SOLUTE/ml 3 DAY 2. 83E'()8 70AY 2. 85E-OS 7DAYDU NA 14 DAY 2.8SE-OS 14 DAY D NA
4.00E..Q8 8.71 E-O& 3.00E-08 S.74E-09
NA NA 2.00E-08 8. nE-09
NA NA
10 SOLUTEIg SAND KDRATIO 4.00E'()& 0.142 3.00E-09 0.105
NA NA 2.00E-09 0.07
NA NA
1 (mU1ll
I
J
.. - . . ··'1·:·· ..
-----------------~ -- .. ---~--
I I I I
. APPENDIXE
I STATISTICAL EVALUATION
I I I I I' I I"
I I.
I ·1 I I I
~ ~-
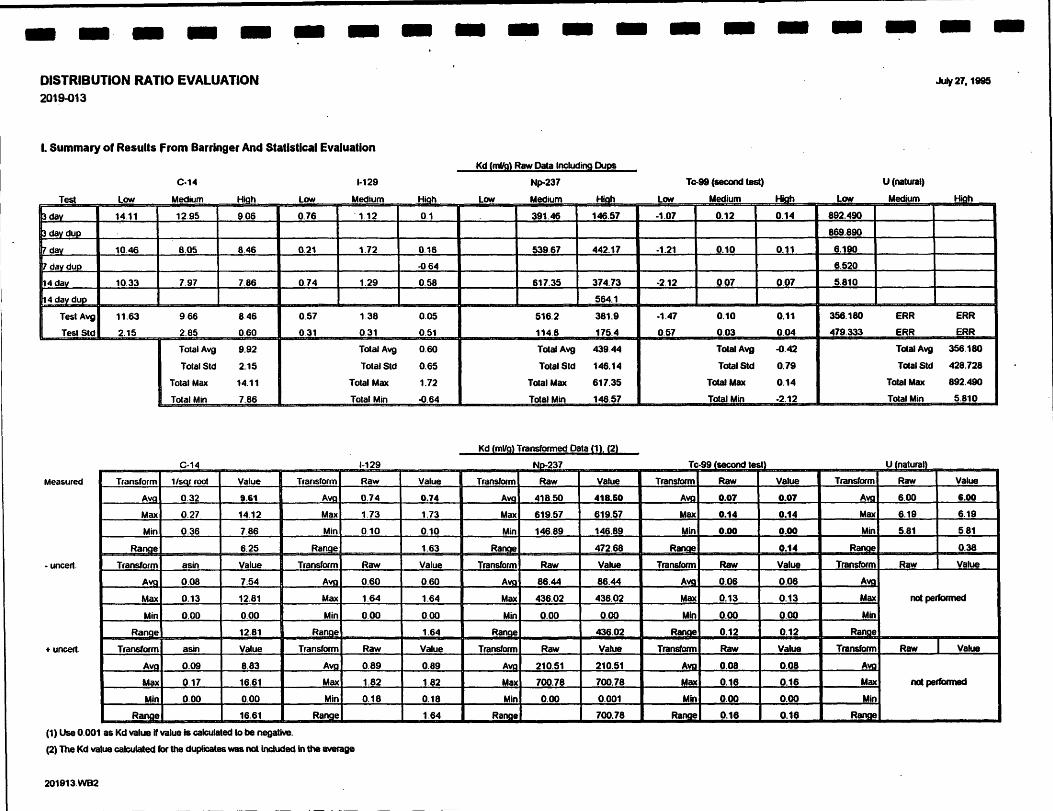
- - - - -DISTRIBUTION RATIO EVALUATION 2019-013
- -I. Summary of Results From Barringer And Statistical Evaluation
C-14 1-129
....... ...-... ....,----'" • ",...11, -_ .... ,.,--,-,.,
~day 14.11 12.95 9.06 0.76 . 1.12
~ day dllP
7 day 10.46 8.05 8.46 0.21 1.72
7 day dup
14d~ 10.33 797 7.86 0.74 1.29
14 day dup
TeslAvg 11.63 9.66 8.46 0.57 1.38
Test Std 2.15 2.85 0.60 0.31 0.31
Total Avg 9.92 Total Avg
TolalSld 2.15 TolalSld
Total Max 14.11 Tolal Max
Total Min 7.86 Total Min
.. .. ---Measured Transform l/sgr rool Value Transform Raw
AVQ 0.32 8.61 Ayg 0.74
Max 0.27 14.12 Max 1.73
Min 0.36 7.86 Min 0.10
Range 6.25 Range
- uncert. Transform asin Value Transform Raw
A~ 0.08 7.54 AVil 0.60
Max 0.13 12.81 Max 1.64
Min 0.00 0.00 Min 0.00
Range 12.81 Range
+ uncert. Transform asin Value Transform Raw
AVQ 0.09 8.83 Avg 0.89
Max 0.17 16.61 Max 1.82
Min 0.00 0.00 Min 0.18
Range 16.61 Range
(1) Use 0.001 as Kd value If value Is calculated to be negative.
(2) The Kd value calculated for the duplicates waa not Included In the avet'age
201913.WB2
-
• ~'w" •
0.1
0.18
-064
0.58
0.05
0.51
0.60
0.65
1.72
-0.64
Value
0.74
1.73
0.10
1.63
Value
0.60
1.64
0.00
1.64
Value
0.89
1.82
0.18
1.64
- - - - - - - - - - -JulV27.1895
Kd (ml/Q' Raw Data IncludinQ [)ups
Np-237 To-99 (second test) U(natwal)
.. -.... ,"" ... _,_, .. ... y .. -_ .... ..... __ ._ ... ... '1 -_ .. .... - -". ........
391.46 146.57 -1.07 0.12 0.14 892.490
869.890
53967 442.17 -1.21 0.10 0.11 6.190
6.520
617.35 374.73 -2.12 0.07 0.07 5.810
564.1
516.2 381.9 -1.47 0.10 0.11 356.180 ERR ERR
114.8 175.4 0.57 0.03 0.04 479.333 ERR ERR
Total Avg 439.44 TotalAvg -0.42 TotalAvg 356.180
TolalSld 146.14 Total Std 0.79 Total Sid 428.728
Total Max 617.35 Total Max 0.14 Total Max 892.490 I
Tolal Min 146.57 Total Min -2.12 Total Min 5.810
Kd (mUg' Transformed Dala (1). (2)
.. __ , .. -- - -_ ...... _ .. - ...... -- ..
Transform Raw Value Transform Raw Value Transform Raw Value
AVQ 418.50 418.60 Ava 0.07 0.07 Ava 6.00 '.00 Max 619.57 619.57 Max 0.14 0.14 Max 6.19 6.19
Min 146.89 146.89 Min 0.00 0.00 Min 5.81 5.81
Rcmge 472.68 Range 0.14 Range 0.38
Transform Raw Value Transform Raw Value Transform Raw Value
AVQ 86.44 86.44 Avg 0.06 0.06 ~'m
Max 436.02 436.02 Max 0.13 0.13 Max not performed
Min 0.00 0.00 Min 0.00 0.00 Min
Range 436.02 RaMe 0.12 0.12 Ranoe
Transform Raw Value Transform Raw Value Transform Raw Value
AVQ 210.51 210.51 AVA 0.08 0.08 A!!'Q
Max 700.78 700.78 Max 0.16 0.16 Max not performed
Min 0.00 0.001 Min 0.00 0.00 Min
Range 700.78 Ranmt 0.18 0.18 Ranae
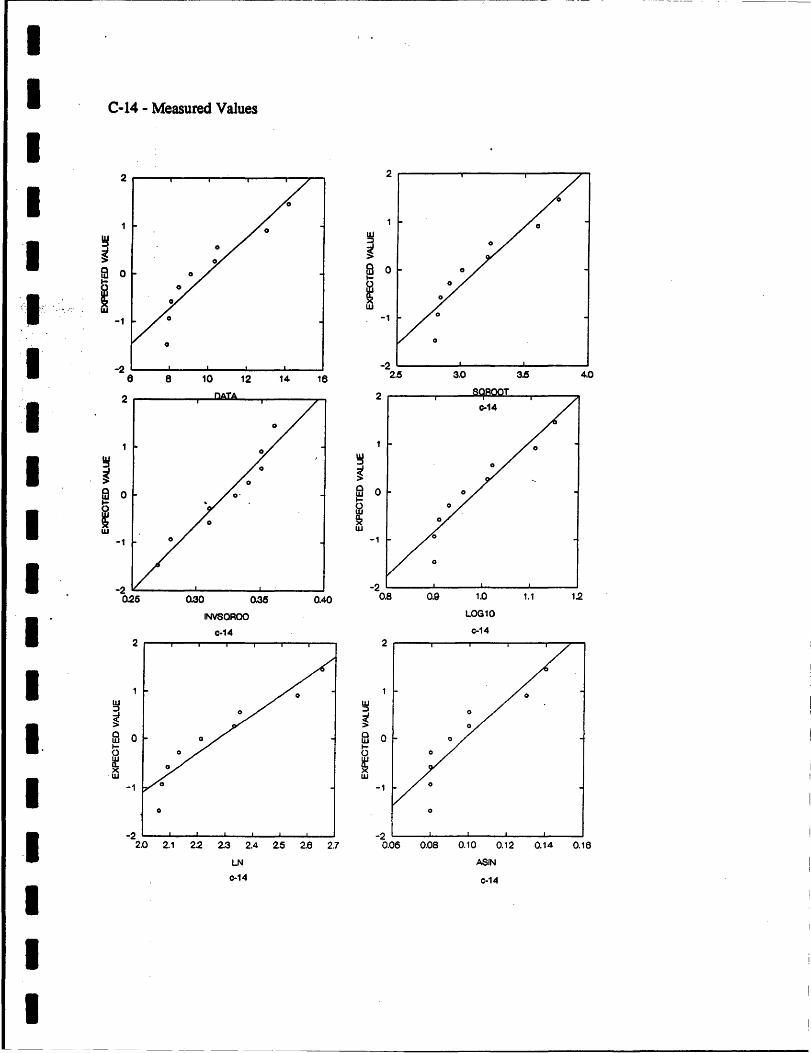
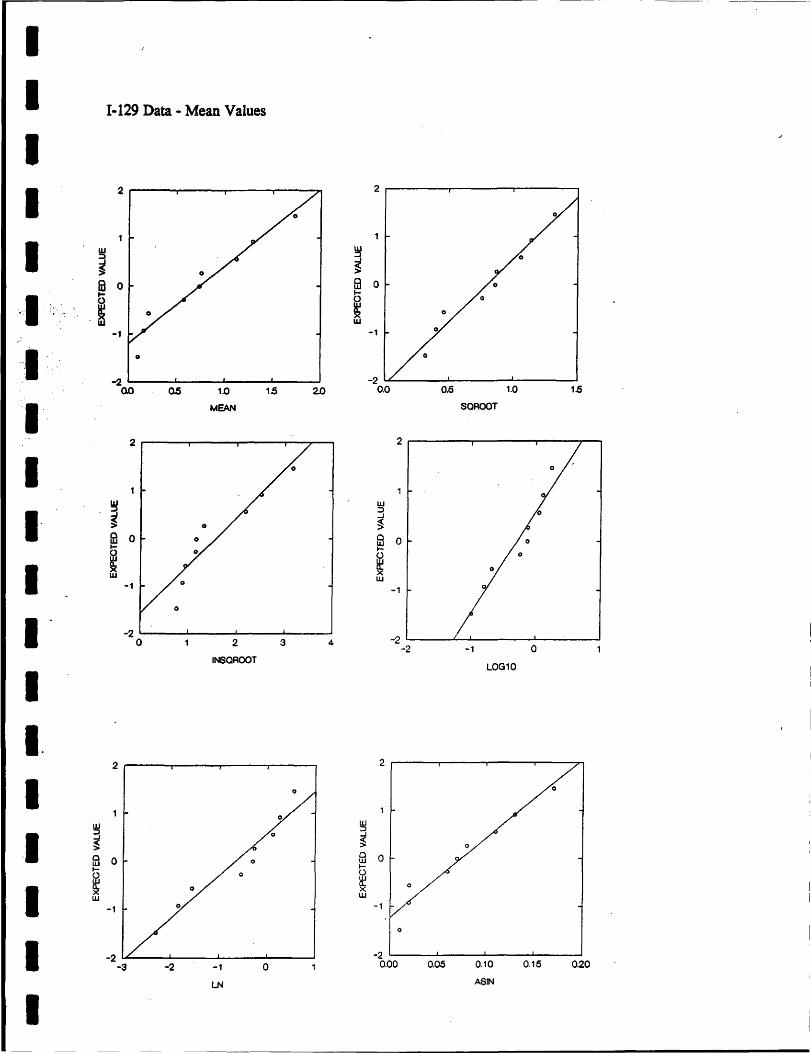
1 1 1-129 Data - Mean Values
I 1
2 2
I w ~ ~
~ ~ ID 0 @ 0
•• ~ ....
I-" •••• ~ w
-1 -1
1 0
-2 0.0 Q5 1.0 1.5 2.0 0.5 1.0 1.5
'1' MEAN SQROOT
2 2
1 ~ UJ
I :J
i ~ 53 0 0 0 .... UJ
~ .... 0
1 1e
w x UJ
-1 -1
1- -2 -2 0 2 3 4 -2 -1 0
INSQROOT LOG10
1 I.
2 2
1 w UJ :J :J
·1 ~
~
~ ~ 0 0
0 0 UJ W .... I-
0 0 w w
1 ~ a.. 0 x
w w -1 -1
0
1 -2 -2 -1 0 0.00 0.05 0.10 0.15 0.20
LN ASIN
I
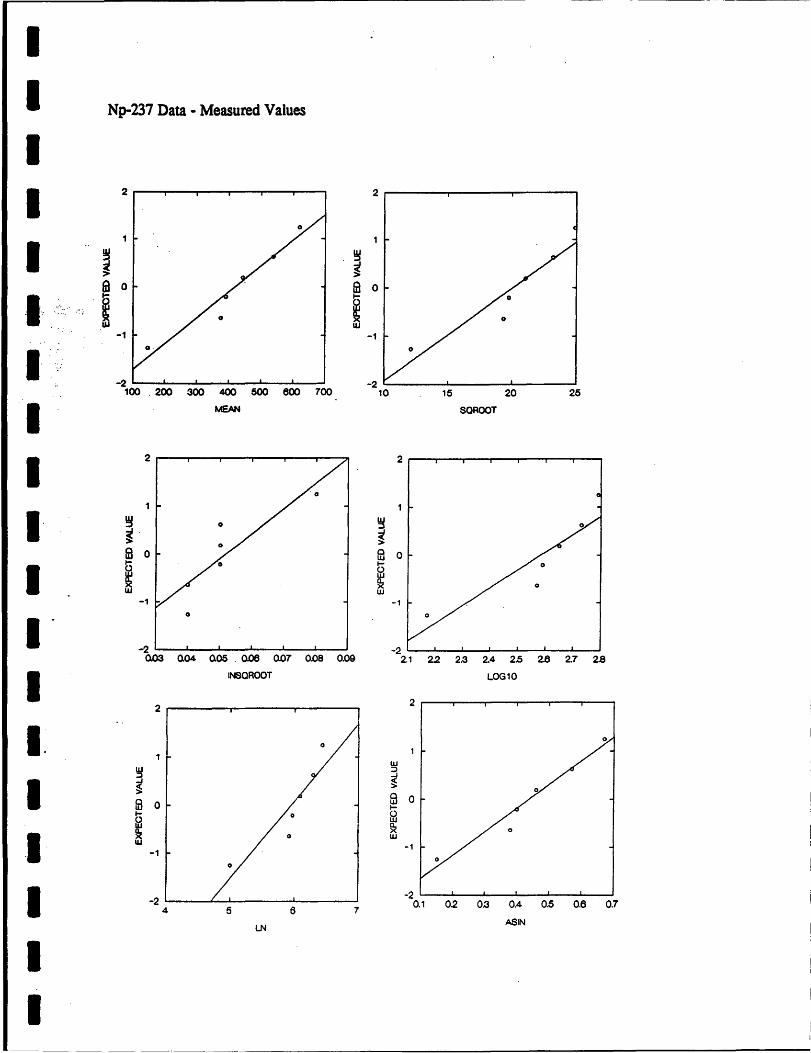
I I I I I I ...... .
',: ..... .
I I I I I I-
I II I I I I
Np-237 Data - Measured Values
2..--~-~-,.--,---,-----,
-1
~ ~_L-_L-_~ __ ~ __ ~~
100 . 200 300 400 500 600 700
MEAN
o
~ ~_L-__ L-__ ~ __ ~ __ ~~
().()3 0.04 0.05. o.oe (1)7 o.oa 0.09
INSQROOT
2r------~-----_r_---____,
3 ~ ~ 0 I-
fa ~ w
-1
-2 4 5 6 7
LN
2..------,.-----,---------,
-1
UJ ::J
~ 0 w 0 l-
@ a.. x w
-1
-2 0.1
15 20 25
SQROOT
22 2.3 2.4 2.5 2.6 2.7 2.8
LOO10
0.2 0.3 0.4 0.5 0.6
ASIN
0.7
_. - - -_. ----------------------------------
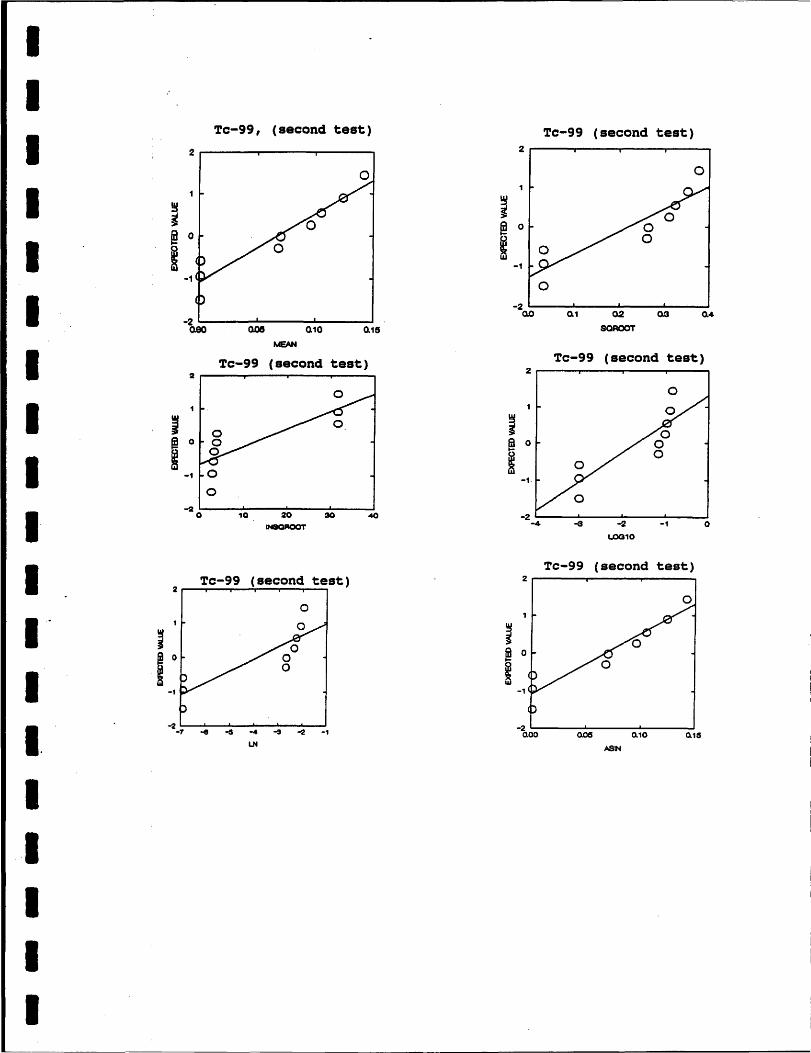
I I I I I I 1 I I 1 1
." I I.
• I I I
•
Tc-99, (second test)
2~----~------~------,
o
-2 o.eo Q.05 0.10 0.15
MEAN
Tc-99 (second test) 2
j ~ 0
~ -1
0 -2
0 10 20 30
IN8QI'OOT
Tc-99 (second test) 2
0
; ~ 0
I -1
-2 -7 -e -s -4 -<I -2 -1
LN
Tc-99 (second test) 2
0
~ ~ fa 0
i w -1
0
-2 0.0 0., 02 Q3 0.4
SQROOT
Tc-99 (second test) 2
0
i fa 0
~ -1.
-s -2 -1 0
1.OG10
Tc-99 (second test) 2
0
~ ~ ~ 0
~ -1
-2 0.00 Q.OI5 0.10 0.18
ASN
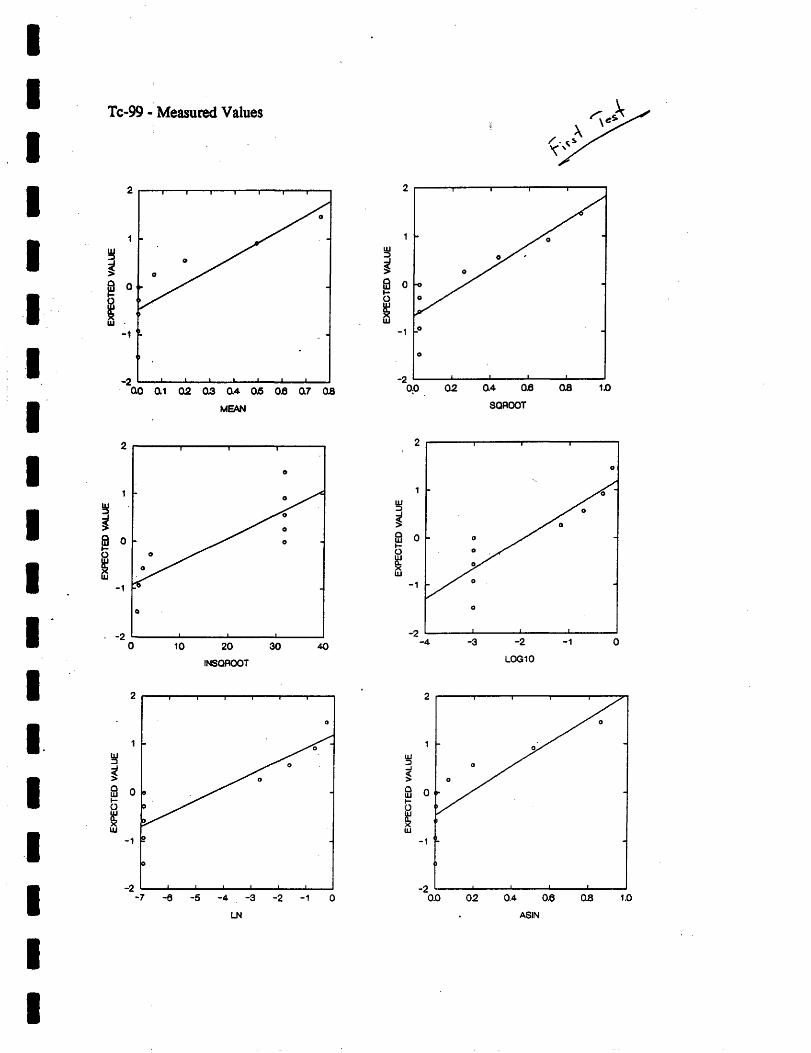


![Bilstein Performance Suspension Parts Application Guide · off-road racing technology—brings the performance proven in Baja to the streets. 5160 SERIES [ TRUCK/SUV ] BILSTEIN 5160](https://static.fdocuments.us/doc/165x107/5e20734e33c58176247da3d2/bilstein-performance-suspension-parts-application-guide-off-road-racing-technologyabrings.jpg)