5160-WP 2008-5 Varieties Wachira 13October CPAD2
96
ISSN 0256-8748 Social Sciences Working Paper No. 2008 - 5 Working Paper 2008-5 Farmer practices and adoption of improved potato varieties in Kenya and Uganda Wachira Kaguongo, International Potato Center (CIP) Peter Gildemacher, International Potato Center (CIP) Paul Demo, International Potato Center (CIP) William Wagoire, Kachwekano Zonal Agricultural Research and Development Institute (KAZARDI, Uganda) Peter Kinyae, Kenya Agricultural Research Institute (KARI-Tigoni) Jorge Andrade, International Potato Center (CIP) Greg Forbes, International Potato Center (CIP) Keith Fuglie, United States Department of Agriculture (USDA) Graham Thiele, International Potato Center (CIP)
Transcript of 5160-WP 2008-5 Varieties Wachira 13October CPAD2
ISSN 0256-8748Social SciencesWorking PaperNo. 2008 - 5
Wo
rkin
g P
aper
200
8-5
Farmer practices and adoptionof improved potato varieties inKenya and Uganda
Wachira Kaguongo, International Potato Center (CIP)Peter Gildemacher, International Potato Center (CIP)Paul Demo, International Potato Center (CIP)William Wagoire, Kachwekano Zonal Agricultural Researchand Development Institute (KAZARDI, Uganda)Peter Kinyae, Kenya Agricultural Research Institute (KARI-Tigoni)Jorge Andrade, International Potato Center (CIP)Greg Forbes, International Potato Center (CIP)Keith Fuglie, United States Department of Agriculture (USDA)Graham Thiele, International Potato Center (CIP)

5
I n t e r n a t i o n a l P o t a t o C e n t e r • W o r k i n g P a p e r 1
3
Inte
rna
tio
na
l P
ota
to C
en
ter
• W
ork
ing
Pa
pe
r 1
Wo
rkin
g P
aper
Farmer practices and adoptionof improved potato varieties in
Kenya and Uganda
Wachira Kaguongo, International Potato Center (CIP)Peter Gildemacher, International Potato Center (CIP)
Paul Demo, International Potato Center (CIP)William Wagoire, Kachwekano Zonal Agricultural Research and
Development Institute (KAZARDI, Uganda)Peter Kinyae, Kenya Agricultural Research Institute (KARI-Tigoni)
Jorge Andrade, International Potato Center (CIP)Greg Forbes, International Potato Center (CIP)
Keith Fuglie, United States Department of Agriculture (USDA)Graham Thiele, International Potato Center (CIP)
4
Inte
rna
tio
na
l P
ota
to C
en
ter
• W
ork
ing
Pa
pe
r 1
© International Potato Center (CIP), 2008
ISSN 0256-8748
CIP publications contribute important development information to thepublic arena. Readers are encouraged to quote or reproduce materialfrom them in their own publications. As copyright holder CIP requestsacknowledgement, and a copy of the publication where the citationor material appears. Please send a copy to the Communication andPublic Awareness Department at the address below.
International Potato CenterP.O.Box 1558, Lima 12, [email protected] • www.cipotato.org
Produced by the CIP Communication and PublicAwareness Department (CPAD)
Correct citation:Kaguongo, W., P. Gildemacher, P. Demo, W. Wagoire, P. Kinyae, J.Andrade, G. Forbes, K. Fuglie and G. Thiele. 2008. Farmer practicesand adoption of improved potato varieties in Kenya and Uganda.International Potato center (CIP), Lima, Peru. Social Sciences WorkingPaper 2008-5. 85 p.
Production CoordinatorCecilia Lafosse
Design and LayoutElena Taipe and contributions from Graphic Arts
Printed in Peru by Comercial Gráfica SucrePress run: 150October 2008
The Social Sciences Working Paper Series is intended to advance social science knowledge about production and utili-zation of potato, sweetpotato, and root and tuber crops in developing countries to encourage debate and exchange ofideas. The views expressed in the papers are those of the author(s) and do not necessarily reflect the official position ofthe International Potato Center.
Comments are invited.
Farmer practices and adoptionof improved potato varieties inKenya and Uganda

iii
Table of Contents Acronyms ......................................................................................................................................................................................... v Abstract ........................................................................................................................................................................................vi Acknowledgements..................................................................................................................................................................viii Introduction .....................................................................................................................................................................................1
Potato production in Kenya and Uganda ................................................................................................... 1 Importance of late blight.................................................................................................................................. 3 Investment in potato improvement ............................................................................................................. 3
Methodology ...................................................................................................................................................................................6 Sampling in Kenya .............................................................................................................................................. 6 Sampling in Uganda........................................................................................................................................... 6 Analytical tools..................................................................................................................................................... 7 Definitions ............................................................................................................................................................. 7
Results and Discussion...............................................................................................................................................................8 Farmers’ characteristics..................................................................................................................................... 8 Potato production.............................................................................................................................................13 Variety adoption and abandonment..........................................................................................................15 Preferences for traits and attributes ...........................................................................................................25 Variety abandonment......................................................................................................................................29
Disease Incidences and Control......................................................................................................................................... 32 Late blight............................................................................................................................................................32 Bacterial wilt........................................................................................................................................................34
Input use ...................................................................................................................................................................................... 35 Seed potato system..........................................................................................................................................35 Fertilizer application.........................................................................................................................................42 Farmyard manure..............................................................................................................................................44
Total output, Storage, Marketing and Utilization.................................................................................................... 45 Marketing.............................................................................................................................................................45 Credit .....................................................................................................................................................................49 Extension services and farmer training......................................................................................................50
Economics of potato production ...................................................................................................................................... 52 Yields difference between local and improved varieties.....................................................................52
Profitability..................................................................................................................................................................................... 54 Kenya.....................................................................................................................................................................54 Uganda .................................................................................................................................................................57
iv
Conclusions and Recommendations................................................................................................................59 References.................................................................................................................................................................62 List of Tables Table 1. Varieties released by KARI and NARO, 1927 to 2006 .................................................................................... 4 Table 2. Demographic characteristics of selected farm families in survey............................................................ 8 Table 3. Asset ownership of selected households by districts.................................................................................10 Table 4. Most important income sources (%).................................................................................................................11 Table 5. Description of farming system based on first season of 2005 ................................................................13 Table 6. Potato production practices by country: 2004/2005..................................................................................14 Table 7. Potato varieties grown by sample farmers in Kenya in 2005...................................................................19 Table 8. Potato varieties in farmer’s fields in Kenya between 1976 and 2005 (percentage of sample
farmers). ......................................................................................................................................................................20 Table 9. Potato varieties grown by sample farmers in Uganda in 2005...............................................................22 Table 10. Potato varieties in farmer’s fields in Uganda between 1976 and 2005 ..............................................23 Table 11. On-station performance (1989-91) and attributes of some improved
varieties during release of Victoria. ...................................................................................................................23 Table 12. Attributes considered when ranking good and bad qualities of varieties grown ..........................25 Table 13. Advantages cited by farmers growing the ten common varieties in Kenya, 2005a.........................26 Table 14. Advantages cited by farmers of the eight common varieties in Uganda, 2005a ..............................26 Table 15. Weaknesses cited by farmers of the six commonly abandoned varieties
in Kenya, 2005...........................................................................................................................................................30 Table 16. Weaknesses cited by farmers of the six commonly abandoned varieties in Uganda, 2005 ........30 Table 17. Late blight details by country. ............................................................................................................................33 Table 18. Rating of varieties according to level of resistance to late blighta.........................................................34 Table 19. Sources of seed for each variety grown in the last two seasons ............................................................36 Table 20. Seed details by country. ........................................................................................................................................38 Table 21. Sources of seed during the first time of growing ........................................................................................41 Table 22. Seed storage details by country.........................................................................................................................43 Table 23. Fertilizer application details.................................................................................................................................44 Table 24. Potato utilization details by country.................................................................................................................47 Table 25. Prices of potato seeds and wares by varieties...............................................................................................49 Table 26. Group membership and credit. ..........................................................................................................................50 Table 27. Other general problems cited by potato farmers (%) ................................................................................51 Table 28. Mean yields of the most commonly grown varieties in 2004-5 (kg/ha). .............................................53 Table 29. Costs and returns per hectare of land per season for improved and local
varieties in Kenya (USD/ha)..................................................................................................................................56 Table 30. Costs and returns per hectare of land per season for improved and local
varieties in Uganda (USD/ha). .............................................................................................................................58
List of Figures Figure 1. Percentage of farmers growing improved and local varieties ................................................................16 Figure 2. Proportion of area under CIP derived and non-CIP derived varieties ..................................................16 Figure 3. Percentage of farmers growing red and white skin varieties..................................................................24 Appendices Appendix 1. Potato production for Kenya and Uganda: 1990-2005. ...........................................................................66 Appendix 2. Production details of commonly grown varieties in Kenya and Uganda (per ha). ........................67 Appendix 3. Production of pre-basic seed during 1993-94 in Uganda (kg). .............................................................69 Appendix 4. Details of Data Analyses. .....................................................................................................................................69 Appendix 5. Map of Kenya showing potato producing districts...................................................................................71 Appendix 6. Map of Uganda showing potato producing districts. ..............................................................................72 Appendix 7. Survey questionnaire –Uganda ........................................................................................................................73

v
Acronyms ADC Agricultural Development Corporation
CIP Centro International de la Papa (International Potato Center)
FFS Farmer Field School
FAO Food and Agricultural Organization
IFAD International Fund for Agricultural Development
KARI Kenya Agricultural Research Institute
KAZARDI Kachwekano Zonal Agricultural Research and Development Institute
MoA Ministry of Agriculture
NAADS National Agricultural Advisory Services
NARO National Agricultural Research Organization
NARS National Agricultural Research Stations
PRAPACE Regional Potato and Sweetpotato Improvement Program for Eastern and Central Africa
SSA Sub-Saharan Africa
vi
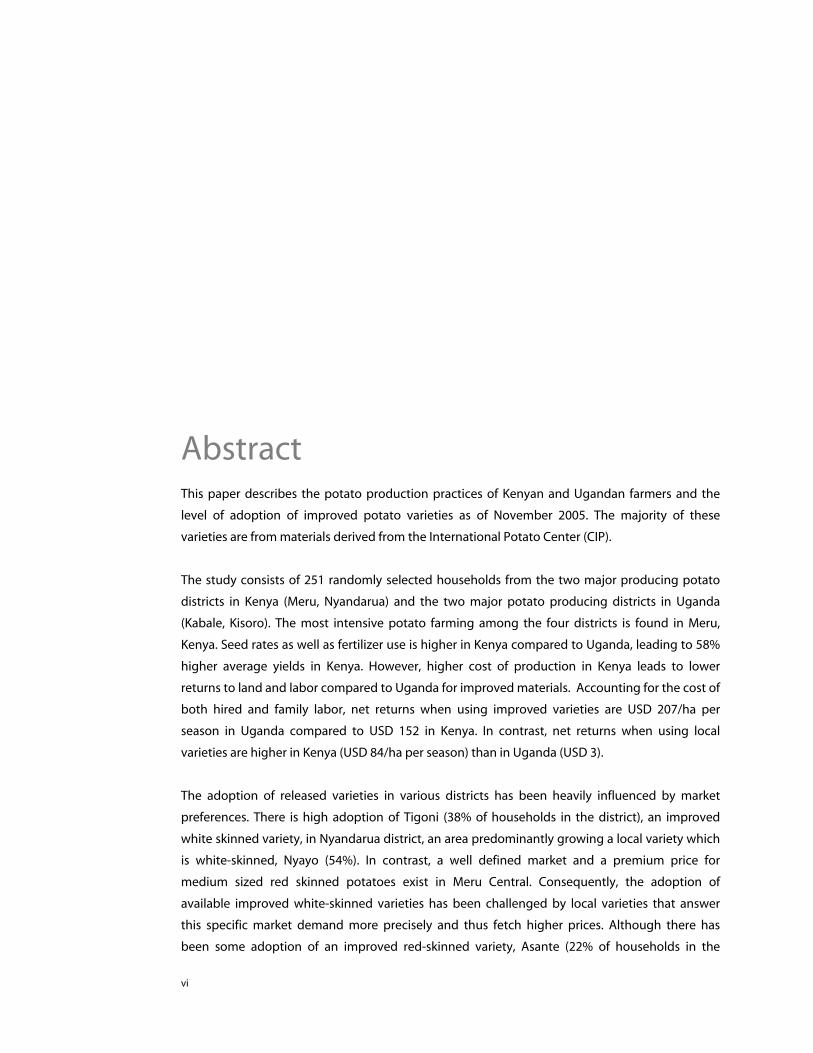
Abstract This paper describes the potato production practices of Kenyan and Ugandan farmers and the
level of adoption of improved potato varieties as of November 2005. The majority of these
varieties are from materials derived from the International Potato Center (CIP).
The study consists of 251 randomly selected households from the two major producing potato
districts in Kenya (Meru, Nyandarua) and the two major potato producing districts in Uganda
(Kabale, Kisoro). The most intensive potato farming among the four districts is found in Meru,
Kenya. Seed rates as well as fertilizer use is higher in Kenya compared to Uganda, leading to 58%
higher average yields in Kenya. However, higher cost of production in Kenya leads to lower
returns to land and labor compared to Uganda for improved materials. Accounting for the cost of
both hired and family labor, net returns when using improved varieties are USD 207/ha per
season in Uganda compared to USD 152 in Kenya. In contrast, net returns when using local
varieties are higher in Kenya (USD 84/ha per season) than in Uganda (USD 3).
The adoption of released varieties in various districts has been heavily influenced by market
preferences. There is high adoption of Tigoni (38% of households in the district), an improved
white skinned variety, in Nyandarua district, an area predominantly growing a local variety which
is white-skinned, Nyayo (54%). In contrast, a well defined market and a premium price for
medium sized red skinned potatoes exist in Meru Central. Consequently, the adoption of
available improved white-skinned varieties has been challenged by local varieties that answer
this specific market demand more precisely and thus fetch higher prices. Although there has
been some adoption of an improved red-skinned variety, Asante (22% of households in the
vii
district), the more profitable local red-skinned variety, Ngure, has remained predominant in the
district (67% of households producing). In Uganda, Victoria (the same variety as Asante in Kenya),
has been highly adopted (44%) due to its preferred characteristics: high yielding, early maturity
and marketability. Victoria has even replaced other improved varieties, such as Cruza (17%) and
Rutuku (10%), both considered to be more tolerant to late blight than Victoria. Results indicate
that market demand must be a critical component in variety development, release and extension.
It also stresses the importance of promoting improved varieties amongst consumers, traders and
producers, rather than on the producer side alone.
Farmers underestimate the possible economic losses incurred through improper use of
fungicides and are not aware of the health risk posed to them and their families from fungicide
use. This leads to farmers underestimating the actual benefits of adopting late blight resistant
varieties in the two countries.
The adoption of improved varieties is higher in Uganda than in Kenya. This may partly be
explained by the higher economic benefit of adopting improved varieties in Uganda compared
to Kenya and partly explained by the existence of superior seed systems in Uganda in the past 15
years. In spite of an average yield gain of 0.97t/ha in Kenya for farmers using improved varieties
compared to local varieties. Interpreted at face value this might suggest that, farmers in Meru
Central do not increase profits by adopting improved varieties as they receive a lower price on
the market than local varieties, but additional analysis using multivariate analysis is necessary to
distinguish the effect of varietal change from other confounding factors such as differences in
input use or differences in environmental factors between farmers growing improved and local
varieties. In Nyandarua farmers growing improved varieties earned USD 204/ha per year more
than those growing local varieties. The average yield gain of 2.7t/ha from adoption of improved
varieties in Uganda earns farmers an extra USD 358/ha per year, a large economic contribution to
smallholder household income. Not surprisingly, over 60% of farmers in Uganda use improved
varieties. In Uganda seed renewal rates by farmers were higher than in Kenya as was the
availability and use of high quality seed. This may also have contributed to the higher adoption of
improved varieties in Uganda.
viii
Acknowledgements This study is the outcome of collaborative field work between the National Potato Research
Centre of the Kenya Agricultural Research Institute (KARI-Tigoni), the Kachwekano Zonal
Agricultural Research and Development Institute (KAZARDI), which is part of the National
Agricultural Research Organization of Uganda, the Ministries of Agriculture in Kenya and Uganda
and the International Potato Centre (CIP). Special thanks go to Director of KARI-Tigoni, Dr. Jackson
Kabira and the manager of KAZARDI, Imelda Kashaija, for the logistic support provided. We also
wish to thank Rogers Kakuhenzire, Fredrick Nabimba and Innocent Uzatunga of KAZARDI,
Uganda for their valuable field and professional support. Finally but not the least, we wish to
thank Pamela Ochungo, an ILRI GIS analyst for her contribution in map work at planning and
writing stage and all the enumerators and farmers in Kenya and Uganda who participated in this
study. We would also like to recognize the Regional Potato and Sweetpotato Improvement
Program for Eastern and Central Africa (PRAPACE) for its important role of promoting improved
potato varieties in the region and providing technical assistance during the write-up. The study
was jointly funded by IFAD and CIP’s Impact Enhancement Division.
C I P W O R K I N G P A P E R S O C I A L S C I E N C E S 2 0 0 8 - 5
A D O P T I O N O F P O T A T O V A R I E T I E S I N K E N Y A A N D U G A N D A
1
Farmer practices and adoption of improved potato varieties in Kenya and Uganda
INTRODUCTION
Potato production in Kenya and Uganda The potato (Solanum tuberosum) is a staple food for many rural and urban families of East Africa.
There is a growing trade in potatoes to supply the fast growing cities and towns with cheap
staple food, and to satisfy the demand of the growing fast industry. 60-65% of the fresh potatoes
supplied by urban traders in Kenya is processed in restaurants and street stalls (ECAPAPA et al.,
2005; Kirumba et al, 2004).
According to 2005 FAO statistics, Ugandan potato production of 585,000t from 86,000 ha and
Kenyan production of 980,000t from 120,000 ha, indicate national average yields of about 7- 8t/
ha for the two countries (Appendix 1). This is low compared to the 25t/ ha that can be attained by
progressive farmers under rainfed conditions (Kinyae et al, 2004; Low, 2000; Aliguma, 2002). This
yield gap can be attributed to high incidences of diseases, particularly late blight and bacterial
wilt, the use of low quality seed potatoes degenerated by viruses, inadequate soil fertility
management and poor general crop husbandry.
In Kenya, potato production is concentrated in the highlands (1500-3000m) of Central, Eastern
and Rift valley provinces, in the districts lying on the Mau escarpment, the Aberdare range, and
the edges of the rift valley and the slopes of Mt. Kenya. Based on geographic location, production
practices and variety preferences potato growing areas are divided into five regions:
Mt. Kenya, mainly comprising Meru CentralMeru Central, and parts of Nyeri and Laikipia
districts;
Aberdares and Eastern Rift Valley, mainly comprising of Nyandarua and parts of Nyeri,
Kiambu and Nakuru districts;
Mau, comprising Bomet, Narok and parts of Nakuru district;
Mt. Elgon, comprising Keiyo and Marakwet districts;
Others highlands, such as Taita in Taita Taveta in the southern border which have also
started growing potatoes on a commercial basis (Appendix 5).
C I P W O R K I N G P A P E R S O C I A L S C I E N C E S 2 0 0 8 - 5
A D O P T I O N O F P O T A T O V A R I E T I E S I N K E N Y A A N D U G A N D A
2
In Uganda, potatoes have traditionally been grown in the highland areas, which include Kabale
and Kisoro districts of south western Uganda that produce the bulk of the potatoes and Mbale
and Kapchorwa districts on the slopes of Mt. Elgon (Appendix 6). Kabale district alone produces
60% of the potatoes consumed in Uganda, although there has been growing interest in
cultivation of potatoes in other districts.
C I P W O R K I N G P A P E R S O C I A L S C I E N C E S 2 0 0 8 - 5
A D O P T I O N O F P O T A T O V A R I E T I E S I N K E N Y A A N D U G A N D A
3
Importance of late blight Late blight caused by the fungus Phytophthora infestans can devastate a potato crop (Stewart
and Bradshaw, 2001). Global estimates of economic damage as a result of yield losses and
management costs of late blight in developing countries are estimated at $3 billion annually
(Baker et al., 2004; CIP, 20071). The magnitude of losses of potato caused by late blight in African
countries can range from 30 to 75% on susceptible varieties (Olanya et al., 2001; Njuguna et al.,
1998). According to Nyakanga et al (2003) farmers lose up to 30% of potatoes due to late blight,
with Meru Central farmers encountering even higher loses.
Due to high late blight pressure in the highland tropics, some farmers apply fungicides more than
ten times per growing season (Namanda, 2004). Nyankanga et al (2004) estimated that 98% of
potato farmers in Meru Central, Mount Elgon and Njabini division, Kenya rely on fungicides to
protect their potato crop against late blight, with an average of 5 sprays per season. The most
used fungicides are Ridomil, containing the systemic fungicide Metalaxyl as well as the contact
fungicide, Mancozeb and different brands of Mancozeb alone, of which Dithane M45 is most used
(Nyankanga et al., 2004).
In Uganda, after potato was introduced by colonial administrators before mid 1900s, it rapidly
spread in the highland areas as a garden crop, but was practically wiped out by late blight in 1946
(Akimanzi, 1982). Potato was later re-established through introduction of seeds from Kenya but
yields have remained low due to lack of suitable varieties, poor agronomic practices, and disease
problems. In Uganda late blight has remained an important constraint affecting level of
production across the districts (Aliguma, 2002; Low, 2000 and Akimanzi 1982).
Investment in potato improvement During the past 20 years Kenya Agricultural Research Institute (KARI) in Kenya and National
Agricultural research Organization (NARO) in Uganda, in collaboration with International Potato
Center (CIP) and Regional Potato and Sweetpotato Improvement Program for Eastern and Central
Africa (PRAPACE) have released several improved potato varieties (Table 1). Most of the released
varieties have late blight resistance to help farmers reduce losses to the disease (Olanya et al.,
2001; El-Bedewy et al, 2001; 1995, Kakuhenzire et al., 2004).
In 1987 Uganda joined the PRAPAC (Programme Regional d’Amelioration de la Culture de la
Pomme de Terre en Afrique Centrale) network which has been instrumental in revival and
strengthening of Uganda National Potato Research and Development Program. PRAPAC was
1 http://www.cipotato.org/potato/pests_diseases/late_blight (April, 2007)
C I P W O R K I N G P A P E R S O C I A L S C I E N C E S 2 0 0 8 - 5
A D O P T I O N O F P O T A T O V A R I E T I E S I N K E N Y A A N D U G A N D A
4
founded in 1982 by the national research institutes of Burundi, Rwanda and Zaire to link their
potato programs. Ethiopia and Kenya joined the network in 1992 which became PRAPACE and
included sweetpotato in its programs. When Eritrea joined the network in 1995 it became a
regional research network covering all ASARECA member countries.
In Kenya one of the oldest varieties is Kerr’s Pink, which was introduced in 1927 and was still
widely grown in 1992 (Crissman et al., 1993). The more recently released varieties Tigoni (CIP
381381.13) and Asante (CIP 381381.20) (Table 1) possess useful levels of late blight resistance. The
two siblings were released to farmers in 1998 for their high yields and good quality traits, and
superiority in late blight resistance compared to local varieties. Dissemination of the two varieties
commenced in 1999 (KARI, 2004).
Table 1. Varieties released by KARI and NARO, 1927 to 2006.
Variety release by KARI, Kenya Variety released by NARO, Uganda Variety name Year of release Variety name Year of release
Kerr's Pink 1927 Rutuku (Uganda 11) 1972 Dutch Robyjn 1945 Malirahinda 1972 Rosline Eburu 1953 Makerere 1974 Annet 1972 Rosita 1974 Desiree 1972 Kenya Baraka 1977 Feldeslohn 1972 Sangema* 1989 Kenya Baraka 1973 Cruza * 1989 Roslin Gucha 1974 Victoria* 1991 Roslin Ruaka 1974 Kabale* 1991 Roslin Tana 1974 Kisoro* 1991 Roslin Bvumbwe 1974 NAKPOT-1* 1999 Kenya Chaguo 1988 NAKPOT-2* 1999 Kenya Dhamana* 1988 NAKPOT-3* 1999 Asante* 1998 NAKPOT-4* 2003 Tigoni* 1998 NAKPOT-5* 2003 Kenya-Sifa*p 2003 KACHPOT1* 2006 Kenya-Karibu*p 2003 KACHPOT2* 2006 Kenya-Mavuno*p 2003 Kenya-Faulu*p 2003
* Variety developed in collaboration with CIP p Pre-released- hence had only been accepted as variety but would be officially released once KARI bulked sufficient seed stock
A Potato Improvement Program for Uganda was initiated in 1968 by Makerere University College
and the Ministry of Agriculture with support from Rockefeller Foundation. The program objective
was the development of potato varieties with multi-gene resistance to late blight (horizontal
resistance). By 1974, a number of varieties were released in Kabale and Kisoro (USAID, 1994), of
which Rutuku (CIP 720097) is among those still being grown today. However, due to civil war the
C I P W O R K I N G P A P E R S O C I A L S C I E N C E S 2 0 0 8 - 5
A D O P T I O N O F P O T A T O V A R I E T I E S I N K E N Y A A N D U G A N D A
5
continuity and success of the program was interrupted affecting potato production in the
country. The Ugandan program released other high-quality varieties in late 1980s and early 1990s
which include Cruza (CIP 720108), Victoria (CIP 381381.2), Kisoro (CIP 381379.9), and Kabale (CIP
374080.5) and some are still being grown (Table 1), while the latest varieties were released from
1999 until 2006.
CIP and its partners have invested in development and promotion of high yielding and late blight
resistant varieties for a long time. This study aims firstly at documenting the economic impact of
these efforts on the potato sectors of Kenya and Uganda. Secondly, CIP and its partners hope to
draw lessons from this study in regard to the effectiveness of variety development and
promotion strategies in both countries. Thirdly, the key factors for successful variety introduction
will be identified to be fed back to the potato breeding and variety selection programs of CIP and
its research partners.
C I P W O R K I N G P A P E R S O C I A L S C I E N C E S 2 0 0 8 - 5
A D O P T I O N O F P O T A T O V A R I E T I E S I N K E N Y A A N D U G A N D A
6
METHODOLOGY
Data collection took place between 10 and 29 October 2005 and between 1 and 25 November
2005 in Kenya and Uganda respectively. In each country two major potato producing districts
were selected for the study. The districts were selected as representative of the potato sector of
the countries, on the basis of a rapid appraisal that was executed before the final design of the
study (Kaguongo et al 2005a; Kaguongo et al 2005b). In both countries a stratified sampling
frame was used with sub-locations (parishes) and villages randomly selected within potato
growing areas, and farmers were randomly selected in each village and interviewed by
enumerators in dominant local language in a single visit. A structured questionnaire was drafted
in collaboration with socio-economists, agronomists and plant pathologists from CIP, KARI
(Kenya) and NARO (Uganda) and pre-tested with 20 farmers in each country. The questionnaire
was then revised and refined using feedback from the field to help capture late blight
management, variety choices, production levels, seed potato management, agronomic practices
and potato production economics of the farmers (Appendix 7).
Sampling in Kenya Nyandarua and Meru Central districts, which represent other potato growing districts in terms of
varieties grown and management practices, were selected for the study. In Meru Central district,
the 3 main potato producing divisions were sampled. All 15 locations in these divisions were
included in the study. Seventeen sub-locations, representing 50% of the total 33 sub-locations in
sample area were randomly selected. One village was sampled randomly per sub-location. A list
of all farmers in the village was obtained from a village elder from which 6 farmers were randomly
sampled. In Nyandarua district all divisions with their 20 locations were included in the study.
About half (26) of 55 potato producing sub-locations were selected at random, from which a
single village was sampled in which 6 farmers were selected randomly. Out of the 258 randomly
selected farmers 251 were successfully interviewed.
Sampling in Uganda Kabale and Kisoro districts being the major potato producing districts in the country were
selected for this study. All the 4 counties and the 25 potato producing sub-counties in Kabale and
Kisoro districts were included in the study. One parish was randomly selected from each sub-
county and one village randomly selected within each parish. A list of all farmers in the village
was then obtained from a village elder and 6 farmers were sampled randomly for interviewing.
Out of the 150 farmers sampled 144 were successfully interviewed.
C I P W O R K I N G P A P E R S O C I A L S C I E N C E S 2 0 0 8 - 5
A D O P T I O N O F P O T A T O V A R I E T I E S I N K E N Y A A N D U G A N D A
7
Analytical tools Descriptive statistics are used to describe households, potato production, marketing, utilization
and level of adoption of improved varieties. Benefits and cost are used to analyze gains from
adoption of improved varieties in the two countries. Gains emanating from savings in costs of
inputs and labor used and increased yields due to adoption of improved varieties are evaluated
using net returns.
Definitions Improved potato varieties
Potato varieties that have been developed or cleaned up for diseases by CIP in collaboration with
National research stations since 1970 and are considered to be superior in qualities such as yields,
resistance to diseases, dormancy period, maturity period or taste as compared to ‘local’ or
existing varieties.
Improved varieties also include those varieties originating from trials conducted by NARS and
selected and adopted by farmers because of their superior qualities but have not been out with
the farmers for more than 35 years.
Local potato varieties
Varieties with the farmers whose origin is unknown or varieties released by NARS but have been
out with the farmers for more than 35 years without being cleaned up for diseases.
C I P W O R K I N G P A P E R S O C I A L S C I E N C E S 2 0 0 8 - 5
A D O P T I O N O F P O T A T O V A R I E T I E S I N K E N Y A A N D U G A N D A
8
RESULTS AND DISCUSSION
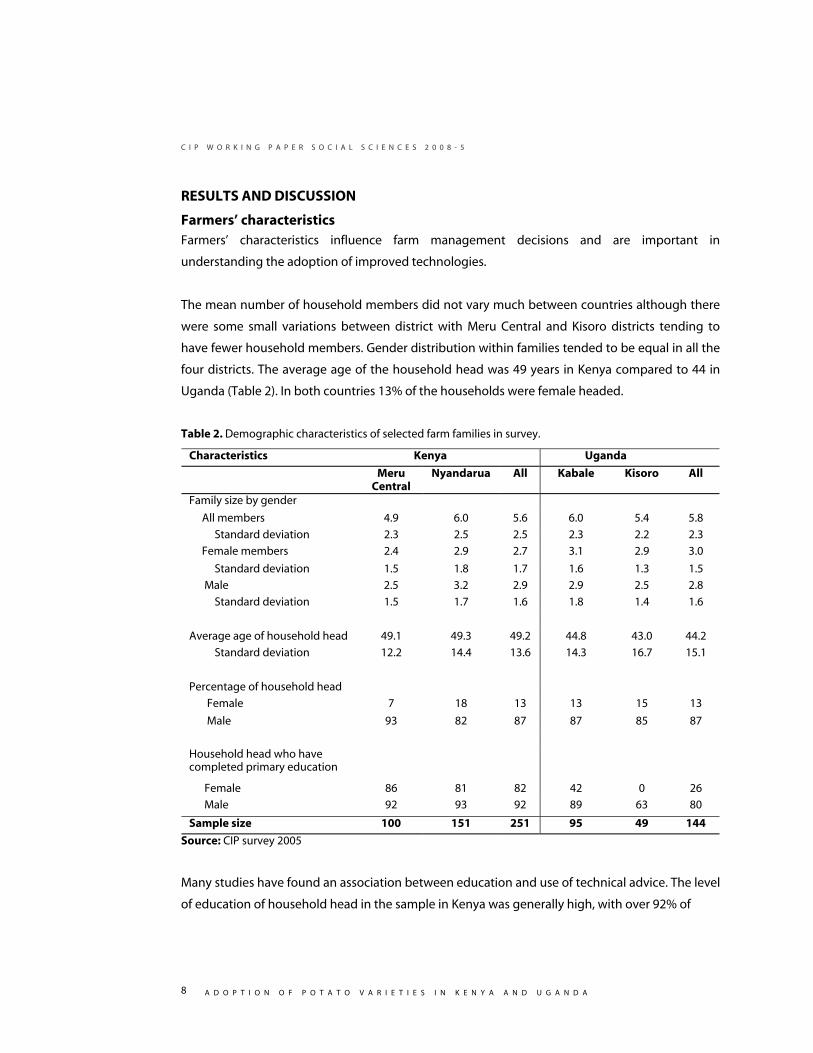
Farmers’ characteristics Farmers’ characteristics influence farm management decisions and are important in
understanding the adoption of improved technologies.
The mean number of household members did not vary much between countries although there
were some small variations between district with Meru Central and Kisoro districts tending to
have fewer household members. Gender distribution within families tended to be equal in all the
four districts. The average age of the household head was 49 years in Kenya compared to 44 in
Uganda (Table 2). In both countries 13% of the households were female headed.
Table 2. Demographic characteristics of selected farm families in survey.
Characteristics Kenya Uganda
Meru Central
Nyandarua All Kabale Kisoro All
Family size by gender
All members 4.9 6.0 5.6 6.0 5.4 5.8
Standard deviation 2.3 2.5 2.5 2.3 2.2 2.3
Female members 2.4 2.9 2.7 3.1 2.9 3.0
Standard deviation 1.5 1.8 1.7 1.6 1.3 1.5
Male 2.5 3.2 2.9 2.9 2.5 2.8
Standard deviation 1.5 1.7 1.6 1.8 1.4 1.6
Average age of household head 49.1 49.3 49.2 44.8 43.0 44.2
Standard deviation 12.2 14.4 13.6 14.3 16.7 15.1
Percentage of household head
Female 7 18 13 13 15 13
Male 93 82 87 87 85 87
Household head who have completed primary education
Female 86 81 82 42 0 26
Male 92 93 92 89 63 80
Sample size 100 151 251 95 49 144
Source: CIP survey 2005
Many studies have found an association between education and use of technical advice. The level
of education of household head in the sample in Kenya was generally high, with over 92% of

C I P W O R K I N G P A P E R S O C I A L S C I E N C E S 2 0 0 8 - 5
A D O P T I O N O F P O T A T O V A R I E T I E S I N K E N Y A A N D U G A N D A
9
male and 82% female household heads having completed primary school. In Uganda 80% of the
male household heads completed basic education, but only 26% of the female household heads.
In Kisoro none of the female household heads had completed basic education.
Asset ownership
Cattle were important mainly in Kenya while small ruminants were important in both Kenya and
Uganda. About 90% of households in Kenya had cattle compared to only 33% in Uganda (Table
3). Seventy-two percent of households in Kenya and 67% households in Uganda owned small
ruminants (sheep and goat). Other livestock owned include pigs which are kept by 16% of sample
farmers in Uganda, and donkeys kept only by 14 % of the farmers in Nyandarua, Kenya. On
average Kenyan farmers had higher Tropical livestock unit (TLU) 2 compared to Ugandan farmers,
indicating more manure could be available from their own herd. Livestock are mainly kept for
milk production, consumption, sale and also as a saving and especially to mitigate risks of arable
farming (Ashley and Nanyeenya, 2002). In the mixed crop-livestock production systems of the
study areas livestock are also important as a source of manure and draft power for ploughing and
ox-cart pulling.
A bicycle is the most common equipment and is owned by 53% and 46% of Kenyan and Ugandan
sample farmers, respectively. Both ox-plough and ox-carts are only important in Kenya with only
10% and 12% of farmers, respectively owning them. Ox-carts and bicycles are important sources
of transportation for humans and farm produce in rural areas while ox-plough provides a more
efficient and affordable means of ploughing land.
Overall average farm sizes and cultivated areas of the sample farmers were relatively similar for
the two countries. In Meru Central district land pressure is much higher than in Nyandarua, with
1.3 and 2.1 ha per household respectively. In Uganda land pressure in Kisoro is slightly higher
than in Kabale with an overall average of 1.6 ha available per household.
Income from crop sales represented over 80% of total household income in Uganda (Table 4). In
Kenya crops contributed about 51% of total income while livestock and remittances contributed
28% and 16% respectively. This shows that in both countries at least 80% of farmers’ income from
the two countries was farm dependent although farmers from Kenya depended more on
livestock than those in Uganda. Surprisingly, off-farm income was not important, and contributed
only 3% at most.
2 Tropical livestock unit (TLU) is equivalent to 250 kg live weight as defined by Food and Agriculture Organization of the United Nations (FAO) .

C I P W O R K I N G P A P E R S O C I A L S C I E N C E S 2 0 0 8 - 5
A D O P T I O N O F P O T A T O V A R I E T I E S I N K E N Y A A N D U G A N D A
10
Table 3. Asset ownership of selected households by districts.
Asset type Kenya Uganda
Meru Central
Nyandarua All Kabale Kisoro All
Livestock holdings
Percentage of household owning
Cattle 93 89 90 37 25 33
Small ruminants 69 74 72 63 75 67
Pig 2 0 1 18 6 16
Donkeys 0 14 8 0 0 0
Tropical livestock Unit (TLU) 2.6 3.3 3.0 1.1 0.5 0.9
Standard deviation 2.7 2.5 2.6 1.4 0.7 1.3
Median 1.9 2.4 2.2 0.5 0.2 0.4
Equipment
Percent household owning
Ox-plough 20 3 10 1 0 1
Ox-cart 14 11 12 1 0 1
Bicycle 31 67 53 49 40 46
Land ownership
Average farm size (ha) 1.3 2.1 1.8 1.7 1.4 1.6
Standard deviation 1.2 2.0 1.8 1.6 1.0 1.4
Median 0.9 1.6 1.2 1.2 0.8 1.2
Average cultivated area (ha) 1.0 1.4 1.2 1.3 1.1 1.2
Standard deviation 0.8 1.4 1.2 1.4 0.7 1.2
Median 0.8 0.9 0.8 0.9 0.8 0.8
Sample size 100 151 251 95 49 144
Source: CIP survey 2005

C I P W O R K I N G P A P E R S O C I A L S C I E N C E S 2 0 0 8 - 5
A D O P T I O N O F P O T A T O V A R I E T I E S I N K E N Y A A N D U G A N D A
11
Table 4. Most important income sources (%).
Source Kenya Uganda
Meru Central
Nyandarua All Kabale Kisoro All
Crop sale 55 48 51 80 88 82 Animals and animal products 18 36 28 8 2 6
Remittances 18 15 16 12 8 11 Other on-farm incomes 8 2 4 1 0 1 Off-farm income 3 1 2 1 3 1
Sample size 100 151 251 95 49 144
Source: CIP survey 2005
Farming systems
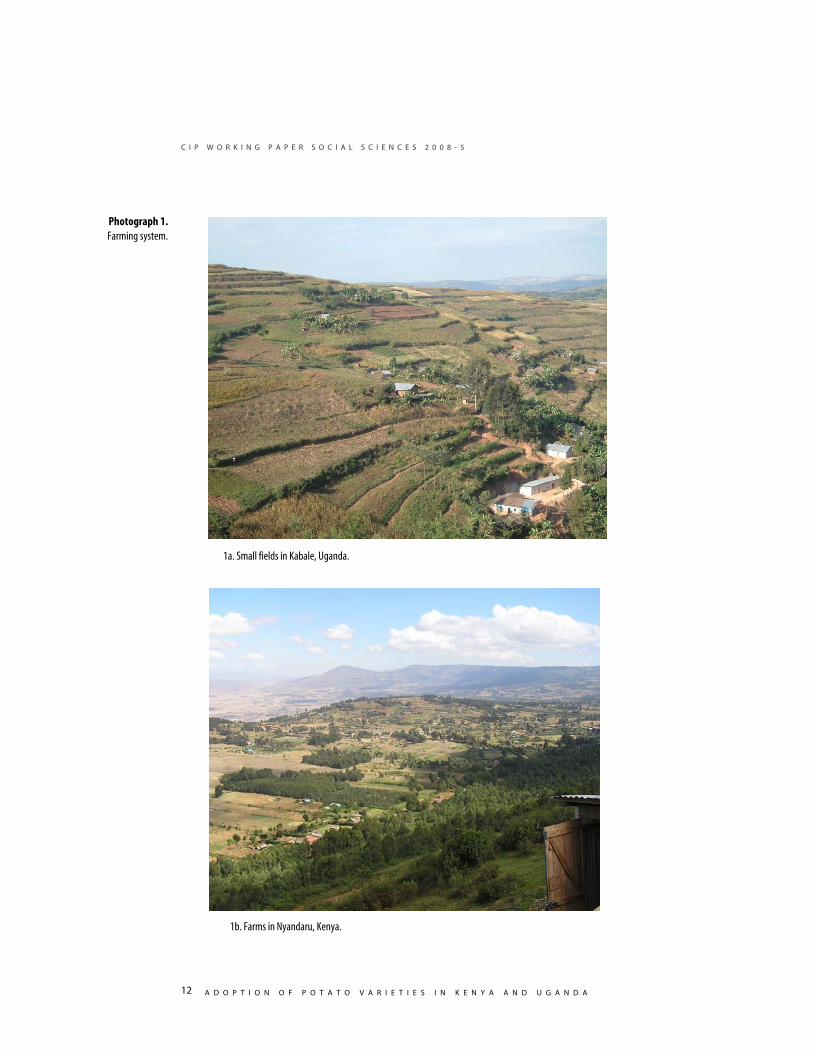
In all four districts there is a bi-modal rainfall pattern and farmers are able to produce at least two
rainfed crops a year. However, there is considerable off-season farming in Meru Central and
Kabale to fetch higher prices. In Kabale off-season farming is most notable in the swampy valley
bottoms that have been reclaimed, while some farmers in Meru Central use irrigation to enable
off-season farming (see Photograph 1).
Irrigation water is important in crop production especially where rain water is not adequate, is
unreliable and where farmers want to synchronize harvesting with high prices in the market.
Meru Central district in Kenya is distinctly different from the other sample areas as 72% of farmers
produced some crops under irrigation while only about 7%, 11% and 8% used irrigation in
Nyandarua, Kabale and Kisoro districts, respectively. About half of the farmers in Meru Central
district used irrigation for potato production, irrigating about two-thirds of their area under
potato. Sprinkler irrigation is the most common form of irrigation in Kenya while the few farmers
irrigating in Uganda mainly use hand watering, drip or surface irrigation.
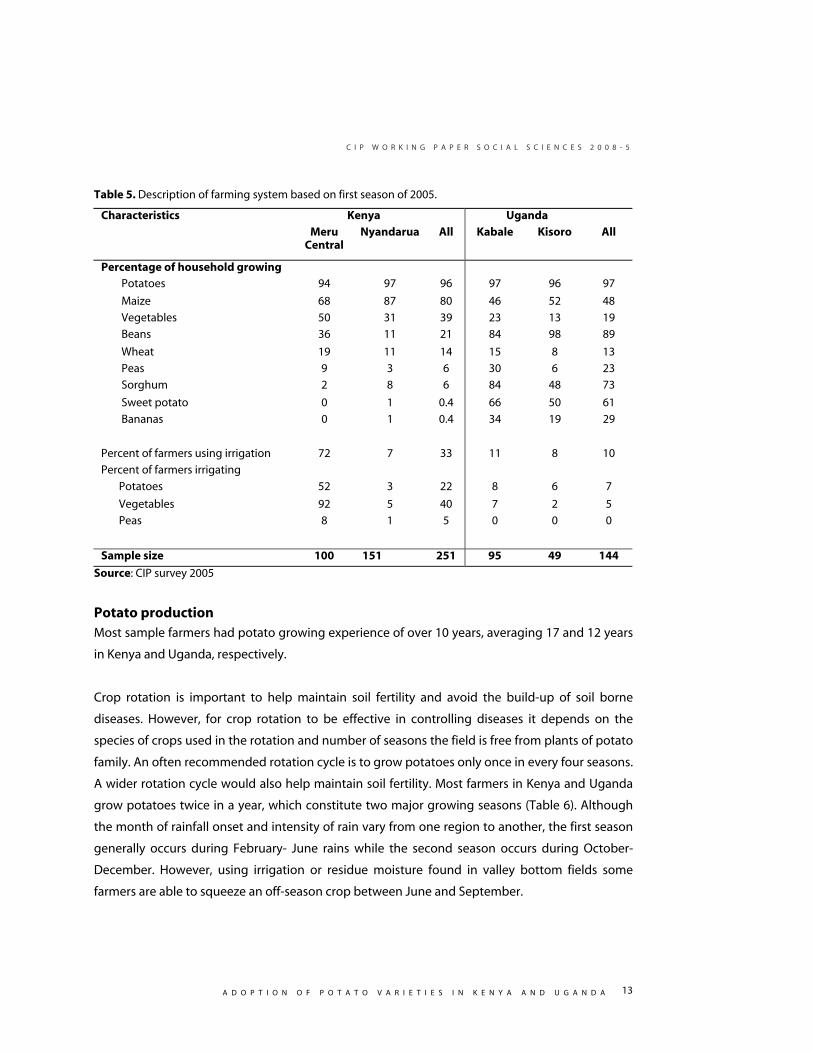
The sample farmers produced a variety of crops ranging from tuber crops to cereals and legumes.
Potato was the most frequently grown crop, being grown by all farmers sampled although a few
did not have potato in the field during the considered season due to rotation (Table 5). Maize was
the second most important crop in Kenya, followed by vegetables. In Uganda the majority of
households sampled were growing beans, sorghum and sweetpotato, while maize is only grown
by slightly less than half of the farmers.
C I P W O R K I N G P A P E R S O C I A L S C I E N C E S 2 0 0 8 - 5
A D O P T I O N O F P O T A T O V A R I E T I E S I N K E N Y A A N D U G A N D A
12
Photograph 1.Farming system.
1a. Small fields in Kabale, Uganda.
1b. Farms in Nyandaru, Kenya.
C I P W O R K I N G P A P E R S O C I A L S C I E N C E S 2 0 0 8 - 5
A D O P T I O N O F P O T A T O V A R I E T I E S I N K E N Y A A N D U G A N D A
13
Table 5. Description of farming system based on first season of 2005.
Characteristics Kenya Uganda
Meru Central
Nyandarua All Kabale Kisoro All
Percentage of household growing Potatoes 94 97 96 97 96 97
Maize 68 87 80 46 52 48
Vegetables 50 31 39 23 13 19
Beans 36 11 21 84 98 89
Wheat 19 11 14 15 8 13
Peas 9 3 6 30 6 23
Sorghum 2 8 6 84 48 73
Sweet potato 0 1 0.4 66 50 61
Bananas 0 1 0.4 34 19 29
Percent of farmers using irrigation 72 7 33 11 8 10
Percent of farmers irrigating
Potatoes 52 3 22 8 6 7
Vegetables 92 5 40 7 2 5
Peas 8 1 5 0 0 0
Sample size 100 151 251 95 49 144
Source: CIP survey 2005
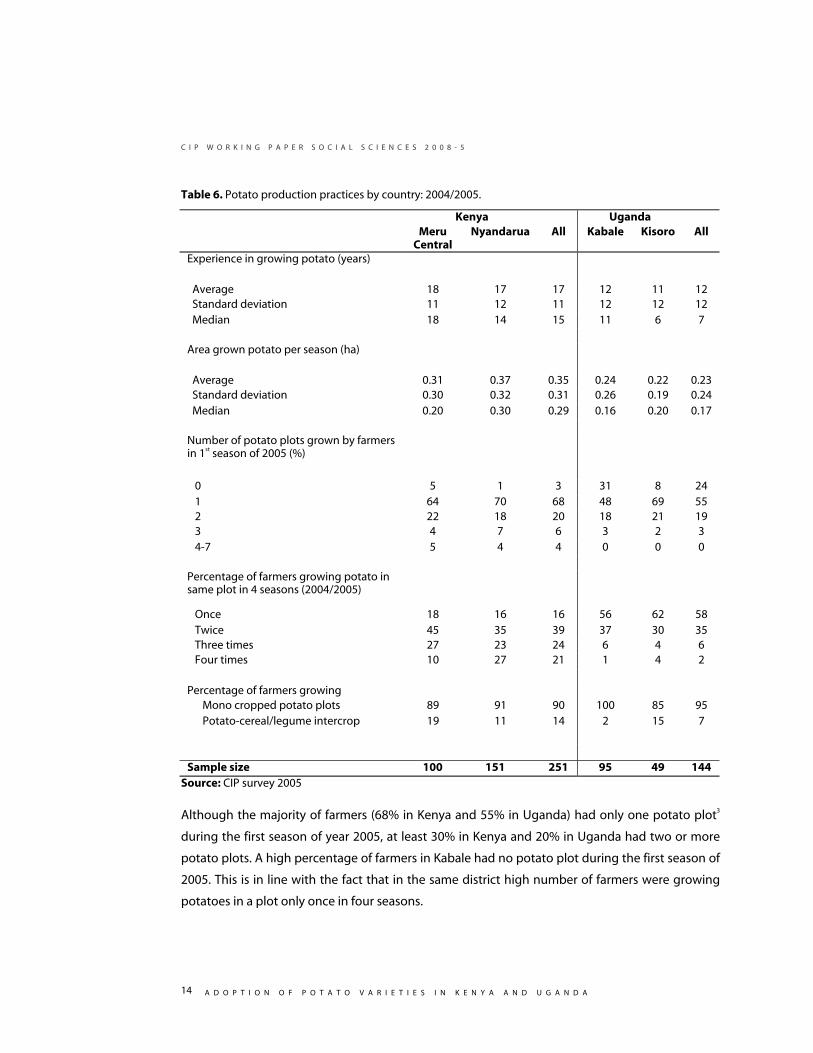
Potato production Most sample farmers had potato growing experience of over 10 years, averaging 17 and 12 years
in Kenya and Uganda, respectively.
Crop rotation is important to help maintain soil fertility and avoid the build-up of soil borne
diseases. However, for crop rotation to be effective in controlling diseases it depends on the
species of crops used in the rotation and number of seasons the field is free from plants of potato
family. An often recommended rotation cycle is to grow potatoes only once in every four seasons.
A wider rotation cycle would also help maintain soil fertility. Most farmers in Kenya and Uganda
grow potatoes twice in a year, which constitute two major growing seasons (Table 6). Although
the month of rainfall onset and intensity of rain vary from one region to another, the first season
generally occurs during February- June rains while the second season occurs during October-
December. However, using irrigation or residue moisture found in valley bottom fields some
farmers are able to squeeze an off-season crop between June and September.
C I P W O R K I N G P A P E R S O C I A L S C I E N C E S 2 0 0 8 - 5
A D O P T I O N O F P O T A T O V A R I E T I E S I N K E N Y A A N D U G A N D A
14
Table 6. Potato production practices by country: 2004/2005.
Kenya Uganda Meru
Central Nyandarua All Kabale Kisoro All
Experience in growing potato (years)
Average 18 17 17 12 11 12 Standard deviation 11 12 11 12 12 12 Median 18 14 15 11 6 7 Area grown potato per season (ha)
Average 0.31 0.37 0.35 0.24 0.22 0.23 Standard deviation 0.30 0.32 0.31 0.26 0.19 0.24 Median 0.20 0.30 0.29 0.16 0.20 0.17 Number of potato plots grown by farmers in 1st season of 2005 (%)
0 5 1 3 31 8 24 1 64 70 68 48 69 55 2 22 18 20 18 21 19 3 4 7 6 3 2 3 4-7 5 4 4 0 0 0 Percentage of farmers growing potato in same plot in 4 seasons (2004/2005)
Once 18 16 16 56 62 58 Twice 45 35 39 37 30 35 Three times 27 23 24 6 4 6 Four times 10 27 21 1 4 2 Percentage of farmers growing Mono cropped potato plots 89 91 90 100 85 95 Potato-cereal/legume intercrop 19 11 14 2 15 7
Sample size 100 151 251 95 49 144
Source: CIP survey 2005
Although the majority of farmers (68% in Kenya and 55% in Uganda) had only one potato plot3
during the first season of year 2005, at least 30% in Kenya and 20% in Uganda had two or more
potato plots. A high percentage of farmers in Kabale had no potato plot during the first season of
2005. This is in line with the fact that in the same district high number of farmers were growing
potatoes in a plot only once in four seasons.
C I P W O R K I N G P A P E R S O C I A L S C I E N C E S 2 0 0 8 - 5
A D O P T I O N O F P O T A T O V A R I E T I E S I N K E N Y A A N D U G A N D A
15
In Kenya 21% of the farmers indicated they grow potatoes in the same plot continuously, with
another 24% indicating to grow potatoes in the same plot 3 out of 4 seasons. Only 55% of the
farmers practice some form of regular rotation, with at least 2 out of four seasons without
potatoes. In Uganda 58% of the farmers indicated they grow potatoes only once in 4 seasons on
the same plot, while in Kenya this was just 16%. However, the effectiveness of the rotation
regimes in avoiding build-up of soil borne diseases is questionable since most farmers do not
remove volunteer plants in the next season as they value the early sprouting volunteers as the
source of early potatoes for home consumption. Although farmers in Kabale and Kisoro can easily
expand their rotation cycle while retaining their current potato acreage, farmers in Meru Central
and Nyandarua cannot expand their rotation cycle while maintaining their current potato
acreages because the total cultivated land is less than four times the mean size of potato area.
Farmers in Kenya had larger areas under potatoes compared to those in Uganda. Nyandarua
district had the highest mean potato area of 0.37 ha while Kisoro had the smallest mean potatoes
area of 0.22 ha per season. Most potatoes were grown as mono crops both in Kenya and Uganda
and only few plots were intercropped with either legumes, cereals or both.
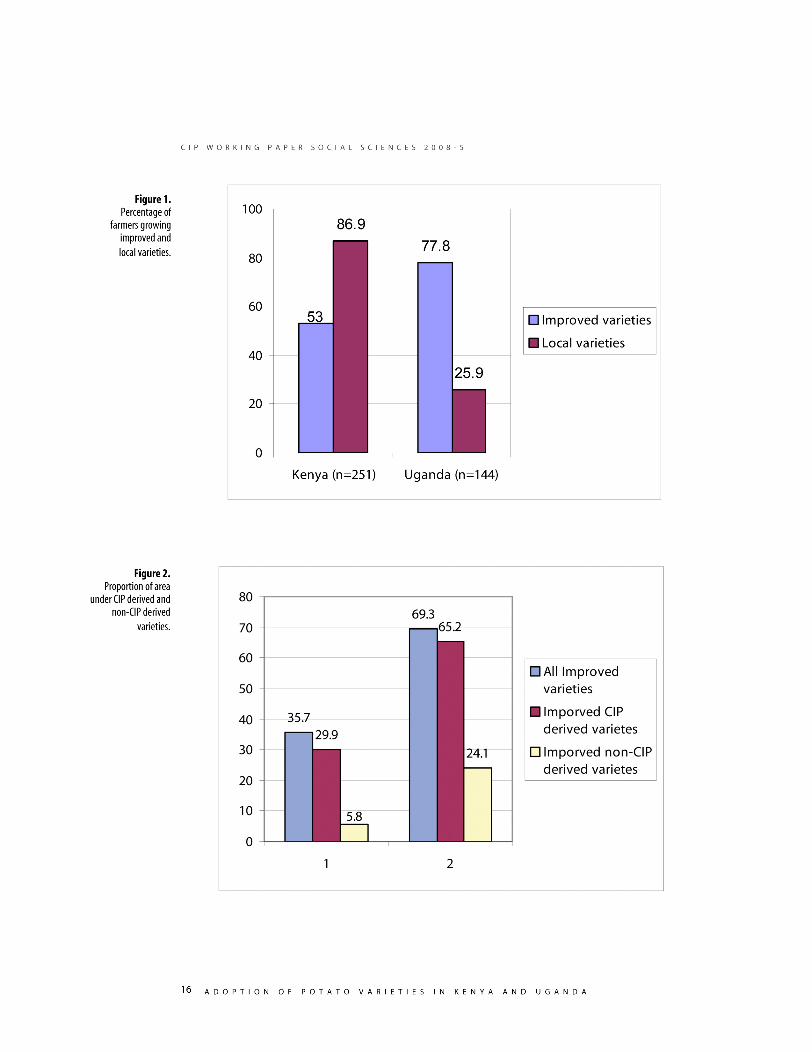
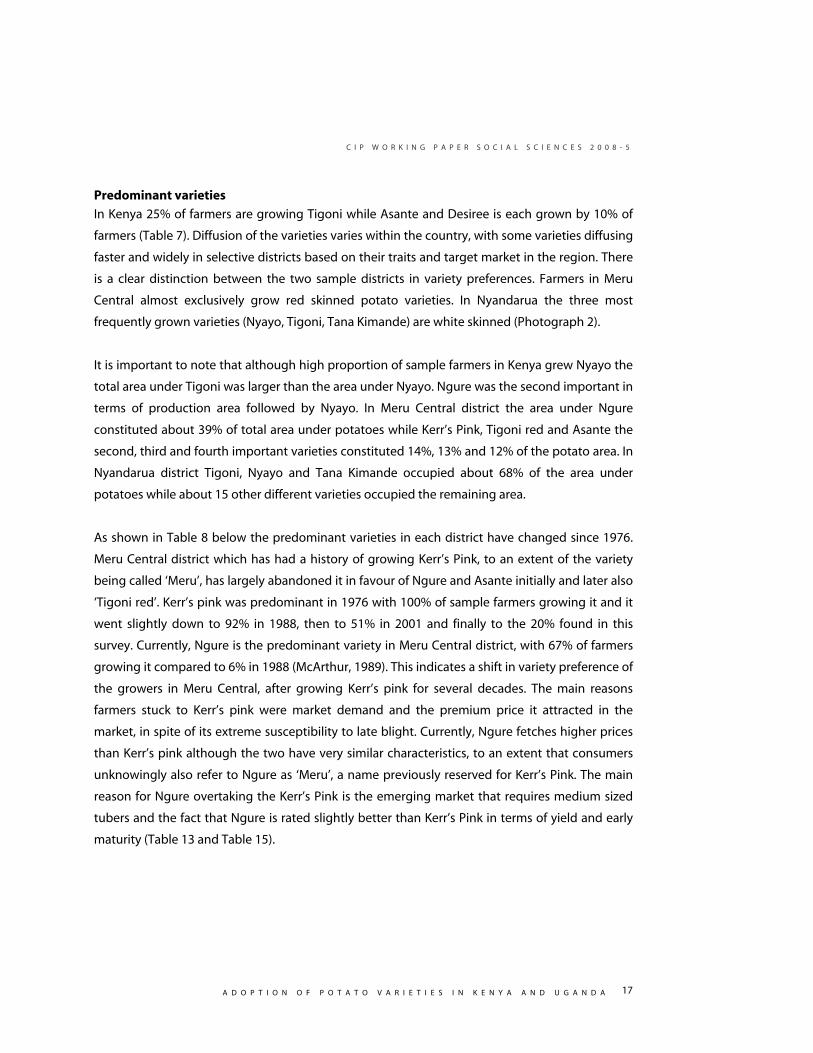
Variety adoption and abandonment Adoption of Improved and CIP derived varieties
The survey clearly indicated that the improved varieties released by national programs have been
widely adopted in both Kenya and Uganda, but more so in Uganda than in Kenya. In Kenya 53.0%
of farmers had adopted improved varieties compared to 77.8% of farmers in Uganda (Figure 1).
Most farmers were growing improved varieties as pure stands although a few farmers were
growing a mixture of improved varieties or a mixture of improved and local varieties. Similarly,
the proportion of area under improved varieties was higher for Uganda compared to Kenya
(Figure 2)4.
However, in both countries CIP derived varieties occupied over 80.0% of the area under improved
varieties. The area under CIP derived varieties in Kenya was 29.9% while in Uganda reached
69.3%.
3 Smallest piece of land grown one or more crops and managed as a single unit. 4 Only pure stands were considered
C I P W O R K I N G P A P E R S O C I A L S C I E N C E S 2 0 0 8 - 5
A D O P T I O N O F P O T A T O V A R I E T I E S I N K E N Y A A N D U G A N D A
17
Predominant varieties
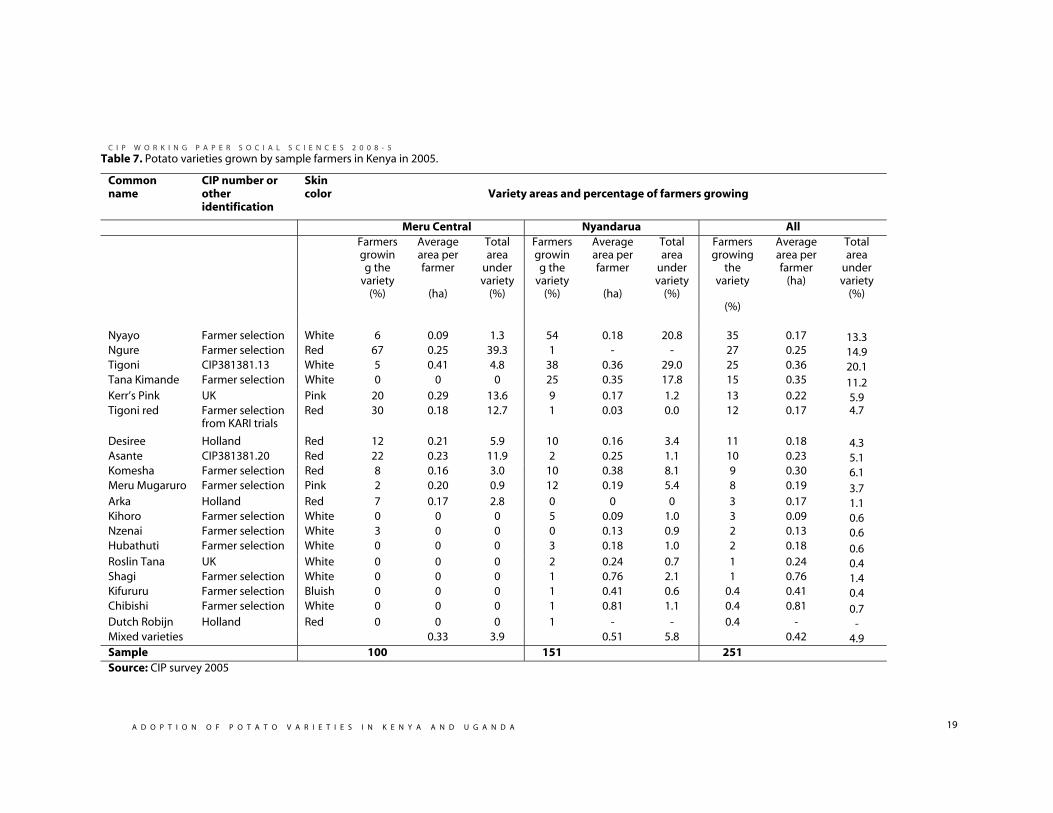
In Kenya 25% of farmers are growing Tigoni while Asante and Desiree is each grown by 10% of
farmers (Table 7). Diffusion of the varieties varies within the country, with some varieties diffusing
faster and widely in selective districts based on their traits and target market in the region. There
is a clear distinction between the two sample districts in variety preferences. Farmers in Meru
Central almost exclusively grow red skinned potato varieties. In Nyandarua the three most
frequently grown varieties (Nyayo, Tigoni, Tana Kimande) are white skinned (Photograph 2).
It is important to note that although high proportion of sample farmers in Kenya grew Nyayo the
total area under Tigoni was larger than the area under Nyayo. Ngure was the second important in
terms of production area followed by Nyayo. In Meru Central district the area under Ngure
constituted about 39% of total area under potatoes while Kerr’s Pink, Tigoni red and Asante the
second, third and fourth important varieties constituted 14%, 13% and 12% of the potato area. In
Nyandarua district Tigoni, Nyayo and Tana Kimande occupied about 68% of the area under
potatoes while about 15 other different varieties occupied the remaining area.
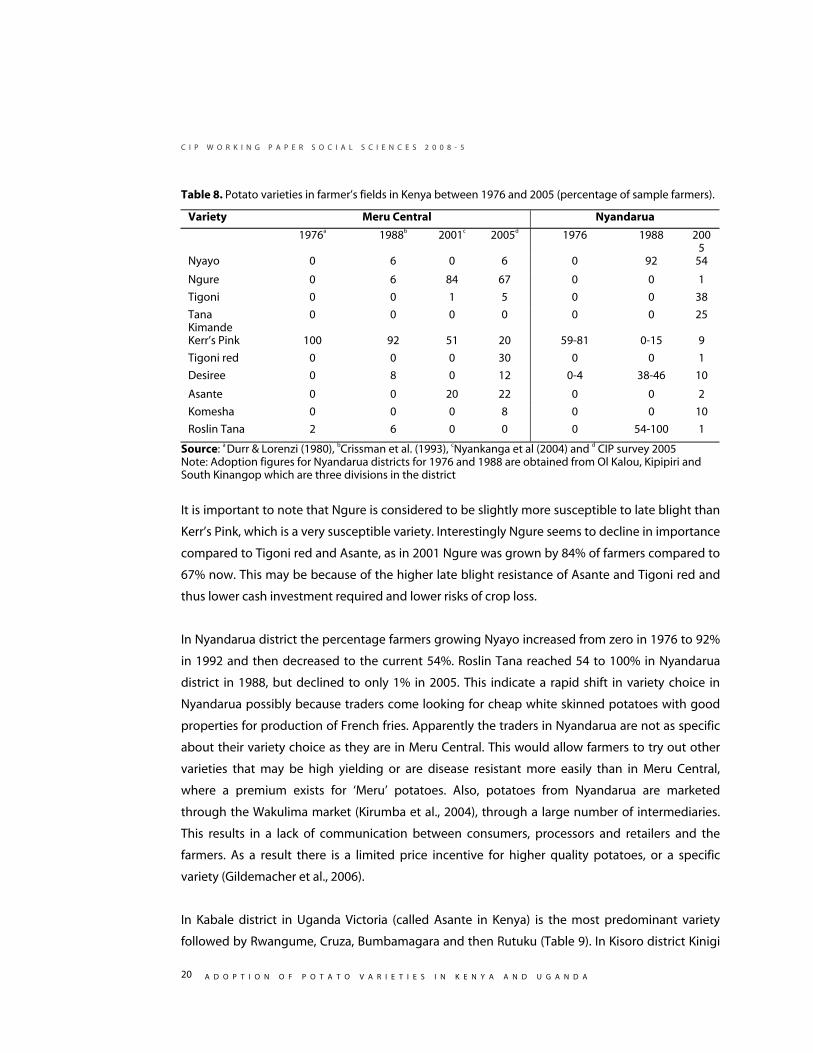
As shown in Table 8 below the predominant varieties in each district have changed since 1976.
Meru Central district which has had a history of growing Kerr’s Pink, to an extent of the variety
being called ‘Meru’, has largely abandoned it in favour of Ngure and Asante initially and later also
‘Tigoni red’. Kerr’s pink was predominant in 1976 with 100% of sample farmers growing it and it
went slightly down to 92% in 1988, then to 51% in 2001 and finally to the 20% found in this
survey. Currently, Ngure is the predominant variety in Meru Central district, with 67% of farmers
growing it compared to 6% in 1988 (McArthur, 1989). This indicates a shift in variety preference of
the growers in Meru Central, after growing Kerr’s pink for several decades. The main reasons
farmers stuck to Kerr’s pink were market demand and the premium price it attracted in the
market, in spite of its extreme susceptibility to late blight. Currently, Ngure fetches higher prices
than Kerr’s pink although the two have very similar characteristics, to an extent that consumers
unknowingly also refer to Ngure as ‘Meru’, a name previously reserved for Kerr’s Pink. The main
reason for Ngure overtaking the Kerr’s Pink is the emerging market that requires medium sized
tubers and the fact that Ngure is rated slightly better than Kerr’s Pink in terms of yield and early
maturity (Table 13 and Table 15).

C I P W O R K I N G P A P E R S O C I A L S C I E N C E S 2 0 0 8 - 5
A D O P T I O N O F P O T A T O V A R I E T I E S I N K E N Y A A N D U G A N D A
19
Table 7. Potato varieties grown by sample farmers in Kenya in 2005.
Common name
CIP number or other identification
Skin color
Variety areas and percentage of farmers growing
Meru Central Nyandarua All Farmers
growing the
variety (%)
Average area per farmer
(ha)
Total area
under variety
(%)
Farmers growing the
variety (%)
Average area per farmer
(ha)
Total area
under variety
(%)
Farmers growing
the variety
(%)
Average area per farmer
(ha)
Total area
under variety
(%)
Nyayo Farmer selection White 6 0.09 1.3 54 0.18 20.8 35 0.17 13.3 Ngure Farmer selection Red 67 0.25 39.3 1 - - 27 0.25 14.9 Tigoni CIP381381.13 White 5 0.41 4.8 38 0.36 29.0 25 0.36 20.1 Tana Kimande Farmer selection White 0 0 0 25 0.35 17.8 15 0.35 11.2 Kerr’s Pink UK Pink 20 0.29 13.6 9 0.17 1.2 13 0.22 5.9 Tigoni red Farmer selection
from KARI trials Red 30 0.18 12.7 1 0.03 0.0 12 0.17 4.7
Desiree Holland Red 12 0.21 5.9 10 0.16 3.4 11 0.18 4.3 Asante CIP381381.20 Red 22 0.23 11.9 2 0.25 1.1 10 0.23 5.1 Komesha Farmer selection Red 8 0.16 3.0 10 0.38 8.1 9 0.30 6.1 Meru Mugaruro Farmer selection Pink 2 0.20 0.9 12 0.19 5.4 8 0.19 3.7 Arka Holland Red 7 0.17 2.8 0 0 0 3 0.17 1.1 Kihoro Farmer selection White 0 0 0 5 0.09 1.0 3 0.09 0.6 Nzenai Farmer selection White 3 0 0 0 0.13 0.9 2 0.13 0.6 Hubathuti Farmer selection White 0 0 0 3 0.18 1.0 2 0.18 0.6 Roslin Tana UK White 0 0 0 2 0.24 0.7 1 0.24 0.4 Shagi Farmer selection White 0 0 0 1 0.76 2.1 1 0.76 1.4 Kifururu Farmer selection Bluish 0 0 0 1 0.41 0.6 0.4 0.41 0.4 Chibishi Farmer selection White 0 0 0 1 0.81 1.1 0.4 0.81 0.7 Dutch Robijn Holland Red 0 0 0 1 - - 0.4 - - Mixed varieties 0.33 3.9 0.51 5.8 0.42 4.9 Sample 100 151 251 Source: CIP survey 2005
C I P W O R K I N G P A P E R S O C I A L S C I E N C E S 2 0 0 8 - 5
A D O P T I O N O F P O T A T O V A R I E T I E S I N K E N Y A A N D U G A N D A
20
Table 8. Potato varieties in farmer’s fields in Kenya between 1976 and 2005 (percentage of sample farmers).
Variety Meru Central Nyandarua
1976a 1988b 2001c 2005d 1976 1988 2005
Nyayo 0 6 0 6 0 92 54
Ngure 0 6 84 67 0 0 1
Tigoni 0 0 1 5 0 0 38
Tana Kimande
0 0 0 0 0 0 25
Kerr’s Pink 100 92 51 20 59-81 0-15 9
Tigoni red 0 0 0 30 0 0 1
Desiree 0 8 0 12 0-4 38-46 10
Asante 0 0 20 22 0 0 2
Komesha 0 0 0 8 0 0 10
Roslin Tana 2 6 0 0 0 54-100 1
Source: a Durr & Lorenzi (1980), bCrissman et al. (1993), cNyankanga et al (2004) and d CIP survey 2005 Note: Adoption figures for Nyandarua districts for 1976 and 1988 are obtained from Ol Kalou, Kipipiri and South Kinangop which are three divisions in the district
It is important to note that Ngure is considered to be slightly more susceptible to late blight than
Kerr’s Pink, which is a very susceptible variety. Interestingly Ngure seems to decline in importance
compared to Tigoni red and Asante, as in 2001 Ngure was grown by 84% of farmers compared to
67% now. This may be because of the higher late blight resistance of Asante and Tigoni red and
thus lower cash investment required and lower risks of crop loss.
In Nyandarua district the percentage farmers growing Nyayo increased from zero in 1976 to 92%
in 1992 and then decreased to the current 54%. Roslin Tana reached 54 to 100% in Nyandarua
district in 1988, but declined to only 1% in 2005. This indicate a rapid shift in variety choice in
Nyandarua possibly because traders come looking for cheap white skinned potatoes with good
properties for production of French fries. Apparently the traders in Nyandarua are not as specific
about their variety choice as they are in Meru Central. This would allow farmers to try out other
varieties that may be high yielding or are disease resistant more easily than in Meru Central,
where a premium exists for ‘Meru’ potatoes. Also, potatoes from Nyandarua are marketed
through the Wakulima market (Kirumba et al., 2004), through a large number of intermediaries.
This results in a lack of communication between consumers, processors and retailers and the
farmers. As a result there is a limited price incentive for higher quality potatoes, or a specific
variety (Gildemacher et al., 2006).
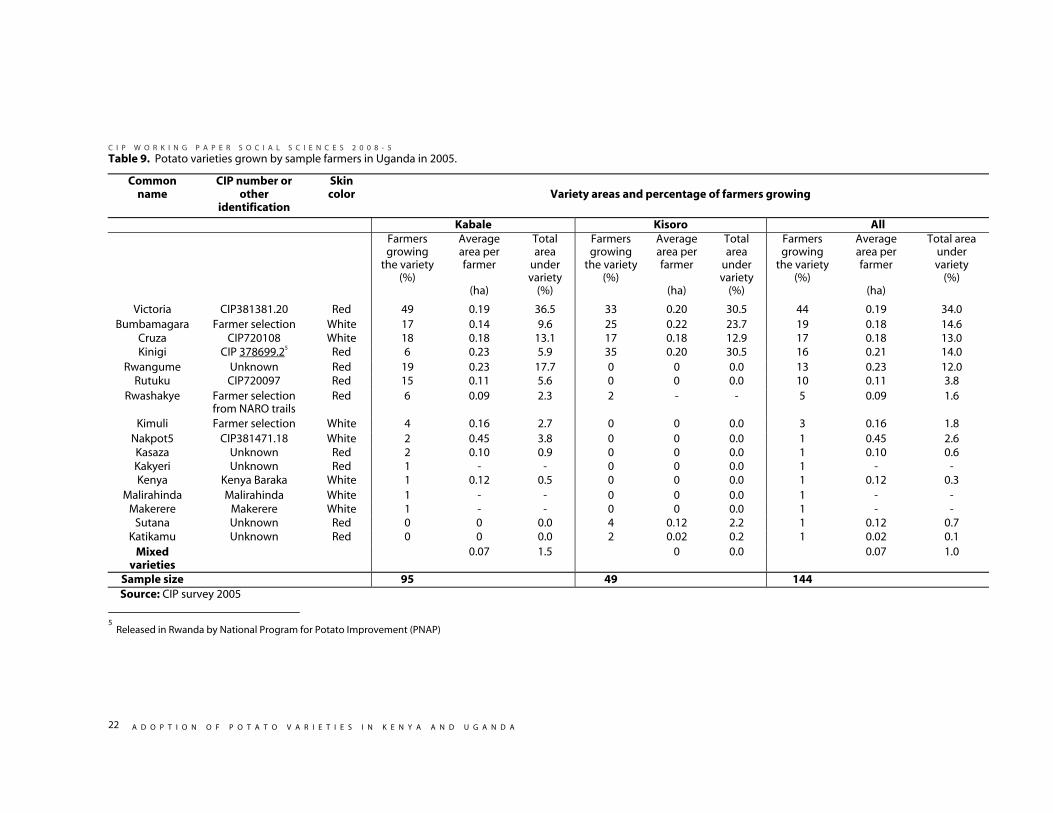
In Kabale district in Uganda Victoria (called Asante in Kenya) is the most predominant variety
followed by Rwangume, Cruza, Bumbamagara and then Rutuku (Table 9). In Kisoro district Kinigi
C I P W O R K I N G P A P E R S O C I A L S C I E N C E S 2 0 0 8 - 5
A D O P T I O N O F P O T A T O V A R I E T I E S I N K E N Y A A N D U G A N D A
21
is the most important variety and is grown by 35% of farmers in the district. The variety draws its
major market from the neighboring country, Rwanda and may be transported as far as Burundi.
Victoria is the second important variety in the district, followed by Bumbamagara and Cruza.
In terms of production area Victoria was most important constituting 34% of total area under
potato production. Respectively, Victoria constituted 36% and 31% of potato area in Kabale and
Kisoro districts. In Kisoro district Kiningi was as important as Victoria and occupied 31% of total
area under production.
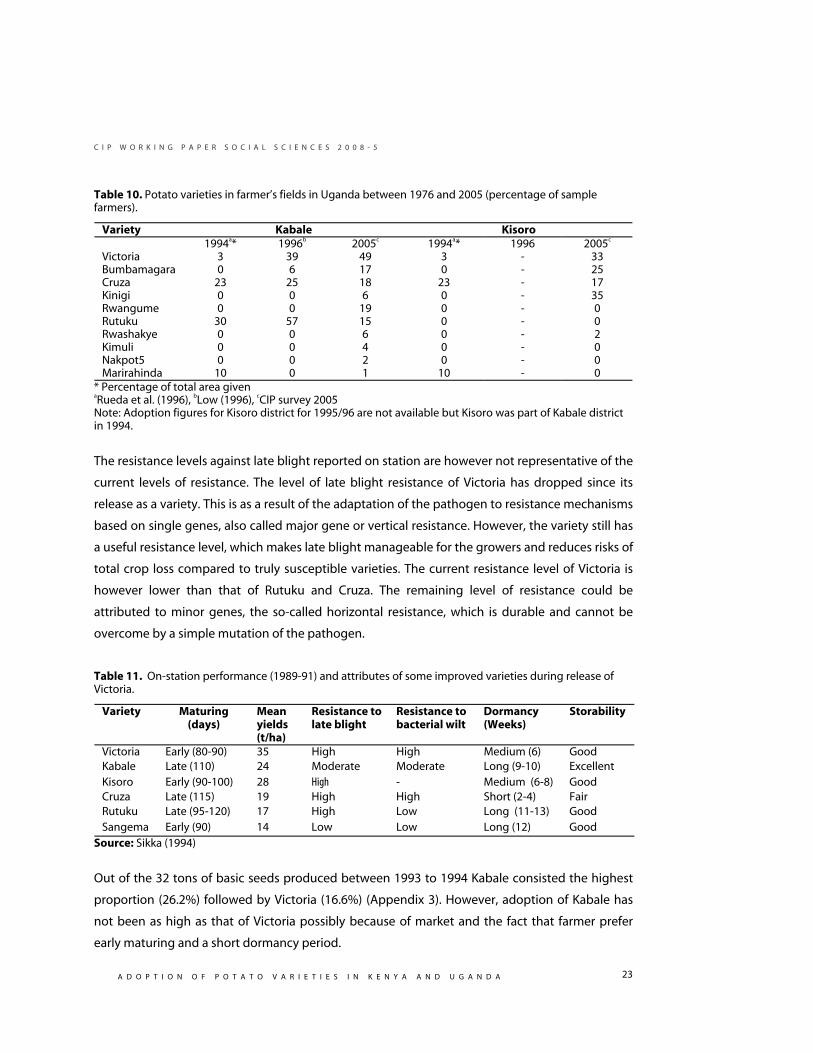
Table 10 below shows there has been a substantial diffusion of Victoria.; Rueda et al. (1996)
estimate the area under Victoria to be 3% in 1994, while Low (2000) estimated 39% of farmers in
the region were growing Victoria in 1995, which had increased at the expense of Rutuku.
Rutuku was grown by 57% of farmers in 1995 compared to current 8%. The decline could be
explained by the fact that farmers perceived Rutuku to be highly susceptible to bacterial wilt and
has a long maturity period (Table 16). The attribute of early maturity in Victoria could also have
contributed to farmers preferring it over Rutuku.
Kinigi, the most frequently grown variety in Kisoro district, was released in Rwanda in 1984 by
National Programme for Potato Improvement (PNAP) (USAID, 1994) and introduced to Uganda by
farmers. Farmers growing Kinigi in Uganda have increased from zero in 1994 to 6% in Kabale and
35% in Kisoro district. The farmers in Kisoro district market these potatoes partly to traders from
Rwanda, through the small border crossing of Cyanika, close to Kisoro town.
According to the on farm trial data presented during the release of Victoria, Kisoro and Kabale in
1991 all the three varieties had high yield potential and useful degree of resistance to late blight
(Table 11) (Sikka, 1994). Screening of bacterial wilt resistance at the National agricultural research
laboratory at Nairobi indicated that Victoria also had high degree of resistance to bacterial wilt
while Kabale was characterized by a moderate degree of resistance (Michieka, 1993).
C I P W O R K I N G P A P E R S O C I A L S C I E N C E S 2 0 0 8 - 5
A D O P T I O N O F P O T A T O V A R I E T I E S I N K E N Y A A N D U G A N D A
22
Table 9. Potato varieties grown by sample farmers in Uganda in 2005.
Common name
CIP number or other
identification
Skin color
Variety areas and percentage of farmers growing
Kabale Kisoro All Farmers
growing the variety
(%)
Average area per farmer
(ha)
Total area
under variety
(%)
Farmers growing
the variety (%)
Average area per farmer
(ha)
Total area
under variety
(%)
Farmers growing
the variety (%)
Average area per farmer
(ha)
Total area under variety
(%)
Victoria CIP381381.20 Red 49 0.19 36.5 33 0.20 30.5 44 0.19 34.0 Bumbamagara Farmer selection White 17 0.14 9.6 25 0.22 23.7 19 0.18 14.6
Cruza CIP720108 White 18 0.18 13.1 17 0.18 12.9 17 0.18 13.0 Kinigi CIP 378699.25 Red 6 0.23 5.9 35 0.20 30.5 16 0.21 14.0
Rwangume Unknown Red 19 0.23 17.7 0 0 0.0 13 0.23 12.0 Rutuku CIP720097 Red 15 0.11 5.6 0 0 0.0 10 0.11 3.8
Rwashakye Farmer selection from NARO trails
Red 6 0.09 2.3 2 - - 5 0.09 1.6
Kimuli Farmer selection White 4 0.16 2.7 0 0 0.0 3 0.16 1.8 Nakpot5 CIP381471.18 White 2 0.45 3.8 0 0 0.0 1 0.45 2.6 Kasaza Unknown Red 2 0.10 0.9 0 0 0.0 1 0.10 0.6 Kakyeri Unknown Red 1 - - 0 0 0.0 1 - - Kenya Kenya Baraka White 1 0.12 0.5 0 0 0.0 1 0.12 0.3
Malirahinda Malirahinda White 1 - - 0 0 0.0 1 - - Makerere Makerere White 1 - - 0 0 0.0 1 - -
Sutana Unknown Red 0 0 0.0 4 0.12 2.2 1 0.12 0.7 Katikamu Unknown Red 0 0 0.0 2 0.02 0.2 1 0.02 0.1
Mixed varieties
0.07 1.5 0 0.0 0.07 1.0
Sample size 95 49 144 Source: CIP survey 2005
5 Released in Rwanda by National Program for Potato Improvement (PNAP)
C I P W O R K I N G P A P E R S O C I A L S C I E N C E S 2 0 0 8 - 5
A D O P T I O N O F P O T A T O V A R I E T I E S I N K E N Y A A N D U G A N D A
23
Table 10. Potato varieties in farmer’s fields in Uganda between 1976 and 2005 (percentage of sample farmers).
Variety Kabale Kisoro 1994a* 1996b 2005c 1994a* 1996 2005c
Victoria 3 39 49 3 - 33 Bumbamagara 0 6 17 0 - 25 Cruza 23 25 18 23 - 17 Kinigi 0 0 6 0 - 35 Rwangume 0 0 19 0 - 0 Rutuku 30 57 15 0 - 0 Rwashakye 0 0 6 0 - 2 Kimuli 0 0 4 0 - 0 Nakpot5 0 0 2 0 - 0 Marirahinda 10 0 1 10 - 0
* Percentage of total area given aRueda et al. (1996), bLow (1996), cCIP survey 2005 Note: Adoption figures for Kisoro district for 1995/96 are not available but Kisoro was part of Kabale district in 1994.
The resistance levels against late blight reported on station are however not representative of the
current levels of resistance. The level of late blight resistance of Victoria has dropped since its
release as a variety. This is as a result of the adaptation of the pathogen to resistance mechanisms
based on single genes, also called major gene or vertical resistance. However, the variety still has
a useful resistance level, which makes late blight manageable for the growers and reduces risks of
total crop loss compared to truly susceptible varieties. The current resistance level of Victoria is
however lower than that of Rutuku and Cruza. The remaining level of resistance could be
attributed to minor genes, the so-called horizontal resistance, which is durable and cannot be
overcome by a simple mutation of the pathogen.
Table 11. On-station performance (1989-91) and attributes of some improved varieties during release of Victoria.
Variety Maturing (days)
Mean yields (t/ha)
Resistance to late blight
Resistance to bacterial wilt
Dormancy (Weeks)
Storability
Victoria Early (80-90) 35 High High Medium (6) Good Kabale Late (110) 24 Moderate Moderate Long (9-10) Excellent Kisoro Early (90-100) 28 High - Medium (6-8) Good Cruza Late (115) 19 High High Short (2-4) Fair Rutuku Late (95-120) 17 High Low Long (11-13) Good Sangema Early (90) 14 Low Low Long (12) Good
Source: Sikka (1994)
Out of the 32 tons of basic seeds produced between 1993 to 1994 Kabale consisted the highest
proportion (26.2%) followed by Victoria (16.6%) (Appendix 3). However, adoption of Kabale has
not been as high as that of Victoria possibly because of market and the fact that farmer prefer
early maturing and a short dormancy period.
C I P W O R K I N G P A P E R S O C I A L S C I E N C E S 2 0 0 8 - 5
A D O P T I O N O F P O T A T O V A R I E T I E S I N K E N Y A A N D U G A N D A
24
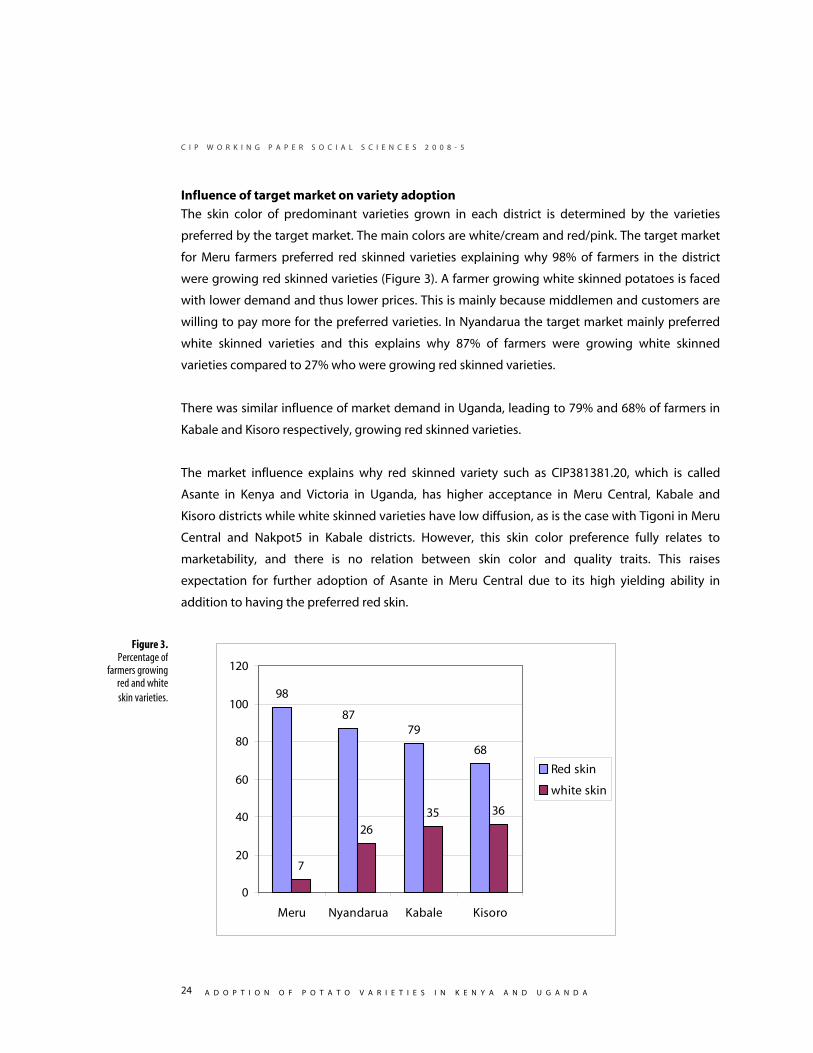
Influence of target market on variety adoption
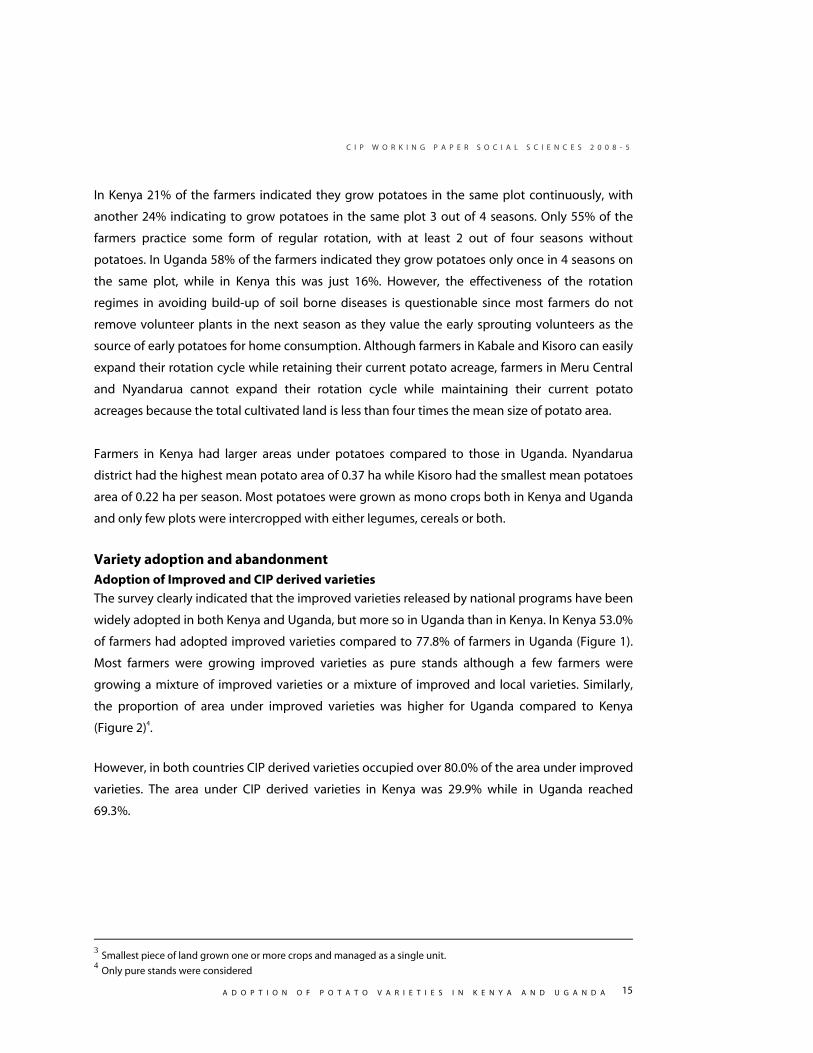
The skin color of predominant varieties grown in each district is determined by the varieties
preferred by the target market. The main colors are white/cream and red/pink. The target market
for Meru farmers preferred red skinned varieties explaining why 98% of farmers in the district
were growing red skinned varieties (Figure 3). A farmer growing white skinned potatoes is faced
with lower demand and thus lower prices. This is mainly because middlemen and customers are
willing to pay more for the preferred varieties. In Nyandarua the target market mainly preferred
white skinned varieties and this explains why 87% of farmers were growing white skinned
varieties compared to 27% who were growing red skinned varieties.
There was similar influence of market demand in Uganda, leading to 79% and 68% of farmers in
Kabale and Kisoro respectively, growing red skinned varieties.
The market influence explains why red skinned variety such as CIP381381.20, which is called
Asante in Kenya and Victoria in Uganda, has higher acceptance in Meru Central, Kabale and
Kisoro districts while white skinned varieties have low diffusion, as is the case with Tigoni in Meru
Central and Nakpot5 in Kabale districts. However, this skin color preference fully relates to
marketability, and there is no relation between skin color and quality traits. This raises
expectation for further adoption of Asante in Meru Central due to its high yielding ability in
addition to having the preferred red skin.
98
8779
68
7
2635 36
0
20
40
60
80
100
120
Meru Nyandarua Kabale Kisoro
Red skin
white skin
Figure 3.Percentage of
farmers growingred and whiteskin varieties.
C I P W O R K I N G P A P E R S O C I A L S C I E N C E S 2 0 0 8 - 5
A D O P T I O N O F P O T A T O V A R I E T I E S I N K E N Y A A N D U G A N D A
25
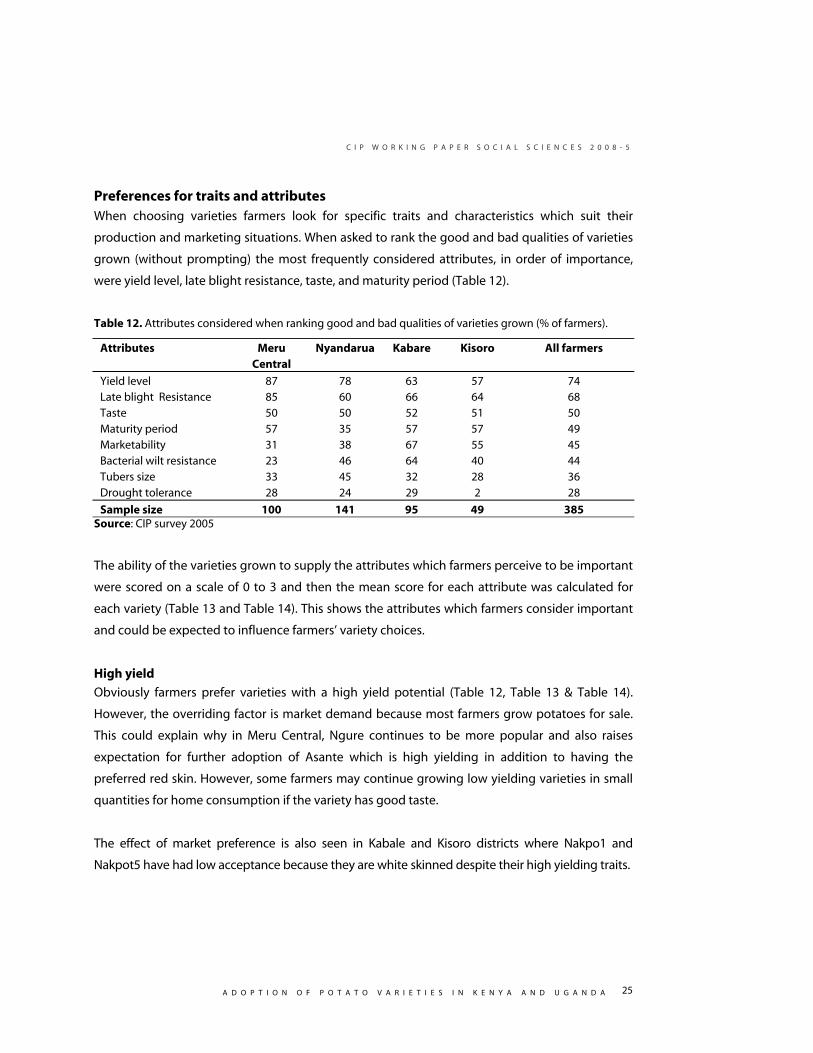
Preferences for traits and attributes When choosing varieties farmers look for specific traits and characteristics which suit their
production and marketing situations. When asked to rank the good and bad qualities of varieties
grown (without prompting) the most frequently considered attributes, in order of importance,
were yield level, late blight resistance, taste, and maturity period (Table 12).
Table 12. Attributes considered when ranking good and bad qualities of varieties grown (% of farmers).
Attributes Meru Central
Nyandarua Kabare Kisoro All farmers
Yield level 87 78 63 57 74 Late blight Resistance 85 60 66 64 68 Taste 50 50 52 51 50 Maturity period 57 35 57 57 49 Marketability 31 38 67 55 45 Bacterial wilt resistance 23 46 64 40 44 Tubers size 33 45 32 28 36 Drought tolerance 28 24 29 2 28
Sample size 100 141 95 49 385 Source: CIP survey 2005
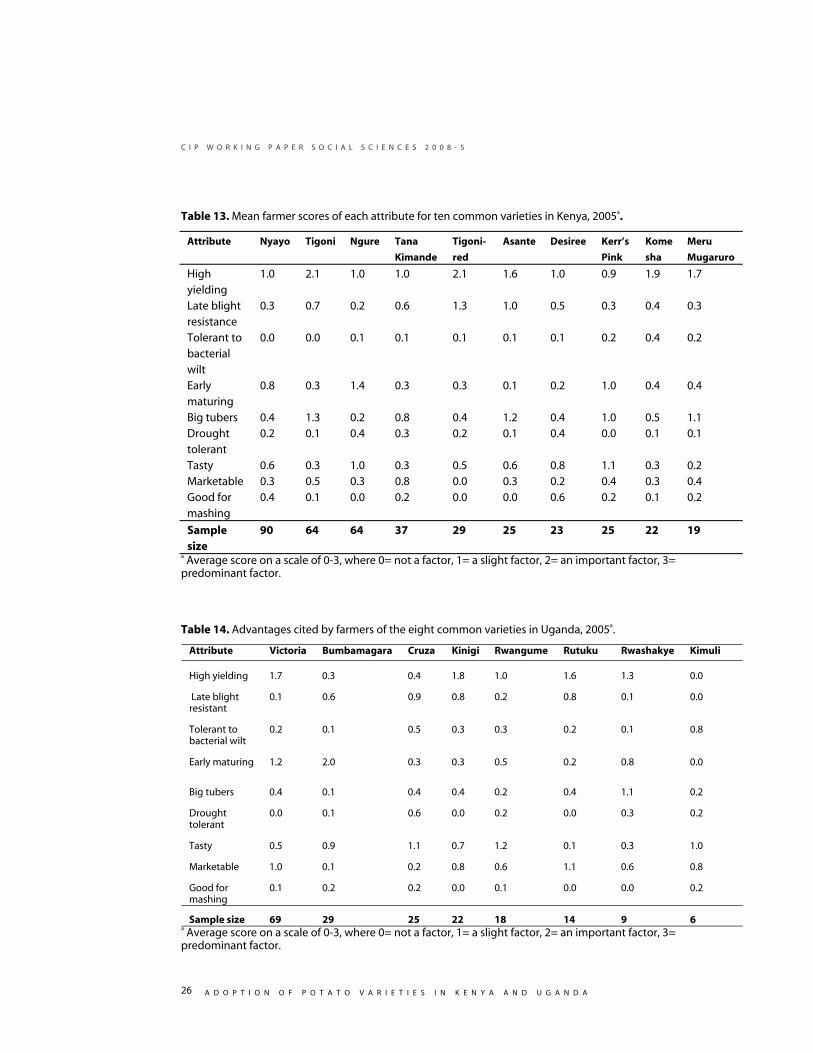
The ability of the varieties grown to supply the attributes which farmers perceive to be important
were scored on a scale of 0 to 3 and then the mean score for each attribute was calculated for
each variety (Table 13 and Table 14). This shows the attributes which farmers consider important
and could be expected to influence farmers’ variety choices.
High yield
Obviously farmers prefer varieties with a high yield potential (Table 12, Table 13 & Table 14).
However, the overriding factor is market demand because most farmers grow potatoes for sale.
This could explain why in Meru Central, Ngure continues to be more popular and also raises
expectation for further adoption of Asante which is high yielding in addition to having the
preferred red skin. However, some farmers may continue growing low yielding varieties in small
quantities for home consumption if the variety has good taste.
The effect of market preference is also seen in Kabale and Kisoro districts where Nakpo1 and
Nakpot5 have had low acceptance because they are white skinned despite their high yielding traits.
C I P W O R K I N G P A P E R S O C I A L S C I E N C E S 2 0 0 8 - 5
A D O P T I O N O F P O T A T O V A R I E T I E S I N K E N Y A A N D U G A N D A
26
Table 13. Mean farmer scores of each attribute for ten common varieties in Kenya, 2005a.
Attribute Nyayo Tigoni Ngure Tana
Kimande
Tigoni-
red
Asante Desiree Kerr’s
Pink
Kome
sha
Meru
Mugaruro
High yielding
1.0 2.1 1.0 1.0 2.1 1.6 1.0 0.9 1.9 1.7
Late blight resistance
0.3 0.7 0.2 0.6 1.3 1.0 0.5 0.3 0.4 0.3
Tolerant to bacterial wilt
0.0 0.0 0.1 0.1 0.1 0.1 0.1 0.2 0.4 0.2
Early maturing
0.8 0.3 1.4 0.3 0.3 0.1 0.2 1.0 0.4 0.4
Big tubers 0.4 1.3 0.2 0.8 0.4 1.2 0.4 1.0 0.5 1.1 Drought tolerant
0.2 0.1 0.4 0.3 0.2 0.1 0.4 0.0 0.1 0.1
Tasty 0.6 0.3 1.0 0.3 0.5 0.6 0.8 1.1 0.3 0.2 Marketable 0.3 0.5 0.3 0.8 0.0 0.3 0.2 0.4 0.3 0.4 Good for mashing
0.4 0.1 0.0 0.2 0.0 0.0 0.6 0.2 0.1 0.2
Sample size
90 64 64 37 29 25 23 25 22 19
a Average score on a scale of 0-3, where 0= not a factor, 1= a slight factor, 2= an important factor, 3= predominant factor.
Table 14. Advantages cited by farmers of the eight common varieties in Uganda, 2005a.
Attribute Victoria Bumbamagara Cruza Kinigi Rwangume Rutuku Rwashakye Kimuli
High yielding 1.7 0.3 0.4 1.8 1.0 1.6 1.3 0.0
Late blight resistant
0.1 0.6 0.9 0.8 0.2 0.8 0.1 0.0
Tolerant to bacterial wilt
0.2 0.1 0.5 0.3 0.3 0.2 0.1 0.8
Early maturing 1.2 2.0 0.3 0.3 0.5 0.2 0.8 0.0
Big tubers 0.4 0.1 0.4 0.4 0.2 0.4 1.1 0.2
Drought tolerant
0.0 0.1 0.6 0.0 0.2 0.0 0.3 0.2
Tasty 0.5 0.9 1.1 0.7 1.2 0.1 0.3 1.0
Marketable 1.0 0.1 0.2 0.8 0.6 1.1 0.6 0.8
Good for mashing
0.1 0.2 0.2 0.0 0.1 0.0 0.0 0.2
Sample size 69 29 25 22 18 14 9 6 a Average score on a scale of 0-3, where 0= not a factor, 1= a slight factor, 2= an important factor, 3= predominant factor.
C I P W O R K I N G P A P E R S O C I A L S C I E N C E S 2 0 0 8 - 5
A D O P T I O N O F P O T A T O V A R I E T I E S I N K E N Y A A N D U G A N D A
27
Late blight resistance
Late blight is most damaging in areas with high rainfall and low temperatures which happens to
be areas suitable for rainfed potato production in the tropics. Resistance to late blight emerged
as an important attribute although farmers do not perceive the disease as a major limitation
because they can control it using fungicides. Although use of fungicides for late blight control
increases production costs, farmers felt it was a lesser problem compared to bacterial wilt which
they do not know how to control. Farmers are also not wary of health risk posed to them and
their families when applying fungicides, although they are aware of importance of late blight
resistance in reducing production risks and cash requirement for buying fungicides. Lack of
proper methods of storage, handling and use of fungicides in the tropics expose farm families
and their workers to health risks potentially leading to economic burden due to cost of treatment
and lost man days (Crissman et al., 2002; Cole et al, 1997). Adoption of late blight resistant
varieties reduces the number of fungicides sprays required therefore reducing health risk and
potential economic loss.
In Kenya, Tigoni and Asante were considered as more late blight resistant than the other Kenyan
varieties (Table 12), which is in line with the findings at Tigoni national potato research centre
(KARI, 2002). In Uganda, Cruza, Kinigi and Rutuku were scored higher in late blight resistance than
Victoria which was considered quite susceptible (Table 14). This is contrary to findings from
research stations during the time of variety release in 1991 which scored Victoria higher than
Cruza in late blight resistance (UNPRDP, 1994; Sikka, 1994).
Although Victoria and Asante are the same variety, it is considered susceptible to late blight by
Ugandan farmers while Kenyan farmers considered it resistant. This could be as a result of farmers
comparing the variety against different benchmarks. Farmers in Uganda tend to compare Victoria
with the more late blight resistant Rutuku and Cruza, while farmers in Kenya compare Asante
with relatively late blight susceptible Nyayo, Ngure and Kerr’s Pink.
Taste
Taste is important for the potatoes grown for home use and the attribute was constantly used by
farmers when scoring varieties. However, preferences for particular tastes vary from one region to
another. A variety described as tasty in one region may be considered tasteless in another region.
Kerr’s Pink and Ngure were scored high for their taste and could be one of the reasons the latter is
able to take the place of the former in Meru Central. In Uganda, Rwangume, Kimuli,
Bumbamagara and Cruza were rated relatively high for taste compared to other varieties.
C I P W O R K I N G P A P E R S O C I A L S C I E N C E S 2 0 0 8 - 5
A D O P T I O N O F P O T A T O V A R I E T I E S I N K E N Y A A N D U G A N D A
28
Early maturity
Early maturity is important for food security and enabling households get income early to meet
cash obligations such as school fees. It is also important in potato growing areas with high land
pressure hence early harvesting allow growing more crops in a year. The trait is also important for
Ugandan farmers cropping in valley bottoms because it enables them to squeeze a third crop
during off-seasons period of June-September, when only the valley bottoms have residue moisture.
During the short rainy season, that is often a bit erratic and can vary in length an early maturing
variety also gives better chances of carrying the crop to full maturity without water stress.
In Meru Central, Ngure and Kerr’s Pink were scored high for early maturity. In Uganda,
Bumbamagara scored higher than other varieties for early maturity, followed by Victoria. Early
maturity of Victoria is one of the major factors contributing to the success of its adoption and
leading to farmer abandoning other varieties such as Cruza and Rutuku.
Bacterial wilt tolerance
Bacterial wilt is endemic in potato production areas in Kenya (Wakahiu et al, 2006) and Uganda.
Bacterial wilt is considered a catastrophic disease by farmers as there is no easy chemical solution
once it strikes. Thus farmer logically value tolerance to this disease as an important variety
characteristic. No variety was considered tolerant to bacterial wilt in Kenya, while in Uganda
Kimuli and Cruza were scored higher than other varieties in tolerance to bacterial wilt. Cruza’s
tolerance to bacterial wilt has previously been demonstrated through performance trials and
farmers’ ranking (Low, 2000).
Size of tubers
Most farmers prefer big tubers for home consumption and marketing. In Kenya farmers
appreciate the large tuber sizes of Tigoni, Asante, Meru Mugaruro and Kerr’s Pink. However, for
reasons that are not clear an emerging market in Meru north prefers medium sized potatoes and
that could be reason for Ngure becoming more popular than Kerr’s pink in the area. In Uganda
only Rwashakye scored relatively high for big tuber traits.
Short dormancy
In the two countries it was observed that farmers considered the length of seed dormancy to be
important in their intensive potato farming practices. Once a crop is harvested, farmers like to
plant tubers from the same crop as fast as possible in another field in the next season. If the
tubers take a long period to sprout this hampers their field operations and timing hence farmers
favour varieties with short dormancy as Victoria or Asante, Cruza and Nyayo.
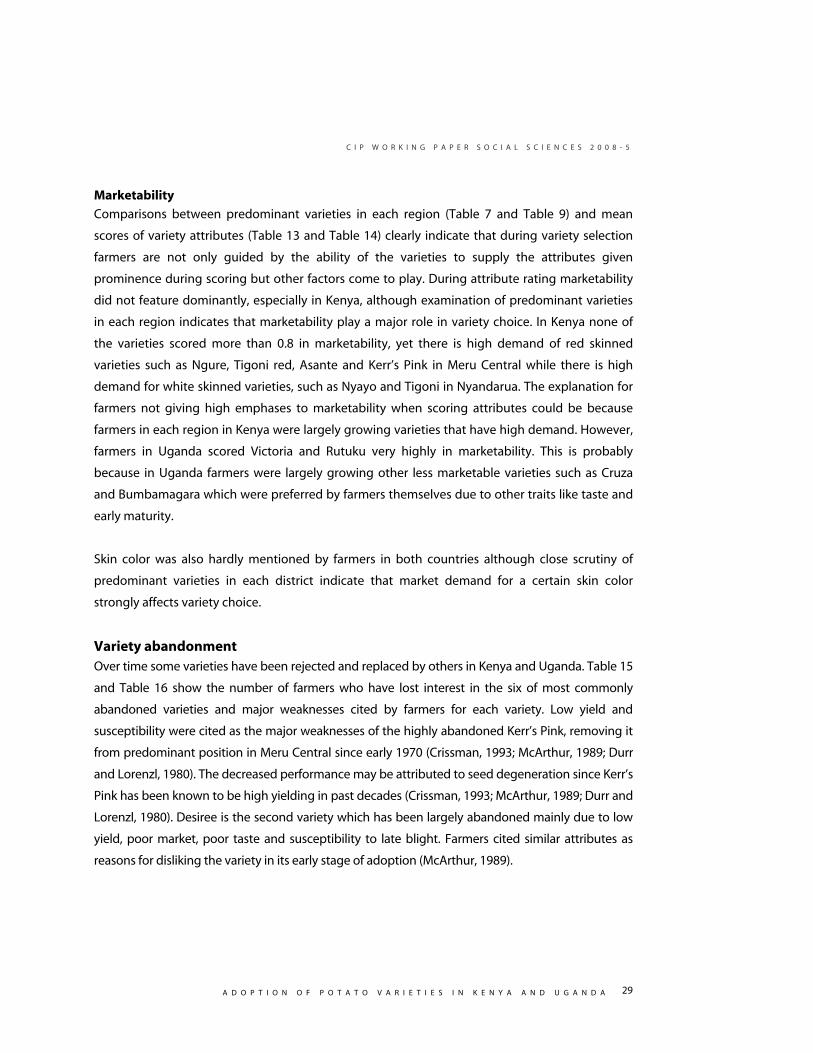
C I P W O R K I N G P A P E R S O C I A L S C I E N C E S 2 0 0 8 - 5
A D O P T I O N O F P O T A T O V A R I E T I E S I N K E N Y A A N D U G A N D A
29
Marketability
Comparisons between predominant varieties in each region (Table 7 and Table 9) and mean
scores of variety attributes (Table 13 and Table 14) clearly indicate that during variety selection
farmers are not only guided by the ability of the varieties to supply the attributes given
prominence during scoring but other factors come to play. During attribute rating marketability
did not feature dominantly, especially in Kenya, although examination of predominant varieties
in each region indicates that marketability play a major role in variety choice. In Kenya none of
the varieties scored more than 0.8 in marketability, yet there is high demand of red skinned
varieties such as Ngure, Tigoni red, Asante and Kerr’s Pink in Meru Central while there is high
demand for white skinned varieties, such as Nyayo and Tigoni in Nyandarua. The explanation for
farmers not giving high emphases to marketability when scoring attributes could be because
farmers in each region in Kenya were largely growing varieties that have high demand. However,
farmers in Uganda scored Victoria and Rutuku very highly in marketability. This is probably
because in Uganda farmers were largely growing other less marketable varieties such as Cruza
and Bumbamagara which were preferred by farmers themselves due to other traits like taste and
early maturity.
Skin color was also hardly mentioned by farmers in both countries although close scrutiny of
predominant varieties in each district indicate that market demand for a certain skin color
strongly affects variety choice.
Variety abandonment Over time some varieties have been rejected and replaced by others in Kenya and Uganda. Table 15
and Table 16 show the number of farmers who have lost interest in the six of most commonly
abandoned varieties and major weaknesses cited by farmers for each variety. Low yield and
susceptibility were cited as the major weaknesses of the highly abandoned Kerr’s Pink, removing it
from predominant position in Meru Central since early 1970 (Crissman, 1993; McArthur, 1989; Durr
and Lorenzl, 1980). The decreased performance may be attributed to seed degeneration since Kerr’s
Pink has been known to be high yielding in past decades (Crissman, 1993; McArthur, 1989; Durr and
Lorenzl, 1980). Desiree is the second variety which has been largely abandoned mainly due to low
yield, poor market, poor taste and susceptibility to late blight. Farmers cited similar attributes as
reasons for disliking the variety in its early stage of adoption (McArthur, 1989).
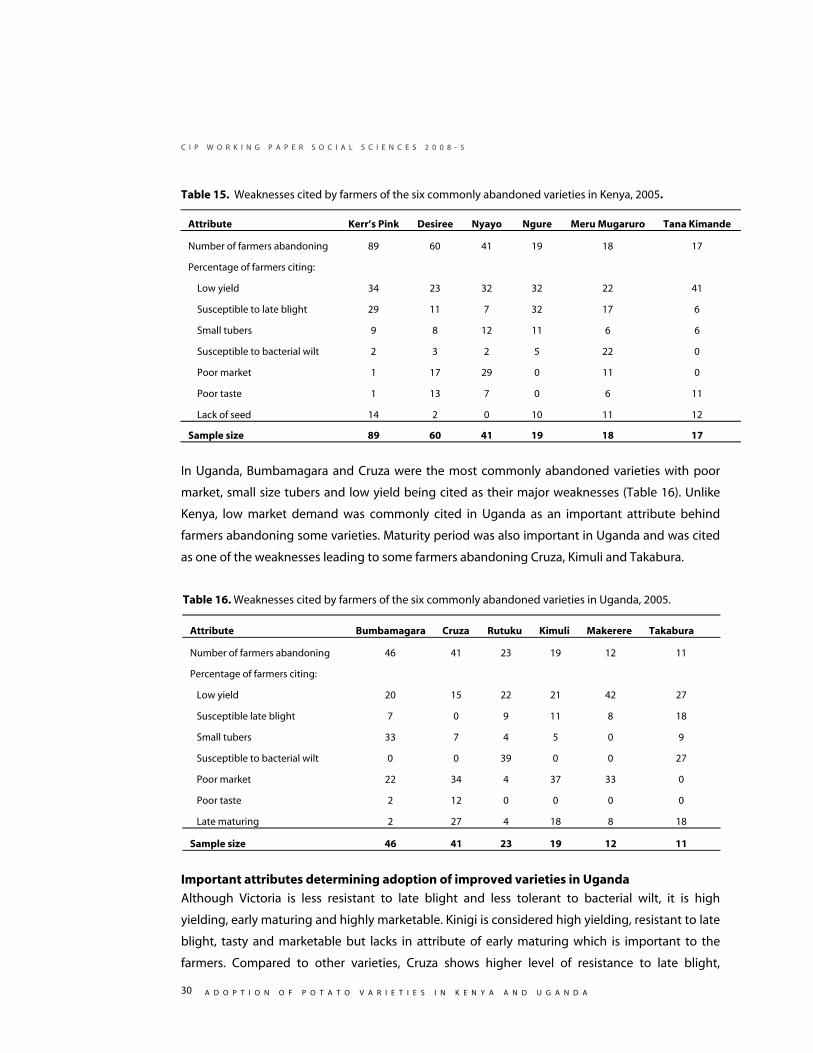
C I P W O R K I N G P A P E R S O C I A L S C I E N C E S 2 0 0 8 - 5
A D O P T I O N O F P O T A T O V A R I E T I E S I N K E N Y A A N D U G A N D A
30
Table 15. Weaknesses cited by farmers of the six commonly abandoned varieties in Kenya, 2005.
Attribute Kerr’s Pink Desiree Nyayo Ngure Meru Mugaruro Tana Kimande
Number of farmers abandoning 89 60 41 19 18 17
Percentage of farmers citing:
Low yield 34 23 32 32 22 41
Susceptible to late blight 29 11 7 32 17 6
Small tubers 9 8 12 11 6 6
Susceptible to bacterial wilt 2 3 2 5 22 0
Poor market 1 17 29 0 11 0
Poor taste 1 13 7 0 6 11
Lack of seed 14 2 0 10 11 12
Sample size 89 60 41 19 18 17
In Uganda, Bumbamagara and Cruza were the most commonly abandoned varieties with poor
market, small size tubers and low yield being cited as their major weaknesses (Table 16). Unlike
Kenya, low market demand was commonly cited in Uganda as an important attribute behind
farmers abandoning some varieties. Maturity period was also important in Uganda and was cited
as one of the weaknesses leading to some farmers abandoning Cruza, Kimuli and Takabura.
Table 16. Weaknesses cited by farmers of the six commonly abandoned varieties in Uganda, 2005.
Attribute Bumbamagara Cruza Rutuku Kimuli Makerere Takabura
Number of farmers abandoning 46 41 23 19 12 11
Percentage of farmers citing:
Low yield 20 15 22 21 42 27
Susceptible late blight 7 0 9 11 8 18
Small tubers 33 7 4 5 0 9
Susceptible to bacterial wilt 0 0 39 0 0 27
Poor market 22 34 4 37 33 0
Poor taste 2 12 0 0 0 0
Late maturing 2 27 4 18 8 18
Sample size 46 41 23 19 12 11
Important attributes determining adoption of improved varieties in Uganda
Although Victoria is less resistant to late blight and less tolerant to bacterial wilt, it is high
yielding, early maturing and highly marketable. Kinigi is considered high yielding, resistant to late
blight, tasty and marketable but lacks in attribute of early maturing which is important to the
farmers. Compared to other varieties, Cruza shows higher level of resistance to late blight,
C I P W O R K I N G P A P E R S O C I A L S C I E N C E S 2 0 0 8 - 5
A D O P T I O N O F P O T A T O V A R I E T I E S I N K E N Y A A N D U G A N D A
31
bacteria wilt and drought and is also considered tasty. However, the variety is relatively low
yielding, late maturing and hard to market as a result of coloration of the vascular ring when fried,
which makes it unsuitable for the French fries market in towns and cities. Rutuku is high yielding,
has a high level of resistance to late blight and has the preferred red skin color. However, it is late
maturing, as pointed out by farmers growing it, while those who have abandoned it say it is
highly susceptible to bacterial wilt.
C I P W O R K I N G P A P E R S O C I A L S C I E N C E S 2 0 0 8 - 5
A D O P T I O N O F P O T A T O V A R I E T I E S I N K E N Y A A N D U G A N D A
32
DISEASE INCIDENCES AND CONTROL
Late blight Late blight is a problem for most sample farmers as reported by 92% of Kenyan sample farmers and
86% of Uganda sample farmers (Table 17). The disease was particularly important in Meru CentralMeru
Central where 98% of farmers said it posed a problem. Only in Kisoro district, Uganda where relatively
higher proportion of farmers (23%) said the disease was not important in production.
Most farmers in Meru Central, Kabale and Kisoro districts were aware of variety differences in
levels of resistance to late blight. However, in Nyandarua district only 48% were aware of this.
Use of fungicides was the predominant method of controlling late blight with 77% of farmers in
Kenya and 80% in Uganda reporting using it. Nyandarua district had the lowest percentage of
farmers using fungicides. In both countries farmers predominantly use two types of fungicides,
Mancozeb and Ridomil. Mancozeb, a preventative fungicide marketed in different brands is the
most commonly used followed by Ridomil, which contains both the curative Metalaxyl as well as
the preventative ingredients in Mancozeb. Most farmers in Meru Central use Mancozeb while in
Nyandarua use of Ridomil is predominant.
In Uganda most farmers use Mancozeb formulations. A number of farmers in Uganda (17%)
reported using insecticides to control late blight. A few farmers in Uganda did not know the
name of the chemicals they used to control the disease.
On average farmers in Meru Central sprayed fungicides 4 times per season, while farmers in
Nyandarua district sprayed only 2 times. Farmers in Kabale and Kisoro districts sprayed fungicides
on average 3 times in a season.
Most farmers timed the first spray on the basis of the number of days after emergence or
weeding or by the height of plant. About 32% of farmers in Kenya and 14% of farmers in
Uganda began spraying when they could observe leaf infection. In Kenya 21% used the
predisposing conditions of chilly weather to determine the first time of spraying, while only 2% of
Uganda sample farmers used such conditions as determinant. The fact that the start of spaying is
determined by number of days after plant emerges or by appearance of leaf lesions, implies that
a substantial proportion of farmers may be incurring higher losses than they realize.

C I P W O R K I N G P A P E R S O C I A L S C I E N C E S 2 0 0 8 - 5
A D O P T I O N O F P O T A T O V A R I E T I E S I N K E N Y A A N D U G A N D A
33
Table 17. Late blight details by country.
Kenya Uganda
Meru Central
Nyandarua All Kabale Kisoro All
Percentage of farmers who:
Consider late blight a threat 98 88 92 90 77 86
Are aware of variety differences in sensitivity to late blight
94 48 66 86 85 86
Percentage of farmers controlling LB by:
Use of fungicides 99 62 77 81 77 80
Early planting 0 0 0 4 2 3
Weeding 0 0 0 2 2 2
Uprooting affected plant 0 0 0 1 0 1
What determines when to start spraying (%)*
When leaves are affected 26 39 32 12 17 14
Immediately after emergence 33 1 18 38 37 38
Plant height 33 6 21 1 6 3
When cold/chilly weather starts 23 18 21 3 0 2
Some days before/after weeding 0 0 0 18 20 19
Count some days after emergency 14 45 28 33 20 29
Average number of sprays* 3.7 1.8 2.7 3.3 2.9 3.2
Standard deviation 1.9 0.7 1.7 1.5 1.0 1.4
Median 3.0 2.0 2.0 3.0 3.0 3.0
Percentage of farmers using*
Mancozeb (mainly Dithane-M45) 96 2 52 74 76 75
Ridomil 22 88 53 17 6 14
Insecticide (Karate and Ambush) 2 0 1 16 18 17
Propineb based fungicide 1 7 4 0 3 1
Herbicides (Aqua Pro) &
Dewormer (Nilzan)
0 2 1 0 0 0
Unknown 1 1 1 10 15 12
Sample size 100 151 251 95 49 144 *For proportion using fungicides Source: CIP survey 2005
Farmers growing potatoes in the valley bottoms in Kabale district indicated they have fewer
problems with late blight during the off-season period of June-September because it is not a
rainy season. Only 3% of Ugandan farmers said they used early planting to control late blight. No
farmer said they planted a variety with disease resistance to control the disease.
Going by attribute rating and varieties grown it appears level of late blight resistance is not a
dominant factor for farmers determining the choices of grown varieties in the two countries as
seen from the predominant varieties which are considered susceptible to late blight. When
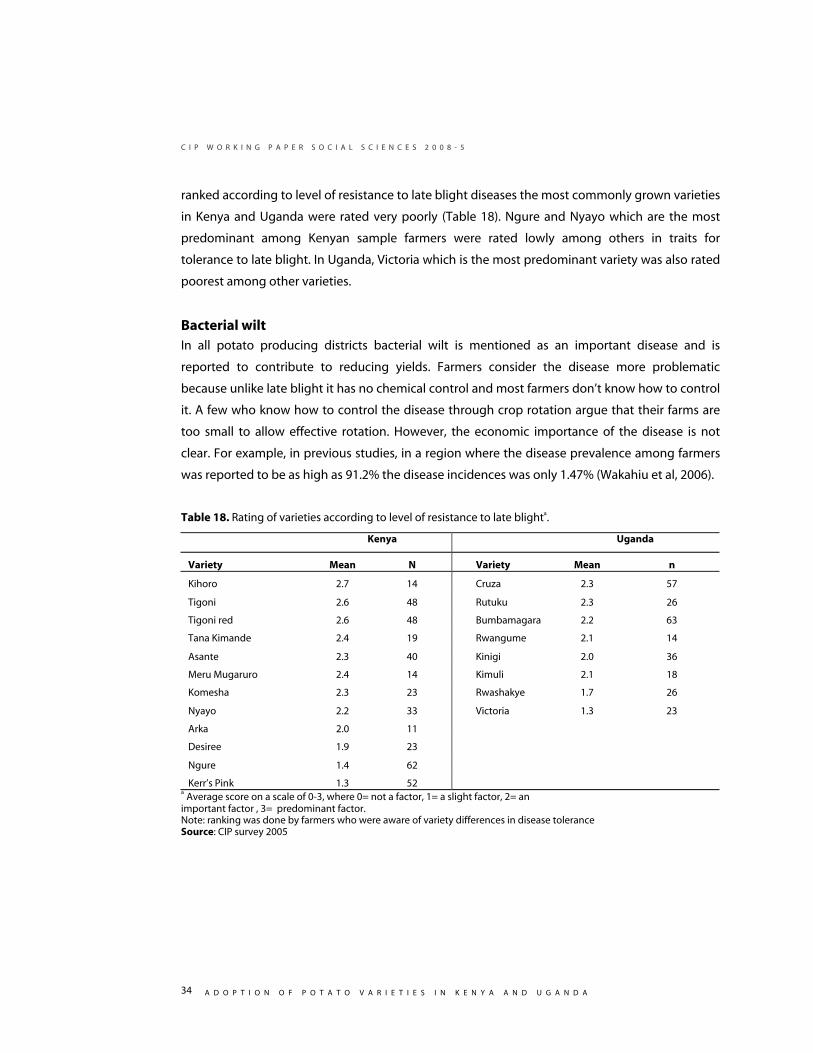
C I P W O R K I N G P A P E R S O C I A L S C I E N C E S 2 0 0 8 - 5
A D O P T I O N O F P O T A T O V A R I E T I E S I N K E N Y A A N D U G A N D A
34
ranked according to level of resistance to late blight diseases the most commonly grown varieties
in Kenya and Uganda were rated very poorly (Table 18). Ngure and Nyayo which are the most
predominant among Kenyan sample farmers were rated lowly among others in traits for
tolerance to late blight. In Uganda, Victoria which is the most predominant variety was also rated
poorest among other varieties.
Bacterial wilt In all potato producing districts bacterial wilt is mentioned as an important disease and is
reported to contribute to reducing yields. Farmers consider the disease more problematic
because unlike late blight it has no chemical control and most farmers don’t know how to control
it. A few who know how to control the disease through crop rotation argue that their farms are
too small to allow effective rotation. However, the economic importance of the disease is not
clear. For example, in previous studies, in a region where the disease prevalence among farmers
was reported to be as high as 91.2% the disease incidences was only 1.47% (Wakahiu et al, 2006).
Table 18. Rating of varieties according to level of resistance to late blighta.
Kenya Uganda
Variety Mean N Variety Mean n
Kihoro 2.7 14 Cruza 2.3 57
Tigoni 2.6 48 Rutuku 2.3 26
Tigoni red 2.6 48 Bumbamagara 2.2 63
Tana Kimande 2.4 19 Rwangume 2.1 14
Asante 2.3 40 Kinigi 2.0 36
Meru Mugaruro 2.4 14 Kimuli 2.1 18
Komesha 2.3 23 Rwashakye 1.7 26
Nyayo 2.2 33 Victoria 1.3 23
Arka 2.0 11
Desiree 1.9 23
Ngure 1.4 62
Kerr’s Pink 1.3 52 a Average score on a scale of 0-3, where 0= not a factor, 1= a slight factor, 2= an important factor , 3= predominant factor. Note: ranking was done by farmers who were aware of variety differences in disease tolerance Source: CIP survey 2005
C I P W O R K I N G P A P E R S O C I A L S C I E N C E S 2 0 0 8 - 5
A D O P T I O N O F P O T A T O V A R I E T I E S I N K E N Y A A N D U G A N D A
35
INPUT USE
Seed potato system Sources of seed potato
In both Kenya and Uganda very few farmers procured clean seeds. Only 4% of farmers reported
using seeds from sources likely to provide high quality seeds, such as trained farmer associations,
seed growers and national research stations.
Self-supply is the most important source of seed for over 55% of potato grown in Kenya and
Uganda (Table 19). This conforms to earlier studies (Low, 2000; Adipala, 1999) indicating self
supply was the major source of seed supply for majority of farmers. Farmers select and store small
tubers from their own production to plant the next season. The main reasons, as also stated by
Nyangito (1986), are that this practice saves cash expenses. Furthermore, farmers may have more
confidence in the quality of their own seed and with their own saved seed it is easier to plan
production.
The second most important source of seed in Kenya was neighboring farmers while the market was
second important in Uganda. Whereas neither of the two sources (neighbor or market) ensures
clean seeds, obtaining seeds from neighbors may be slightly preferable especially where farmers
obtain potato seeds from neighbors with potato fields in proximity after monitoring their growth.
Table 19 shows that most farmers obtain seed from their own harvest or buy seeds of uncertain
quality from either neighboring farmers or the market. Reliable clean seed forms just a tiny
proportion of the whole seed market. This can be attributed to several factors:
Firstly, the market for consumption potatoes is somewhat unpredictable as a result of the rainfed
farming. When the season is good, prices go down as a result of glut reducing producer margins
making farmers shy away from investing in clean seeds which are relatively more expensive.
Secondly, there is a lack of awareness amongst potato farmers about the importance of high
quality seed to obtain high yields. The concept of seed degeneration as a result of virus diseases
is not common knowledge among potato farmers. Farmers are known to look for new varieties as
the variety they have has “become tired” or “lazy” and too “used to the environment”, which are
basically farmers’ interpretations of seed degeneration, without understanding that the
underlying cause is a build of diseases. Farmers rarely look for clean seed of the same variety but
instead they look for a new “fresh” variety.

C I P W O R K I N G P A P E R S O C I A L S C I E N C E S 2 0 0 8 - 5
A D O P T I O N O F P O T A T O V A R I E T I E S I N K E N Y A A N D U G A N D A
36
Table 19. Sources of seed for each variety grown in the last two seasons.
Own Neighbor Market Farmer association /seed growers or NARS
n*
Kenya
All varieties 58 36 2 4 733
Nyayo 70 27 2 1 153
Tigoni 57 39 1 3 115
Ngure 34 51 3 12 97
Tigoni red 18 69 5 8 39
Kimande 84 16 0 0 74
Asante 40 46 3 11 35
Desiree 69 31 0 0 35
Kerr’s Pink 37 48 0 15 27
Meru Mugaruro 64 33 0 3 39
Komesha 69 25 0 3 36
Uganda
All varieties 56 15 25 4 357
Victoria 57 15 21 7 133
Bumbamagara 54 9 35 2 43
Cruza 65 5 30 0 37
Kinigi 35 18 47 0 34
Rwangume 63 20 9 9 46
Rutuku 56 11 33 0 18
Rwashakye 39 46 8 8 13 *n depends on number of plots grown in two seasons Source: CIP survey 2005
Thirdly, high quality seed is not readily available. In Kenya there is no large scale seed potato
production since the collapse of Agricultural Development Corporation (ADC) which was
multiplying pre-basic seed into certified seed. KARI National Potato Research Center in Kenya and
Kalengyere research station in Uganda are the single source of clean basic seeds in each country.
Their capacity to produce this seed is limited as they are struggling with a double mandate of
research and commercial basic seed production. They are handicapped by institutional
arrangements in which there are limited incentives for increased productivity and efficiency. The
multiplication of the limited amounts of basic seed stock produced by the national research
programs into high quality seed potatoes also remains a major challenge. There is no large
private sector involvement and only a small number of specialized and trained private seed
potato multipliers.
C I P W O R K I N G P A P E R S O C I A L S C I E N C E S 2 0 0 8 - 5
A D O P T I O N O F P O T A T O V A R I E T I E S I N K E N Y A A N D U G A N D A
37
Seed selection
The principle method of selecting seeds for farmers using own seed supply is sorting out tubers
from the overall harvest, as reported by 90% of farmers in Kenya and 70% of farmers in Uganda.
But this way the farmer has no knowledge of whether the seed comes from a healthy mother
plant. In Uganda, at least 17% reported practicing some sort of positive selection while in Kenya
only 3% reported using the technique. Of the farmers using own seed supply, the farmers who
use separate seed bed as the principle method of seed production were only 3% in Kenya and
10% in Uganda.
Seed renewal
Many more farmers in Meru Central district renew seeds compared to farmers in all other districts
visited in the two countries (Table 20). In Meru Central district, 75% of farmers renew seeds
compared to only 21%, 25% and 25% in Nyandarua, Kabale and Kisoro districts. Of the farmers
that reported renewing seeds, Meru Central farmers also renew more frequently than in other
districts, with most Meru Central farmers renewing after every two seasons, while most farmers in
other districts renewed seeds after eight seasons. This exception of high seed renovation in Meru
Central district was also noted in 1988 (Crissman et al., 1993). Over the years farmers have
purchased seeds from Kibirichia division, an area known to have low disease incidences due to
high elevation. The area also neighbors mount Kenya forest, from where until recently farmers
were allowed access to virgin land for potato production for short periods.
Higher rates of seed renewal in Meru Central are possibly due to a higher level of market
integration, more stable prices for potatoes as a result of a more diversified and sure market, and
the lower risks of production compared to other areas as a result of the availability of irrigation.
Also since the production system is intensive and the rotation times the shortest of all four
districts, there is likelihood of higher bacterial wilt pressure if seeds are not renewed regularly.
Seed sizes and rates
The majority of farmers in Kenya and Uganda used medium size tubers for seeds with 77% of
Kenyan farmers and 60% of Ugandan farmers using medium size seeds. This is in line with earlier
findings by Crissman et al. (1993), that the majority of farmers in Kenya preferred egg-sized seeds
(Photograph 3). However, over 50% of farmers in Uganda also reported using small sized tubers.
On average Kenyan farmers used about 50%, higher seed rates than Ugandan farmers, with
Kenyan farmers using 1.6t/ha while Ugandan farmers used 1.1t/ha. However, the seed rate used
by Kenyan farmers is still lower that the 2 tons/ ha recommended by the extension service (Durr
and Lorenzil, 1980).
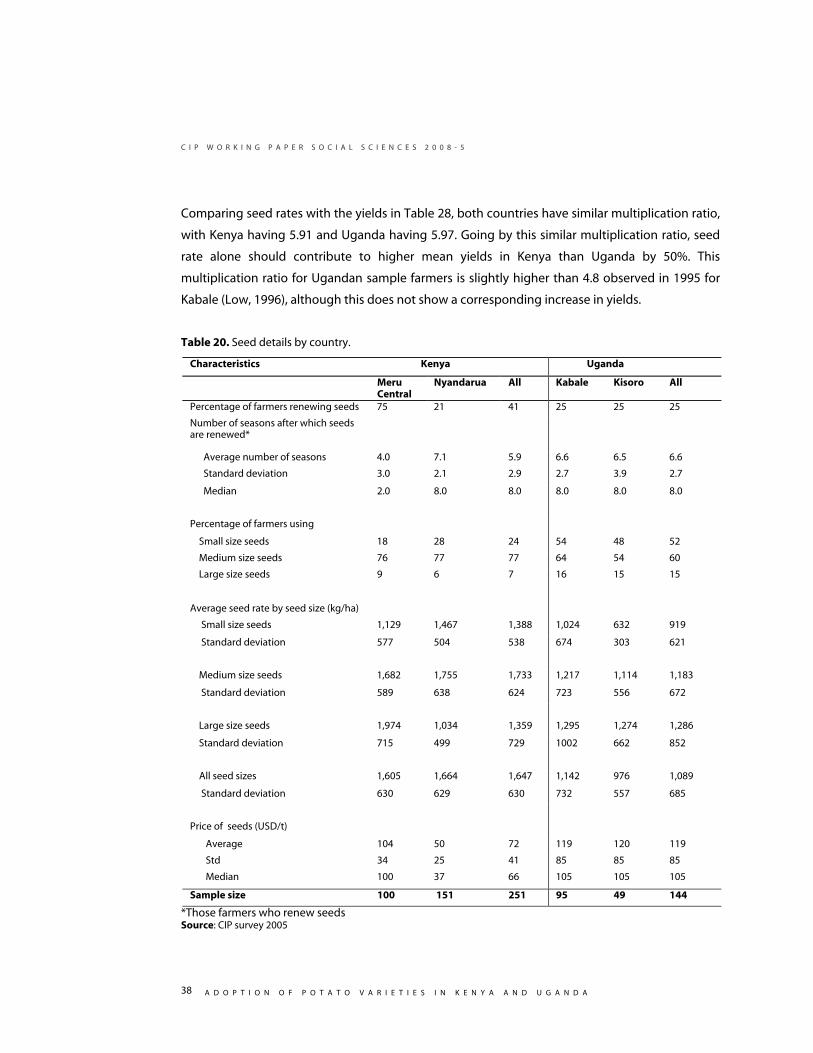
C I P W O R K I N G P A P E R S O C I A L S C I E N C E S 2 0 0 8 - 5
A D O P T I O N O F P O T A T O V A R I E T I E S I N K E N Y A A N D U G A N D A
38
Comparing seed rates with the yields in Table 28, both countries have similar multiplication ratio,
with Kenya having 5.91 and Uganda having 5.97. Going by this similar multiplication ratio, seed
rate alone should contribute to higher mean yields in Kenya than Uganda by 50%. This
multiplication ratio for Ugandan sample farmers is slightly higher than 4.8 observed in 1995 for
Kabale (Low, 1996), although this does not show a corresponding increase in yields.
Table 20. Seed details by country.
Characteristics Kenya Uganda
Meru Central
Nyandarua All Kabale Kisoro All
Percentage of farmers renewing seeds 75 21 41 25 25 25
Number of seasons after which seeds are renewed*
Average number of seasons 4.0 7.1 5.9 6.6 6.5 6.6
Standard deviation 3.0 2.1 2.9 2.7 3.9 2.7
Median 2.0 8.0 8.0 8.0 8.0 8.0
Percentage of farmers using
Small size seeds 18 28 24 54 48 52
Medium size seeds 76 77 77 64 54 60
Large size seeds 9 6 7 16 15 15
Average seed rate by seed size (kg/ha)
Small size seeds 1,129 1,467 1,388 1,024 632 919
Standard deviation 577 504 538 674 303 621
Medium size seeds 1,682 1,755 1,733 1,217 1,114 1,183
Standard deviation 589 638 624 723 556 672
Large size seeds 1,974 1,034 1,359 1,295 1,274 1,286
Standard deviation 715 499 729 1002 662 852
All seed sizes 1,605 1,664 1,647 1,142 976 1,089
Standard deviation 630 629 630 732 557 685
Price of seeds (USD/t)
Average 104 50 72 119 120 119
Std 34 25 41 85 85 85
Median 100 37 66 105 105 105
Sample size 100 151 251 95 49 144
*Those farmers who renew seeds Source: CIP survey 2005
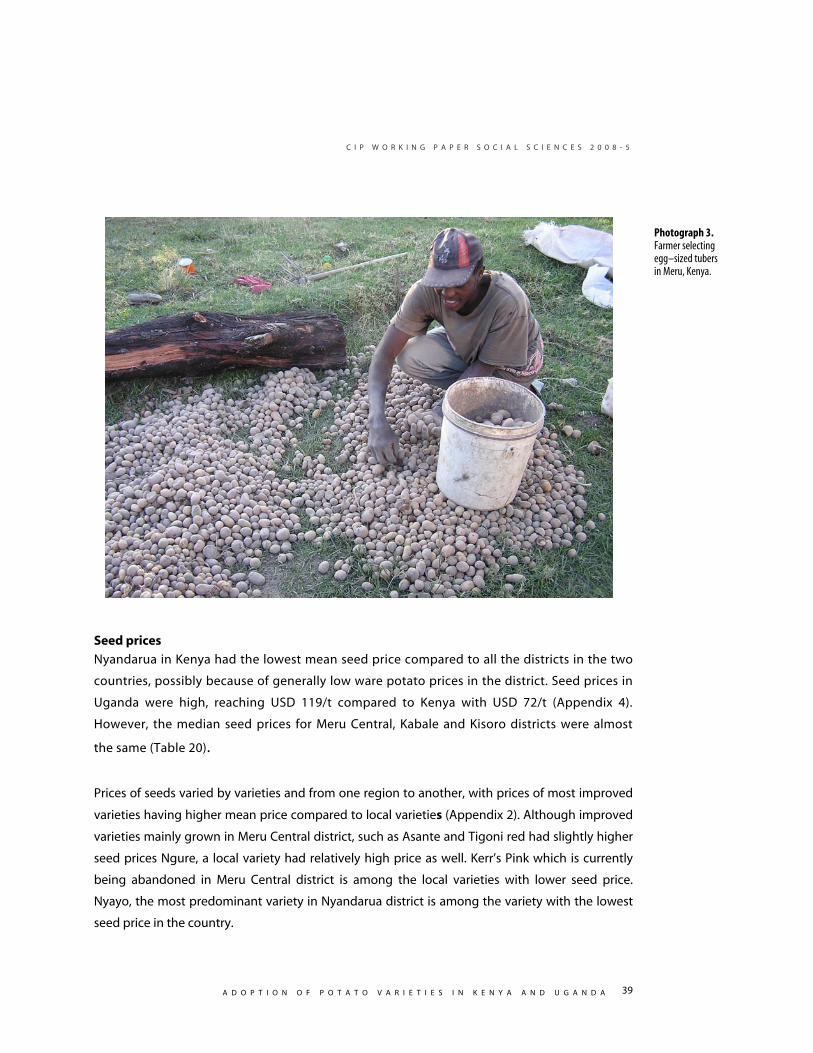
C I P W O R K I N G P A P E R S O C I A L S C I E N C E S 2 0 0 8 - 5
A D O P T I O N O F P O T A T O V A R I E T I E S I N K E N Y A A N D U G A N D A
39
Seed prices
Nyandarua in Kenya had the lowest mean seed price compared to all the districts in the two
countries, possibly because of generally low ware potato prices in the district. Seed prices in
Uganda were high, reaching USD 119/t compared to Kenya with USD 72/t (Appendix 4).
However, the median seed prices for Meru Central, Kabale and Kisoro districts were almost
the same (Table 20).
Prices of seeds varied by varieties and from one region to another, with prices of most improved
varieties having higher mean price compared to local varieties (Appendix 2). Although improved
varieties mainly grown in Meru Central district, such as Asante and Tigoni red had slightly higher
seed prices Ngure, a local variety had relatively high price as well. Kerr’s Pink which is currently
being abandoned in Meru Central district is among the local varieties with lower seed price.
Nyayo, the most predominant variety in Nyandarua district is among the variety with the lowest
seed price in the country.
Photograph 3. Farmer selecting egg–sized tubers in Meru, Kenya.
C I P W O R K I N G P A P E R S O C I A L S C I E N C E S 2 0 0 8 - 5
A D O P T I O N O F P O T A T O V A R I E T I E S I N K E N Y A A N D U G A N D A
40
In Uganda, Victoria, Cruza, Kinigi and Rutuku are among varieties with high seed price. However,
Rwashakye has high seed price although it is a local variety.
First source of seed
As shown in Table 21, neighbors were the major source of first seeds6 of all varieties grown in
Kenya. Neighbors were the source of 84% of all varieties grown by Kenyan farmers while markets,
farmers’ association and seed growers or government department formed the other sources of
first seeds. In Uganda, the market was the most important source of first seed (45%) of varieties
grown while neighbors were the second important source of first seed (35%). In Uganda more
first seeds originated from sources known to produce clean seeds (13%), such as commercial seed
growers, the ministry of agriculture or national research stations compared to Kenya (6%),
Seed storage facilities
Most sample farmers stored seeds. Only 8% of farmers in Kenya and 11% of farmers in Uganda
said they did not store seeds. Dark storage and a field pit are the main storage techniques used
by farmers in Kenya (Table 22). In Meru Central, the percentage of farmers storing seed in a field
pit have declined from 100% in 1976 (Durr and Lorenzl, 1980) to 34%. In Nyandarua, farmers
storing seeds in their houses have also declined from about 50% in 1976 to less than 25% in 2005,
with the majority of them using stores.
In Uganda a dark space in the house was the most common storage facility, followed by a light
store and a light space in the house as reported by 36%, 31% and 16% of sample farmers.
Seed potatoes were mostly spread out on the floor as was reported by 48% of farmers in Kenya
and 73% of farmers in Uganda. However, in Kenya a substantial proportion of farmers reported
storing seeds in gunny bags (24%) or a wooden structure (20%).
6 Seeds used by the farmer to grown a given variety for the first time.
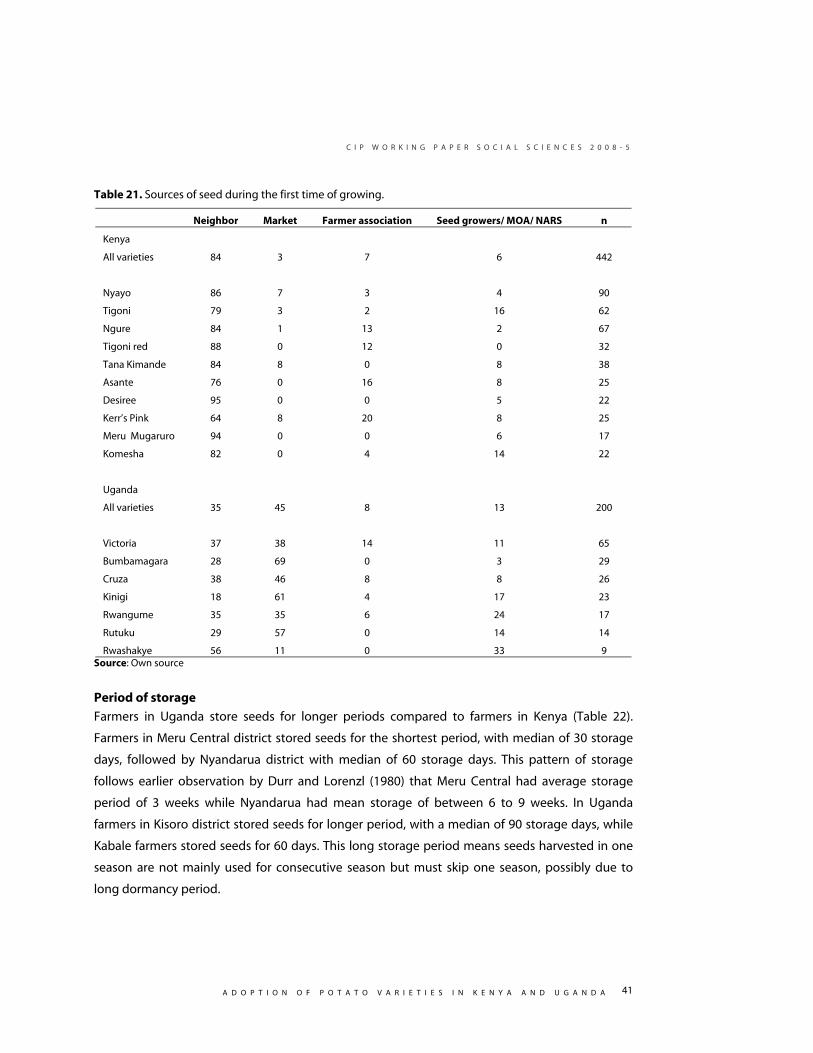
C I P W O R K I N G P A P E R S O C I A L S C I E N C E S 2 0 0 8 - 5
A D O P T I O N O F P O T A T O V A R I E T I E S I N K E N Y A A N D U G A N D A
41
Table 21. Sources of seed during the first time of growing.
Neighbor Market Farmer association Seed growers/ MOA/ NARS n
Kenya
All varieties 84 3 7 6 442
Nyayo 86 7 3 4 90
Tigoni 79 3 2 16 62
Ngure 84 1 13 2 67
Tigoni red 88 0 12 0 32
Tana Kimande 84 8 0 8 38
Asante 76 0 16 8 25
Desiree 95 0 0 5 22
Kerr’s Pink 64 8 20 8 25
Meru Mugaruro 94 0 0 6 17
Komesha 82 0 4 14 22
Uganda
All varieties 35 45 8 13 200
Victoria 37 38 14 11 65
Bumbamagara 28 69 0 3 29
Cruza 38 46 8 8 26
Kinigi 18 61 4 17 23
Rwangume 35 35 6 24 17
Rutuku 29 57 0 14 14
Rwashakye 56 11 0 33 9 Source: Own source
Period of storage
Farmers in Uganda store seeds for longer periods compared to farmers in Kenya (Table 22).
Farmers in Meru Central district stored seeds for the shortest period, with median of 30 storage
days, followed by Nyandarua district with median of 60 storage days. This pattern of storage
follows earlier observation by Durr and Lorenzl (1980) that Meru Central had average storage
period of 3 weeks while Nyandarua had mean storage of between 6 to 9 weeks. In Uganda
farmers in Kisoro district stored seeds for longer period, with a median of 90 storage days, while
Kabale farmers stored seeds for 60 days. This long storage period means seeds harvested in one
season are not mainly used for consecutive season but must skip one season, possibly due to
long dormancy period.

C I P W O R K I N G P A P E R S O C I A L S C I E N C E S 2 0 0 8 - 5
A D O P T I O N O F P O T A T O V A R I E T I E S I N K E N Y A A N D U G A N D A
42
Sprouting
In Meru Central district more than 90% of farmers reported using various methods to force
sprouting while a substantial proportion of farmers in Nyandarua, Kabale and Kisoro districts did
nothing to induce sprouting (Table 22). Most farmers in Meru Central districts used a pit to induce
sprouting while others covered seeds using dry leaves or put them in bags or warm places. In
Nyandarua district farmers who induced sprouting mainly used dry leaves or used pits. In
Uganda, farmers who induced sprouting mainly put seeds in bags, covered them with dry leaves
or put them in warm places.
Fertilizer application In Kenya 89% of farmers reported using chemical fertilizer compared to only 7% in Uganda (Table
23). The low adoption of fertilizer use in Uganda is clearly related to the very limited availability of
agrochemical suppliers at county and sub-county levels7 in Kabale and Kisoro districts. It is
however unclear whether the low fertilizer use is a result of, or to blame for this lack of supply.
The finding reaffirms earlier findings by Kaguongo et al (2005b) that only farmers around
Kapchorwa district in Uganda use fertilizer, estimating 40% of potato farmers in the district to be
fertilizer users.
In Kenya, Di-ammonium Phosphate (DAP8) is the most commonly used type of fertilizer as
reported by 96% of users. Only 8% and 1% respectively, reported using Calcium Ammonium
Nitrate (CAN) and compound fertilizer (NPK).
Sixty-one percent of farmers who were not using fertilizer in Kenya sited lack of cash and high
fertilizer prices as their main reason for not using fertilizer while in Uganda 50% sited similar
problems. In Uganda 26% of nonusers said they believed their land was adequately fertile for
potato production while interestingly only 9% said fertilizer was not available.
7 Administrative units smaller than a district- one district is made up of several counties and a county consists of several sub-counties . 8 DAP has 18 % nitrogen and 46% phosphorous.
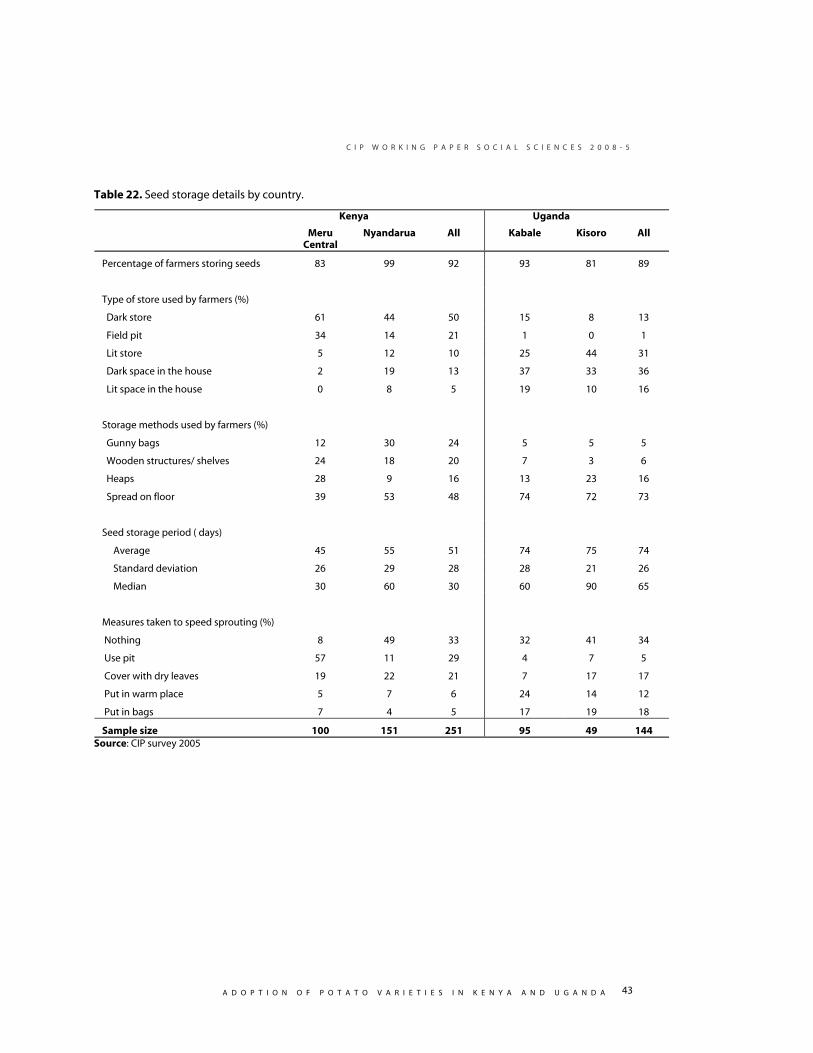
C I P W O R K I N G P A P E R S O C I A L S C I E N C E S 2 0 0 8 - 5
A D O P T I O N O F P O T A T O V A R I E T I E S I N K E N Y A A N D U G A N D A
43
Table 22. Seed storage details by country.
Kenya Uganda
Meru Central
Nyandarua All Kabale Kisoro All
Percentage of farmers storing seeds 83 99 92 93 81 89
Type of store used by farmers (%)
Dark store 61 44 50 15 8 13
Field pit 34 14 21 1 0 1
Lit store 5 12 10 25 44 31
Dark space in the house 2 19 13 37 33 36
Lit space in the house 0 8 5 19 10 16
Storage methods used by farmers (%)
Gunny bags 12 30 24 5 5 5
Wooden structures/ shelves 24 18 20 7 3 6
Heaps 28 9 16 13 23 16
Spread on floor 39 53 48 74 72 73
Seed storage period ( days)
Average 45 55 51 74 75 74
Standard deviation 26 29 28 28 21 26
Median 30 60 30 60 90 65
Measures taken to speed sprouting (%)
Nothing 8 49 33 32 41 34
Use pit 57 11 29 4 7 5
Cover with dry leaves 19 22 21 7 17 17
Put in warm place 5 7 6 24 14 12
Put in bags 7 4 5 17 19 18
Sample size 100 151 251 95 49 144 Source: CIP survey 2005

C I P W O R K I N G P A P E R S O C I A L S C I E N C E S 2 0 0 8 - 5
A D O P T I O N O F P O T A T O V A R I E T I E S I N K E N Y A A N D U G A N D A
44
Table 23. Fertilizer application details. Kenya Uganda Meru Central Nyandarua All Kabale Kisoro All
Percentage of farmers using chemical fertilizer
92 87 89 6 8 7
Fertilizer users applying
DAP 93 98 96 0 75 43
CAN 13 4 8 33 25 29
NPK 1 1 1 67 0 29
Amount of fertilizer applied (Kg/ha)
Average DAP used 295 248 267 0 331 330
Standard deviation 164 212 195 0 222 222
Median 248 165 248 0 402 402
Percentage of farmers using
Organic fertilizer (manure) 53 46 49 15 31 20
Average manure used (kg/ha)* 4,287 1,344 2,535 1,086 2,502 1,946
Standard deviation 3,954 2,237 3,365 1,678 4,087 3,382
Median 2,961 668 1,069 556 620 588
Sample size 100 151 251 95 49 144 Source: CIP survey 2005
Farmyard manure Farm yard manure could be an alternative or supplement to chemical fertilizer because it
contains a variety of nutrients and improves soil structure, which helps soil water retention
capacity. However, it is recommended to use very well composted farmyard manure or apply it
on the crop before potatoes instead of directly on the potato field. Especially in seed potato
production it is not recommended to use farmyard manure just before planting. The use of badly
composted manure increases incidences of Rhizoctonia. Farmers however rarely have enough
from their livestock to satisfy the full crop nutrient demand, while a manure market is not well
established both in Kenya and Uganda. As a result of the higher number of livestock, more
farmers reported using farm yard manure in Kenya (49%) compared to Uganda (20%).
C I P W O R K I N G P A P E R S O C I A L S C I E N C E S 2 0 0 8 - 5
A D O P T I O N O F P O T A T O V A R I E T I E S I N K E N Y A A N D U G A N D A
45
TOTAL OUTPUT, STORAGE, MARKETING AND UTILIZATION
Kenyan farmers harvested twice as much potatoes per household than Ugandan farmers mainly
because they had slightly larger fields and a higher yield per hectare (Table 24). Most farmers
from both countries however, do not store potatoes but sell directly from the field leading to glut
periods and depressed prices. This makes the rain dependent farmers very prone to exploitation
by brokers and traders. Also the brokers and traders do not store ware potato but deliver the
produce directly to the market. This results in widely fluctuating farm gate and market potato
prices, sometimes with the minimum and maximum prices varying by more than 70% (Kaguongo
et al, 2005a; Kaguongo et. al, 2005b). Storage of potatoes can help in leveling prices, assuming
lack of storage capacity rather then immediate cash needs are the main reason for selling
potatoes straight form the field.
Marketing Most of the sample farmers in Kenya and Uganda produced potato commercially and over 80% of
farmers had sold potatoes at least once in the last two seasons. Out of the few farmers who did
not sell any potato in Meru Central, Kabale and Kisoro districts, 90% said they produced just
enough for the family. However, in Nyandarua district 22% of farmers said they refused to sell,
and consumed or fed the potatoes to livestock because the prices were too low.
Meru Central district has the highest proportion of marketed potatoes with farmers selling 80% of
potato produced and consuming 9%, keeping for seed 8% and feeding to livestock or disposing
as wasting only 1% (Table 24). Nyandarua district has the highest proportion of potatoes fed to
livestock or wasted, confirming the farmers’ assertion that a lot of potatoes go to waste because
of poor prices and impassable roads due to bad weather.
Packaging
Farmers usually harvest potatoes when a field broker indicates a trader is coming (Photograph 4).
They sell potatoes packed in bags of different sizes which are supplied by traders and have
different weights when filled. Due to use of extended bags9 farmers sometime are not able to
know the actual amount they pack in the bag since they sell using bags instead of weight.
According to an informal survey by Kaguongo et al, (2005a) instead of using a standard bag of
100-110 kg per bag some farmers used extended bags that contain between 120 and 200 kg of
potatoes depending on target market. The use of extended bags was particularly common in
Uganda and Nyandarua district in Kenya (Table 24).
9 Wares are stacked above the brim to form a mound which is held together using net of strings.
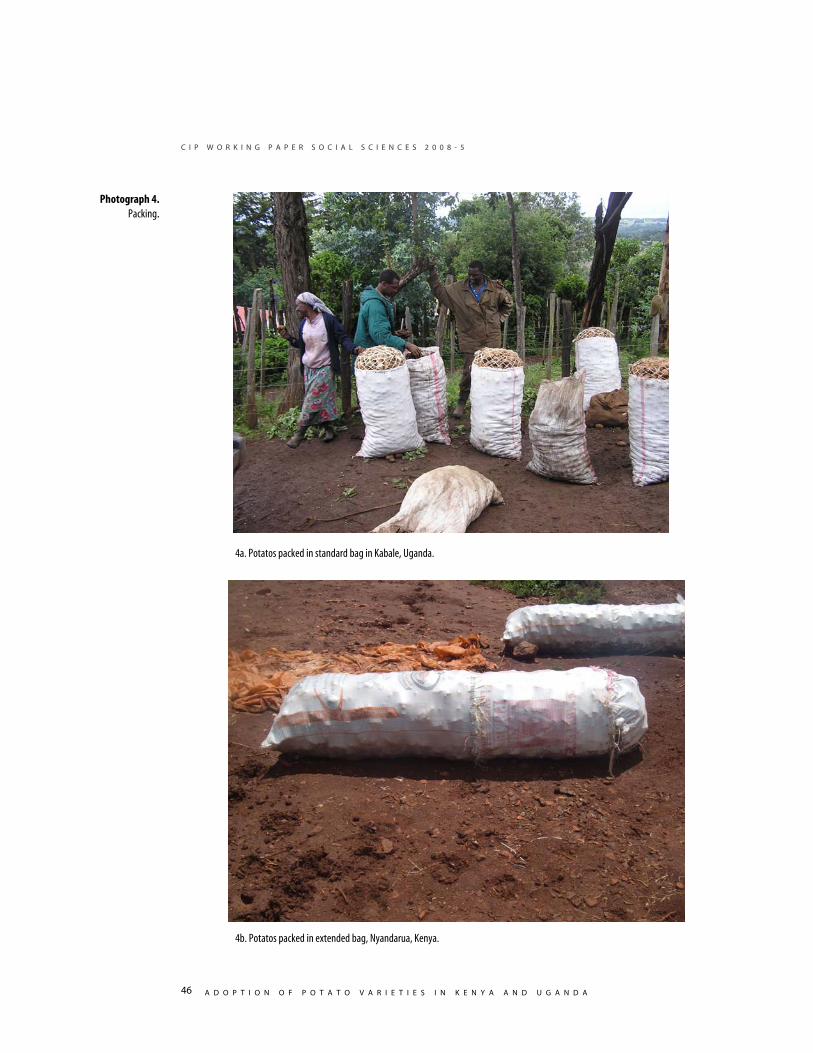
C I P W O R K I N G P A P E R S O C I A L S C I E N C E S 2 0 0 8 - 5
A D O P T I O N O F P O T A T O V A R I E T I E S I N K E N Y A A N D U G A N D A
46
4a. Potatos packed in standard bag in Kabale, Uganda.
4b. Potatos packed in extended bag, Nyandarua, Kenya.
Photograph 4. Packing.
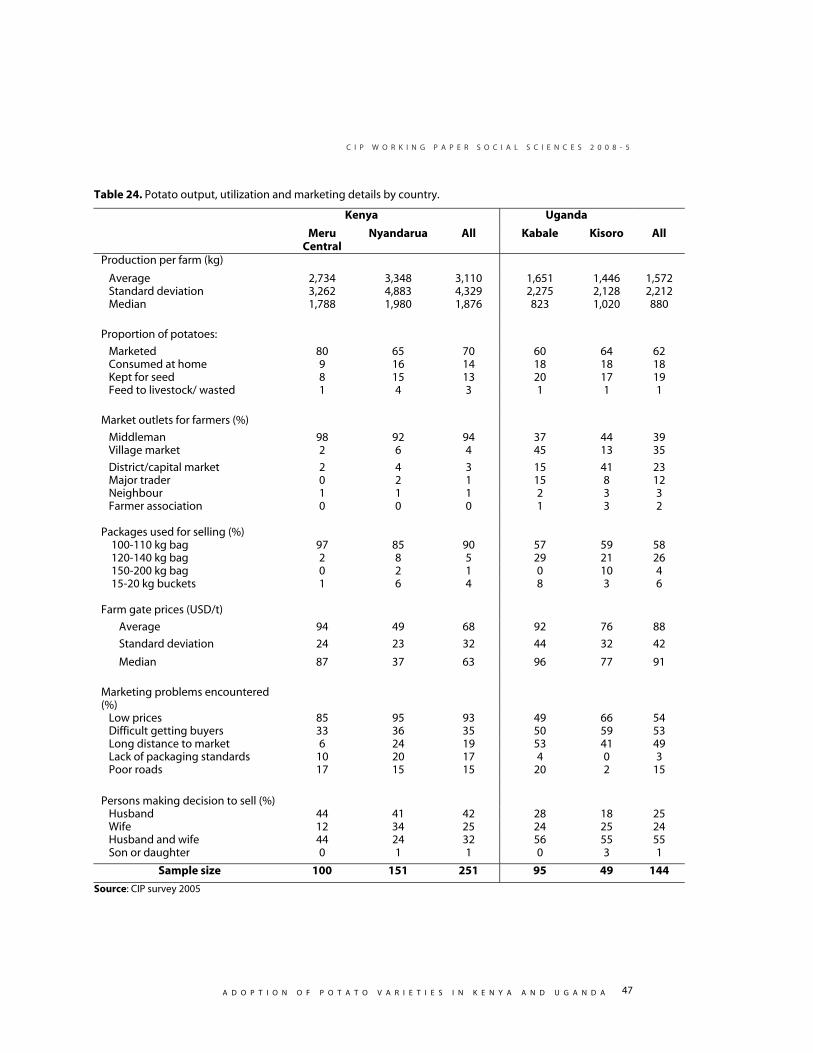
C I P W O R K I N G P A P E R S O C I A L S C I E N C E S 2 0 0 8 - 5
A D O P T I O N O F P O T A T O V A R I E T I E S I N K E N Y A A N D U G A N D A
47
Table 24. Potato output, utilization and marketing details by country.
Kenya Uganda
Meru Central
Nyandarua All Kabale Kisoro All
Production per farm (kg)
Average 2,734 3,348 3,110 1,651 1,446 1,572 Standard deviation 3,262 4,883 4,329 2,275 2,128 2,212 Median 1,788 1,980 1,876 823 1,020 880
Proportion of potatoes:
Marketed 80 65 70 60 64 62 Consumed at home 9 16 14 18 18 18 Kept for seed 8 15 13 20 17 19 Feed to livestock/ wasted 1 4 3 1 1 1
Market outlets for farmers (%)
Middleman 98 92 94 37 44 39 Village market 2 6 4 45 13 35
District/capital market 2 4 3 15 41 23 Major trader 0 2 1 15 8 12 Neighbour 1 1 1 2 3 3 Farmer association 0 0 0 1 3 2 Packages used for selling (%) 100-110 kg bag 97 85 90 57 59 58 120-140 kg bag 2 8 5 29 21 26 150-200 kg bag 0 2 1 0 10 4 15-20 kg buckets 1 6 4 8 3 6 Farm gate prices (USD/t)
Average 94 49 68 92 76 88
Standard deviation 24 23 32 44 32 42
Median 87 37 63 96 77 91
Marketing problems encountered (%)
Low prices 85 95 93 49 66 54 Difficult getting buyers 33 36 35 50 59 53 Long distance to market 6 24 19 53 41 49 Lack of packaging standards 10 20 17 4 0 3 Poor roads 17 15 15 20 2 15
Persons making decision to sell (%) Husband 44 41 42 28 18 25 Wife 12 34 25 24 25 24 Husband and wife 44 24 32 56 55 55 Son or daughter 0 1 1 0 3 1
Sample size 100 151 251 95 49 144
Source: CIP survey 2005

C I P W O R K I N G P A P E R S O C I A L S C I E N C E S 2 0 0 8 - 5
A D O P T I O N O F P O T A T O V A R I E T I E S I N K E N Y A A N D U G A N D A
48
Market outlets
Middlemen formed the major market outlets for farmers in both countries. In Kenya over 90% of
farmers sold their ware potatoes through middlemen, while village and district markets formed
market outlets for very few farmers. In Uganda, although middlemen formed important market
outlets, village and district markets combined formed the major outlets for the farmers. In Kabale
district particularly, the village market is the most important market outlet for most farmers.
Farm gate prices
Both in Kenya and Uganda, prices of potatoes vary with the season, region and skin color. Price
variation occurs from one season to another and from one division10 to another based on market
characteristics, such as distance to markets and road conditions. Farm gate prices are lowest
during harvesting time, especially when it rains in areas with poor roads. Average farm gate
prices in Meru Central district were higher than in Nyandarua district (Table 24), a finding
reflected in earlier observation by Durr and Lorenzl (1980).
Meru Central district has the highest mean price of USD 94/t and higher seasonal and regional
variations while Nyandarua has the lowest mean prices of USD 49/t and lower seasonal and
regional price variations. An informal survey indicated that farm gate prices in Meru Central
ranged between USD 61.8/t to 149.4/t while in Nyandarua district it ranged between USD 42.1/t
to 57.1/t (Kaguongo et al., 2005a).
Ngure, the predominant variety in Meru Central district has the highest farm gate price among all
the varieties in Kenya, averaging USD 97/t (Table 25). In order, Ngure is followed by Asante,
Desiree, Tigoni red and then Kerr’s Pink.
In Uganda, farm gate price for Kisoro district was 17% lower than that of Kabale district, with
Kisoro district price averaging USD 76/t while Kabale district averaged USD 92/t.
Farm gate prices in Uganda also varied with variety, with improved varieties fetching slightly
higher price than local varieties (Table 25). Victoria and Rutuku had the highest farm gate price
followed by Kinigi while. Bumbamagara and Rwangume are among the varieties with the lowest
farm gate prices (Appendix 2).
10 Several administrative units make one district
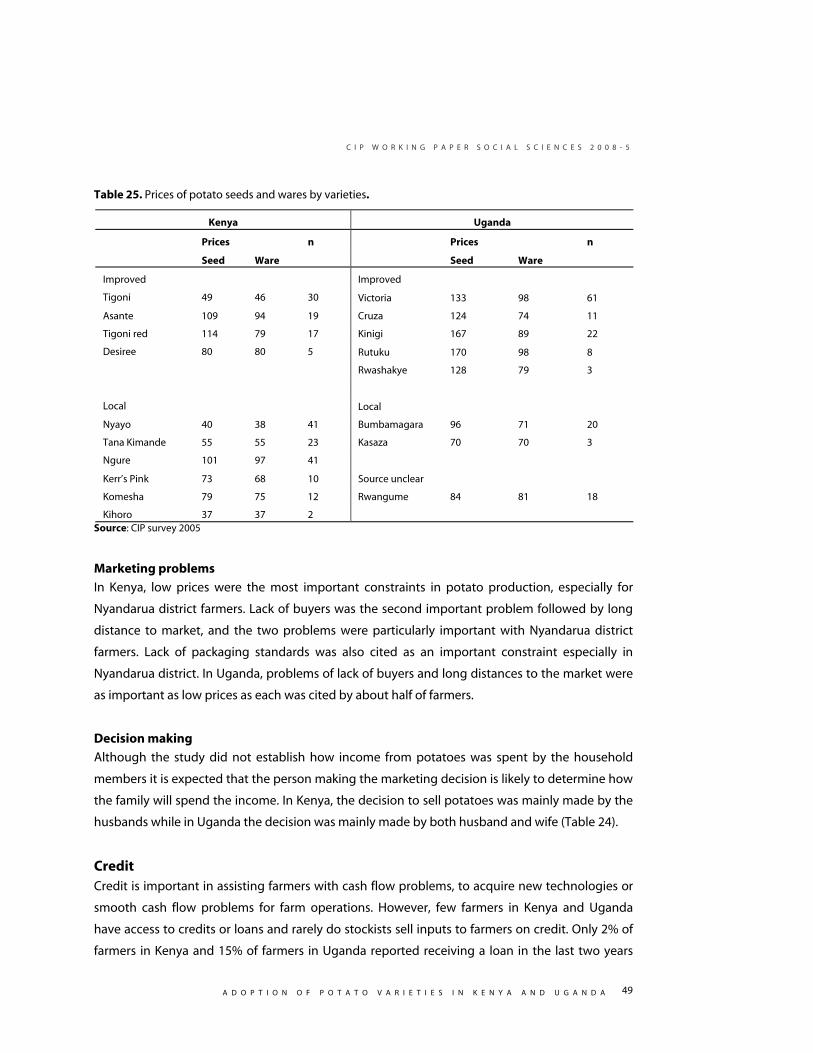
C I P W O R K I N G P A P E R S O C I A L S C I E N C E S 2 0 0 8 - 5
A D O P T I O N O F P O T A T O V A R I E T I E S I N K E N Y A A N D U G A N D A
49
Table 25. Prices of potato seeds and wares by varieties.
Kenya Uganda
Prices n Prices n
Seed Ware Seed Ware
Improved Improved
Tigoni 49 46 30 Victoria 133 98 61
Asante 109 94 19 Cruza 124 74 11
Tigoni red 114 79 17 Kinigi 167 89 22
Desiree 80 80 5 Rutuku 170 98 8
Rwashakye 128 79 3
Local Local
Nyayo 40 38 41 Bumbamagara 96 71 20
Tana Kimande 55 55 23 Kasaza 70 70 3
Ngure 101 97 41
Kerr’s Pink 73 68 10 Source unclear
Komesha 79 75 12 Rwangume 84 81 18
Kihoro 37 37 2 Source: CIP survey 2005
Marketing problems
In Kenya, low prices were the most important constraints in potato production, especially for
Nyandarua district farmers. Lack of buyers was the second important problem followed by long
distance to market, and the two problems were particularly important with Nyandarua district
farmers. Lack of packaging standards was also cited as an important constraint especially in
Nyandarua district. In Uganda, problems of lack of buyers and long distances to the market were
as important as low prices as each was cited by about half of farmers.
Decision making Although the study did not establish how income from potatoes was spent by the household
members it is expected that the person making the marketing decision is likely to determine how
the family will spend the income. In Kenya, the decision to sell potatoes was mainly made by the
husbands while in Uganda the decision was mainly made by both husband and wife (Table 24).
Credit Credit is important in assisting farmers with cash flow problems, to acquire new technologies or
smooth cash flow problems for farm operations. However, few farmers in Kenya and Uganda
have access to credits or loans and rarely do stockists sell inputs to farmers on credit. Only 2% of
farmers in Kenya and 15% of farmers in Uganda reported receiving a loan in the last two years
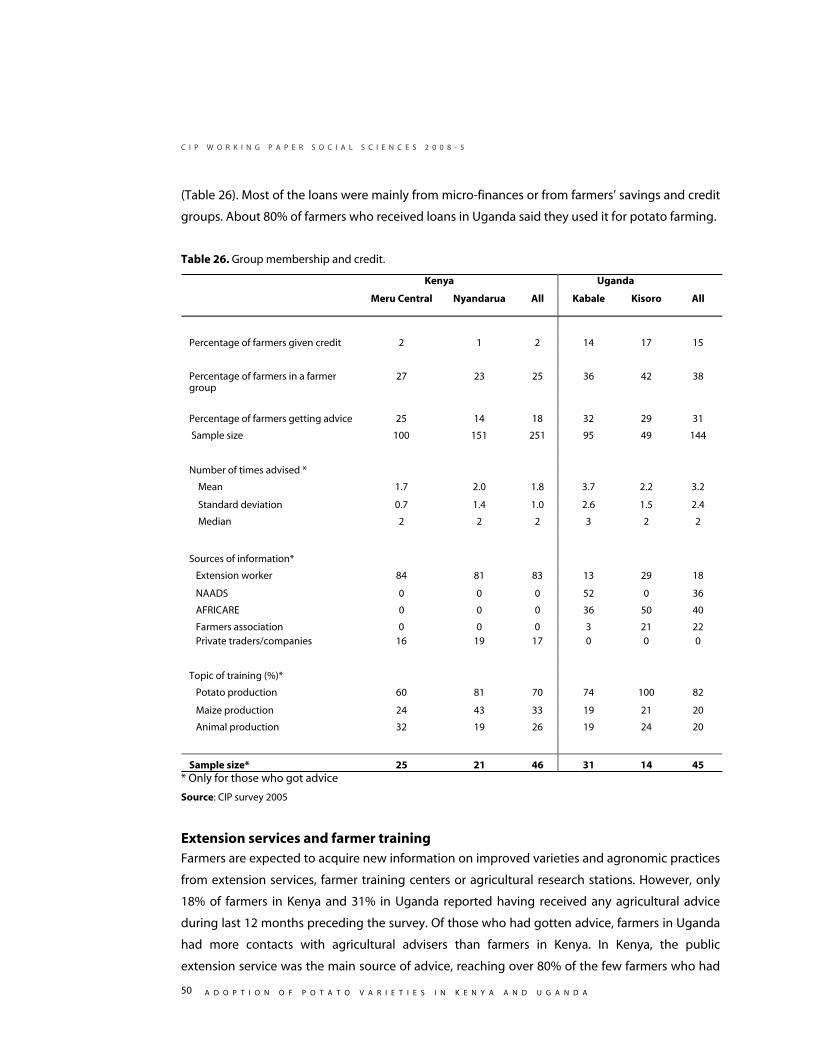
C I P W O R K I N G P A P E R S O C I A L S C I E N C E S 2 0 0 8 - 5
A D O P T I O N O F P O T A T O V A R I E T I E S I N K E N Y A A N D U G A N D A
50
(Table 26). Most of the loans were mainly from micro-finances or from farmers’ savings and credit
groups. About 80% of farmers who received loans in Uganda said they used it for potato farming.
Table 26. Group membership and credit.
Kenya Uganda
Meru Central Nyandarua All Kabale Kisoro All
Percentage of farmers given credit 2 1 2 14 17 15
Percentage of farmers in a farmer group
27 23 25 36 42 38
Percentage of farmers getting advice 25 14 18 32 29 31
Sample size 100 151 251 95 49 144
Number of times advised *
Mean 1.7 2.0 1.8 3.7 2.2 3.2
Standard deviation 0.7 1.4 1.0 2.6 1.5 2.4
Median 2 2 2 3 2 2
Sources of information*
Extension worker 84 81 83 13 29 18
NAADS 0 0 0 52 0 36
AFRICARE 0 0 0 36 50 40
Farmers association 0 0 0 3 21 22 Private traders/companies 16 19 17 0 0 0
Topic of training (%)*
Potato production 60 81 70 74 100 82
Maize production 24 43 33 19 21 20
Animal production 32 19 26 19 24 20
Sample size* 25 21 46 31 14 45 * Only for those who got advice
Source: CIP survey 2005
Extension services and farmer training Farmers are expected to acquire new information on improved varieties and agronomic practices
from extension services, farmer training centers or agricultural research stations. However, only
18% of farmers in Kenya and 31% in Uganda reported having received any agricultural advice
during last 12 months preceding the survey. Of those who had gotten advice, farmers in Uganda
had more contacts with agricultural advisers than farmers in Kenya. In Kenya, the public
extension service was the main source of advice, reaching over 80% of the few farmers who had
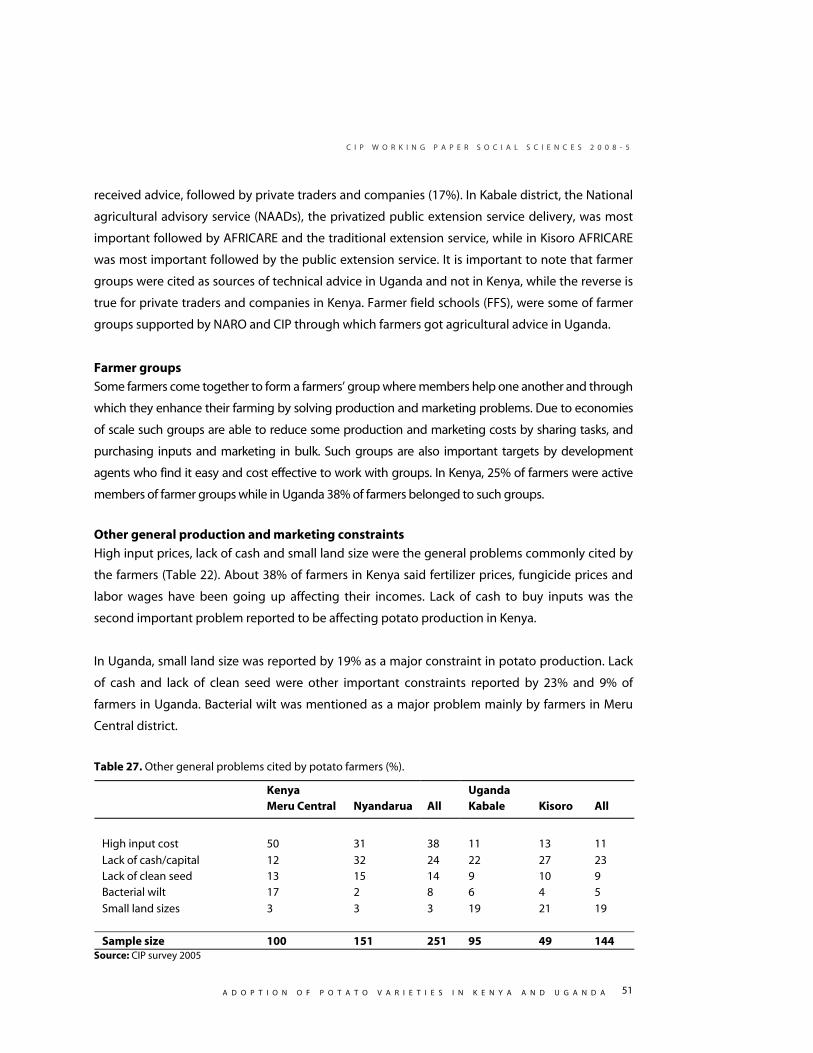
C I P W O R K I N G P A P E R S O C I A L S C I E N C E S 2 0 0 8 - 5
A D O P T I O N O F P O T A T O V A R I E T I E S I N K E N Y A A N D U G A N D A
51
received advice, followed by private traders and companies (17%). In Kabale district, the National
agricultural advisory service (NAADs), the privatized public extension service delivery, was most
important followed by AFRICARE and the traditional extension service, while in Kisoro AFRICARE
was most important followed by the public extension service. It is important to note that farmer
groups were cited as sources of technical advice in Uganda and not in Kenya, while the reverse is
true for private traders and companies in Kenya. Farmer field schools (FFS), were some of farmer
groups supported by NARO and CIP through which farmers got agricultural advice in Uganda.
Farmer groups
Some farmers come together to form a farmers’ group where members help one another and through
which they enhance their farming by solving production and marketing problems. Due to economies
of scale such groups are able to reduce some production and marketing costs by sharing tasks, and
purchasing inputs and marketing in bulk. Such groups are also important targets by development
agents who find it easy and cost effective to work with groups. In Kenya, 25% of farmers were active
members of farmer groups while in Uganda 38% of farmers belonged to such groups.
Other general production and marketing constraints
High input prices, lack of cash and small land size were the general problems commonly cited by
the farmers (Table 22). About 38% of farmers in Kenya said fertilizer prices, fungicide prices and
labor wages have been going up affecting their incomes. Lack of cash to buy inputs was the
second important problem reported to be affecting potato production in Kenya.
In Uganda, small land size was reported by 19% as a major constraint in potato production. Lack
of cash and lack of clean seed were other important constraints reported by 23% and 9% of
farmers in Uganda. Bacterial wilt was mentioned as a major problem mainly by farmers in Meru
Central district.
Table 27. Other general problems cited by potato farmers (%).
Kenya Uganda Meru Central Nyandarua All Kabale Kisoro All
High input cost 50 31 38 11 13 11
Lack of cash/capital 12 32 24 22 27 23 Lack of clean seed 13 15 14 9 10 9 Bacterial wilt 17 2 8 6 4 5
Small land sizes 3 3 3 19 21 19
Sample size 100 151 251 95 49 144 Source: CIP survey 2005

C I P W O R K I N G P A P E R S O C I A L S C I E N C E S 2 0 0 8 - 5
A D O P T I O N O F P O T A T O V A R I E T I E S I N K E N Y A A N D U G A N D A
52
ECONOMICS OF POTATO PRODUCTION
Yields difference between local and improved varieties Average potato yield for the two countries remain low (7,720 kg/ha) compared to the potential
yields, and vary significantly from one variety to another and from country to country (Table 28).
Two season data indicated that Kenya had 56% higher mean yield and 58% higher median yield
than Uganda. Although agro-ecological conditions, rainfall and other abiotic factors may be
playing a major role the large differences may also be attributed to management practices, with a
higher percentage of Kenyan farmers adopting improved management practices such as
irrigation, fertilizer use and a higher seed rate. Mean yields for improved varieties were higher
than for local varieties in both countries.
In Kenya, Tigoni had the highest yield and this could explain why adoption is increasing; in Uganda
Kinigi had the highest yields and adoption is also increasing. The two varieties were perceived by
farmers as high yielding. Asante which is grown in Meru Central district has high yield compared to
Ngure and Kerr’s pink and the reason fewer farmers were growing Asante could be that it is still
being grown by early adopters and it is yet to reach the take-off stage. ‘Tigoni red’ which is mainly
grown in Meru Central district was rated as high yielding although its mean yield was lower than
that of Asante, Ngure and Kerr’s pink grown in the same district. However, the median yield of
Tigoni red was higher than that of Kerr’s pink which it has largely replaced.
Yield gains from improved varieties
In general, the improved varieties have higher yields than local varieties (Table 28). In Kenya,
Tigoni and Asante, the two most common improved varieties are among the three varieties
yielding over 10t/ha, while Nyayo and Ngure, the most commonly grown local varieties have
lower yields. However, Tana Kimande, one of farmers selection had also high yields of 10t/ha. On
average, farmers in Kenya appear to have benefited from adopting improved yields by additional
yield of 0.7t/ha. However, the economic benefits of adoption of improved varieties would be
better estimated by also considering differences between the two districts with regard to variety
preferences, agronomic practices and marketing conditions using multivariable analysis.
Similarly, in Uganda most of the improved varieties had higher yields compared to local varieties.
Kinigi, Rutuku and Victoria are improved varieties and are regarded by farmers as high yielding.
Rwangume is also among the high yielding varieties but its origin is not clear. Farmers in Uganda
growing improved varieties had an additional yield of 3.9t/ha compared to those growing local
varieties.
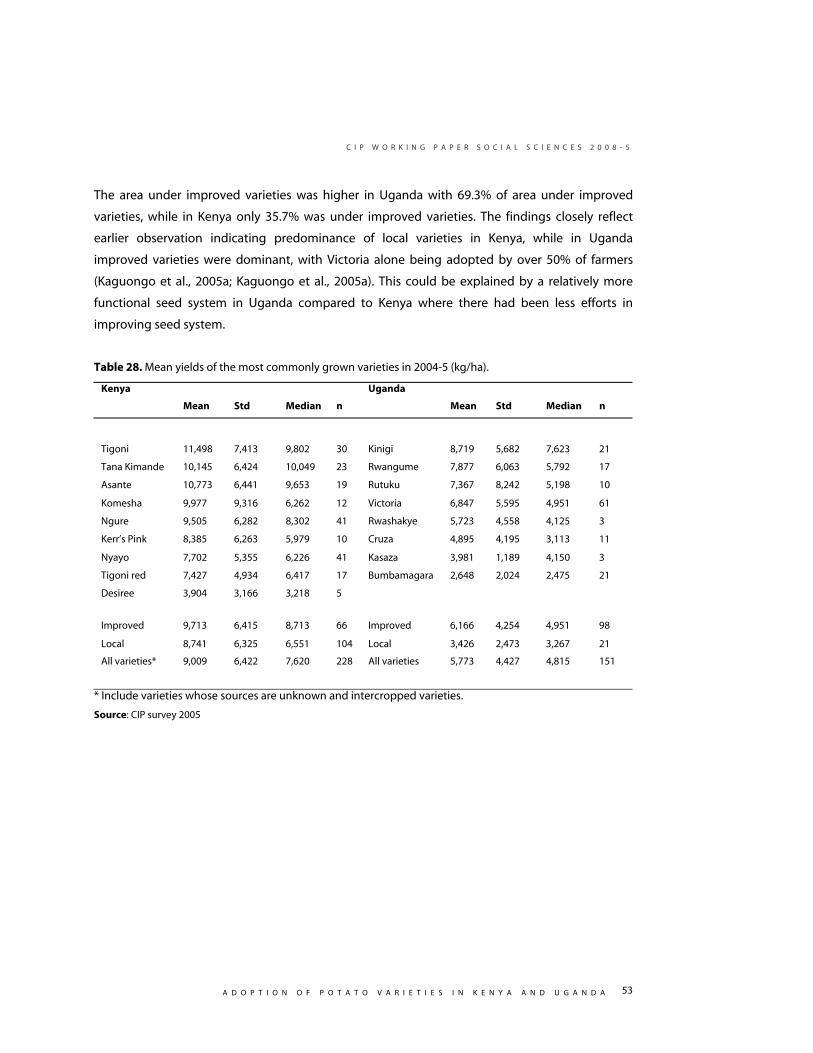
C I P W O R K I N G P A P E R S O C I A L S C I E N C E S 2 0 0 8 - 5
A D O P T I O N O F P O T A T O V A R I E T I E S I N K E N Y A A N D U G A N D A
53
The area under improved varieties was higher in Uganda with 69.3% of area under improved
varieties, while in Kenya only 35.7% was under improved varieties. The findings closely reflect
earlier observation indicating predominance of local varieties in Kenya, while in Uganda
improved varieties were dominant, with Victoria alone being adopted by over 50% of farmers
(Kaguongo et al., 2005a; Kaguongo et al., 2005a). This could be explained by a relatively more
functional seed system in Uganda compared to Kenya where there had been less efforts in
improving seed system.
Table 28. Mean yields of the most commonly grown varieties in 2004-5 (kg/ha).
Kenya Uganda
Mean Std Median n Mean Std Median n
Tigoni 11,498 7,413 9,802 30 Kinigi 8,719 5,682 7,623 21
Tana Kimande 10,145 6,424 10,049 23 Rwangume 7,877 6,063 5,792 17
Asante 10,773 6,441 9,653 19 Rutuku 7,367 8,242 5,198 10
Komesha 9,977 9,316 6,262 12 Victoria 6,847 5,595 4,951 61
Ngure 9,505 6,282 8,302 41 Rwashakye 5,723 4,558 4,125 3
Kerr’s Pink 8,385 6,263 5,979 10 Cruza 4,895 4,195 3,113 11
Nyayo 7,702 5,355 6,226 41 Kasaza 3,981 1,189 4,150 3
Tigoni red 7,427 4,934 6,417 17 Bumbamagara 2,648 2,024 2,475 21
Desiree 3,904 3,166 3,218 5
Improved 9,713 6,415 8,713 66 Improved 6,166 4,254 4,951 98
Local 8,741 6,325 6,551 104 Local 3,426 2,473 3,267 21
All varieties* 9,009 6,422 7,620 228 All varieties 5,773 4,427 4,815 151
* Include varieties whose sources are unknown and intercropped varieties.
Source: CIP survey 2005
C I P W O R K I N G P A P E R S O C I A L S C I E N C E S 2 0 0 8 - 5
A D O P T I O N O F P O T A T O V A R I E T I E S I N K E N Y A A N D U G A N D A
54
PROFITABILITY
Kenya Input and labor costs
On average, cost of seed constituted the highest proportion of the total input costs followed by
the cost of fertilizer11. The costs of inputs for improved and local varieties in Meru Central district
were similar. However, costs of inputs for both types of varieties were generally higher in Meru
Central district compared to Nyandarua district (Table 29). Manure cost was the lowest input cost
in the two districts for the two types of varieties. In Nyandarua district, local variety had the
lowest fertilizer cost among the two categories.
To cost labor, two assumptions are used: in the first family labor is treated as fixed and in the
second an opportunity cost is used for family labor. This is because we appreciate how difficult it
is for a farmer to quantify family labor apportioned to specific production activities and the
difficulty in valuing the worth of family labor (Appendix 4). Either of the two approaches would
give similar results in this analysis because the main objective is to compare profitability of
improved and local varieties, and this is not very sensitive to differences in the cost of labor.
Labor costs for various production activities did not vary much between districts and variety
types (Table 29). Only harvesting labor cost for improved varieties in Meru Central district was
considerably lower than others, with no reason that was found. In general, the total production
cost for Meru Central district was higher than that of Nyandarua district, mainly because of high
costs of seeds, manure and fertilizers indicating intensive farming in Meru Central district.
Production costs for 1977 for Meru Central and Nyandarua districts followed similar pattern, as
observed by Durr and Lorenzl (1980).
Farmers in Meru Central districts incurred higher cost of fungicides on local varieties compared to
farmers in Nyandarua districts, possibly because Meru Central farmers considered the local
varieties to be more susceptible to late blight but they were willing to invest more them in
disease control because of their high returns.
Returns
Gross returns were calculated using farm gate prices and output per hectare. Gross returns for
Meru CentralMeru Central district were higher than that of Nyandarua district, and hence more
than compensated for the higher production cost. Findings by Durr and Lorenzl (1980) also
showed Meru CentralMeru Central district had higher net returns than Nyandarua district. In
11 Opportunity cost was used for farmers using seeds from their own harvests or neighbors.
C I P W O R K I N G P A P E R S O C I A L S C I E N C E S 2 0 0 8 - 5
A D O P T I O N O F P O T A T O V A R I E T I E S I N K E N Y A A N D U G A N D A
55
Meru CentralMeru Central district, the local varieties tend to be more profitable compared to the
improved varieties mainly because the mean yield of local variety tended to be higher than mean
yield of improved variety (Table 29). While Asante is high yielding the mean yield of improved
varieties for the district is pulled down by the low yielding Tigoni red and Desiree (Table 28).
Similarly, the mean prices of local and improved varieties are the same (Table 29) because the
high prices of the predominant Ngure variety is pulled down by other local varieties such as Kerr’s
Pink and Komesha (Table 25). However, on average the net return to planting local varieties was
higher than that of improved varieties by 284/ha per year ($142/ha per season)12.
In Nyandarua district, a simple comparison of means suggests that improved varieties were more
profitable than local varieties although the net return was lower than that of local and improved
varieties in Meru Central district. Low net returns in Nyandarua district could be attributed to low
prices and other marketing problems in the district. In Nyandarua district improved varieties had
higher net returns than local varieties by USD 204 per year ($102/ha per season). This could be
mainly because the yields and prices of improved varieties tended to be higher than that of local
varieties.
When opportunity cost of family labor is used in the analysis the net returns reduce significantly
and becomes negative for local varieties in Nyandarua district as shown in Table 29 below. Durr
and Lorenzl (1980) also obtained negative net returns for Nyandarua district when family labor
was costed. However, in Meru Central district local varieties remain more profitable than
improved varieties by USD 270 per ha per year ($135/ha per season) and in Nyandarua district
improved variety has higher net returns than local varieties by USD 338 per ha per year ($162/ha
per season).
Variety profitability
The local varieties were most profitable with Ngure having the highest net returns followed by
Meru Mugaruro and Komesha (Appendix 2). The high net returns could explain why Ngure has
highly been adopted in Meru Central district. Nyayo, the most predominant variety in Nyandarua
district has very low net returns explaining why farmers complained about poor market.
However, these figures need to interpreted with caution as additional analysis using multivariate
analysis is necessary to distinguish the effect of varietal change from other confounding factors
such as differences in input use or differences in environmental factors between farmers growing
improved and local varieties.
12 Most farmers grown potatoes two times per a year.
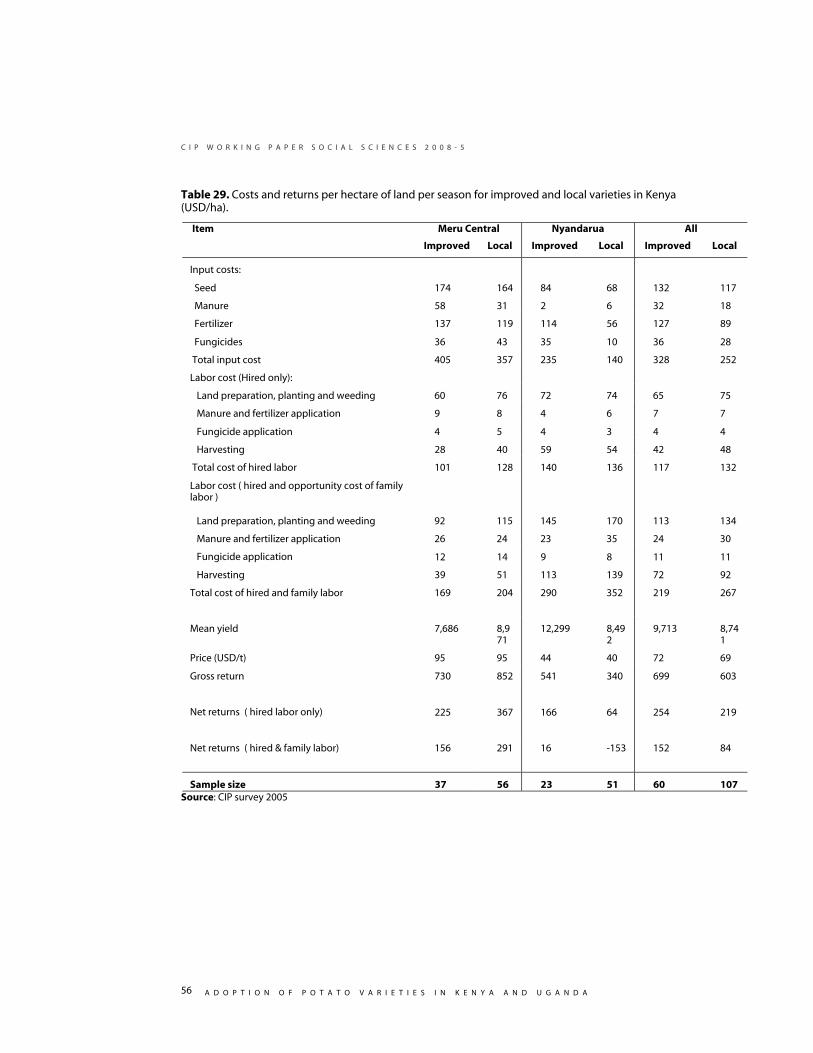
C I P W O R K I N G P A P E R S O C I A L S C I E N C E S 2 0 0 8 - 5
A D O P T I O N O F P O T A T O V A R I E T I E S I N K E N Y A A N D U G A N D A
56
Table 29. Costs and returns per hectare of land per season for improved and local varieties in Kenya (USD/ha).
Item Meru Central Nyandarua All
Improved Local Improved Local Improved Local
Input costs:
Seed 174 164 84 68 132 117
Manure 58 31 2 6 32 18
Fertilizer 137 119 114 56 127 89
Fungicides 36 43 35 10 36 28
Total input cost 405 357 235 140 328 252
Labor cost (Hired only):
Land preparation, planting and weeding 60 76 72 74 65 75
Manure and fertilizer application 9 8 4 6 7 7
Fungicide application 4 5 4 3 4 4
Harvesting 28 40 59 54 42 48
Total cost of hired labor 101 128 140 136 117 132
Labor cost ( hired and opportunity cost of family labor )
Land preparation, planting and weeding 92 115 145 170 113 134
Manure and fertilizer application 26 24 23 35 24 30
Fungicide application 12 14 9 8 11 11
Harvesting 39 51 113 139 72 92
Total cost of hired and family labor 169 204 290 352 219 267
Mean yield 7,686 8,971
12,299 8,492
9,713 8,741
Price (USD/t) 95 95 44 40 72 69
Gross return 730 852 541 340 699 603
Net returns ( hired labor only) 225 367 166 64 254 219
Net returns ( hired & family labor) 156 291 16 -153 152 84
Sample size 37 56 23 51 60 107 Source: CIP survey 2005
C I P W O R K I N G P A P E R S O C I A L S C I E N C E S 2 0 0 8 - 5
A D O P T I O N O F P O T A T O V A R I E T I E S I N K E N Y A A N D U G A N D A
57
Uganda Input and labor costs
Cost of seed forms the single most important cost of potato production in Uganda, constituting
over 60% of total production cost (Table 30)13. At the same time seed cost of improved varieties
were higher compared to that of local varieties. Costs of manure and fertilizer were negligible
when compared to those of Kenyan farmers. The amount spent on fungicides for improved
varieties was higher than for local varieties in the two districts. This is consistent with farmers’
perceptions that Victoria is highly susceptible to late blight.
When only hired labor is considered, total labor cost for land preparation, planting and weeding
for improved varieties were generally higher than that for local varieties, because the more
commercially oriented larger scale potato farmers tended to use the more profitable improved
varieties.
Returns
Gross return was calculated using farm gate prices and output per hectare. Gross returns for
improved varieties were higher than for local varieties in the two district of Uganda mainly
because they are high yielding and they fetched higher prices. Hence improved varieties are
more profitable than local varieties (Table 30). Farmers in Kabale district obtained extra USD 254
per ha ($127/ha per season) from growing improved varieties while Kisoro farmers obtained an
extra USD 416 per ha ($208/ha per season) from growing improved verities. The entire Uganda
sample farmers growing improved varieties obtained an extra USD 358 per ha ($179/ha per
season) compared to those growing local varieties.
Including opportunity cost of family labor in the analysis reduced the net returns of local varieties
significantly but marginally affected the net returns for improved varieties, indicating that local
varieties mainly used family labor, while production of improved varieties highly depended on
hired labor. Improved varieties remained more profitable than local varieties by USD 400/ha per
year ($200/ha per season) in Kabale district and USD 386/ha per year in Kisoro district. The entire
Uganda sample farmers obtained an average USD 408 /ha (per season) extra from growing
improved varieties, although as was noted above additional analysis is needed to separate the
effect of varietal change from other confounding factors.
13 Opportunity cost was used for farmers using seeds from their harvests or neighbors.
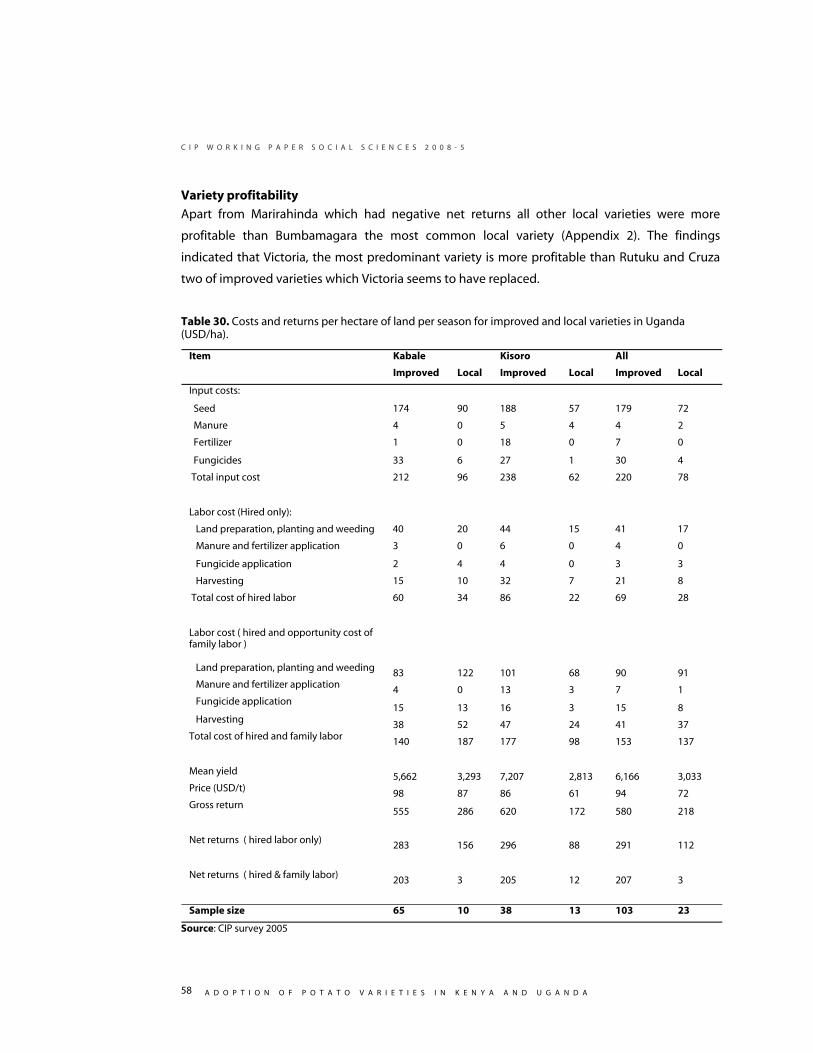
C I P W O R K I N G P A P E R S O C I A L S C I E N C E S 2 0 0 8 - 5
A D O P T I O N O F P O T A T O V A R I E T I E S I N K E N Y A A N D U G A N D A
58
Variety profitability
Apart from Marirahinda which had negative net returns all other local varieties were more
profitable than Bumbamagara the most common local variety (Appendix 2). The findings
indicated that Victoria, the most predominant variety is more profitable than Rutuku and Cruza
two of improved varieties which Victoria seems to have replaced.
Table 30. Costs and returns per hectare of land per season for improved and local varieties in Uganda (USD/ha).
Item Kabale Kisoro All
Improved Local Improved Local Improved Local
Input costs:
Seed 174 90 188 57 179 72
Manure 4 0 5 4 4 2
Fertilizer 1 0 18 0 7 0
Fungicides 33 6 27 1 30 4
Total input cost 212 96 238 62 220 78
Labor cost (Hired only):
Land preparation, planting and weeding 40 20 44 15 41 17
Manure and fertilizer application 3 0 6 0 4 0
Fungicide application 2 4 4 0 3 3
Harvesting 15 10 32 7 21 8
Total cost of hired labor 60 34 86 22 69 28
Labor cost ( hired and opportunity cost of family labor )
Land preparation, planting and weeding 83 122 101 68 90 91 Manure and fertilizer application 4 0 13 3 7 1 Fungicide application
15 13 16 3 15 8 Harvesting 38 52 47 24 41 37 Total cost of hired and family labor 140 187 177 98 153 137
Mean yield 5,662 3,293 7,207 2,813 6,166 3,033 Price (USD/t) 98 87 86 61 94 72 Gross return
555 286 620 172 580 218 Net returns ( hired labor only) 283 156 296 88 291 112
Net returns ( hired & family labor) 203 3 205 12 207 3
Sample size 65 10 38 13 103 23
Source: CIP survey 2005
C I P W O R K I N G P A P E R S O C I A L S C I E N C E S 2 0 0 8 - 5
A D O P T I O N O F P O T A T O V A R I E T I E S I N K E N Y A A N D U G A N D A
59
Conclusions and Recommendations Potato farmers in Kenya and Uganda in this study had a lot in common but dissimilarities did exist
in socio-economic characteristics, asset ownership and agronomic practices. Kenyan farmers
owned slightly more livestock, equipment and land and a higher proportion of household heads
had completed primary education compared to their Ugandan counterparts. Mean cultivated
area was the same for the two countries, although Kenyan farmers had slightly higher area under
potato production and more land under irrigation.
Farmers in the two countries were also faced with different consumer preferences that affected
choices of varieties grown. CIP 381381.20 has had wider diffusion in Uganda (under the released
name Victoria) compared to Kenya (under the name Asante) mainly driven by clear preferences
for red-skinned varieties throughout Uganda compared to Kenya (where preferences for white-
skinned and red-skinned varieties vary considerably among major growing areas).
Market demand emerged as the most important criterion underlying variety selection. The second
most important criterion for farmers was yield, followed by the fit of the variety in their cropping
system, in terms of earliness, and then taste was the next important attribute. Although disease
resistance is an important attributes it plays a limited role in adoption of varieties with high market
demand. For example, in Meru Central district the predominant variety was relatively more
susceptible to late blight than other available varieties. Farmers were cognizant of this drawback,
but continue producing it because it fetched a higher price and fungicides were available to control
the problem. Tigoni, a high yielding white skinned variety, has had limited adoption in Meru Central
district but was well accepted in Nyandarua district where consumer preferences concerning skin
color differ from those in Meru. This study therefore stresses the need to orient goals of CIP and its
partners to selecting market and farmer preferred potato varieties, that are adapted to local
cropping system and which carry useful late blight resistance levels.
Several varieties continued to be grown for home consumption despite their low market value
due to taste and early maturity traits. For example, the second most important variety in Uganda,
Bumbamagara, was considered less marketable but more tasty and early maturing than other
varieties.
While disease resistance is clearly an underlying driver of yield, no farmer specifically mentioned
late-blight tolerant varieties as a method for late-blight control. The majority of farmers in both
countries used fungicides to control late blight. Although the predominant varieties in the two
countries, Nyayo and Ngure in Kenya and Victoria in Uganda were rated poorly in disease
C I P W O R K I N G P A P E R S O C I A L S C I E N C E S 2 0 0 8 - 5
A D O P T I O N O F P O T A T O V A R I E T I E S I N K E N Y A A N D U G A N D A
60
tolerance they faced high demand in their respective areas of production. However, the degree
to which a variety was considered susceptible to late-blight depends on the range of late-blight
resistant materials in the area. Interestingly, CIP 381381.20 (Asante in Kenya and Victoria in
Uganda) was regarded as late blight resistant in Kenya while in Uganda it was rated as
susceptible to the disease. A plausible explanation of this difference is that farmers in Uganda
were used to varieties such as Rutuku and Cruza which have high resistance to late blight.
Thus, farmers appeared to underestimate the actual benefits of adopting late-blight resistant
varieties in both countries. This is due in part to the cost of controlling late blight on susceptible
varieties being low compared to the cost of seed and other inputs. Most farmers were unaware of
the potential economic losses incurred through incorrect fungicide application and the health
risk posed by use of fungicides. A study relating late blight prevalence and farmers use of
fungicides to quantify the economic losses incurred by farmers and possible health risk caused by
improper method of fungicide use is therefore recommended.
Distinct differences in agronomic practices in the two countries existed. In particular, Kenyan
farmers used higher seed rates and more intense fertilizer applications than farmers in Uganda.
This explains the higher yields found for Kenyan farmers compared to Ugandan farmers, but
lower profitability due to high production cost-an indication that Kenyan farmers could have
been operating at economically sub-optimal levels. Furthermore, the almost similar
multiplication ratio of 6 for the two countries can not explain the relatively intensive husbandry in
Kenya. This may mean that the predominant varieties grown in Kenya are of low genetic potential
and farmer stand to gain substantially by adopting higher yielding varieties. However, input and
output market conditions could be contributing to most of the imbalances. Further in-depth
market analysis is essential for untangling the contribution of each underlying factor. More in-
depth analysis should also demonstrate whether farmers in Uganda stand to gain by intensifying
management of the crop.
Self supply and neighbor supply were the predominant sources of seed for potato farmers in
both Kenya and Uganda. The performance or quality of the seeds from these sources was
doubtful leading to reduced yields. Access to certified seed is limited due to lack of supply and
high per unit cost. Past efforts in development of seed system have concentrated on improved
seed production by government parastatals, while current interventions in seed potato systems
are concentrated on developing specialized seed multipliers. However, multiple strategies,
including greater involvement of the private sector, are clearly needed to address bottlenecks in
potato seed production. These strategies should include interventions to improve the quality of

C I P W O R K I N G P A P E R S O C I A L S C I E N C E S 2 0 0 8 - 5
A D O P T I O N O F P O T A T O V A R I E T I E S I N K E N Y A A N D U G A N D A
61
the self and neighbor supply seed as they are likely to remain the most common source of seed
for smallholders, at least in the medium term.
The majority of farmers from both countries sell their ware potato on harvesting leading to glut
periods and depressed prices. Increased potato storage use could even out supply over the
season, thus reducing price fluctuations. However, construction of storage facilities for larger
farmers may require credit facilities and additional analysis of price seasonality and storage losses
is needed to assess the financial viability of these facilities.
The findings clearly demonstrate that profitability of potato production in Kenya varies
considerably between regions and among varieties. In Meru Central district, farmers with
improved varieties had lower net returns than those growing local varieties while the opposite
was true in Nyandarua district. Districts with production and marketing characteristics similar to
those of Nyandarua district are expected to have similar benefits from adoption of improved
varieties. A note of caution is necessary in interpreting these results as additional analysis using
multivariate analysis is necessary to distinguish the effect of varietal change from other
confounding factors such as differences in input use or differences in environmental factors
between farmers growing improved and local varieties. Substantial improvement in profitability,
however, depends on improved market conditions, including more efficient linkages between
producers, traders, and consumers.
C I P W O R K I N G P A P E R S O C I A L S C I E N C E S 2 0 0 8 - 5
A D O P T I O N O F P O T A T O V A R I E T I E S I N K E N Y A A N D U G A N D A
62
REFERENCES
Adipala, E. 1999. Potato Production in Uganda: A Survey Perspective. A report to Rockefeller
Foundation by Dept. of Crop Science Makerere University, Kampala, Uganda. 41p.
Akimanzi, D.R. 1982. Potato development and transfer of technology in Uganda. In: Nganga, S.
(ed.). Regional workshop on potato development and transfer of technology in tropical Africa.
Addis Ababa (Ethiopia). 22-31 Aug 1982. Nairobi (Kenya). International Potato Center (CIP).
Region III. pp. 52-54.
Aliguma, A. 2002. The Marketing, Processing and Export Opportunities for Irish potatoes in
Uganda. Unpublished.
Ashley, S. and Nanyeenya, W. 2002. More Than Income: Pro-Poor Livestock Development Policy
in Uganda. Ladder working Paper No. 8. LADDER website www.odg.uea.ac.uk/ladder .
Baker, K.M, Kirk, W.W., Andresen J. and Stein, J.M. 2004. A problem case study: Influence of
climatic trends on late blight epidemiology in potatoes. Acta Hort 638: 37-42.
CIP. 2007. Potato / Late Blight Overview. April, 2007-
http://www.cipotato.org/potato/pests_diseases/late_blight
Cole D.C., Carpio, F., Julian, J. and Leon, N. 1997. “Dermatitis in Ecuadorian farm workers”.
Contact Dermatitis 137:1-8.
Crissman, C., Cole, D., Sherwood, S., Espinosa, P. and Yanggen, D. 2002. Potato Production
and Pesticide Use in Ecuador: Linking Impact Assessment. Research and Rural Development
Intervention for Greater Eco-system Health.
Crissman, C.C., McArthur, L. and Carli, C. 1993. Seed Potato Systems in Kenya: A Case Study.
Lima, International Potato Center. 44 p.
Durr, G. and Lorenzl, G. 1980. Potato Production and Utilization in Kenya. Centro Internacional
de la Papa. Lima, Peru. 133 p.
C I P W O R K I N G P A P E R S O C I A L S C I E N C E S 2 0 0 8 - 5
A D O P T I O N O F P O T A T O V A R I E T I E S I N K E N Y A A N D U G A N D A
63
ECAPAPA, PRAPACE, ASARECA. 2005. The Potato and Sweetpotato Sub-Sector Analysis: A
Review of Sub-Sector Status, Constraints, Opportunities and Investment Priorities.
El-Bedewy, R., Olanya, O.M., Ewell, P.T., Lung’aho, C., Ojiambo, P.S. and Karinga, J. 2001.
Evaluation of potato germplasm (populations A & B) for resistance to late blight in Kenya, African
Crop Science Journal, 9: 215-224.
Gildemacher, P.R, Maina, P., Nyongesa, M., Kinyae, P., Gebremedhin, W., Lema, Y., Damene,
B., Shiferaw, T., Kakuhenzire, R., Kashaija, I., Musoke, C., Mudiope, J., Kahiu, I., Ortiz, O.
2006. Participatory Analysis of the Potato Knowledge and Information System in Ethiopia, Kenya
and Uganda. Paper presented at the Innovation Africa Symposium, 20-23 September 2006.
Kampala, Uganda.
Kaguongo W., Kinyae, P., Demo, P., Gildemacher, Peter. 2005a. A Rapid Appraisal of Potato
Production in Kenya.
Kaguongo, W., Wagoire, W, Demo, P. and Gildemacher, P. 2005b. A Rapid Appraisal of Potato
Production in Uganda.
Kakuhenzire, R., Hakiza, J.J., Adipala, E., Wagoire, W. and Lemaga, B. 2004. Yield stability and
acceptability of two new Solanum potato varieties in Uganda. Uganda Journal of Agricultural
Sciences 9: 718-722.
KARI. 2004. Annual Report 2003. Kenya Agricultural Research Institute, National Potato Research
Centre-Tigoni, Limuru, Kenya.
KARI. 2002. Annual Report 2000. Kenya Agricultural Research Institute, National Potato Research
Center-Tigoni, Limuru, Kenya
Kinyae, P.M., Lung’aho, C., Walingo, A., Kipkoech, D.N., Nambiro E., Ng’ang’a N.M, ,Wakahiu
M., Kabira J.N. and Mwang,i P. 2004. Impact Assessment and Achievements of potato
technologies. Unpublished report.
Kirumba, W., Kinyae, P. and Muchara, M. 2004. Irish Potato Market Survey: Promotion of Private
Sector Development in Agriculture (PSDA). GTZ/MOA .

C I P W O R K I N G P A P E R S O C I A L S C I E N C E S 2 0 0 8 - 5
A D O P T I O N O F P O T A T O V A R I E T I E S I N K E N Y A A N D U G A N D A
64
Low, J. 1996. Prospects for Sustaining Potato and Sweetpotato Cropping Systems in the Densely-
Populated Highlands of Southwest Uganda. August, 1996. International Potato Center, Nairobi,
Kenya.
Low, J. 2000. Prospects for Sustaining Potato and Sweetpotato Cropping Systems in the Densely-
Populated Highlands of Southwest Uganda. International Potato Center, Social Science
Department, Working Paper No. 2000-1.
McArthur, Crissman, L. 1989. Evaluation, Choice and Use of Potato Varieties in Kenya. Social
Science Department, Working Paper 1989-1. International Potato Center. Lima, Peru.
Michieka, A.O. 1993. Screening CIP potato germplasm for resistance to Pseudomonas
solanacearum E.F. Smith. Proceedings of a workshop on Bacterial wilt of potato caused by
Pseudomonas solanacearum, February 22-26, 1993, Bujumbura, Burundi. pp. 27-31.
Namanda, S., Olanya, O.M., Adipala, E., Hakiza, J.J., El-Bedewy R, Baghsari, A.S. and Ewell, P.
2004. Fungicide application and host-resistance for potato late blight management: benefits
assessment from on-farm studies in S.W. Uganda. Crop Protection, 23: 1075-1083.
Njuguna, J.G.M, Oduor, G.I., Njenga, D.N. 1998. Rate of adoption of the new late blight
resistant potato cultivars by farmers in Kiambu district. Pp 196-202; In: Proceedings of the 2nd
Biennial Crop Protection Conference, KARI/NARL, Nairobi, Kenya.
Nyangito, H.Z. 1986. A Socio Economic Analysis of the Factors that Determine and Affect Potato
Post-Harvest Harvest Technologies in Kinagop, Kenya: A Case Study. MSc Thesis, Dept. Ag.
Economics, University of Nairobi.
Nyankanga, R.O., Wien, H.C., Olanya, O.M. and Ojiambo, P.S. 2004. Farmers' cultural practices
and management of potato late blight in Kenya highlands: implications for development of
integrated disease management, International Journal of Pest Management, 50: 135-144.
Olanya, O.M. El Bedewy, R., Ojiambo, P.S., Ewell, P. and Hakiza, J.J. 2001. Relationships of
fungicide application to late blight development and potato growth parameters in the tropical
highlands of Uganda and Kenya. Pp 77-86. In: Scientist and Farmer: Partners in Research for the
21st Century. International Potato Centre Program Report, 1999-2000. International Potato Centre
(CIP), Lima, Peru.

C I P W O R K I N G P A P E R S O C I A L S C I E N C E S 2 0 0 8 - 5
A D O P T I O N O F P O T A T O V A R I E T I E S I N K E N Y A A N D U G A N D A
65
Rueda, J. L., Ewel,l P. T., Walke,r T. S., Soto, M., Bicamumpaka, M. and Berrios, D. 1996.
Economic Impact of High-yielding, Late-Blight-Resistant Varieties in the Eastern and Central
African Highlands. In Case Studies of the Economic Impact of CIP-Related Technologies, by
Walker T.S. and Crissman, CC. Lima, Peru: International Potato Center, 1996. 157 p.
Sikka, L. C. 1994. End of Project Report. Technical Assistance to the Uganda National Potato
Research and Development Programme, 1989-1994. International Potato Center (CIP). Nairobi,
Kenya.
Stewart, H.E. and Bradshaw, J.E. 2001. Assessment of the field resistance of potato genotypes
with major gene resistance to late blight (Phytophthora infestans (Mont.) de Bary) using
inoculums comprised of two complementary races of the fungus, European Association for
Potato Research, 44:41-52.
UNPRDP. 1994. Annual Report 1993/1994. Uganda National Potato Research and Development
Program, Namulonge Agricultural and Animal Production Research Institute, Kalengyere
Research Station. Uganda.
USAID. 1994. Developments in Potato Research in Central Africa. Project Evaluation: Programme
Régional de l'Amélioration de la Pomme de terre en Afrique Centrale (PRAPAC). Technical Paper
No. 5. December 1994. USAID/REDSO/ESA, Nairobi, Kenya.
Wakahiu, M.W., Gildemacher, P.R., Kinyua, Z.M., Kabira, J.N., Kimenju, A.W. and Mutitu,
E.W. 2006. Status of bacterial wilt caused by Ralstonia solanacearum in Kenya; farmers’
knowledge and control practices. In: The fourth international bacterial wilt symposium, 17-20 July
2006, York. Book of abstracts, pp. 36.
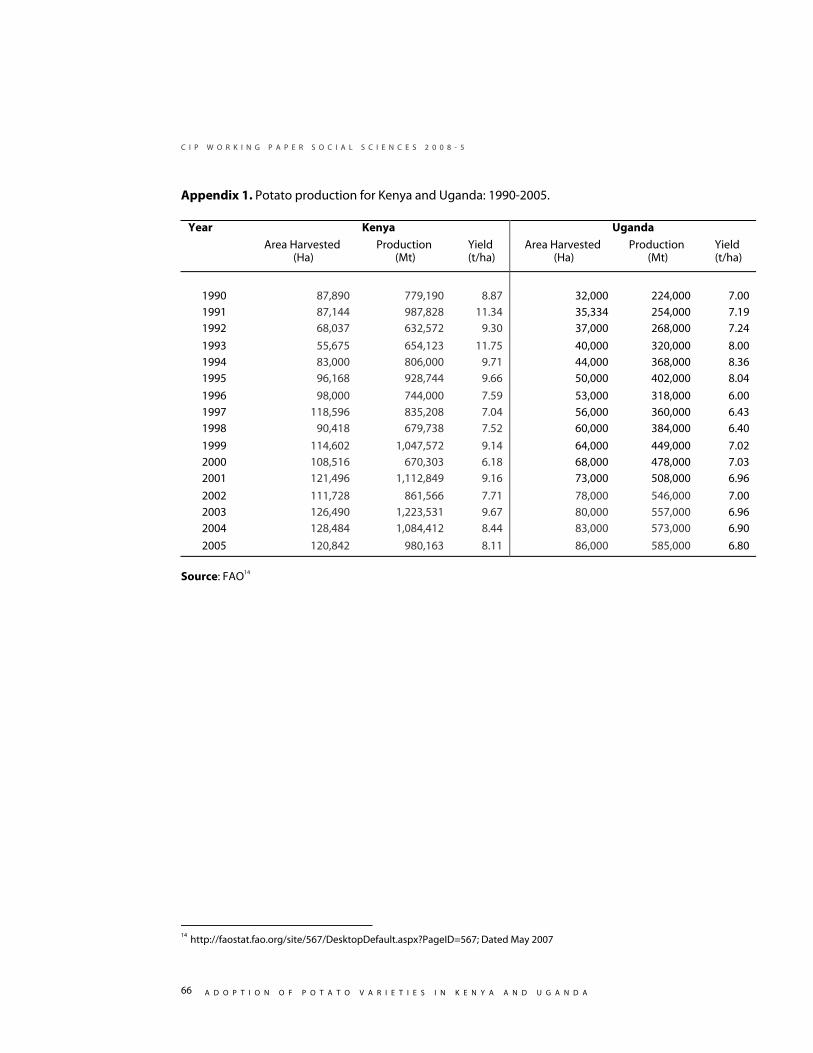
C I P W O R K I N G P A P E R S O C I A L S C I E N C E S 2 0 0 8 - 5
A D O P T I O N O F P O T A T O V A R I E T I E S I N K E N Y A A N D U G A N D A
66
Appendix 1. Potato production for Kenya and Uganda: 1990-2005.
Year Kenya Uganda
Area Harvested (Ha)
Production (Mt)
Yield (t/ha)
Area Harvested (Ha)
Production (Mt)
Yield (t/ha)
1990 87,890 779,190 8.87 32,000 224,000 7.00
1991 87,144 987,828 11.34 35,334 254,000 7.19
1992 68,037 632,572 9.30 37,000 268,000 7.24
1993 55,675 654,123 11.75 40,000 320,000 8.00
1994 83,000 806,000 9.71 44,000 368,000 8.36
1995 96,168 928,744 9.66 50,000 402,000 8.04
1996 98,000 744,000 7.59 53,000 318,000 6.00
1997 118,596 835,208 7.04 56,000 360,000 6.43
1998 90,418 679,738 7.52 60,000 384,000 6.40
1999 114,602 1,047,572 9.14 64,000 449,000 7.02
2000 108,516 670,303 6.18 68,000 478,000 7.03
2001 121,496 1,112,849 9.16 73,000 508,000 6.96
2002 111,728 861,566 7.71 78,000 546,000 7.00
2003 126,490 1,223,531 9.67 80,000 557,000 6.96
2004 128,484 1,084,412 8.44 83,000 573,000 6.90
2005 120,842 980,163 8.11 86,000 585,000 6.80
Source: FAO14
14 http://faostat.fao.org/site/567/DesktopDefault.aspx?PageID=567; Dated May 2007
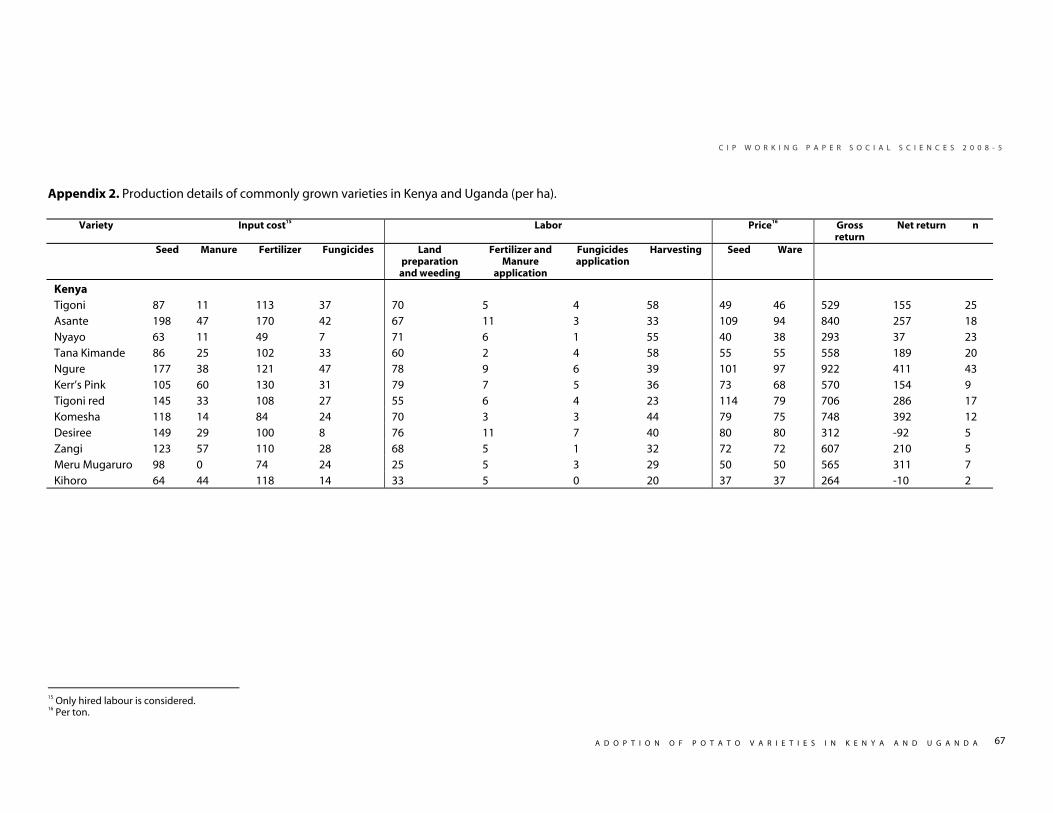
C I P W O R K I N G P A P E R S O C I A L S C I E N C E S 2 0 0 8 - 5
A D O P T I O N O F P O T A T O V A R I E T I E S I N K E N Y A A N D U G A N D A
67
Appendix 2. Production details of commonly grown varieties in Kenya and Uganda (per ha).
Variety Input cost15 Labor Price16 Gross return
Net return n
Seed Manure Fertilizer Fungicides Land preparation
and weeding
Fertilizer and Manure
application
Fungicides application
Harvesting Seed Ware
Kenya Tigoni 87 11 113 37 70 5 4 58 49 46 529 155 25 Asante 198 47 170 42 67 11 3 33 109 94 840 257 18 Nyayo 63 11 49 7 71 6 1 55 40 38 293 37 23 Tana Kimande 86 25 102 33 60 2 4 58 55 55 558 189 20 Ngure 177 38 121 47 78 9 6 39 101 97 922 411 43 Kerr’s Pink 105 60 130 31 79 7 5 36 73 68 570 154 9 Tigoni red 145 33 108 27 55 6 4 23 114 79 706 286 17 Komesha 118 14 84 24 70 3 3 44 79 75 748 392 12 Desiree 149 29 100 8 76 11 7 40 80 80 312 -92 5 Zangi 123 57 110 28 68 5 1 32 72 72 607 210 5 Meru Mugaruro 98 0 74 24 25 5 3 29 50 50 565 311 7 Kihoro 64 44 118 14 33 5 0 20 37 37 264 -10 2
15 Only hired labour is considered. 16 Per ton.
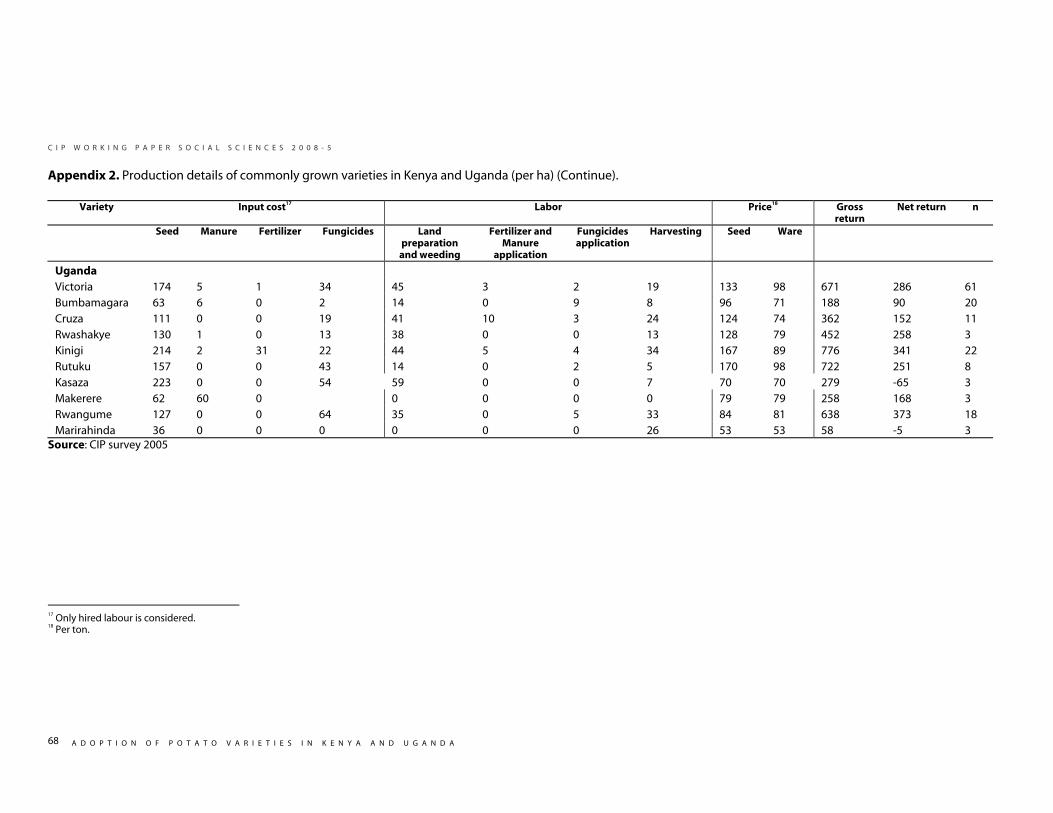
C I P W O R K I N G P A P E R S O C I A L S C I E N C E S 2 0 0 8 - 5
A D O P T I O N O F P O T A T O V A R I E T I E S I N K E N Y A A N D U G A N D A
68
Appendix 2. Production details of commonly grown varieties in Kenya and Uganda (per ha) (Continue).
Variety Input cost17 Labor Price18 Gross return
Net return n
Seed Manure Fertilizer Fungicides Land preparation
and weeding
Fertilizer and Manure
application
Fungicides application
Harvesting Seed Ware
Uganda Victoria 174 5 1 34 45 3 2 19 133 98 671 286 61 Bumbamagara 63 6 0 2 14 0 9 8 96 71 188 90 20 Cruza 111 0 0 19 41 10 3 24 124 74 362 152 11 Rwashakye 130 1 0 13 38 0 0 13 128 79 452 258 3 Kinigi 214 2 31 22 44 5 4 34 167 89 776 341 22 Rutuku 157 0 0 43 14 0 2 5 170 98 722 251 8 Kasaza 223 0 0 54 59 0 0 7 70 70 279 -65 3 Makerere 62 60 0 0 0 0 0 79 79 258 168 3 Rwangume 127 0 0 64 35 0 5 33 84 81 638 373 18 Marirahinda 36 0 0 0 0 0 0 26 53 53 58 -5 3
Source: CIP survey 2005
17 Only hired labour is considered. 18 Per ton.
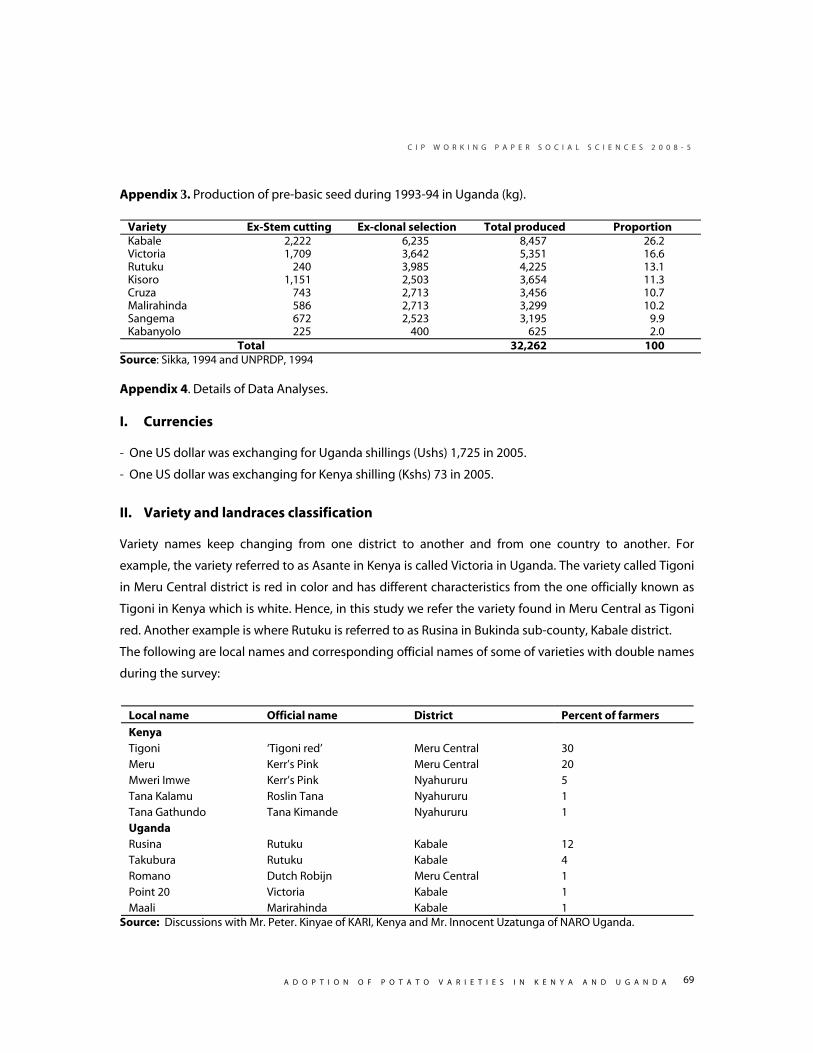
C I P W O R K I N G P A P E R S O C I A L S C I E N C E S 2 0 0 8 - 5
A D O P T I O N O F P O T A T O V A R I E T I E S I N K E N Y A A N D U G A N D A
69
Appendix 3. Production of pre-basic seed during 1993-94 in Uganda (kg).
Variety Ex-Stem cutting Ex-clonal selection Total produced Proportion Kabale 2,222 6,235 8,457 26.2 Victoria 1,709 3,642 5,351 16.6 Rutuku 240 3,985 4,225 13.1 Kisoro 1,151 2,503 3,654 11.3 Cruza 743 2,713 3,456 10.7 Malirahinda 586 2,713 3,299 10.2 Sangema 672 2,523 3,195 9.9 Kabanyolo 225 400 625 2.0 Total 32,262 100
Source: Sikka, 1994 and UNPRDP, 1994 Appendix 4. Details of Data Analyses. I. Currencies - One US dollar was exchanging for Uganda shillings (Ushs) 1,725 in 2005.
- One US dollar was exchanging for Kenya shilling (Kshs) 73 in 2005.
II. Variety and landraces classification Variety names keep changing from one district to another and from one country to another. For
example, the variety referred to as Asante in Kenya is called Victoria in Uganda. The variety called Tigoni
in Meru Central district is red in color and has different characteristics from the one officially known as
Tigoni in Kenya which is white. Hence, in this study we refer the variety found in Meru Central as Tigoni
red. Another example is where Rutuku is referred to as Rusina in Bukinda sub-county, Kabale district.
The following are local names and corresponding official names of some of varieties with double names
during the survey:
Local name Official name District Percent of farmers
Kenya Tigoni ‘Tigoni red’ Meru Central 30 Meru Kerr’s Pink Meru Central 20 Mweri Imwe Kerr’s Pink Nyahururu 5 Tana Kalamu Roslin Tana Nyahururu 1 Tana Gathundo Tana Kimande Nyahururu 1 Uganda Rusina Rutuku Kabale 12 Takubura Rutuku Kabale 4 Romano Dutch Robijn Meru Central 1 Point 20 Victoria Kabale 1 Maali Marirahinda Kabale 1
Source: Discussions with Mr. Peter. Kinyae of KARI, Kenya and Mr. Innocent Uzatunga of NARO Uganda.

C I P W O R K I N G P A P E R S O C I A L S C I E N C E S 2 0 0 8 - 5
A D O P T I O N O F P O T A T O V A R I E T I E S I N K E N Y A A N D U G A N D A
70
III. Labor costs One way of valuing family labor is to use opportunity cost of labor. However, in some cases there are no
alternative jobs for farmers and their children in rural areas and quantifying the labor provided by family
member is rarely accurate because they attend to various household and farm chores at the same time.
There for this study treated family labor as fixed and assumed it will be accounted together with returns
to management in net returns.
IV. Seed costs Farmers had a tendency of exaggerating seed prices although most of them were not ready to pay the
market value of clean seed. Ware prices were used when calculating net returns for farmers reporting
self supply and neighbours as sources of seeds. Prices were taken as given for farmers reporting sources
of seed to be commercial seed grower, farmers association and national research stations.
V. Weights of Farm Yard Manure (FYM) Estimation of amount of FYM used was difficult because of varying degree of dryness and also different
containers used for carrying manure to the fields. Weight of manure was adjusted using estimates from
Smallholder Dairy Project division in International Livestock Research Institute (ILRI).
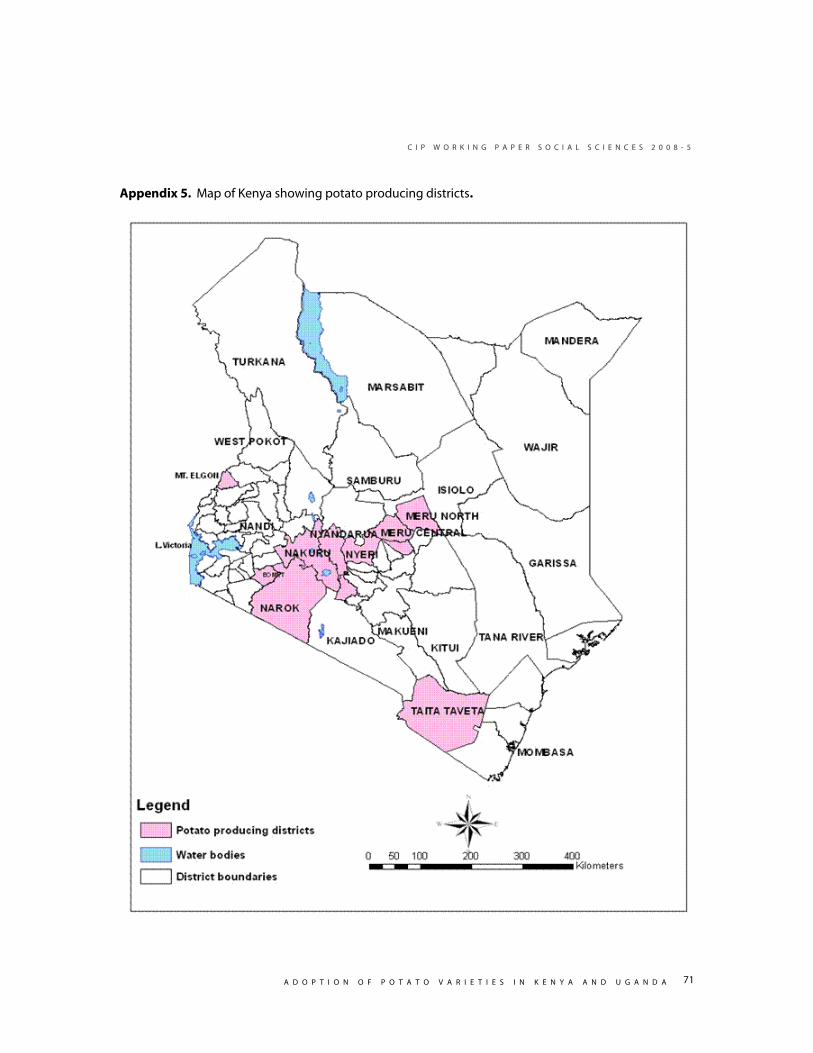
C I P W O R K I N G P A P E R S O C I A L S C I E N C E S 2 0 0 8 - 5
A D O P T I O N O F P O T A T O V A R I E T I E S I N K E N Y A A N D U G A N D A
71
Appendix 5. Map of Kenya showing potato producing districts.
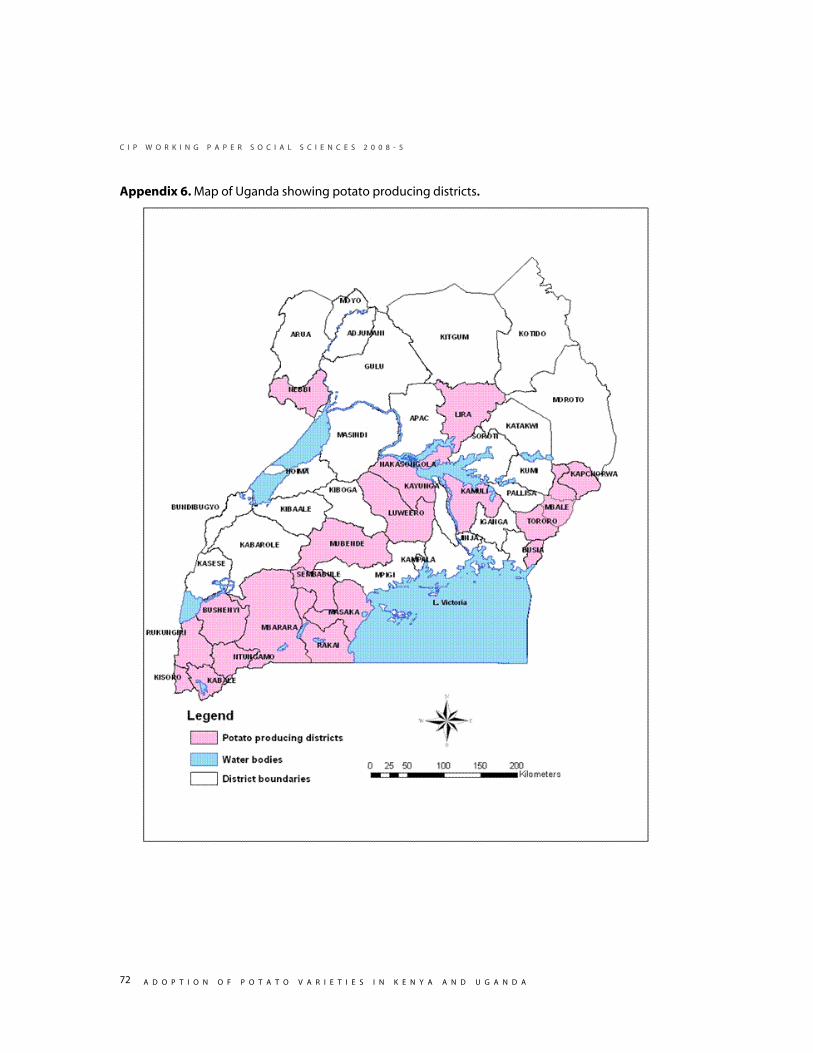
C I P W O R K I N G P A P E R S O C I A L S C I E N C E S 2 0 0 8 - 5
A D O P T I O N O F P O T A T O V A R I E T I E S I N K E N Y A A N D U G A N D A
72
Appendix 6. Map of Uganda showing potato producing districts.
C I P W O R K I N G P A P E R S O C I A L S C I E N C E S 2 0 0 8 - 5
A D O P T I O N O F P O T A T O V A R I E T I E S I N K E N Y A A N D U G A N D A
73
Appendix 7. Survey questionnaire – Uganda
A: Household Characteristics
B: Farm Assets
C: Crop production
D: Potato production
E: Potato marketing and utilization
F: Credit and information
G: Household Income
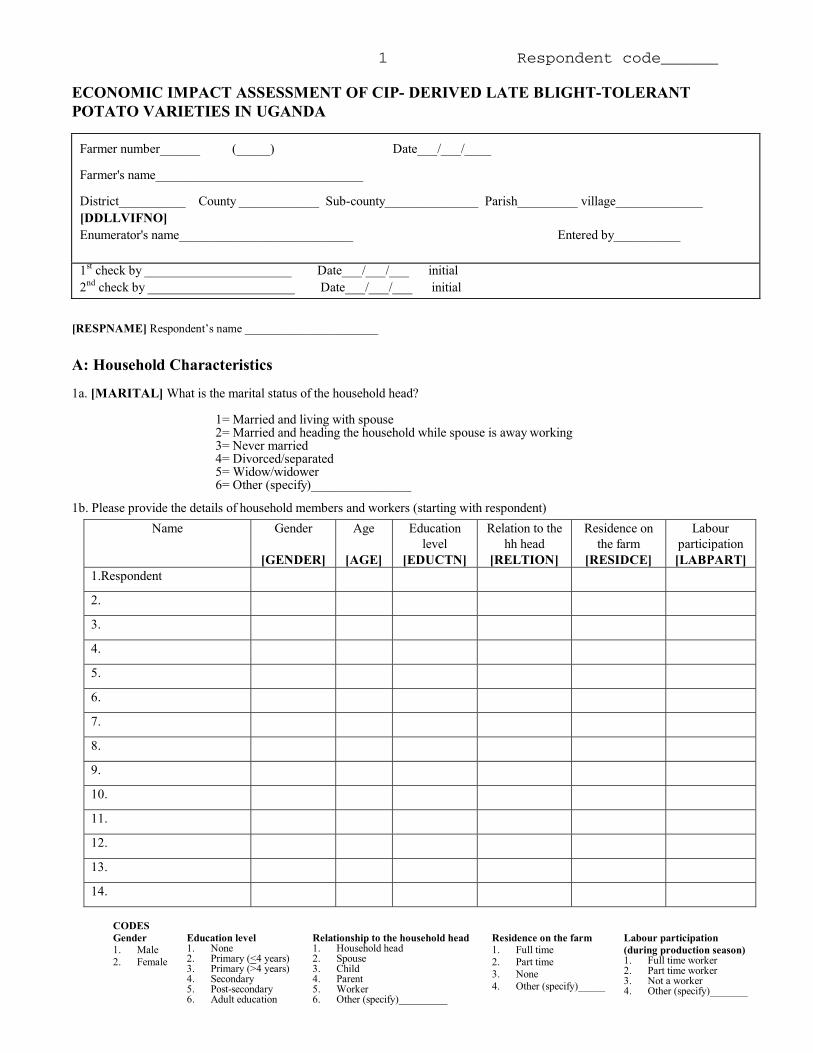
Respondent code______
1
ECONOMIC IMPACT ASSESSMENT OF CIP- DERIVED LATE BLIGHT-TOLERANT POTATO VARIETIES IN UGANDA
Farmer number______ (_____) Date___/___/____ Farmer's name_______________________________ District__________ County ____________ Sub-county______________ Parish_________ village_____________ [DDLLVIFNO] Enumerator's name__________________________ Entered by__________ 1st check by ______________________ Date___/___/___ initial 2nd check by ______________________ Date___/___/___ initial
[RESPNAME] Respondent’s name ______________________
A: Household Characteristics 1a. [MARITAL] What is the marital status of the household head?
1= Married and living with spouse 2= Married and heading the household while spouse is away working
3= Never married 4= Divorced/separated 5= Widow/widower 6= Other (specify)_______________
1b. Please provide the details of household members and workers (starting with respondent) Name
Gender
[GENDER]
Age
[AGE]
Education level
[EDUCTN]
Relation to the hh head
[RELTION]
Residence on the farm
[RESIDCE]
Labour participation [LABPART]
1.Respondent
2.
3.
4.
5.
6.
7.
8.
9.
10.
11.
12.
13.
14.
CODES
Gender 1. Male 2. Female
Education level 1. None 2. Primary (<4 years) 3. Primary (>4 years) 4. Secondary 5. Post-secondary 6. Adult education
Relationship to the household head 1. Household head 2. Spouse 3. Child 4. Parent 5. Worker 6. Other (specify)_________
Residence on the farm 1. Full time 2. Part time 3. None 4. Other (specify)_____
Labour participation (during production season) 1. Full time worker 2. Part time worker 3. Not a worker 4. Other (specify)_______
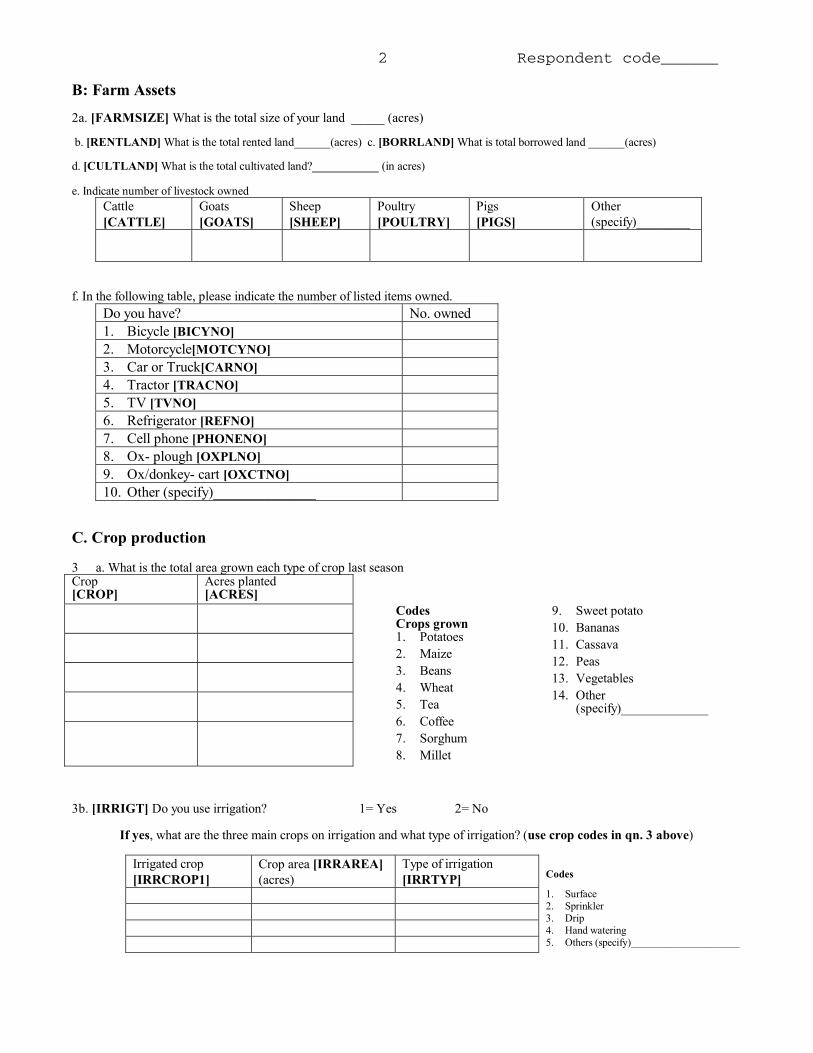
Respondent code______
2
B: Farm Assets 2a. [FARMSIZE] What is the total size of your land _____ (acres) b. [RENTLAND] What is the total rented land______(acres) c. [BORRLAND] What is total borrowed land ______(acres) d. [CULTLAND] What is the total cultivated land?___________ (in acres) e. Indicate number of livestock owned
Cattle [CATTLE]
Goats [GOATS]
Sheep [SHEEP]
Poultry [POULTRY]
Pigs [PIGS]
Other (specify)________
f. In the following table, please indicate the number of listed items owned.
Do you have? No. owned 1. Bicycle [BICYNO] 2. Motorcycle[MOTCYNO] 3. Car or Truck[CARNO] 4. Tractor [TRACNO] 5. TV [TVNO] 6. Refrigerator [REFNO] 7. Cell phone [PHONENO] 8. Ox- plough [OXPLNO] 9. Ox/donkey- cart [OXCTNO] 10. Other (specify)______________
C. Crop production 3 a. What is the total area grown each type of crop last season Crop [CROP]
Acres planted [ACRES]
Codes Crops grown 1. Potatoes 2. Maize 3. Beans 4. Wheat 5. Tea 6. Coffee 7. Sorghum 8. Millet
9. Sweet potato 10. Bananas 11. Cassava 12. Peas 13. Vegetables 14. Other
(specify)_____________
3b. [IRRIGT] Do you use irrigation? 1= Yes 2= No
If yes, what are the three main crops on irrigation and what type of irrigation? (use crop codes in qn. 3 above)
Irrigated crop [IRRCROP1]
Crop area [IRRAREA] (acres)
Type of irrigation [IRRTYP]
Codes
1. Surface 2. Sprinkler 3. Drip 4. Hand watering 5. Others (specify)____________________
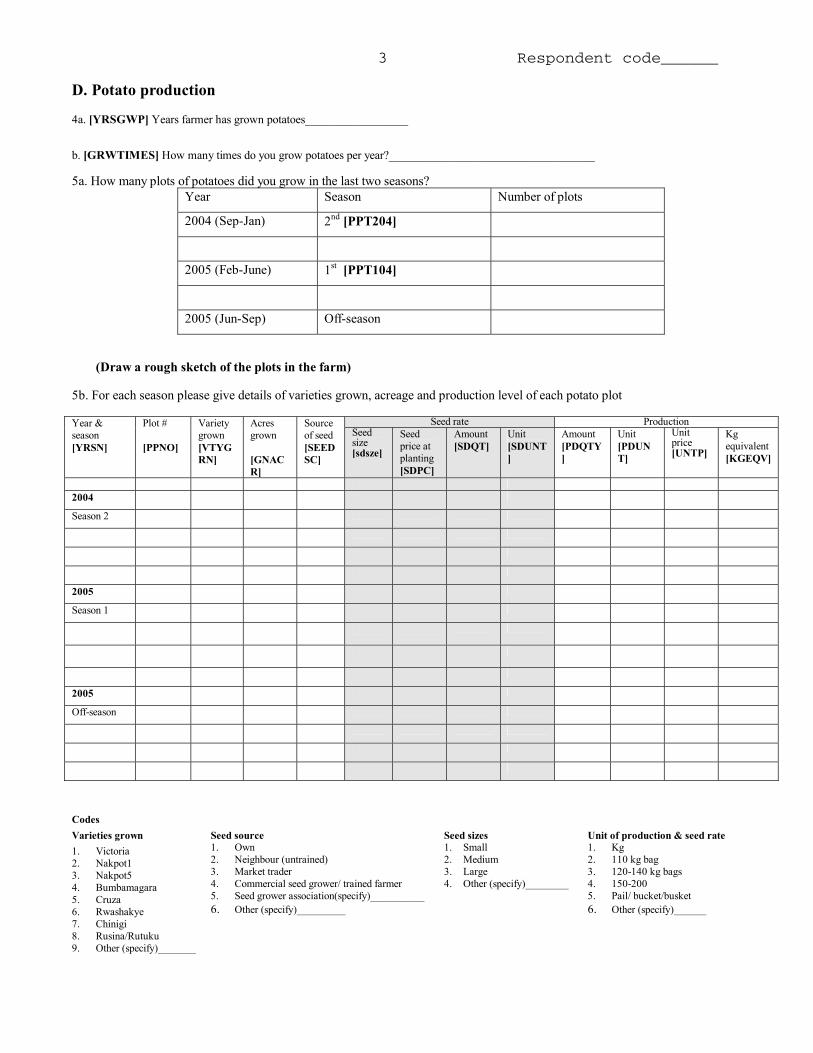
Respondent code______
3
D. Potato production 4a. [YRSGWP] Years farmer has grown potatoes_________________ b. [GRWTIMES] How many times do you grow potatoes per year?__________________________________ 5a. How many plots of potatoes did you grow in the last two seasons?
Year Season Number of plots
2004 (Sep-Jan) 2nd [PPT204]
2005 (Feb-June) 1st [PPT104]
2005 (Jun-Sep) Off-season
(Draw a rough sketch of the plots in the farm)
5b. For each season please give details of varieties grown, acreage and production level of each potato plot
Seed rate Production Year & season [YRSN]
Plot # [PPNO]
Variety grown [VTYGRN]
Acres grown [GNACR]
Source of seed [SEEDSC]
Seed size [sdsze]
Seed price at planting [SDPC]
Amount [SDQT]
Unit [SDUNT]
Amount [PDQTY]
Unit [PDUNT]
Unit price [UNTP]
Kg equivalent [KGEQV]
2004
Season 2
2005
Season 1
2005
Off-season
Codes Varieties grown 1. Victoria 2. Nakpot1 3. Nakpot5 4. Bumbamagara 5. Cruza 6. Rwashakye 7. Chinigi 8. Rusina/Rutuku 9. Other (specify)_______
Seed source 1. Own 2. Neighbour (untrained) 3. Market trader 4. Commercial seed grower/ trained farmer 5. Seed grower association(specify)__________ 6. Other (specify)_________
Seed sizes 1. Small 2. Medium 3. Large 4. Other (specify)________
Unit of production & seed rate 1. Kg 2. 110 kg bag 3. 120-140 kg bags 4. 150-200 5. Pail/ bucket/busket 6. Other (specify)______
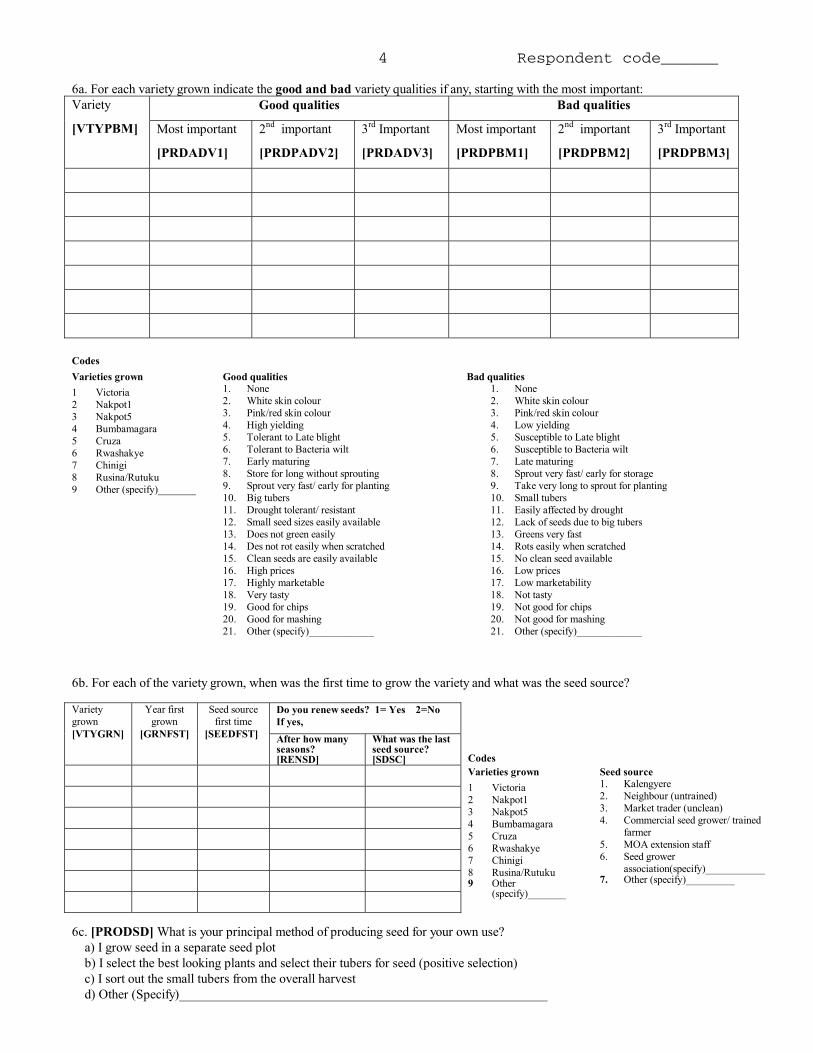
Respondent code______
4
6a. For each variety grown indicate the good and bad variety qualities if any, starting with the most important: Good qualities Bad qualities Variety
[VTYPBM] Most important
[PRDADV1]
2nd important
[PRDPADV2]
3rd Important
[PRDADV3]
Most important
[PRDPBM1]
2nd important
[PRDPBM2]
3rd Important
[PRDPBM3]
Codes Varieties grown 1 Victoria 2 Nakpot1 3 Nakpot5 4 Bumbamagara 5 Cruza 6 Rwashakye 7 Chinigi 8 Rusina/Rutuku 9 Other (specify)_______
Good qualities 1. None 2. White skin colour 3. Pink/red skin colour 4. High yielding 5. Tolerant to Late blight 6. Tolerant to Bacteria wilt 7. Early maturing 8. Store for long without sprouting 9. Sprout very fast/ early for planting 10. Big tubers 11. Drought tolerant/ resistant 12. Small seed sizes easily available 13. Does not green easily 14. Des not rot easily when scratched 15. Clean seeds are easily available 16. High prices 17. Highly marketable 18. Very tasty 19. Good for chips 20. Good for mashing 21. Other (specify)____________
Bad qualities 1. None 2. White skin colour 3. Pink/red skin colour 4. Low yielding 5. Susceptible to Late blight 6. Susceptible to Bacteria wilt 7. Late maturing 8. Sprout very fast/ early for storage 9. Take very long to sprout for planting 10. Small tubers 11. Easily affected by drought 12. Lack of seeds due to big tubers 13. Greens very fast 14. Rots easily when scratched 15. No clean seed available 16. Low prices 17. Low marketability 18. Not tasty 19. Not good for chips 20. Not good for mashing 21. Other (specify)____________
6b. For each of the variety grown, when was the first time to grow the variety and what was the seed source?
Do you renew seeds? 1= Yes 2=No If yes,
Variety grown [VTYGRN]
Year first grown
[GRNFST]
Seed source first time
[SEEDFST] After how many seasons? [RENSD]
What was the last seed source? [SDSC]
Codes
Varieties grown 1 Victoria 2 Nakpot1 3 Nakpot5 4 Bumbamagara 5 Cruza 6 Rwashakye 7 Chinigi 8 Rusina/Rutuku 9 Other
(specify)_______
Seed source 1. Kalengyere 2. Neighbour (untrained) 3. Market trader (unclean) 4. Commercial seed grower/ trained
farmer 5. MOA extension staff 6. Seed grower
association(specify)___________ 7. Other (specify)_________
6c. [PRODSD] What is your principal method of producing seed for your own use? a) I grow seed in a separate seed plot b) I select the best looking plants and select their tubers for seed (positive selection) c) I sort out the small tubers from the overall harvest d) Other (Specify)_______________________________________________________

Respondent code______
5
7a. [OLDVTY1] Before you adopted the variety(s) listed above, what old varieties did you grow and what were the main
reasons for abandoning them?
Variety abandoned [ABANDVRT1] Reasons for abandoning [ABANDRSN!]
i. ___________________________ ________________________________________________________
ii____________________________ ________________________________________________________
ii____________________________ ________________________________________________________
7b. [SEEDPRB1] Do you have problems getting high quality seeds? 1=Yes 2= No If yes, what are the problems?
i. ______________________________________________________________________________
ii. ________________________________________________________________________________
iii. _________________________________________________________________________________
7c. [PFTRAIT1] What should be the priorities for potato breeding for future varieties (what traits)?
iv. ______________________________________________________________________________
v. ________________________________________________________________________________
vi. _________________________________________________________________________________
vii. _________________________________________________________________________________
viii. _________________________________________________________________________________
8a. [APPLYMAN] Did you apply manure to potatoes last season? 1=Yes 2= No 8b. [APPFERT] Did you apply chemical fertilizer during last growing season? 1= Yes, 2=No 8c. Please, give details of manure and fertilizers used in potato production last growing season (refer page 3 above for plot no).
Type 1[FTTYP1]_____________
Type 2[FTTYP2]___________
Type 3[FTTYP13]___________
Plot # [PLOTNO]
Total manure applied (kg) [MANU] Time appl.
(in days) [FRT1TM]
Amount (Kg) [FRT1AMT]
Total cost (Shs) [FRT1CST]
Time appl. (in days) [FRT2TM]
Amount (Kg) [FRT2AMT]
Total cost (Shs) [FRT2CST]
Time appl. (in days) [FRT3TM]
Amount (Kg) [FRT3AMT]
Total cost (Shs) [FRT3CST]
8d. [MANCST] Price of manure if used (Sh/ton) ___________
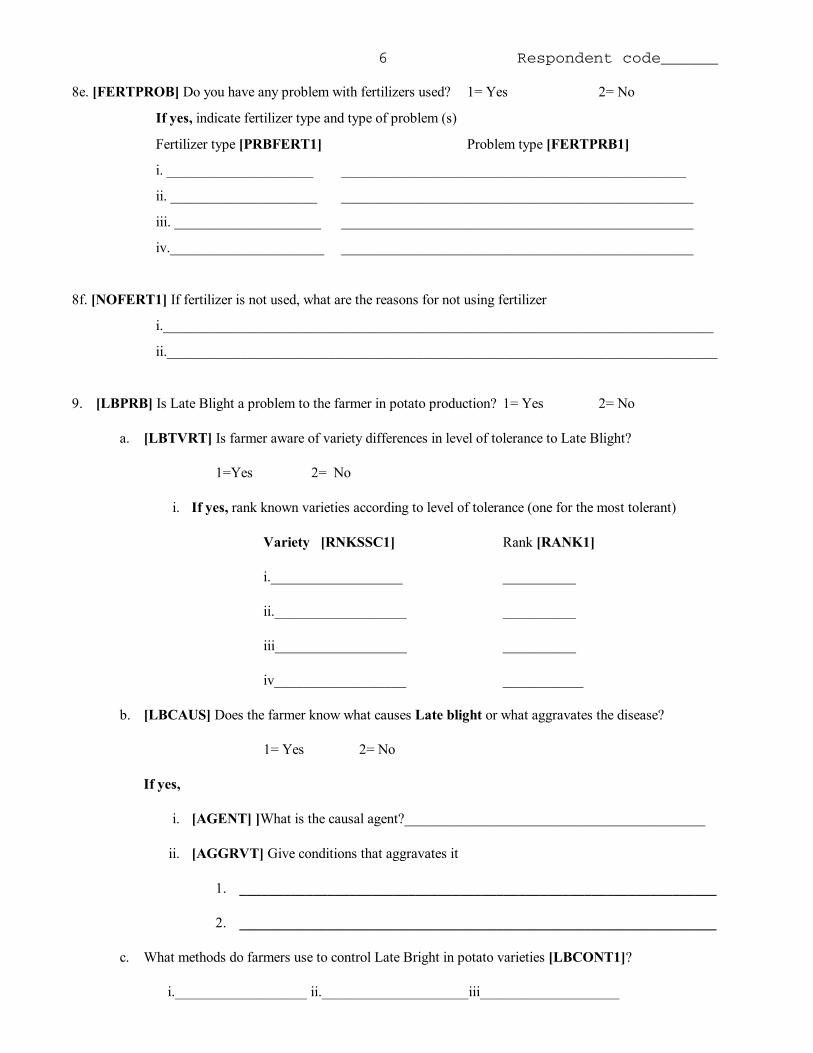
Respondent code______
6
8e. [FERTPROB] Do you have any problem with fertilizers used? 1= Yes 2= No
If yes, indicate fertilizer type and type of problem (s)
Fertilizer type [PRBFERT1] Problem type [FERTPRB1]
i. ____________________ _______________________________________________
ii. ____________________ ________________________________________________
iii. ____________________ ________________________________________________
iv._____________________ ________________________________________________
8f. [NOFERT1] If fertilizer is not used, what are the reasons for not using fertilizer
i.___________________________________________________________________________
ii.___________________________________________________________________________
9. [LBPRB] Is Late Blight a problem to the farmer in potato production? 1= Yes 2= No
a. [LBTVRT] Is farmer aware of variety differences in level of tolerance to Late Blight?
1=Yes 2= No
i. If yes, rank known varieties according to level of tolerance (one for the most tolerant)
Variety [RNKSSC1] Rank [RANK1]
i.__________________ __________
ii.__________________ __________
iii__________________ __________
iv__________________ ___________
b. [LBCAUS] Does the farmer know what causes Late blight or what aggravates the disease?
1= Yes 2= No
If yes,
i. [AGENT] ]What is the causal agent?_________________________________________
ii. [AGGRVT] Give conditions that aggravates it
1. _________________________________________________________________
2. _________________________________________________________________
c. What methods do farmers use to control Late Bright in potato varieties [LBCONT1]?
i.__________________ ii.____________________iii___________________
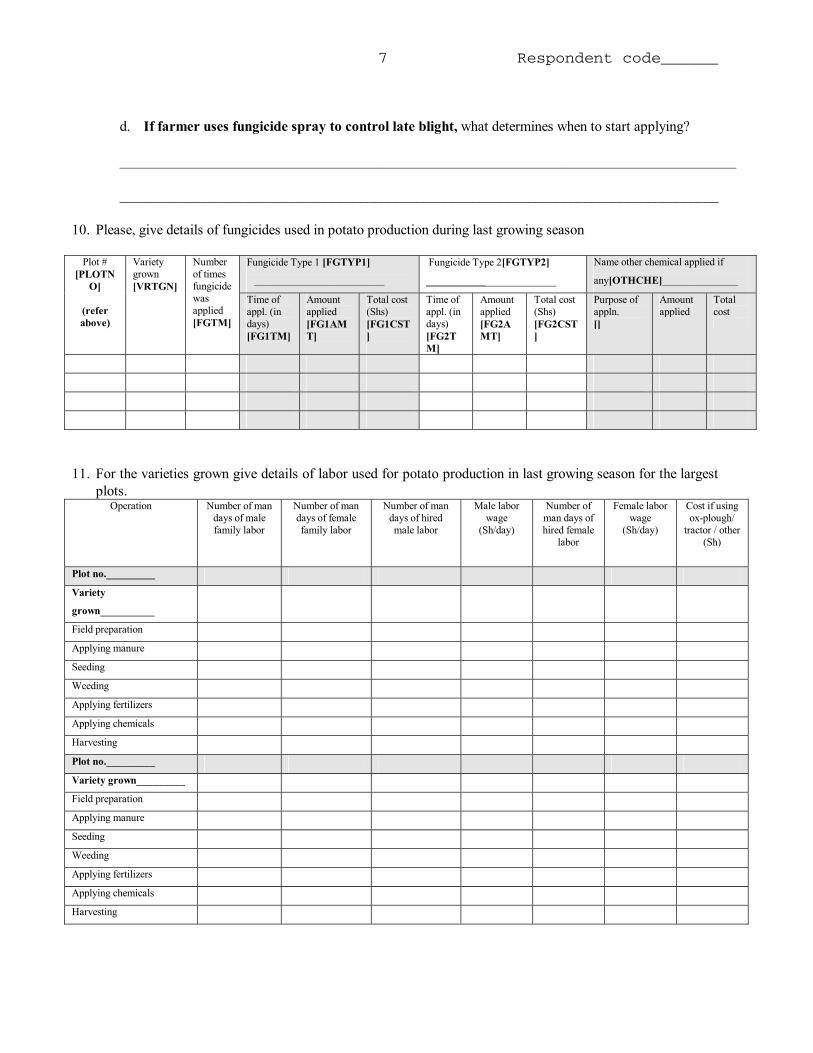
Respondent code______
7
d. If farmer uses fungicide spray to control late blight, what determines when to start applying?
____________________________________________________________________________________
____________________________________________________________________________________
10. Please, give details of fungicides used in potato production during last growing season
Fungicide Type 1 [FGTYP1]
________________________
Fungicide Type 2[FGTYP2]
________________________
Name other chemical applied if
any[OTHCHE]______________
Plot # [PLOTN
O]
(refer above)
Variety grown [VRTGN]
Number of times fungicide was applied [FGTM]
Time of appl. (in days) [FG1TM]
Amount applied [FG1AMT]
Total cost (Shs) [FG1CST]
Time of appl. (in days) [FG2TM]
Amount applied [FG2AMT]
Total cost (Shs) [FG2CST]
Purpose of appln. []
Amount applied
Total cost
11. For the varieties grown give details of labor used for potato production in last growing season for the largest plots.
Operation Number of man days of male family labor
Number of man days of female family labor
Number of man days of hired male labor
Male labor wage
(Sh/day)
Number of man days of hired female
labor
Female labor wage
(Sh/day)
Cost if using ox-plough/
tractor / other (Sh)
Plot no._________
Variety
grown__________
Field preparation
Applying manure
Seeding
Weeding
Applying fertilizers
Applying chemicals
Harvesting
Plot no._________
Variety grown_________
Field preparation
Applying manure
Seeding
Weeding
Applying fertilizers
Applying chemicals
Harvesting
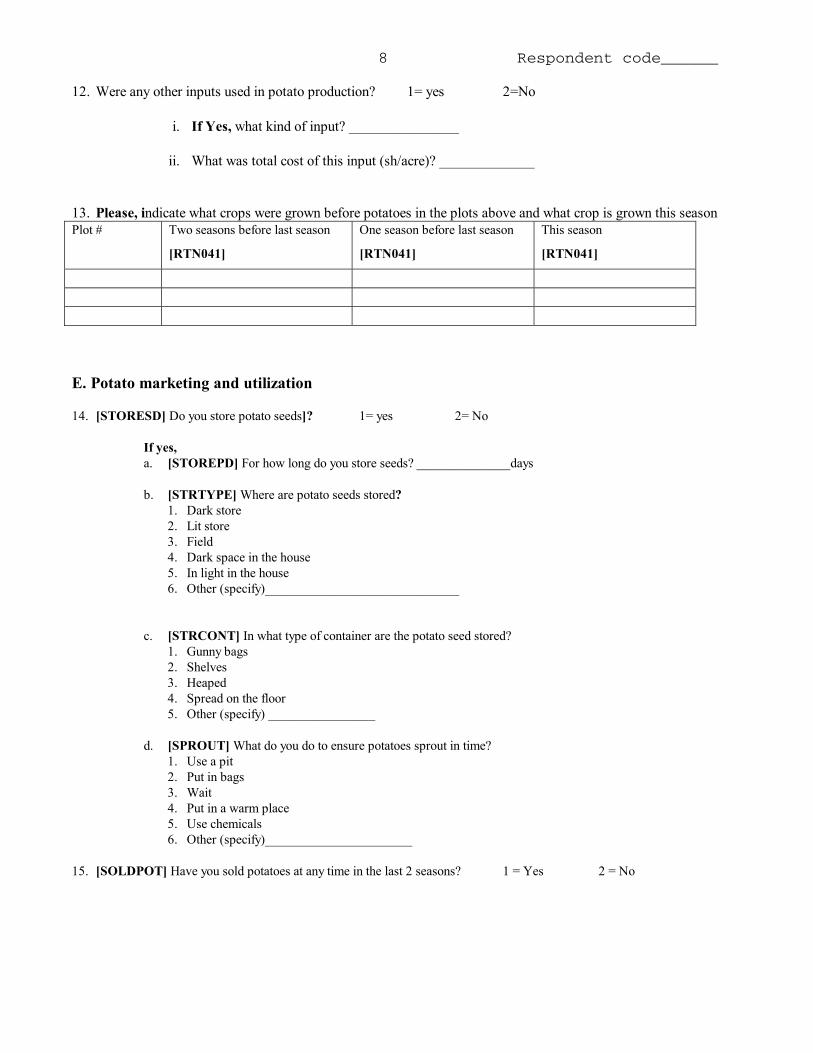
Respondent code______
8
12. Were any other inputs used in potato production? 1= yes 2=No
i. If Yes, what kind of input? _______________
ii. What was total cost of this input (sh/acre)? _____________
13. Please, indicate what crops were grown before potatoes in the plots above and what crop is grown this season Plot # Two seasons before last season
[RTN041]
One season before last season
[RTN041]
This season
[RTN041]
E. Potato marketing and utilization 14. [STORESD] Do you store potato seeds]? 1= yes 2= No
If yes, a. [STOREPD] For how long do you store seeds? ______________days b. [STRTYPE] Where are potato seeds stored?
1. Dark store 2. Lit store 3. Field 4. Dark space in the house 5. In light in the house 6. Other (specify)_____________________________
c. [STRCONT] In what type of container are the potato seed stored? 1. Gunny bags 2. Shelves 3. Heaped 4. Spread on the floor 5. Other (specify) ________________
d. [SPROUT] What do you do to ensure potatoes sprout in time?
1. Use a pit 2. Put in bags 3. Wait 4. Put in a warm place 5. Use chemicals 6. Other (specify)______________________
15. [SOLDPOT] Have you sold potatoes at any time in the last 2 seasons? 1 = Yes 2 = No
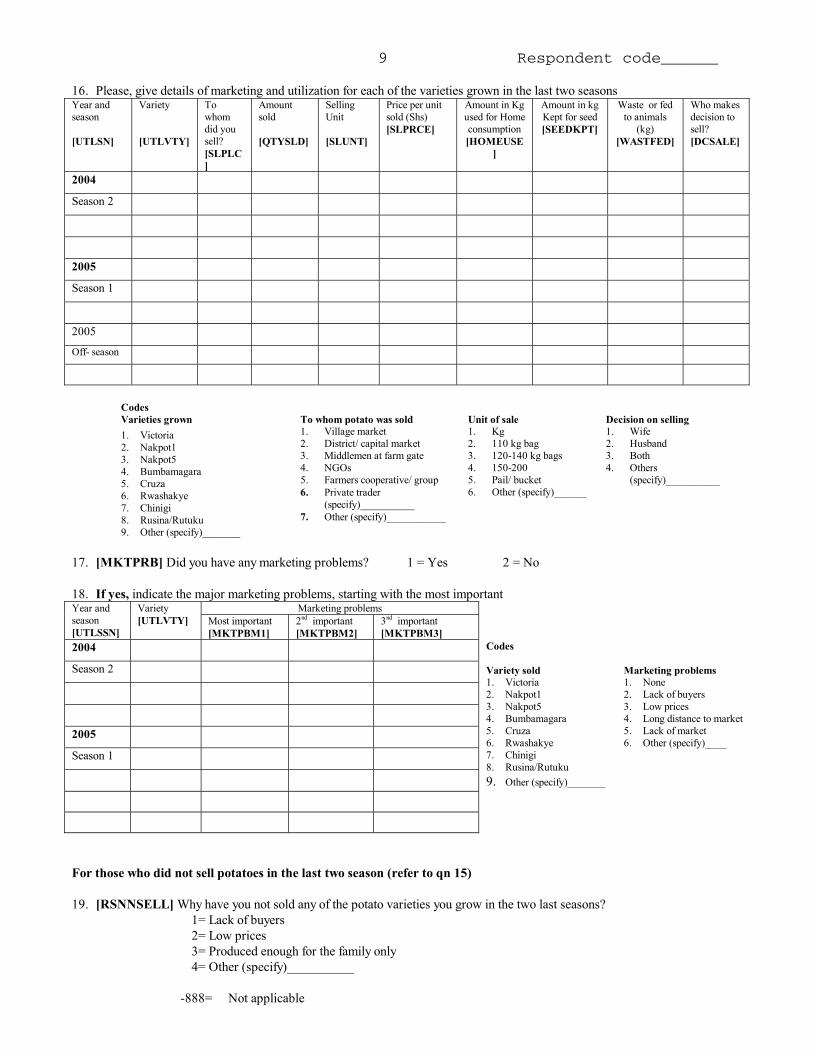
Respondent code______
9
16. Please, give details of marketing and utilization for each of the varieties grown in the last two seasons Year and season [UTLSN]
Variety [UTLVTY]
To whom did you sell? [SLPLC]
Amount sold [QTYSLD]
Selling Unit [SLUNT]
Price per unit sold (Shs) [SLPRCE]
Amount in Kg used for Home consumption [HOMEUSE
]
Amount in kg Kept for seed [SEEDKPT]
Waste or fed to animals
(kg) [WASTFED]
Who makes decision to sell? [DCSALE]
2004 Season 2 2005 Season 1 2005 Off- season
Codes Varieties grown 1. Victoria 2. Nakpot1 3. Nakpot5 4. Bumbamagara 5. Cruza 6. Rwashakye 7. Chinigi 8. Rusina/Rutuku 9. Other (specify)_______
To whom potato was sold 1. Village market 2. District/ capital market 3. Middlemen at farm gate 4. NGOs 5. Farmers cooperative/ group 6. Private trader
(specify)__________ 7. Other (specify)___________
Unit of sale 1. Kg 2. 110 kg bag 3. 120-140 kg bags 4. 150-200 5. Pail/ bucket 6. Other (specify)______
Decision on selling 1. Wife 2. Husband 3. Both 4. Others
(specify)__________
17. [MKTPRB] Did you have any marketing problems? 1 = Yes 2 = No 18. If yes, indicate the major marketing problems, starting with the most important
Marketing problems Year and season [UTLSSN]
Variety [UTLVTY] Most important
[MKTPBM1] 2nd important [MKTPBM2]
3nd important [MKTPBM3]
2004 Season 2 2005 Season 1
Codes Variety sold 1. Victoria 2. Nakpot1 3. Nakpot5 4. Bumbamagara 5. Cruza 6. Rwashakye 7. Chinigi 8. Rusina/Rutuku 9. Other (specify)_______
Marketing problems 1. None 2. Lack of buyers 3. Low prices 4. Long distance to market 5. Lack of market 6. Other (specify)____
For those who did not sell potatoes in the last two season (refer to qn 15) 19. [RSNNSELL] Why have you not sold any of the potato varieties you grow in the two last seasons?
1= Lack of buyers 2= Low prices 3= Produced enough for the family only 4= Other (specify)__________
-888= Not applicable
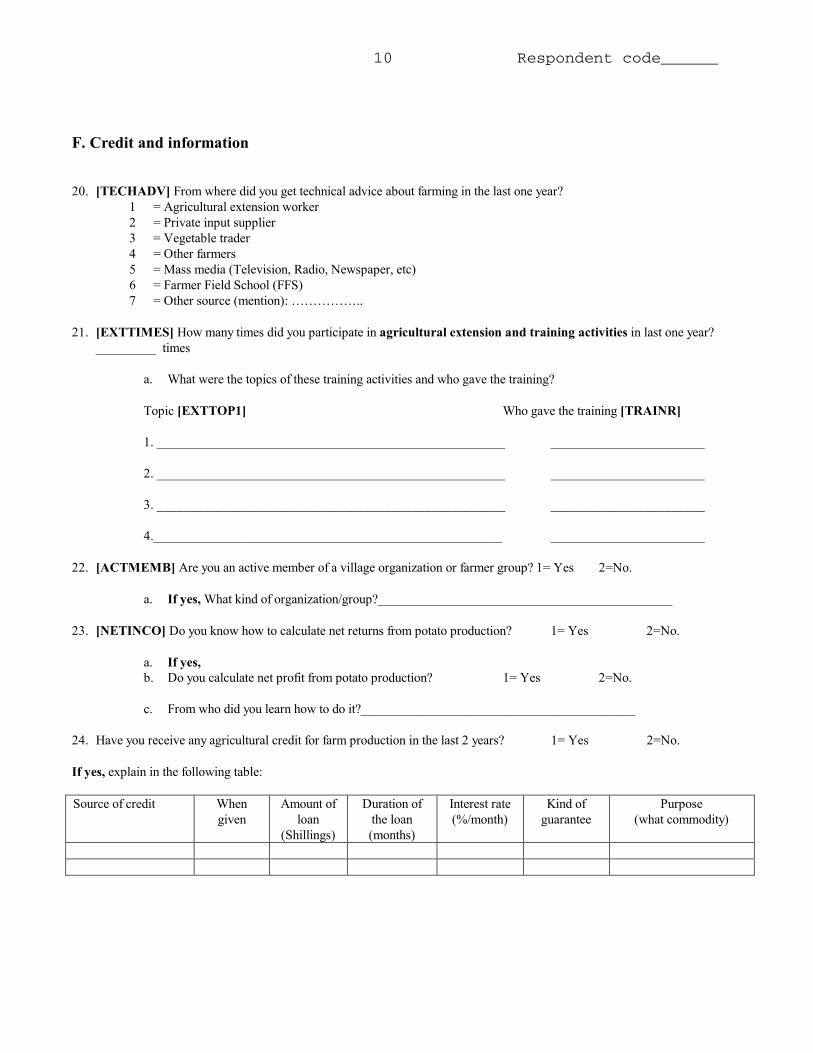
Respondent code______
10
F. Credit and information
20. [TECHADV] From where did you get technical advice about farming in the last one year? 1 = Agricultural extension worker 2 = Private input supplier 3 = Vegetable trader 4 = Other farmers 5 = Mass media (Television, Radio, Newspaper, etc) 6 = Farmer Field School (FFS) 7 = Other source (mention): ……………..
21. [EXTTIMES] How many times did you participate in agricultural extension and training activities in last one year?
_________ times a. What were the topics of these training activities and who gave the training?
Topic [EXTTOP1] Who gave the training [TRAINR] 1. ____________________________________________________ _______________________ 2. ____________________________________________________ _______________________ 3. ____________________________________________________ _______________________ 4.____________________________________________________ _______________________
22. [ACTMEMB] Are you an active member of a village organization or farmer group? 1= Yes 2=No.
a. If yes, What kind of organization/group?____________________________________________
23. [NETINCO] Do you know how to calculate net returns from potato production? 1= Yes 2=No. a. If yes, b. Do you calculate net profit from potato production? 1= Yes 2=No. c. From who did you learn how to do it?_________________________________________
24. Have you receive any agricultural credit for farm production in the last 2 years? 1= Yes 2=No. If yes, explain in the following table: Source of credit When
given Amount of
loan (Shillings)
Duration of the loan (months)
Interest rate (%/month)
Kind of guarantee
Purpose (what commodity)
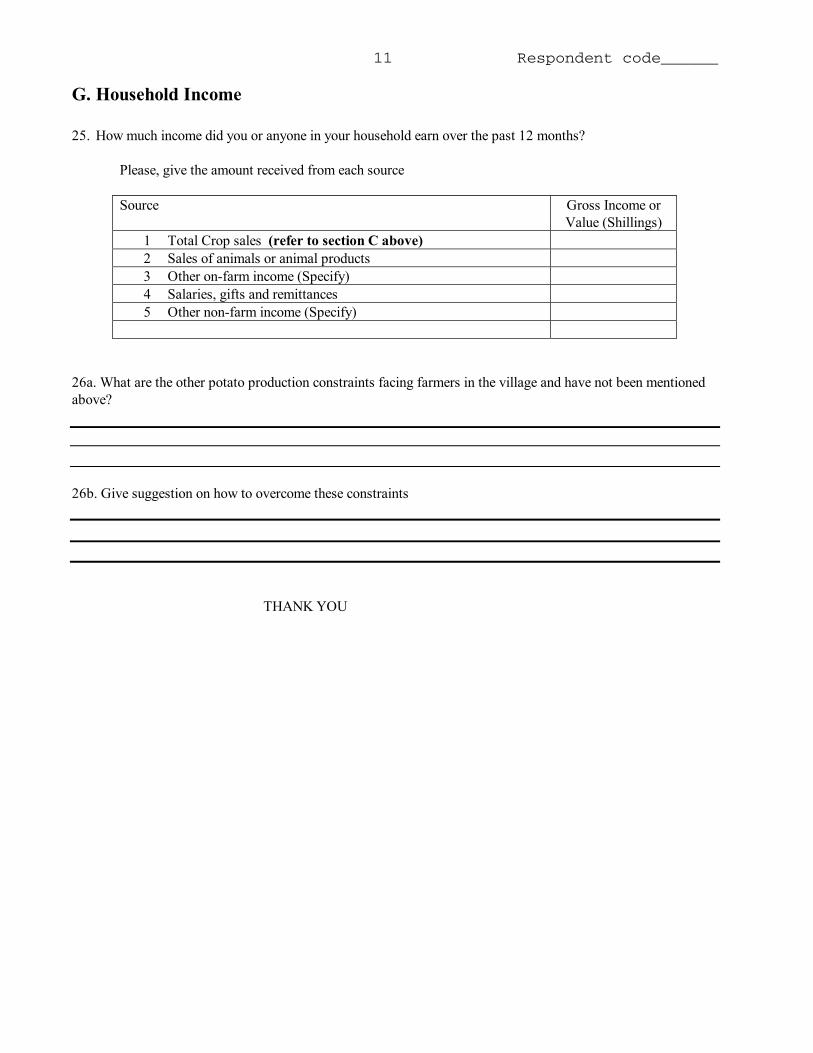
Respondent code______
11
G. Household Income 25. How much income did you or anyone in your household earn over the past 12 months?
Please, give the amount received from each source Source Gross Income or
Value (Shillings) 1 Total Crop sales (refer to section C above) 2 Sales of animals or animal products 3 Other on-farm income (Specify) 4 Salaries, gifts and remittances 5 Other non-farm income (Specify)
26a. What are the other potato production constraints facing farmers in the village and have not been mentioned above? 26b. Give suggestion on how to overcome these constraints THANK YOU

5
I n t e r n a t i o n a l P o t a t o C e n t e r • W o r k i n g P a p e r 1

International Potato CenterApartado 1558 Lima 12, Perú • Tel 51 1 349 6017 • Fax 51 1 349 5326 • email [email protected]
The International Potato Center (CIP) seeks to reduce poverty and achieve food security on asustained basis in developing countries through scientific research and related activities onpotato, sweetpotato, and other root and tuber crops, and on the improved management ofnatural resources in the Andes and other mountain areas.
THE CIP VISIONThe International Potato Center (CIP) will contribute to reducing poverty and hunger; improvinghuman health; developing resilient, sustainable rural and urban livelihood systems; and im-proving access to the benefits of new and appropriate knowledge and technologies. CIP, a WorldCenter, will address these challenges by convening and conducting research and supportingpartnerships on root and tuber crops and on natural resources management in mountain sys-tems and other less-favored areas where CIP can contribute to the achievement of healthy andsustainable human development.www.cipotato.org
CIP is a Future Harvest Alliance Center and receives its funding from a group of governments,private foundations, and international and regional organizations known as the ConsultativeGroup on International Agricultural Research (CGIAR).www.futureharvest.org • www.cgiar.org


![Bilstein Performance Suspension Parts Application Guide · off-road racing technology—brings the performance proven in Baja to the streets. 5160 SERIES [ TRUCK/SUV ] BILSTEIN 5160](https://static.fdocuments.us/doc/165x107/5e20734e33c58176247da3d2/bilstein-performance-suspension-parts-application-guide-off-road-racing-technologyabrings.jpg)