2017 September GrayReports - Demand Trends for Higher Education
48
GRAY REPORTS Demand for Higher Education Programs www.GrayAssociates.com Results through September 2017
-
Upload
gray-associates-inc -
Category
Education
-
view
56 -
download
0
Transcript of 2017 September GrayReports - Demand Trends for Higher Education

GRAYREPORTSDemand for Higher Education Programs
www.GrayAssociates.com
Results through September 2017

617.366.2838 www.GrayAssociates.com 2
GRAY For more information please contact Gray Associates.
Email: [email protected]
Who Is Gray?
Program and Market Evaluation Data
Employment
Placement RatesStudent Demand
Demographics
Wages
Programs Price ProjectsPlace§ Program Evaluation
System
§ Program profiles
§ Program development
§ City targeting
§ Location selection
§ Campus consolidation
§ Price elasticity
§ Price positioning
§ Price optimization
§ Business strategy
§ Strategy implementation
§ Acquisition analysis
§ Complex analytics
Advanced AnalyticsPredictive Models
Geo-Analytics
Clients: Higher Education Institutions and Stakeholders
Competition
Enhanced Crosswalks
617.366.2838 www.GrayAssociates.com 3
GRAY For more information please contact Gray Associates.
Email: [email protected]
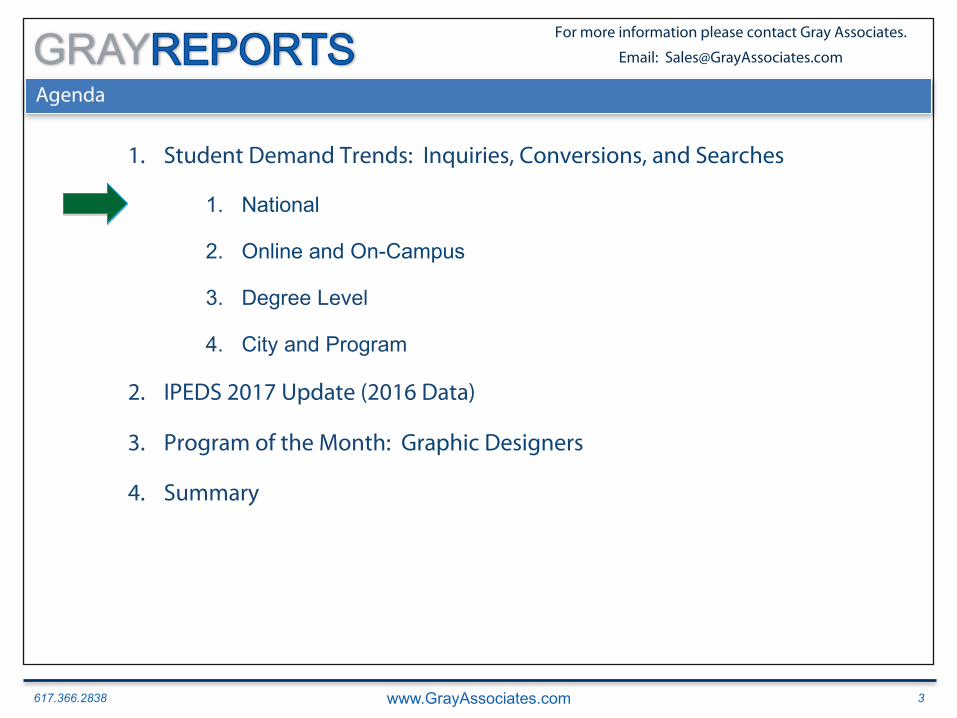
Agenda
1. Student Demand Trends: Inquiries, Conversions, and Searches
1. National
2. Online and On-Campus
3. Degree Level
4. City and Program
2. IPEDS 2017 Update (2016 Data)
3. Program of the Month: Graphic Designers
4. Summary

617.366.2838 www.GrayAssociates.com 4
GRAY For more information please contact Gray Associates.
Email: [email protected]
0
100,000
200,000
300,000
400,000
500,000
600,000
700,000
800,000
900,000
1,000,000
Jan Feb Mar Apr May Jun Jul Aug Sep Oct Nov Dec
National InquiriesAll Programs and Award Levels
2015 2016 2017
Overall Student Inquiries (All Sources)
Total inquiry volumes have been declining for several years.§ Declining unemployment rate
§ Falling interest in post-secondary education
§ Marketers shifting away from paid inquiries
617.366.2838 www.GrayAssociates.com 5
GRAY For more information please contact Gray Associates.
Email: [email protected]
0
100,000
200,000
300,000
400,000
500,000
600,000
700,000
800,000
900,000
1,000,000
Jan Feb Mar Apr May Jun Jul Aug Sep Oct Nov Dec
National InquiriesAll Programs and Award Levels
2015 2016 2017
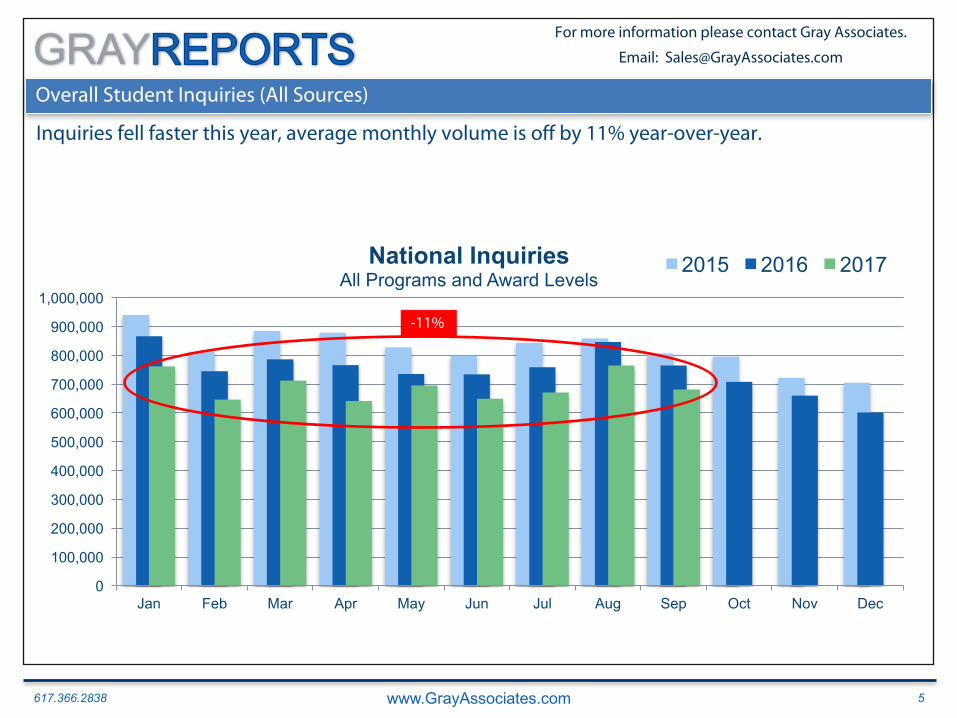
Overall Student Inquiries (All Sources)
Inquiries fell faster this year, average monthly volume is off by 11% year-over-year.
-11%

617.366.2838 www.GrayAssociates.com 6
GRAY For more information please contact Gray Associates.
Email: [email protected]
0
100,000
200,000
300,000
400,000
500,000
600,000
700,000
800,000
900,000
1,000,000
Jan Feb Mar Apr May Jun Jul Aug Sep Oct Nov Dec
National InquiriesAll Programs and Award Levels
2015 2016 2017
Overall Student Inquiries (All Sources)
September volume is consistent with the average, dropping 11% this year.
-11%

617.366.2838 www.GrayAssociates.com 7
GRAY For more information please contact Gray Associates.
Email: [email protected]
Conversion Maturity
It takes six months for inquiries to “mature.”
§ 60% of conversions take place in the month in which the inquiry is received.
§ It takes six months for 95% of conversions to take place.
-40% -35% -30% -25% -20% -15% -10% -5% 0% 5%
10%
Month 1 January
Month 2 February
Month 3 March
Month 4 April
Month 5 May
Month 6 June
Month 7 July
Month 8 August
Month 9 September
Conversion of 2017 January InquiriesVersus 2016 January Conversions
60%
78% 87% 90% 89%
95% 97% 99% 100%
0%
20%
40%
60%
80%
100%
120%
1 2 3 4 5 6 7 8 9
Percentage of Conversions
Months After Inquiry
Inquiries: Time to MaturityConversions of January 2017 Inquiries

617.366.2838 www.GrayAssociates.com 8
GRAY For more information please contact Gray Associates.
Email: [email protected]
80
90
100
110
120
130
140
Q1 2014
Q2 2014
Q3 2014
Q4 2014
Q1 2015
Q2 2015
Q3 2015
Q4 2015
Q1 2016
Q2 2016
Q3 2016
Q4 2016
Q1 2017
Q2 2017
Q3 2017
Overall Inquiry Conversion Rates: Trends(Indexed to Q1 2014)
Inquiry to Application: Overall Conversion Rates
In 2017, conversion rates are well above our 2014 baseline.§ Q2 2017 beat the baseline by 27%.
§ Despite being immature, Q3 2017 is already 27% above the baseline.
1. Applications are counted in the month in which the inquiry is received (i.e., an inquiry that is received in January and converts in March is counted as a January inquiry). Typically, the application rate will rise for three months or more after the month in which the inquiries were received.
2. Total includes unknown source type.
+27%

617.366.2838 www.GrayAssociates.com 9
GRAY For more information please contact Gray Associates.
Email: [email protected]
Overall Student Inquiry Conversions (All Sources)
For June inquiries, total conversions increased 6% year-over-year.§ July and August 2017 have already reached 2016 levels.
§ September is likely to pass last year by 5% or more.
1. Applications are counted in the month in which the inquiry was received (i.e., an inquiry that is received in January and converts in March will be counted as a January inquiry). Typically, the application rate will rise for at least three months after the month in which the inquiries were received.
05,000
10,00015,00020,00025,00030,00035,00040,000
Jan Feb Mar Apr May Jun Jul Aug Sep Oct Nov Dec
Total Inquiry ConversionsAll Programs and Award Levels
2015 2016 2017
+6% YoY
Immature Months1

617.366.2838 www.GrayAssociates.com 10
GRAY For more information please contact Gray Associates.
Email: [email protected]
Jan Feb Mar Apr May Jun Jul Aug Sep Oct Nov Dec2015 $43.10 $43.50 $43.70 $43.61 $43.80 $43.63 $45.07 $44.75 $45.24 $44.92 $44.67 $44.752016 $45.11 $45.91 $44.79 $44.85 $42.47 $44.97 $44.39 $44.53 $45.13 $44.77 $44.89 $45.492017 $45.39 $45.30 $45.50 $45.36 $45.51 $45.76 $45.19 $44.61 $45.29 $- $- $-
$30$32$34$36$38$40$42$44$46$48
Average Price per Inquiry for PPIAll Programs and Award Levels
Average Price for Pay-per-Inquiry
After dropping below $45 in August, the average price of an external inquiry is above $45.§ In September, prices were nearly flat year-over-year.
§ September is still the second lowest price this year.
Note: PPI means “Pay per Inquiry.” Inquiry price is the average price per inquiry from PPI.
+0.3%
617.366.2838 www.GrayAssociates.com 11
GRAY For more information please contact Gray Associates.
Email: [email protected]
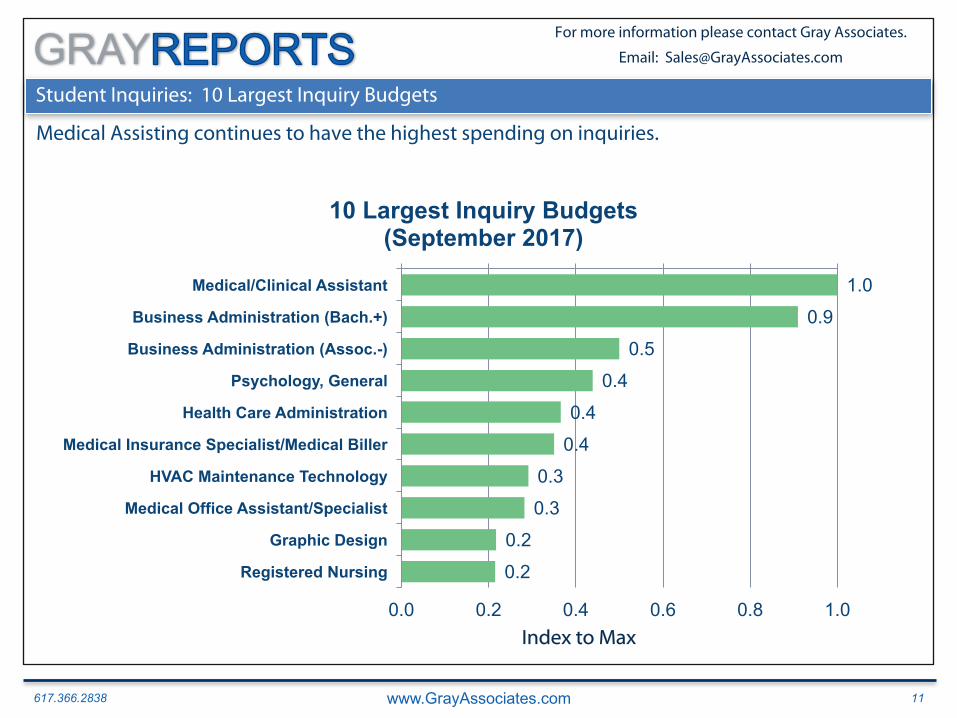
Student Inquiries: 10 Largest Inquiry Budgets
1.0
0.9
0.5
0.4
0.4
0.4
0.3
0.3
0.2
0.2
0.0 0.2 0.4 0.6 0.8 1.0
Medical/Clinical Assistant
Business Administration (Bach.+)
Business Administration (Assoc.-)
Psychology, General
Health Care Administration
Medical Insurance Specialist/Medical Biller
HVAC Maintenance Technology
Medical Office Assistant/Specialist
Graphic Design
Registered Nursing
10 Largest Inquiry Budgets(September 2017)
Medical Assisting continues to have the highest spending on inquiries.
Index to Max

617.366.2838 www.GrayAssociates.com 12
GRAY For more information please contact Gray Associates.
Email: [email protected]
Student Inquiries: Budget Spending for 10 Largest Programs
-1% -8%
-10% -18%
-25% -29% -29%
-45% -52%
-66%
-70% -60% -50% -40% -30% -20% -10% 0%
Graphic Design
Health Care Administration
Medical Insurance Specialist/Medical Biller
Psychology, General
HVAC Maintenance Technology
Medical/Clinical Assistant
Business Administration (Bach.+)
Registered Nursing
Business Administration (Assoc.-)
Medical Office Assistant/Specialist
September 2017 Inquiry Budget Trends10 Programs With the Largest Budgets
§ The program with the largest budget, Medical Assisting, decreased 29% YoY.
Spending decreased in all 10 of the programs with the largest budgets.
% Change YoY

617.366.2838 www.GrayAssociates.com 13
GRAY For more information please contact Gray Associates.
Email: [email protected]
Agenda
1. Student Demand Trends: Inquiries, Conversions, and Searches
1. National
2. Online and On-Campus
3. Degree Level
4. City and Program
2. IPEDS 2017 Update (2016 Data)
3. Program of the Month: Graphic Designers
4. Summary
617.366.2838 www.GrayAssociates.com 14
GRAY For more information please contact Gray Associates.
Email: [email protected]
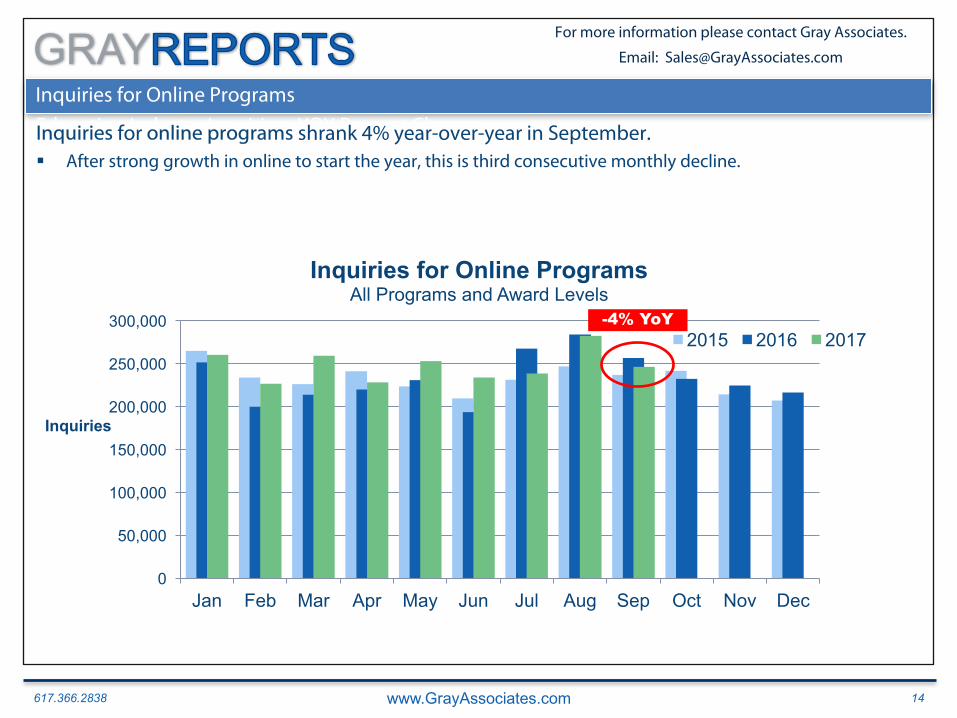
Inquiries for Online Programs
Education Industry Inquiries: YOY Percent ChangeInquiries for online programs shrank 4% year-over-year in September.§ After strong growth in online to start the year, this is third consecutive monthly decline.
0
50,000
100,000
150,000
200,000
250,000
300,000
Jan Feb Mar Apr May Jun Jul Aug Sep Oct Nov Dec
Inquiries
Inquiries for Online ProgramsAll Programs and Award Levels
2015 2016 2017-4% YoY

617.366.2838 www.GrayAssociates.com 15
GRAY For more information please contact Gray Associates.
Email: [email protected]
Student Inquiry Conversions for Online Programs
Conversions for online higher education programs increased 89% in June.§ This is the 11th consecutive increase in conversions.
§ July and August have already grown compared to last year.
02,0004,0006,0008,000
10,00012,00014,00016,000
Jan Feb Mar Apr May Jun Jul Aug Sep Oct Nov Dec
Inquiry Conversions for Online ProgramsAll Programs and Award Levels
2015 2016 2017
1. Conversions are counted in the month in which the inquiry was received (i.e., an inquiry that is received in January and converts in March will be counted as a January conversion). Typically, conversion rates will rise for at least three months after the inquiries were received.
+89% YoY
Immature Months1

617.366.2838 www.GrayAssociates.com 16
GRAY For more information please contact Gray Associates.
Email: [email protected]
Inquiries for On-Campus Programs
In 2017, inquiries for on-campus academic programs continued their decline.
§ In September, inquiries for on-campus programs dropped 21% year-over-year.
2012
050,000
100,000150,000200,000250,000300,000350,000400,000450,000
Jan Feb Mar Apr May Jun Jul Aug Sep Oct Nov Dec
Inquiries
Inquiries for On-Campus ProgramsAll Programs and Award Levels
2015 2016 2017
-21% YoY

617.366.2838 www.GrayAssociates.com 17
GRAY For more information please contact Gray Associates.
Email: [email protected]
Student Inquiry Conversions for On-Campus Programs
Conversions for on-campus programs fell 17% year-over-year in June.§ This marks the tenth consecutive month of declining conversions.
§ But, July and August might reach last year’s levels.
02,0004,0006,0008,000
10,00012,00014,00016,00018,000
Jan Feb Mar Apr May Jun Jul Aug Sep Oct Nov Dec
Inquiry Conversions for On-Campus ProgramsAll Programs and Award Levels
2015 2016 2017
-17% YOY1. Conversions are counted in the month in which the inquiry was received (i.e., an inquiry that is received in January and converts in March will be counted as a January
conversion). Typically, conversion rates will rise for at least three months after the inquiries were received.
Immature Months1
617.366.2838 www.GrayAssociates.com 18
GRAY For more information please contact Gray Associates.
Email: [email protected]
Agenda
1. Student Demand Trends: Inquiries, Conversions, and Searches
1. National
2. Online and On-Campus
3. Degree Level
4. City and Program
2. IPEDS 2017 Update (2016 Data)
3. Program of the Month: Graphic Designers
4. Summary
617.366.2838 www.GrayAssociates.com 19
GRAY For more information please contact Gray Associates.
Email: [email protected]
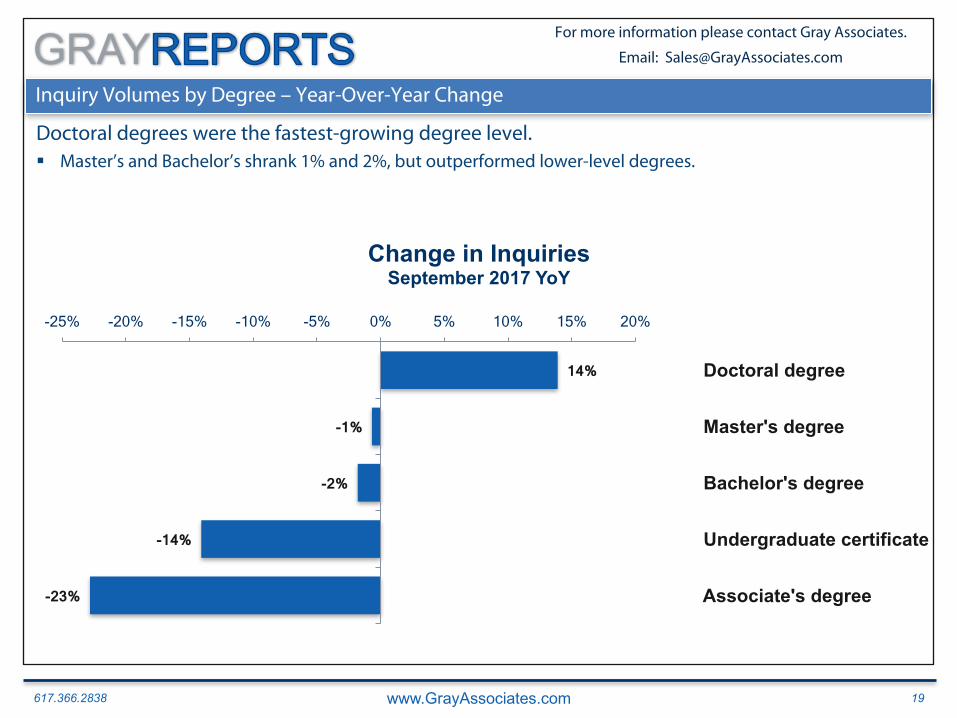
Inquiry Volumes by Degree – Year-Over-Year Change
Doctoral degrees were the fastest-growing degree level.§ Master’s and Bachelor’s shrank 1% and 2%, but outperformed lower-level degrees.
-23%
-14%
-2%
-1%
14%
-25% -20% -15% -10% -5% 0% 5% 10% 15% 20%
Associate's degree
Undergraduate certificate
Bachelor's degree
Master's degree
Doctoral degree
Change in InquiriesSeptember 2017 YoY

617.366.2838 www.GrayAssociates.com 20
GRAY For more information please contact Gray Associates.
Email: [email protected]
Agenda
1. Student Demand Trends: Inquiries, Conversions, and Searches
1. National
2. Online and On-Campus
3. Degree Level
4. City and Program
2. IPEDS 2017 Update (2016 Data)
3. Program of the Month: Graphic Designers
4. Summary
617.366.2838 www.GrayAssociates.com 21
GRAY For more information please contact Gray Associates.
Email: [email protected]
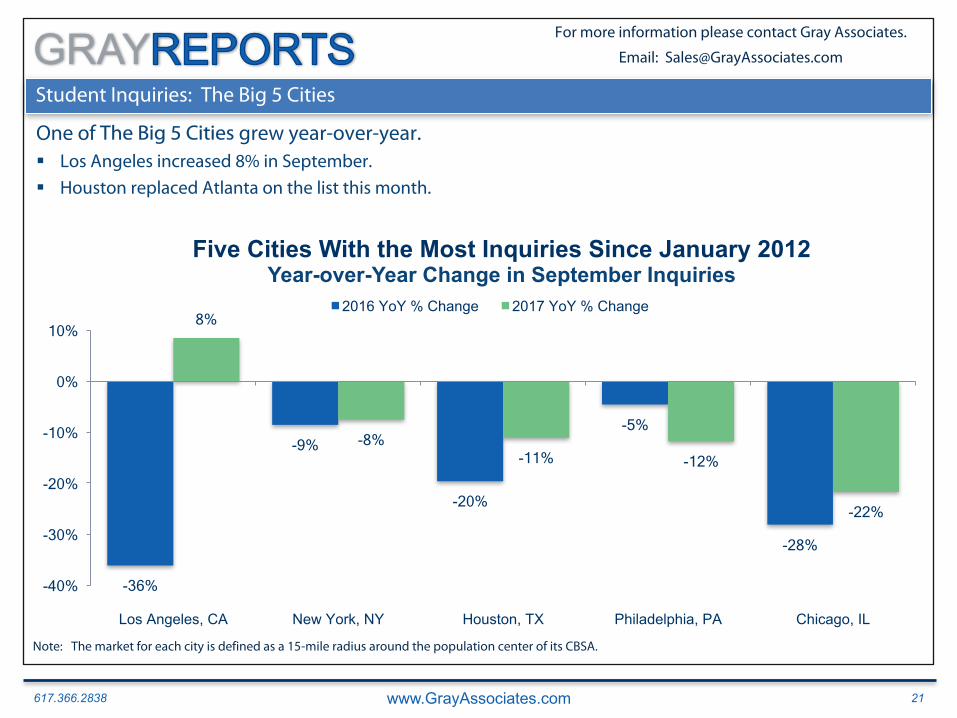
Student Inquiries: The Big 5 Cities
One of The Big 5 Cities grew year-over-year.§ Los Angeles increased 8% in September.
§ Houston replaced Atlanta on the list this month.
-36%
-9%
-20%
-5%
-28%
8%
-8% -11% -12%
-22%
-40%
-30%
-20%
-10%
0%
10%
Los Angeles, CA New York, NY Houston, TX Philadelphia, PA Chicago, IL
Five Cities With the Most Inquiries Since January 2012Year-over-Year Change in September Inquiries
2016 YoY % Change 2017 YoY % Change
Note: The market for each city is defined as a 15-mile radius around the population center of its CBSA.

617.366.2838 www.GrayAssociates.com 22
GRAY For more information please contact Gray Associates.
Email: [email protected]
The Big 5 Programs: September Growth
All of The Big 5 Programs fell 30% or more in September.
-30% -36%
-43% -46%
-53% -60%
-50%
-40%
-30%
-20%
-10%
0%
Medical Assistant Business Admin: Bachelor's +
Criminal Justice Business Admin: Associate's
Registered Nursing
Five Largest Programs Since January 2012Year-over-Year Change in September Inquiries
2017 YoY % Change
617.366.2838 www.GrayAssociates.com 23
GRAY For more information please contact Gray Associates.
Email: [email protected]
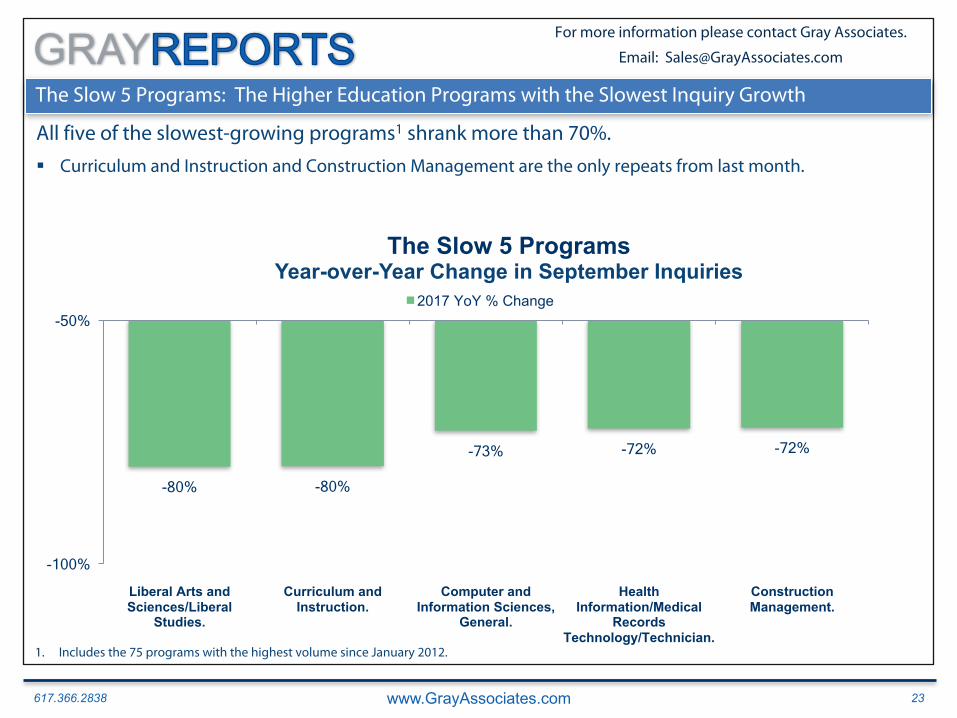
-80% -80%
-73% -72% -72%
-100%
-50%
Liberal Arts and Sciences/Liberal
Studies.
Curriculum and Instruction.
Computer and Information Sciences,
General.
Health Information/Medical
Records Technology/Technician.
Construction Management.
The Slow 5 ProgramsYear-over-Year Change in September Inquiries
2017 YoY % Change
The Slow 5 Programs: The Higher Education Programs with the Slowest Inquiry Growth
All five of the slowest-growing programs1 shrank more than 70%.
§ Curriculum and Instruction and Construction Management are the only repeats from last month.
1. Includes the 75 programs with the highest volume since January 2012.

617.366.2838 www.GrayAssociates.com 24
GRAY For more information please contact Gray Associates.
Email: [email protected]
51%
26% 15% 10%
-5%
-50%
0%
50%
100%
Accounting and Business/Management
Health Services Administration
Graphic Design Hospitality Administration
Entrepreneurship
The Fast 5 ProgramsYear-over-Year Change in September Inquiries
2017 YoY % Change
The Fast 5 Programs: The Higher Education Programs with the Fastest Inquiry Growth
Growth for the five fastest growing programs1 was uninspiring.§ Accounting and Business Management and Hospitality Administration are both repeats from last month.
§ In this challenging month, Entrepreneurship made the list, despite a 5% decline.
1. Includes the 75 programs with the highest volume since January 2012.
617.366.2838 www.GrayAssociates.com 25
GRAY For more information please contact Gray Associates.
Email: [email protected]
Agenda
1. Student Demand Trends: Inquiries, Conversions, and Searches
1. National
2. Online and On-Campus
3. Degree Level
4. City and Program
2. IPEDS 2017 Update (2016 Data)
3. Program of the Month: Graphic Designers
4. Summary

617.366.2838 www.GrayAssociates.com 26
GRAY For more information please contact Gray Associates.
Email: [email protected]
IPEDS Completions: 10 Largest Programs
251,393
167,171
138,794
116,238
114,222
94,220
81,959
81,607
75,893
64,996
0 100,000 200,000 300,000
Liberal Arts and Sciences/Liberal Studies - A
Business Administration, General - B
Registered Nursing - B
Business Administration, General. - M
Psychology, General - B
General Studies - A
Business Administration, General - A
Registered Nursing - A
Biology/Biological Sciences, General - B
Medical/Clinical Assistant - UC
10 Largest Programs(2016 Completions)
The Liberal Arts and Sciences Associate’s degree had the most completions in 2016.
Index to Max
617.366.2838 www.GrayAssociates.com 27
GRAY For more information please contact Gray Associates.
Email: [email protected]
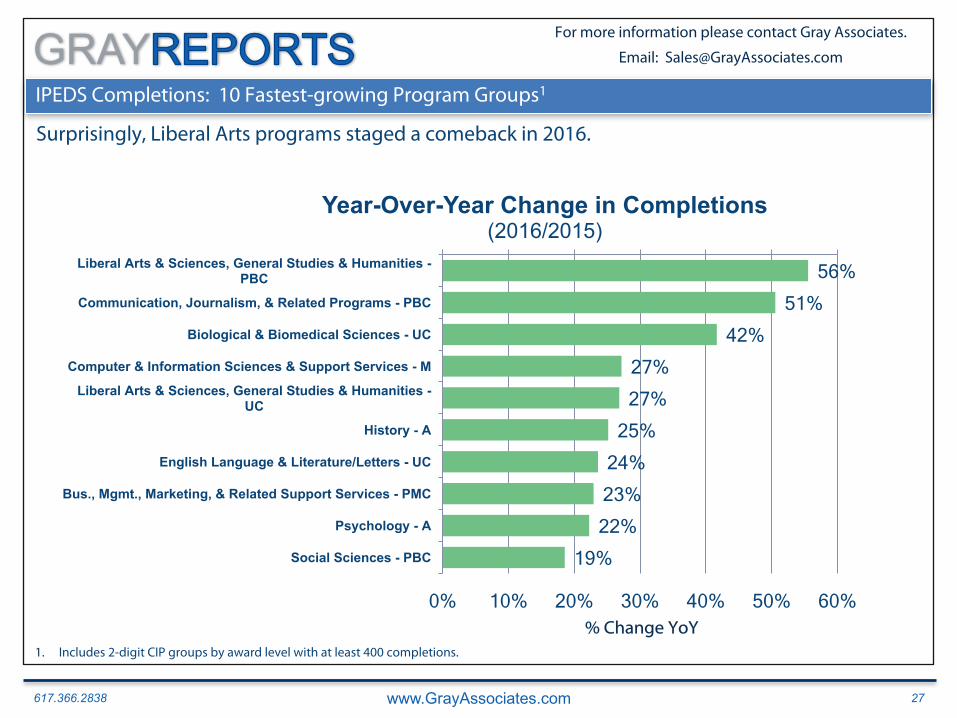
IPEDS Completions: 10 Fastest-growing Program Groups1
56% 51%
42% 27% 27%
25% 24% 23% 22%
19%
0% 10% 20% 30% 40% 50% 60%
Liberal Arts & Sciences, General Studies & Humanities -PBC
Communication, Journalism, & Related Programs - PBC
Biological & Biomedical Sciences - UC
Computer & Information Sciences & Support Services - M
Liberal Arts & Sciences, General Studies & Humanities -UC
History - A
English Language & Literature/Letters - UC
Bus., Mgmt., Marketing, & Related Support Services - PMC
Psychology - A
Social Sciences - PBC
Year-Over-Year Change in Completions(2016/2015)
Surprisingly, Liberal Arts programs staged a comeback in 2016.
% Change YoY1. Includes 2-digit CIP groups by award level with at least 400 completions.

617.366.2838 www.GrayAssociates.com 28
GRAY For more information please contact Gray Associates.
Email: [email protected]
Agenda
1. Student Demand Trends: Inquiries, Conversions, and Searches
1. National
2. Online and On-Campus
3. Degree Level
4. City and Program
2. IPEDS 2017 Update (2016 Data)
3. Program of the Month: Graphic Designers
4. Summary

617.366.2838 www.GrayAssociates.com 29
GRAY For more information please contact Gray Associates.
Email: [email protected]
Graphic Designers: Job Postings
In recent years, Job Postings for Graphic Designers have been volatile.
27,577
38,784
28,354
46,788
41,460
23,961
05,000
10,00015,00020,00025,00030,00035,00040,00045,00050,000
2012 2013 2014 2015 2016 2017 YTD
Job Postings
Job PostingsGraphic Designers
Source: Burning Glass Technologies, Labor Insight™ Real-Time Labor Market Information Tool, http://www.burning-glass.com 2017. October 1, 2016-September 30, 2017SOCs: Graphic Designers (27-1024) was used in this analysis.
617.366.2838 www.GrayAssociates.com 30
GRAY For more information please contact Gray Associates.
Email: [email protected]
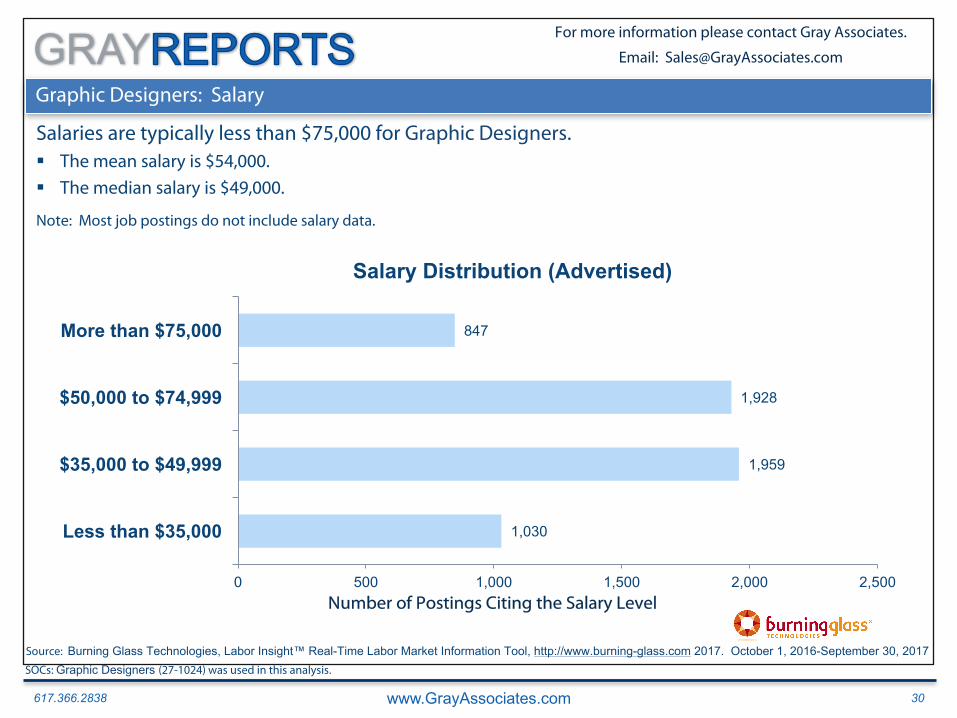
Graphic Designers: Salary
Salaries are typically less than $75,000 for Graphic Designers.
1,030
1,959
1,928
847
0 500 1,000 1,500 2,000 2,500
Less than $35,000
$35,000 to $49,999
$50,000 to $74,999
More than $75,000
Salary Distribution (Advertised)
§ The mean salary is $54,000.
§ The median salary is $49,000.
Note: Most job postings do not include salary data.
Number of Postings Citing the Salary Level
Source: Burning Glass Technologies, Labor Insight™ Real-Time Labor Market Information Tool, http://www.burning-glass.com 2017. October 1, 2016-September 30, 2017SOCs: Graphic Designers (27-1024) was used in this analysis.

617.366.2838 www.GrayAssociates.com 31
GRAY For more information please contact Gray Associates.
Email: [email protected]
Graphic Designers: Education (Minimum Advertised)
Among job postings that specify education, 78% of Graphic Designer job postings cite a Bachelor’s degree.
10%
10%
78%
2%
1%
0% 10% 20% 30% 40% 50% 60% 70% 80% 90%
High school or vocational training
Associate's degree
Bachelor's degree
Master's degree
Doctoral degree
Most Frequently Cited Education (Minimum Advertised)
Source: Burning Glass Technologies, Labor Insight™ Real-Time Labor Market Information Tool, http://www.burning-glass.com 2017. October 1, 2016-September 30, 2017SOCs: Graphic Designers (27-1024) was used in this analysis.

617.366.2838 www.GrayAssociates.com 32
GRAY For more information please contact Gray Associates.
Email: [email protected]
Graphic Designers: Job Titles
Graphic Designer is by far the most common title in this field.
Job Titles Count % to TotalGraphicDesigner 16,932 57.86%VisualDesigner 3,004 10.26%ProductionArtist 1,996 6.82%GraphicArtist 1,480 5.06%JuniorGraphicDesigner 673 2.30%ProductionManager 249 0.85%FreelanceGraphicDesigner 197 0.67%CreativeDesigner 138 0.47%GraphicSpecialist 114 0.39%VisualInformationSpecialist 112 0.38%
Total 29,276
Source: Burning Glass Technologies, Labor Insight™ Real-Time Labor Market Information Tool, http://www.burning-glass.com 2017. October 1, 2016-September 30, 2017SOCs: Graphic Designers (27-1024) was used in this analysis.

617.366.2838 www.GrayAssociates.com 33
GRAY For more information please contact Gray Associates.
Email: [email protected]
Graphic Designers: Skill Clusters
Postings for Graphic Designers require a variety of design and software skills.
16%
16%
18%
20%
22%
23%
24%
37%
78%
87%
0% 20% 40% 60% 80% 100%
Marketing and Public Relations: Social Media
Marketing and Public Relations: Marketing Management
Business: Project Management
Media and Writing: Art and Illustration
Design: User Interface and User Experience (UI/UX) Design
Information Technology: Web Design
Media and Writing: Visual Design Production
Information Technology: Microsoft Office and Productivity Tools
Design: Graphic and Visual Design Software
Design: Graphic and Visual Design
Most Frequently-Cited Skill Clusters in Job Postings
OtherDesign
Source: Burning Glass Technologies, Labor Insight™ Real-Time Labor Market Information Tool, http://www.burning-glass.com 2017. October 1, 2016-September 30, 2017SOCs: Graphic Designers (27-1024) was used in this analysis.

617.366.2838 www.GrayAssociates.com 34
GRAY For more information please contact Gray Associates.
Email: [email protected]
Graphic Designers: Employers
The largest employers are hiring hundreds of Graphic Designers§ But, the employment market remains fragmented: Accenture is the largest employer, but only accounts for
1.5% of specified postings.
241
170
165
87
82
65
64
57
56
52
0 50 100 150 200 250 300
Accenture
Deloitte
Anthem Blue Cross
Booz Allen Hamilton Inc.
Amazon.com
Northrop Grumman
IBM
Whole Foods Market, Inc.
Gensler
Lone Star Med
Graphic DesignersJob Postings by Employer
Source: Burning Glass Technologies, Labor Insight™ Real-Time Labor Market Information Tool, http://www.burning-glass.com 2017. October 1, 2016-September 30, 2017SOCs: Graphic Designers (27-1024) was used in this analysis.
617.366.2838 www.GrayAssociates.com 35
GRAY For more information please contact Gray Associates.
Email: [email protected]
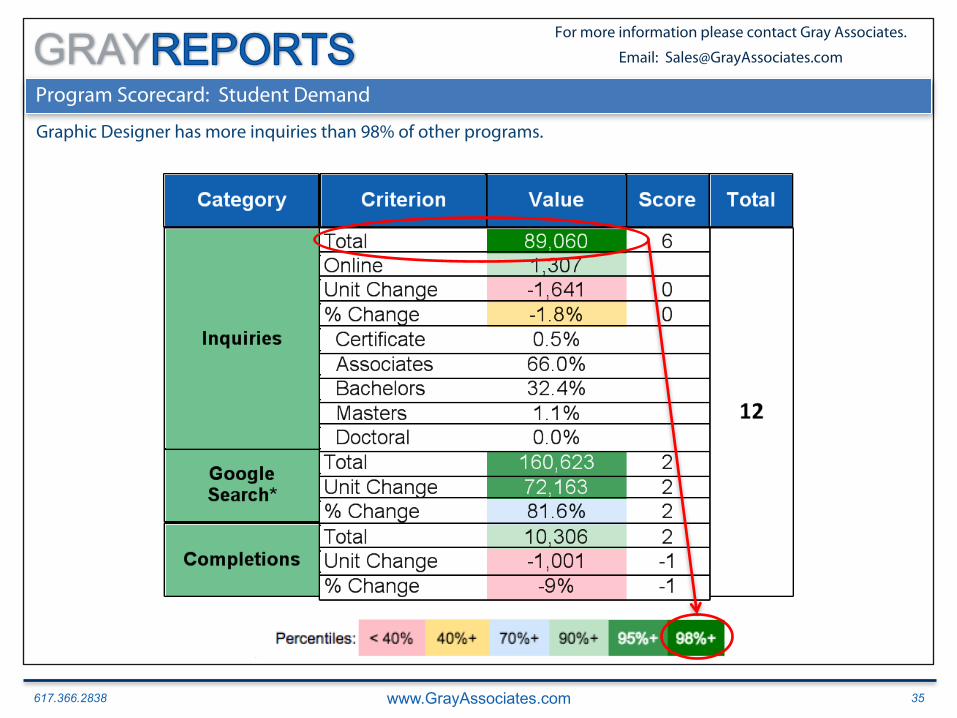
Program Scorecard: Student Demand
Graphic Designer has more inquiries than 98% of other programs.
617.366.2838 www.GrayAssociates.com 36
GRAY For more information please contact Gray Associates.
Email: [email protected]
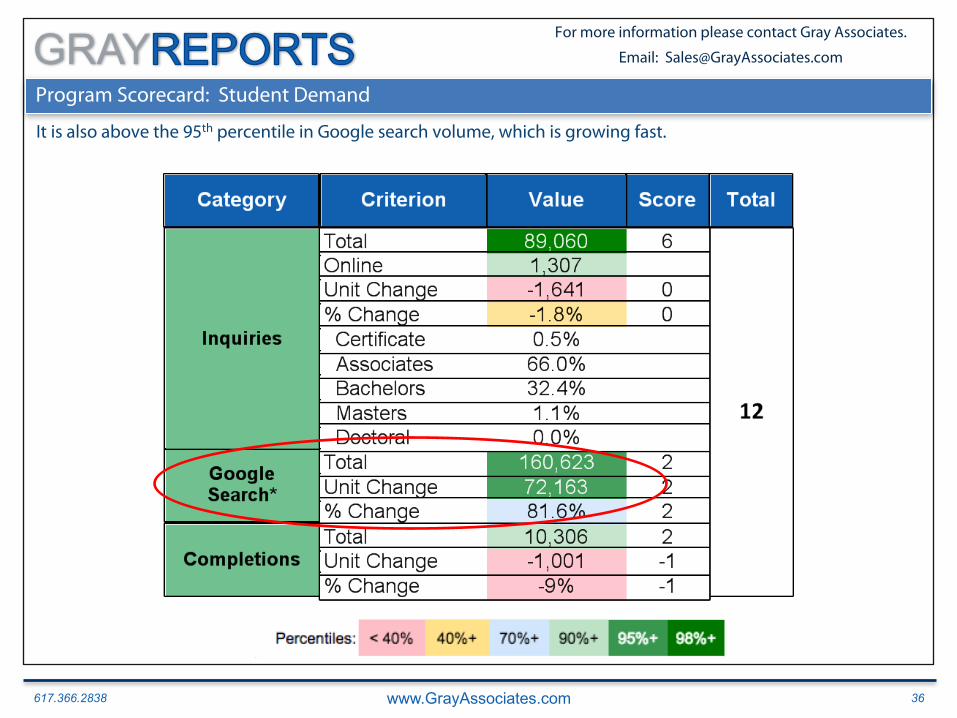
Program Scorecard: Student Demand
It is also above the 95th percentile in Google search volume, which is growing fast.

617.366.2838 www.GrayAssociates.com 37
GRAY For more information please contact Gray Associates.
Email: [email protected]
Program Scorecard: Student Demand
Completions, however, are shrinking fast.

617.366.2838 www.GrayAssociates.com 38
GRAY For more information please contact Gray Associates.
Email: [email protected]
Program Scorecard: Competition
Most programs have fewer competitors.

617.366.2838 www.GrayAssociates.com 39
GRAY For more information please contact Gray Associates.
Email: [email protected]
Program Scorecard: Competition
Google cost per click and competitive index are both above average.
617.366.2838 www.GrayAssociates.com 40
GRAY For more information please contact Gray Associates.
Email: [email protected]
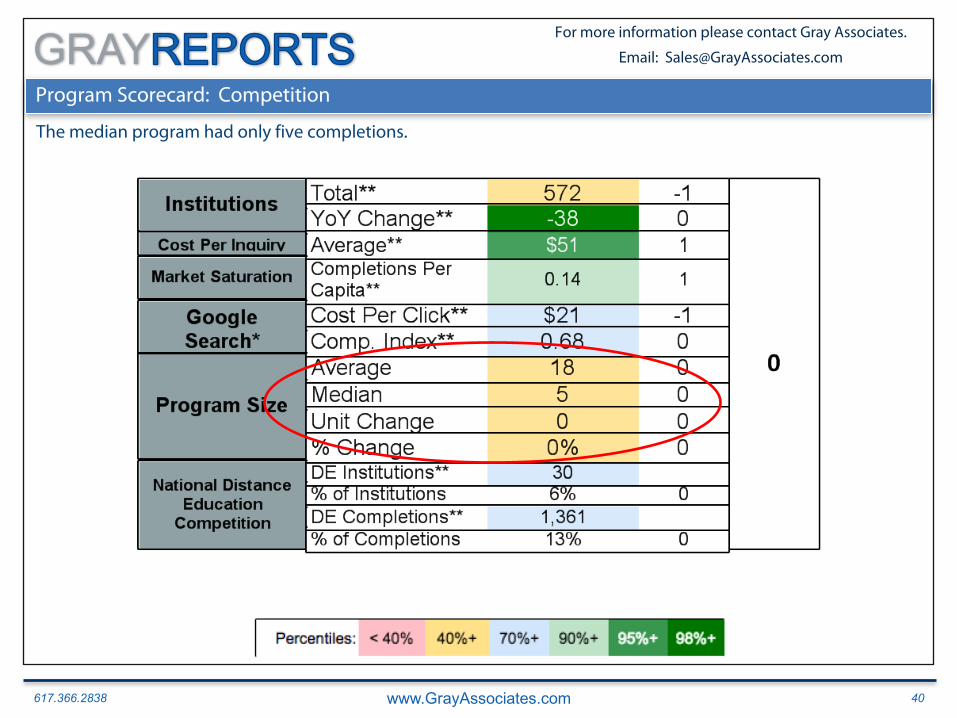
Program Scorecard: Competition
The median program had only five completions.

617.366.2838 www.GrayAssociates.com 41
GRAY For more information please contact Gray Associates.
Email: [email protected]
Program Scorecard: Competition
This program remains largely an on-ground offering; only 13% of completions are online.

617.366.2838 www.GrayAssociates.com 42
GRAY For more information please contact Gray Associates.
Email: [email protected]
Competitors: Graphic Design
The market leaders are for-profits with very large Associate’s and Bachelor’s programs.

617.366.2838 www.GrayAssociates.com 43
GRAY For more information please contact Gray Associates.
Email: [email protected]
Program Scorecard: Employment and Fit
There is a large number of job postings, but the need for formal education is unclear.

617.366.2838 www.GrayAssociates.com 44
GRAY For more information please contact Gray Associates.
Email: [email protected]
Program Scorecard

617.366.2838 www.GrayAssociates.com 45
GRAY For more information please contact Gray Associates.
Email: [email protected]
Agenda
1. Student Demand Trends: Inquiries, Conversions, and Searches
1. National
2. Online and On-Campus
3. Degree Level
4. City and Program
2. IPEDS 2017 Update (2016 Data)
3. Job Postings: Graphic Designers
4. Program of the Month: Graphic Designers
5. Summary

617.366.2838 www.GrayAssociates.com 46
GRAY For more information please contact Gray Associates.
Email: [email protected]
Key Demand Trends and Observations
§ While inquiries are falling, conversion rates are improving.
─ Total Inquiries fell 11%
─ But conversions for the most recent mature month were up 6%
─ Online conversions are increasing at double-digit rates
§ It takes six months for many inquiries to convert: lead nurturing is vital.
§ Interest in on-ground programs continued a steep decline.─ Inquiries fell 12% year-over-year
─ Conversion fell 10% year-over-year
§ Higher-level degrees are outpacing Associate’s degrees and below.
§ Graphic Design is a good program at the national level.─ Student and employer demand are strong
─ Competition is unusually intense
─ Wages are a concern

617.366.2838 www.GrayAssociates.com 47
GRAY For more information please contact Gray Associates.
Email: [email protected]
Questions and Contacts
Please feel free to contact:Bob Atkins
CEOGray Associates, Inc.
[email protected]@Gray_Associates
617.366.2836

617.366.2838 www.GrayAssociates.com 48
GRAY For more information please contact Gray Associates.
Email: [email protected]
Upcoming Gray Associates’ Webcast
Please join us next month!
November Webcast(October Results)
Thursday, November 16th at 2:00 PM ET