2016 March GrayReports - Student Demand Trends
41
GRAYREPORTS Demand for Higher Education Programs www.GrayAssociates.com Results through March 2016
-
Upload
gray-associates-inc -
Category
Education
-
view
217 -
download
0
Transcript of 2016 March GrayReports - Student Demand Trends

GRAYREPORTS Demand for Higher Education Programs
www.GrayAssociates.com
Results through March 2016

617.366.2838 www.GrayAssociates.com 2
GRAY For more information please contact Gray Associates. Email: [email protected]
Who Is Gray?
GrayData
IPEDS+
Employment BLS/O*NET
Placement Rates Gray Research
Student Inquiries GrayReports
Demographics US Census
Job Postings WANTED Analytics
Students Programs Strategy Locations § Demographic priorities § Geo-priorities § Market share
§ City selection § Location selection § Relocation analysis § Consolidation
§ Program selection § Program development § Curriculum enhancement § Market reports
§ Business strategy § Strategy implementation § Pricing § Outcome improvement
Advanced Analytics Predictive Models
Geo-Analytics
Clients: Higher Education Institutions and Stakeholders
Competition
Program Evaluation System
§ Custom Scoring
§ Scorecards
- By Program
- By Market
- 100+ Markets
- 1,000+ Programs
Updates
Enhanced Crosswalks
617.366.2838 www.GrayAssociates.com 3
GRAY For more information please contact Gray Associates. Email: [email protected]
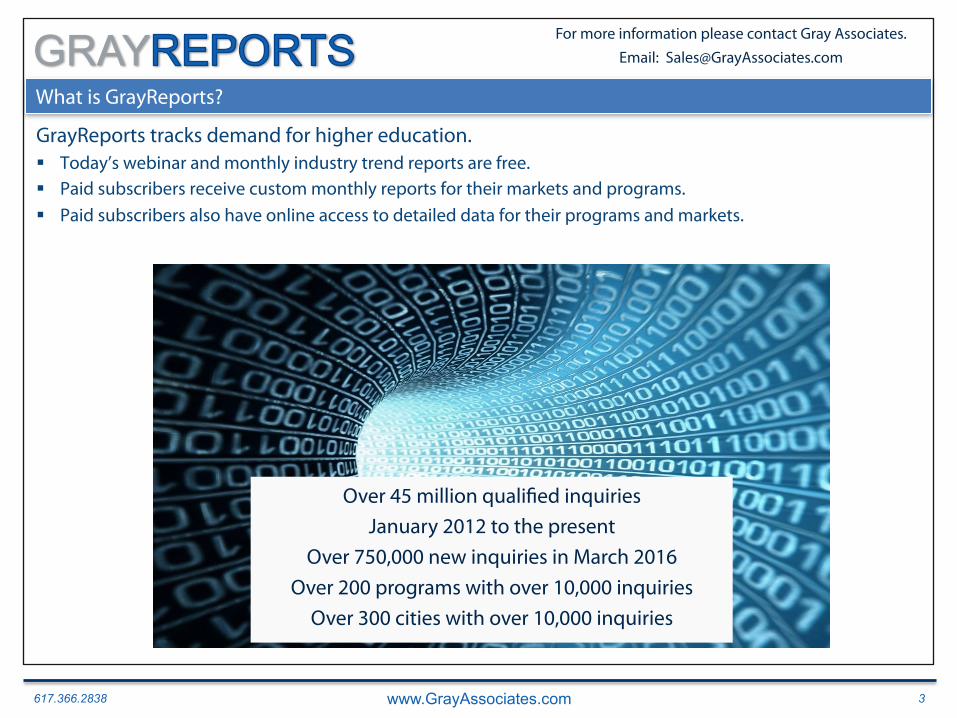
What is GrayReports?
GrayReports tracks demand for higher education. § Today’s webinar and monthly industry trend reports are free. § Paid subscribers receive custom monthly reports for their markets and programs. § Paid subscribers also have online access to detailed data for their programs and markets.
Over 45 million qualified inquiries January 2012 to the present
Over 750,000 new inquiries in March 2016 Over 200 programs with over 10,000 inquiries
Over 300 cities with over 10,000 inquiries

617.366.2838 www.GrayAssociates.com 4
GRAY For more information please contact Gray Associates. Email: [email protected]
Agenda
1. National Inquiry and Conversion Trends
2. Inquiries and Conversions: Online vs. On-Campus Programs
3. Views by Program and Segment
4. Program Evaluation
5. SocialHP
6. Summary

617.366.2838 www.GrayAssociates.com 5
GRAY For more information please contact Gray Associates. Email: [email protected]
Overall Student Inquiries (All Sources)
Overall inquiry volumes for higher education fell another 10%. § Inquiries were increasing late last year, but the trend broke at the start of the new year. § This year’s first quarter was down 9% compared to last year’s first quarter.
-
200,000
400,000
600,000
800,000
1,000,000
1,200,000
Jan Feb Mar Apr May Jun Jul Aug Sep Oct Nov Dec
National Inquiries All Programs and Award Levels 2014 2015 2016
-10% YoY

617.366.2838 www.GrayAssociates.com 6
GRAY For more information please contact Gray Associates. Email: [email protected]
Branded Inquiries
Branded inquiries decreased 10% in March. § March was the first time Branded inquiries have decreased since July 2015.
0
50,000
100,000
150,000
200,000
250,000
300,000
Jan Feb Mar Apr May Jun Jul Aug Sep Oct Nov Dec
National Branded Inquiries All Programs and Award Levels 2014 2015 2016
-10% YoY

617.366.2838 www.GrayAssociates.com 7
GRAY For more information please contact Gray Associates. Email: [email protected]
External Inquiries: Overall Results
External inquiries decreased in March for the second consecutive year. § This was the lowest March volume in over four years. § External inquiries decreased year-over-year in 13 of the last 15 months.
0
100,000
200,000
300,000
400,000
500,000
600,000
700,000
800,000
900,000
Jan Feb Mar Apr May Jun Jul Aug Sep Oct Nov Dec
National External Inquiries All Programs and Award Levels 2014 2015 2016
-11% YoY

617.366.2838 www.GrayAssociates.com 8
GRAY For more information please contact Gray Associates. Email: [email protected]
Inquiry to Application: Overall Conversion Rates
Overall conversion rates have been volatile, but were trending up until recent months. § Since Q1 2014, quarterly rates have risen as much as 18% and dropped by 4%. § The most recent mature quarter dropped by 1%. § Both Branded and external inquiry conversion rates dropped in Q4.
80
85
90
95
100
105
110
115
120
125
Q1 2014 Q2 2014 Q3 2014 Q4 2014 Q1 2015 Q2 2015 Q3 2015 Q4 2015
Overall Inquiry Conversion Rates: Trends (Indexed to Q1 2014)
1. Applications are counted in the month in which the inquiry was received (i.e., an inquiry that is received in January and converts in March will be counted as a January inquiry). Typically, the application rate will rise for at least three months after the month in which the inquiries were received.
2. Total includes unknown source type.
617.366.2838 www.GrayAssociates.com 9
GRAY For more information please contact Gray Associates. Email: [email protected]
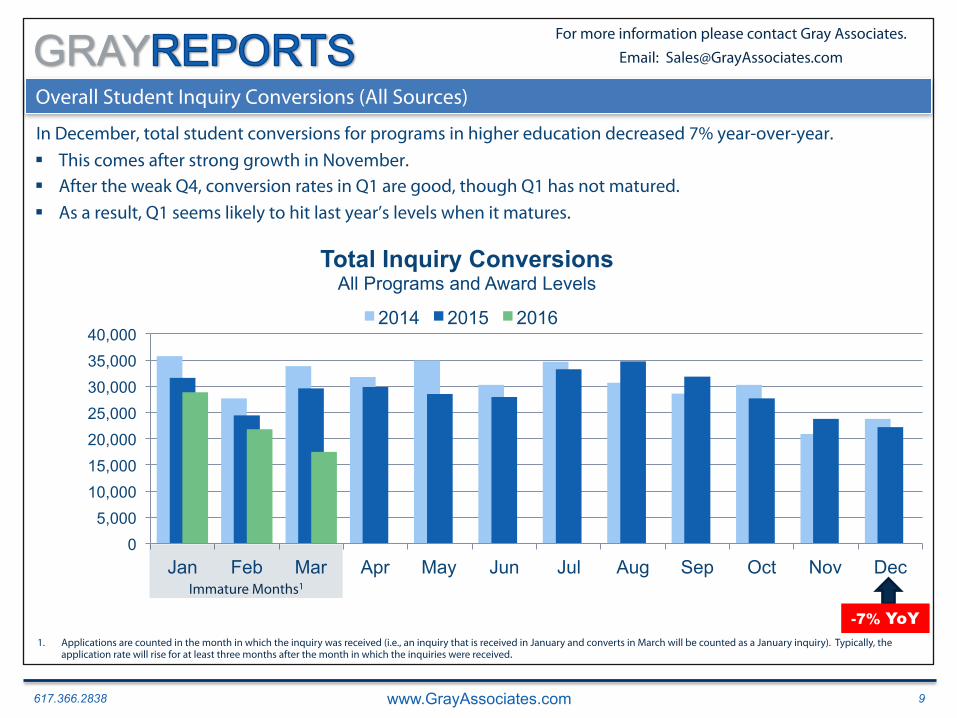
Overall Student Inquiry Conversions (All Sources)
In December, total student conversions for programs in higher education decreased 7% year-over-year. § This comes after strong growth in November. § After the weak Q4, conversion rates in Q1 are good, though Q1 has not matured. § As a result, Q1 seems likely to hit last year’s levels when it matures.
1. Applications are counted in the month in which the inquiry was received (i.e., an inquiry that is received in January and converts in March will be counted as a January inquiry). Typically, the application rate will rise for at least three months after the month in which the inquiries were received.
0 5,000
10,000 15,000 20,000 25,000 30,000 35,000 40,000
Jan Feb Mar Apr May Jun Jul Aug Sep Oct Nov Dec
Total Inquiry Conversions All Programs and Award Levels
2014 2015 2016
-7% YoY
Immature Months1
617.366.2838 www.GrayAssociates.com 10
GRAY For more information please contact Gray Associates. Email: [email protected]
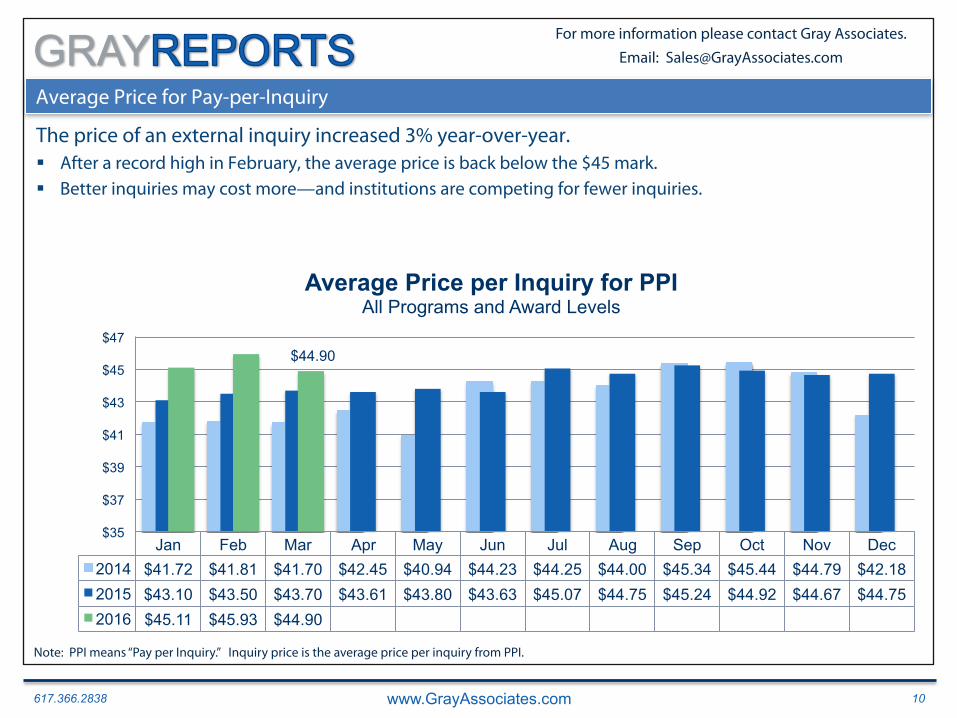
Average Price for Pay-per-Inquiry
The price of an external inquiry increased 3% year-over-year. § After a record high in February, the average price is back below the $45 mark. § Better inquiries may cost more—and institutions are competing for fewer inquiries.
Jan Feb Mar Apr May Jun Jul Aug Sep Oct Nov Dec 2014 $41.72 $41.81 $41.70 $42.45 $40.94 $44.23 $44.25 $44.00 $45.34 $45.44 $44.79 $42.18 2015 $43.10 $43.50 $43.70 $43.61 $43.80 $43.63 $45.07 $44.75 $45.24 $44.92 $44.67 $44.75 2016 $45.11 $45.93 $44.90
$44.90
$35
$37
$39
$41
$43
$45
$47
Average Price per Inquiry for PPI All Programs and Award Levels
Note: PPI means “Pay per Inquiry.” Inquiry price is the average price per inquiry from PPI.

617.366.2838 www.GrayAssociates.com 11
GRAY For more information please contact Gray Associates. Email: [email protected]
Agenda
1. National Inquiry Trends
2. Inquiries and Conversions: Online vs. On-Campus Programs
3. Views by Program and Segment
4. Program Evaluation
5. SocialHP
6. Summary
617.366.2838 www.GrayAssociates.com 12
GRAY For more information please contact Gray Associates. Email: [email protected]
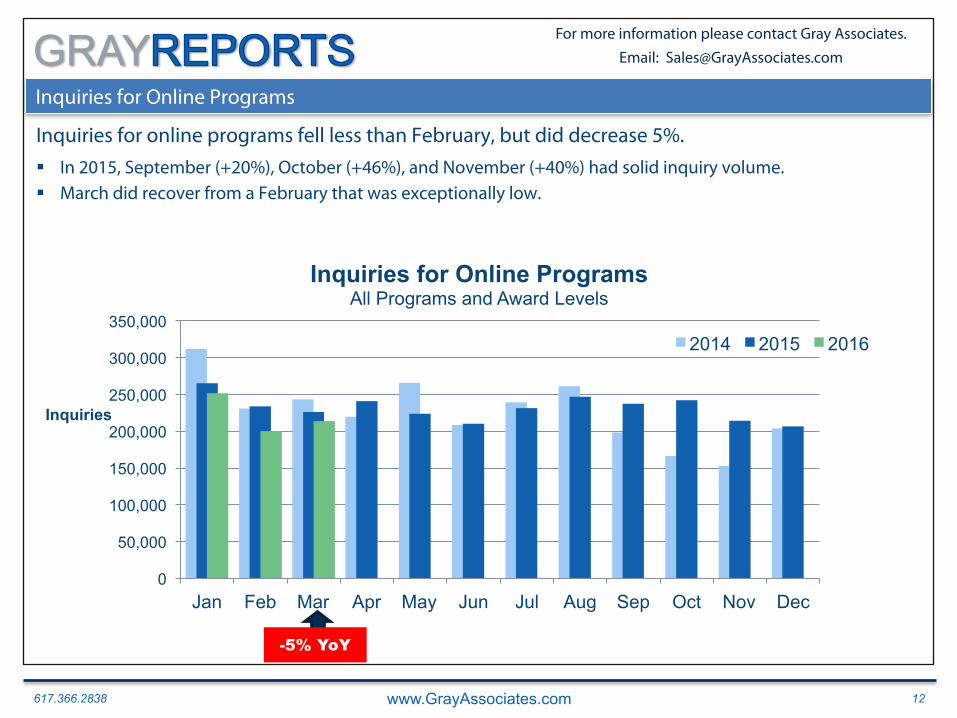
Inquiries for Online Programs Education Industry Inquiries: YOY Percent Change Inquiries for online programs fell less than February, but did decrease 5%. § In 2015, September (+20%), October (+46%), and November (+40%) had solid inquiry volume. § March did recover from a February that was exceptionally low.
0
50,000
100,000
150,000
200,000
250,000
300,000
350,000
Jan Feb Mar Apr May Jun Jul Aug Sep Oct Nov Dec
Inquiries
Inquiries for Online Programs All Programs and Award Levels
2014 2015 2016
-5% YoY

617.366.2838 www.GrayAssociates.com 13
GRAY For more information please contact Gray Associates. Email: [email protected]
Student Inquiry Conversions for Online Programs
Year-over-year, December had 12% more conversions for online programs. § This trend will probably not continue into the new year.
─ January is on pace to come in very near 2015 levels.
1. Applications are counted in the month in which the inquiry was received (i.e., an inquiry that is received in January and converts in March will be counted as a January inquiry). Typically, the application rate will rise for at least three months after the month in which the inquiries were received.
0 1,000 2,000 3,000 4,000 5,000 6,000 7,000 8,000 9,000
10,000
Jan Feb Mar Apr May Jun Jul Aug Sep Oct Nov Dec
Inquiry Conversions for Online Programs All Programs and Award Levels
2014 2015 2016
Immature Months1
12% YoY
617.366.2838 www.GrayAssociates.com 14
GRAY For more information please contact Gray Associates. Email: [email protected]
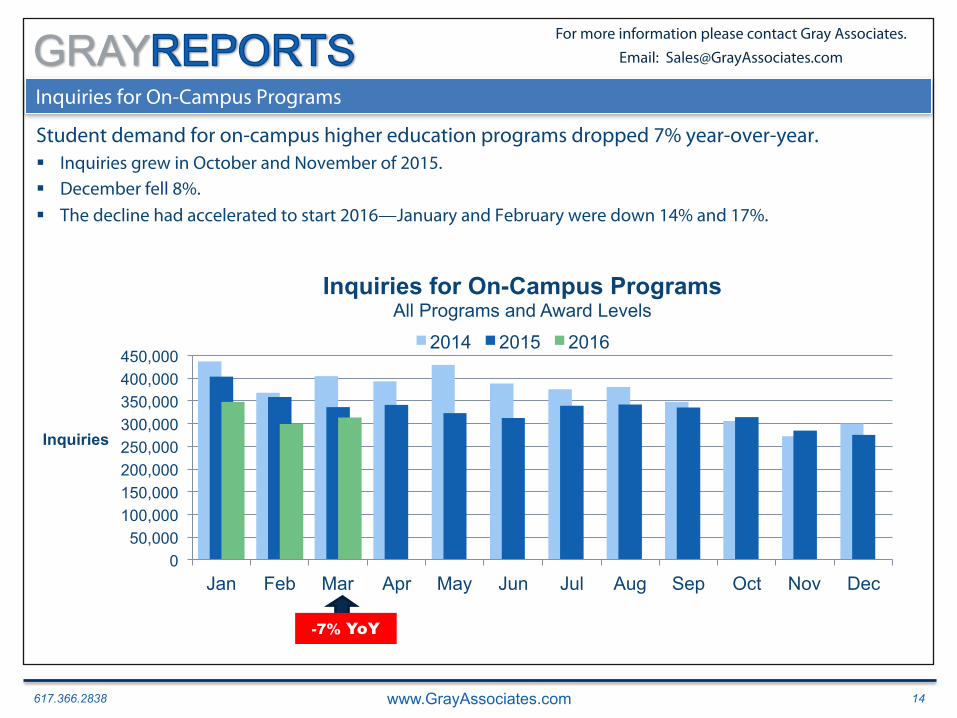
Inquiries for On-Campus Programs
Student demand for on-campus higher education programs dropped 7% year-over-year. § Inquiries grew in October and November of 2015. § December fell 8%. § The decline had accelerated to start 2016—January and February were down 14% and 17%.
2012
0 50,000
100,000 150,000 200,000 250,000 300,000 350,000 400,000 450,000
Jan Feb Mar Apr May Jun Jul Aug Sep Oct Nov Dec
Inquiries
Inquiries for On-Campus Programs All Programs and Award Levels
2014 2015 2016
-7% YoY

617.366.2838 www.GrayAssociates.com 15
GRAY For more information please contact Gray Associates. Email: [email protected]
Student Inquiry Conversions for On-Campus Programs
Conversions for on-campus programs continued to decline—down 13% in December. § Q1 conversions may reach last year’s levels when these months mature.
0 2,000 4,000 6,000 8,000
10,000 12,000 14,000 16,000 18,000 20,000
Jan Feb Mar Apr May Jun Jul Aug Sep Oct Nov Dec
Inquiry Conversions for On-Campus Programs All Programs and Award Levels
2014 2015 2016
1. Applications are counted in the month in which the inquiry was received (i.e., an inquiry that is received in January and converts in March will be counted as a January inquiry). Typically, the application rate will rise for at least three months after the month in which the inquiries were received.
-13% YOY Immature Months1

617.366.2838 www.GrayAssociates.com 16
GRAY For more information please contact Gray Associates. Email: [email protected]
Agenda
1. National Inquiry Trends
2. Inquiries and Conversions: Online vs. On-Campus Programs
3. Views by Program and Segment
4. Program Evaluation
5. SocialHP
6. Summary

617.366.2838 www.GrayAssociates.com 17
GRAY For more information please contact Gray Associates. Email: [email protected]
The Big 5 Programs: March Growth
Three of the big five programs grew! § Three of the Big 5 Programs grew 8% or more year-over-year.
─ After massive year-over-year declines in 2014 and 2015, Criminal Justice is regaining some ground. ─ Registered Nursing is continuing to grow and is up more than 14%.
§ Medical Assistant and Administrative Assistant continued to fall.
-76%
84%
6%
-13% -7%
50%
14% 8%
-20% -27%
-100%
-80%
-60%
-40%
-20%
0%
20%
40%
60%
80%
100%
Criminal Justice/Police Science
Registered Nursing/Registered Nurse
Business Administration and Management
Medical/Clinical Assistant Administrative Assistant and Secretarial Science
Five Largest Programs Since January 2012 Year-over-Year Change in March Inquiries
2015 YoY % Change 2016 YoY % Change

617.366.2838 www.GrayAssociates.com 18
GRAY For more information please contact Gray Associates. Email: [email protected]
Student Inquiries: The Big 5 Cities
Once again, the biggest cities were down year-over-year. § March was much worse than February for the Big 5—all five were down more than 10%. § Unlike last month, Chicago had the largest decline, with a 34% year-over-year drop.
-15%
-2%
-28%
-7% -10% -12%
-22% -25%
-30% -34%
-40%
-30%
-20%
-10%
0%
10%
Philadelphia, PA New York, NY Los Angeles, CA Atlanta, GA Chicago, IL
Top Five Cities for Inquiries Since January 2012 Year-over-Year Change in March Inquiries
2015 YoY % Change2 2016 YoY % Change
Note: The market for each city is defined as a 15-mile radius around the population center of its CBSA.

617.366.2838 www.GrayAssociates.com 19
GRAY For more information please contact Gray Associates. Email: [email protected]
-34%
-29%
-13%
-12%
-8%
-8%
-1%
12%
18%
26%
-40% -30% -20% -10% 0% 10% 20% 30%
Unknown Degree Associate's Campus External Online Certificate Branded Bachelor's Doctorate Master's
Quarterly Change in Inquiries 2014/2015 vs. 2015/2016 (January – March)
Inquiry Volumes by Category – Trailing 3 Months
Quarterly inquiries for higher-level degrees continued to grow. § Higher-level degrees continue to have the highest inquiry growth. § Unlike previous quarters, internal inquiries declined slightly. § For the quarter, both on-campus and online programs were down.
617.366.2838 www.GrayAssociates.com 20
GRAY For more information please contact Gray Associates. Email: [email protected]
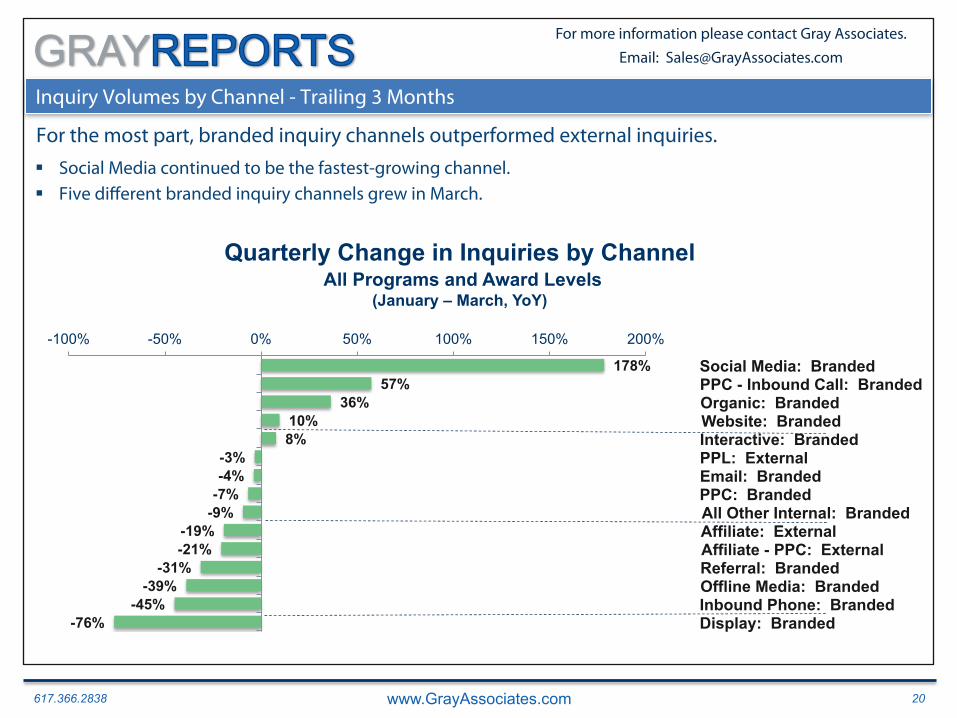
Inquiry Volumes by Channel - Trailing 3 Months
For the most part, branded inquiry channels outperformed external inquiries. § Social Media continued to be the fastest-growing channel. § Five different branded inquiry channels grew in March.
-76% -45%
-39% -31%
-21% -19%
-9% -7% -4% -3%
8% 10%
36% 57%
178%
-100% -50% 0% 50% 100% 150% 200%
Display: Branded Inbound Phone: Branded Offline Media: Branded Referral: Branded Affiliate - PPC: External Affiliate: External All Other Internal: Branded PPC: Branded Email: Branded PPL: External Interactive: Branded Website: Branded Organic: Branded PPC - Inbound Call: Branded Social Media: Branded
Quarterly Change in Inquiries by Channel All Programs and Award Levels
(January – March, YoY)

617.366.2838 www.GrayAssociates.com 21
GRAY For more information please contact Gray Associates. Email: [email protected]
Agenda
1. National Inquiry Trends
2. Inquiries and Conversions: Online vs. On-Campus Programs
3. Views by Program and Segment
4. Program Evaluation
5. SocialHP
6. Summary

617.366.2838 www.GrayAssociates.com 22
GRAY For more information please contact Gray Associates. Email: [email protected]
DoE to Accreditors: Employment Outcomes Matter
The Department of Education notified accreditors that they need to better monitor employment outcomes.
“If there have been poor outcomes for students or other concerns that have arisen at accredited institutions or programs, does the agency need to revise its standards and processes to identify and address those issues
more effectively?”
Source: Letter from the U.S. Department of Education dated April 22, 2016 titled “Flexibility in Application of Accrediting Agency Review Process; and Emphases in Departmental Review of Agency Effectiveness”, signed by Ted Mitchell, Under Secretary.
617.366.2838 www.GrayAssociates.com 23
GRAY For more information please contact Gray Associates. Email: [email protected]
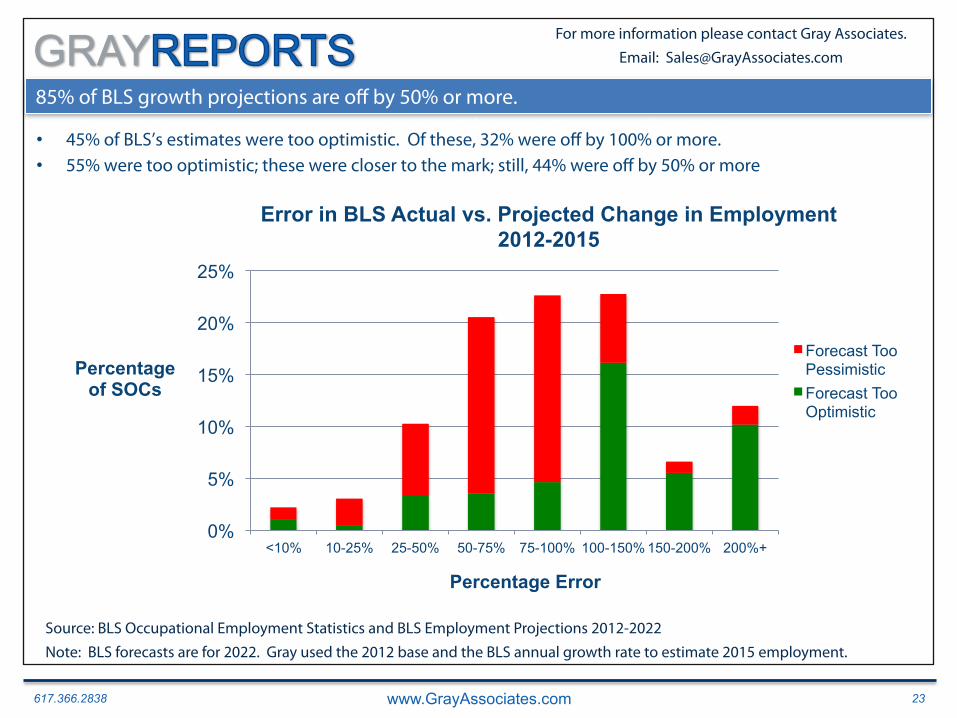
85% of BLS growth projections are off by 50% or more. • 45% of BLS’s estimates were too optimistic. Of these, 32% were off by 100% or more. • 45% of BLS’s estimates were too optimistic. Of these, 32% were off by 100% or more. • 55% were too optimistic; these were closer the mark; still, 44% were off by 50% or more55%
were too optimistic; these were closer the mark; still, 44% were off by 50% or more.
• 45% of BLS’s estimates were too optimistic. Of these, 32% were off by 100% or more. • 55% were too optimistic; these were closer to the mark; still, 44% were off by 50% or more
0%
5%
10%
15%
20%
25%
<10% 10-25% 25-50% 50-75% 75-100% 100-150% 150-200% 200%+
Percentage of SOCs
Percentage Error
Error in BLS Actual vs. Projected Change in Employment 2012-2015
Forecast Too Pessimistic Forecast Too Optimistic
Source: BLS Occupational Employment Statistics and BLS Employment Projections 2012-2022 Note: BLS forecasts are for 2022. Gray used the 2012 base and the BLS annual growth rate to estimate 2015 employment.

617.366.2838 www.GrayAssociates.com 24
GRAY For more information please contact Gray Associates. Email: [email protected]
Job Postings Are Quite Consistent Over Time
New Job Postings in 2012 were a better predictor.
-
250,000
500,000
750,000
1,000,000
1,250,000
1,500,000
- 250,000 500,000 750,000
2015-16 New Job Postings
2012-13 New Job Postings
New Job Postings By 8-Digit SOC*
Home Health Aides
Stock Clerks and Order
Fillers
Source: WANTED Analytics. Excludes SOC 53-3032.00 Commercial Truck Drivers.

617.366.2838 www.GrayAssociates.com 25
GRAY For more information please contact Gray Associates. Email: [email protected]
Monthly New Job Postings for Securities Traders
Some fields are quite volatile; these postings have limited predictive value.
New Job Postings
New Job Postings Securities and Commodities Traders
2012-2016
Source: WANTED Analytics. SOC 41-3031.03 Securities and Commodities Traders.

617.366.2838 www.GrayAssociates.com 26
GRAY For more information please contact Gray Associates. Email: [email protected]
Monthly New Job Postings for Registered Nurses
Some occupations have had essentially straight-line growth trends. Postings in these fields would be highly predictive.
New Job Postings Registered Nurses
2012-2016
New Job Postings
Source: WANTED Analytics. SOC 29-1141 Registered Nurses.

617.366.2838 www.GrayAssociates.com 27
GRAY For more information please contact Gray Associates. Email: [email protected]
Agenda
1. National Inquiry Trends
2. Inquiries and Conversions: Online vs. On-Campus Programs
3. Views by Program and Segment
4. Program Evaluation
5. SocialHP
6. Summary

Social Horse Power Webinar

PROMOTE
¬ ã
ŧ
¬ “People Spend 3X more +me on Facebook than ANY OTHER website in the world.”
� 1.844.445.1751 [email protected]

� 1.844.445.1751 [email protected]
¬ “The average smartphone user checks their Facebook account 14X a day”

� 1.844.445.1751 [email protected]
¬ “72% of high school students are now using social media to research colleges and universi+es before applying”
DID YOU KNOW?
� 1.844.445.1751 [email protected]
DID YOU KNOW? In Academic Impressions’ 2013 survey on enrolment declines, 47% of the 190 institutions participating in the survey missed their enrolment targets last year—many by a significant percentage.
� 1.844.445.1751 [email protected]
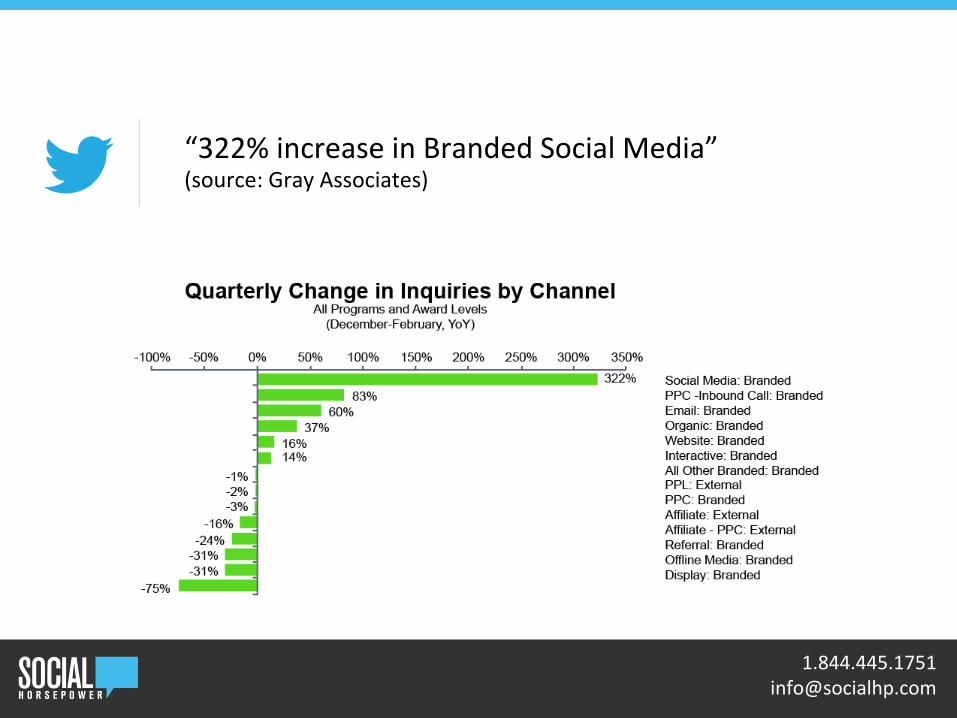
¬ “322% increase in Branded Social Media” (source: Gray Associates)
� 1.844.445.1751 [email protected]
¬ “49% of U.S. consumers say friends and family are their top sources of brand awareness” (source: Jack Morton)
The Ultimate Guide to
Student Advocacy; An Evolution in Word-of-Mouth

Pinnacle Career Institute
Case Study

� 1.844.445.1751 [email protected]
CONTACT US Should you need to know more on Student Advocacy, reach out to us directly:
I Need Employee Advocacy NOW
Call 1.844.445.1751
Sounds Interes+ng, I’d Like To Book A Demo
Get A 25% Discount! Use Promo Code:
Gray11

617.366.2838 www.GrayAssociates.com 38
GRAY For more information please contact Gray Associates. Email: [email protected]
Agenda
1. National Inquiry Trends
2. Inquiries and Conversions: Online vs. On-Campus Programs
3. Views by Program and Segment
4. Program Evaluation
5. SocialHP
6. Summary

617.366.2838 www.GrayAssociates.com 39
GRAY For more information please contact Gray Associates. Email: [email protected]
Key Demand Trends and Observations
March generally underperformed.
§ Inquiry volumes fell 10%. ─ Branded down 10% ─ Online down 5% ─ On-campus down 7%
§ Conversions are down 7%. ─ However, online conversions were up 12% in December. ─ It is too early to tell if January of 2016 will reach last year’s levels.
§ Prices are up year-over-year, but down from last month’s new high. § Several large programs are growing. § Higher degree levels continue to outperform. § Better data and systems are available to support your decisions. ─ Where to focus your marketing—by program and market ─ What programs to Stop, Start, Sustain or Grow
617.366.2838 www.GrayAssociates.com 40
GRAY For more information please contact Gray Associates. Email: [email protected]
Questions and Contacts
Please feel free to contact: Bob Atkins
CEO Gray Associates, Inc.
@Gray_Associates 617.366.2836

617.366.2838 www.GrayAssociates.com 41
GRAY For more information please contact Gray Associates. Email: [email protected]
Upcoming Gray Associates’ Webinars
Please join us next month!
May Webinar (April Results)
Thursday, May 26th at 2:00 PM EDT