2015 July GrayReports - Student Demand Trends
33
GRAYREPORTS Demand for Educational Programs www.GrayAssociates.com Results through July 2015
-
Upload
gray-associates-inc -
Category
Education
-
view
281 -
download
0
Transcript of 2015 July GrayReports - Student Demand Trends

GRAYREPORTS Demand for Educational Programs
www.GrayAssociates.com
Results through July 2015
617.366.2838 www.GrayAssociates.com 2
GRAY For more information please contact Gray Associates. Email: [email protected]
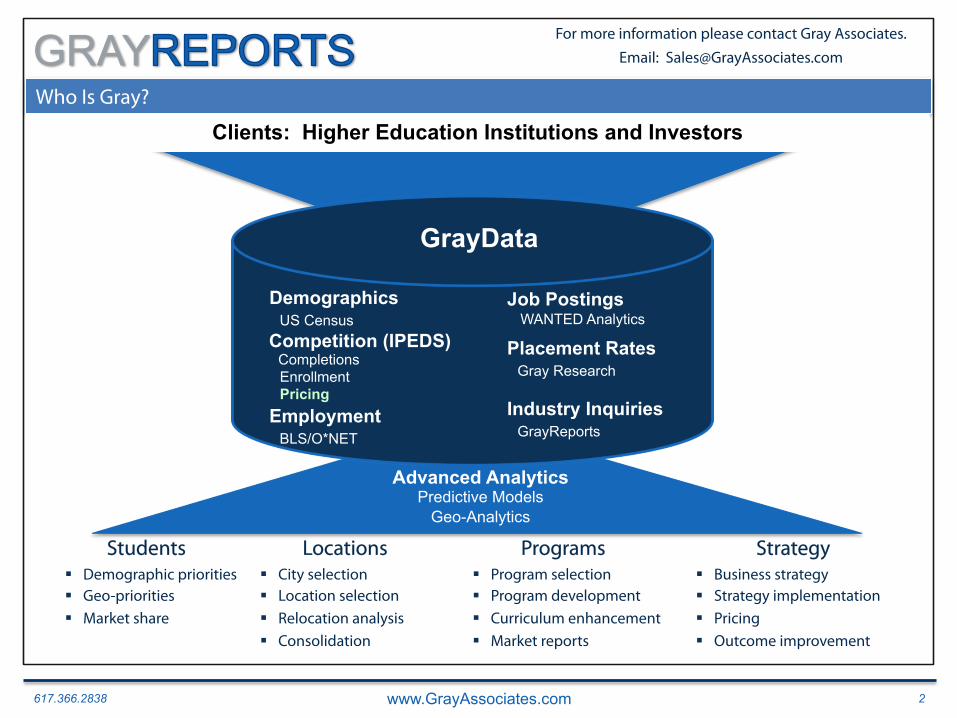
Who Is Gray?
GrayData
Completions
Enrollment Pricing Employment BLS/O*NET
Placement Rates Gray Research
Industry Inquiries GrayReports
Demographics US Census
Job Postings WANTED Analytics
Students Programs Strategy Locations § Demographic priorities § Geo-priorities § Market share
§ City selection § Location selection § Relocation analysis § Consolidation
§ Program selection § Program development § Curriculum enhancement § Market reports
§ Business strategy § Strategy implementation § Pricing § Outcome improvement
Advanced Analytics Predictive Models
Geo-Analytics
Clients: Higher Education Institutions and Investors
Competition (IPEDS)
617.366.2838 www.GrayAssociates.com 3
GRAY For more information please contact Gray Associates. Email: [email protected]
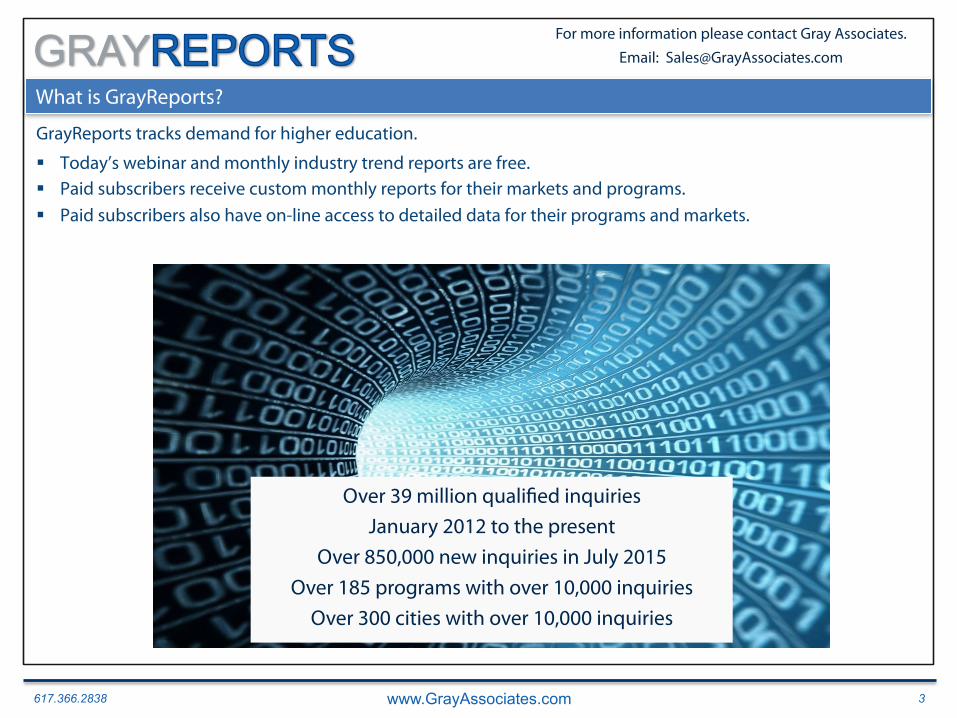
What is GrayReports?
GrayReports tracks demand for higher education.
§ Today’s webinar and monthly industry trend reports are free. § Paid subscribers receive custom monthly reports for their markets and programs. § Paid subscribers also have on-line access to detailed data for their programs and markets.
Over 39 million qualified inquiries January 2012 to the present
Over 850,000 new inquiries in July 2015 Over 185 programs with over 10,000 inquiries
Over 300 cities with over 10,000 inquiries

617.366.2838 www.GrayAssociates.com 4
GRAY For more information please contact Gray Associates. Email: [email protected]
Key Demand Trends and Observations
1. By popular request, this month we will report only on Internal Inquiries.
§ No PPI inquiries are included after the first two charts.
§ Internal inquiries are received directly by school websites, call centers, and mail.
2. In July, total demand fell 4% year-over-year. But, internal inquiries fell 18%.
3. Since 2014, internal inquiry conversion rates have fallen from 8.2 to 6%. 4. In July, year-over-year internal inquiries...
§ Fell 10% for on-line higher-education programs
§ Fell 38% for on-ground higher education programs
§ Fell for the largest programs and markets
5. Over the last three months, there were pockets of year-over-year growth: § Inquiries for programs at the Bachelor's level and higher rose over 25%. § Over this time period, on-line grew at a double-digit rate. § Sustainers continued to grow over 10%.
617.366.2838 www.GrayAssociates.com 5
GRAY For more information please contact Gray Associates. Email: [email protected]
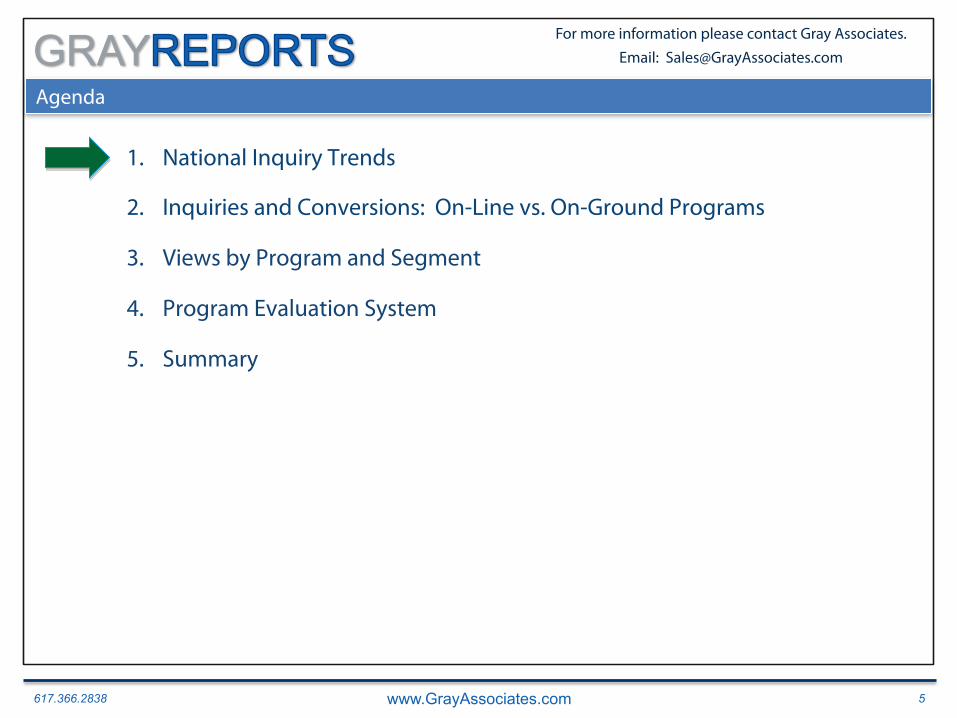
Agenda
1. National Inquiry Trends
2. Inquiries and Conversions: On-Line vs. On-Ground Programs
3. Views by Program and Segment
4. Program Evaluation System
5. Summary

617.366.2838 www.GrayAssociates.com 6
GRAY For more information please contact Gray Associates. Email: [email protected]
Overall Student Inquiries (All Sources)
Student demand for all higher-education programs continued a slight year-over-year decline.
§ Since January, year-over-year inquiry volumes have fallen every month. § For the last two months, they have fallen 4% each month.
-
200,000
400,000
600,000
800,000
1,000,000
1,200,000
Jan Feb Mar Apr May Jun Jul Aug Sep Oct Nov Dec
National Inquiries All Programs and Award Levels 2014 2015
-4% YOY

617.366.2838 www.GrayAssociates.com 7
GRAY For more information please contact Gray Associates. Email: [email protected]
Overall Student Internal and External Inquiries
§ PPI data includes data from aggregators on paid inquiries (74% of 2015 inquires). § Internal inquiries come directly to schools’ websites or call centers (26% of the 2015 inquiries). § The two are over 70% correlated (trends are similar), but external inquiries are falling faster. § This webinar will focus on internal inquiries.
-
100,000
200,000
300,000
400,000
500,000
600,000
700,000
800,000
Jan Feb Mar Apr May Jun Jul Aug Sep Oct Nov Dec
National Internal vs. External Inquiries All Programs and Award Levels Internal External
Gray captures two sources of inquiries: PPI and “internal inquiries.”
617.366.2838 www.GrayAssociates.com 8
GRAY For more information please contact Gray Associates. Email: [email protected]
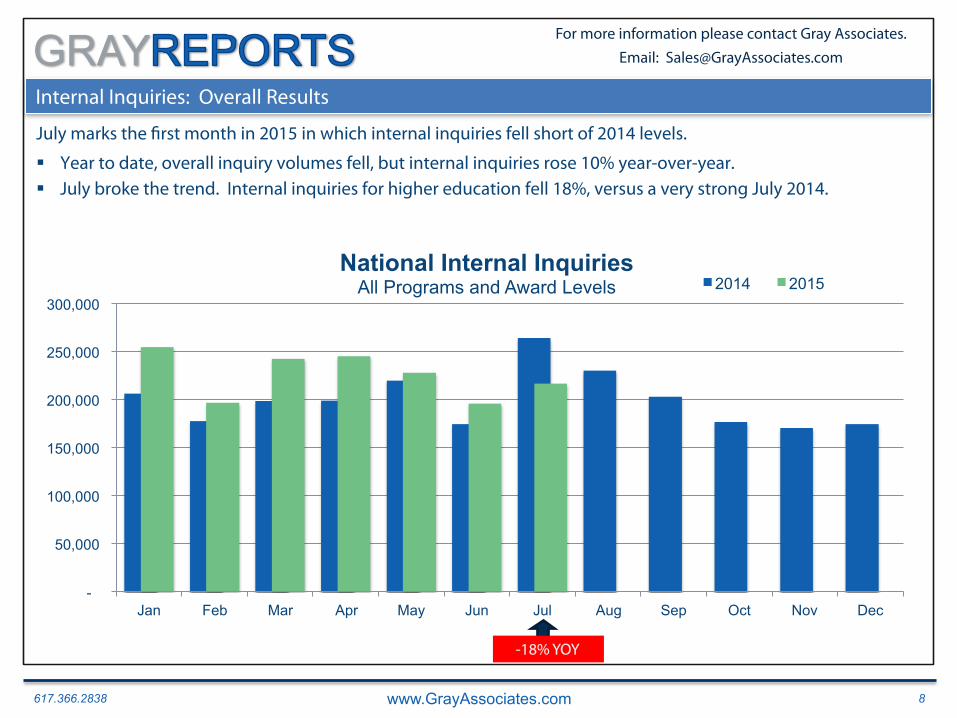
Internal Inquiries: Overall Results
July marks the first month in 2015 in which internal inquiries fell short of 2014 levels.
§ Year to date, overall inquiry volumes fell, but internal inquiries rose 10% year-over-year. § July broke the trend. Internal inquiries for higher education fell 18%, versus a very strong July 2014.
-
50,000
100,000
150,000
200,000
250,000
300,000
Jan Feb Mar Apr May Jun Jul Aug Sep Oct Nov Dec
National Internal Inquiries All Programs and Award Levels 2014 2015
-18% YOY
617.366.2838 www.GrayAssociates.com 9
GRAY For more information please contact Gray Associates. Email: [email protected]
1. Applications are counted in the month in which the inquiry was received (i.e., an inquiry that is received in January and converts in March will be counted as a January inquiry). Typically, the application rate will rise for at least three months after the month in which the inquiries were received.
9.3%
8.0%
9.1%
8.3%
8.5%
8.8%
6.3%
8.1%
8.2%
9.7%
6.4%
7.4%
6.8%
6.0%
5.7%
5.3%
5.3%
5.1%
3.9%
0.0%
2.0%
4.0%
6.0%
8.0%
10.0%
12.0%
Jan Feb Mar Apr May Jun Jul Aug Sep Oct Nov Dec
Education Industry Internal Inquiry Conversion Rates 2014 2015
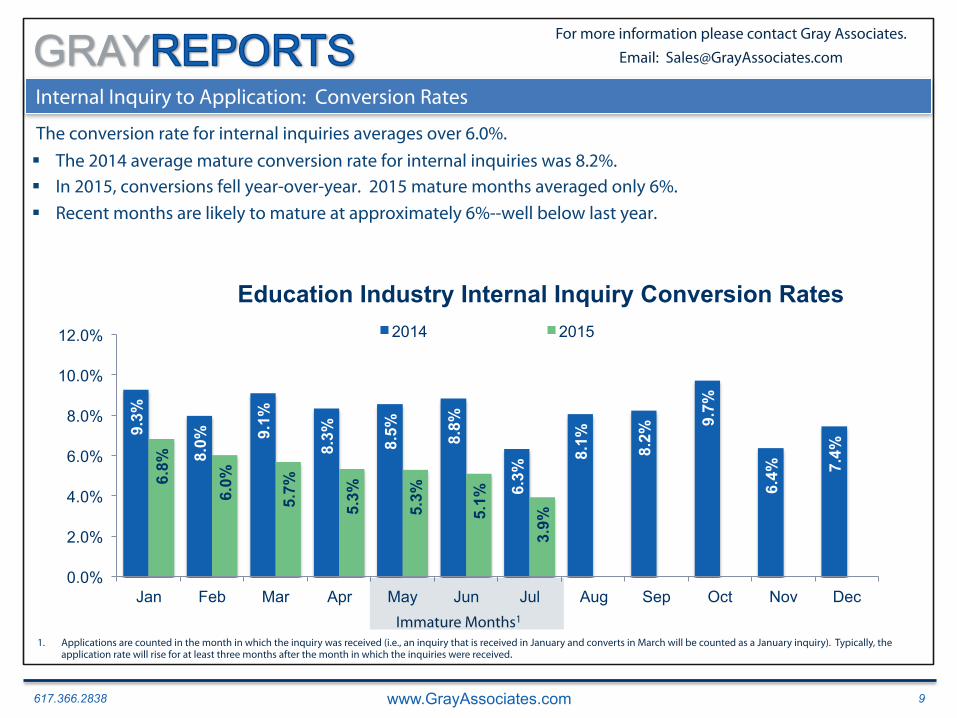
Internal Inquiry to Application: Conversion Rates
The conversion rate for internal inquiries averages over 6.0%. § The 2014 average mature conversion rate for internal inquiries was 8.2%. § In 2015, conversions fell year-over-year. 2015 mature months averaged only 6%. § Recent months are likely to mature at approximately 6%--well below last year.
Immature Months1

617.366.2838 www.GrayAssociates.com 10
GRAY For more information please contact Gray Associates. Email: [email protected]
Agenda
1. National Inquiry Trends
2. Inquiries and Conversions: On-Line vs. On-Ground Programs
3. Views by Program and Segment
4. Program Evaluation System
5. Summary
617.366.2838 www.GrayAssociates.com 11
GRAY For more information please contact Gray Associates. Email: [email protected]
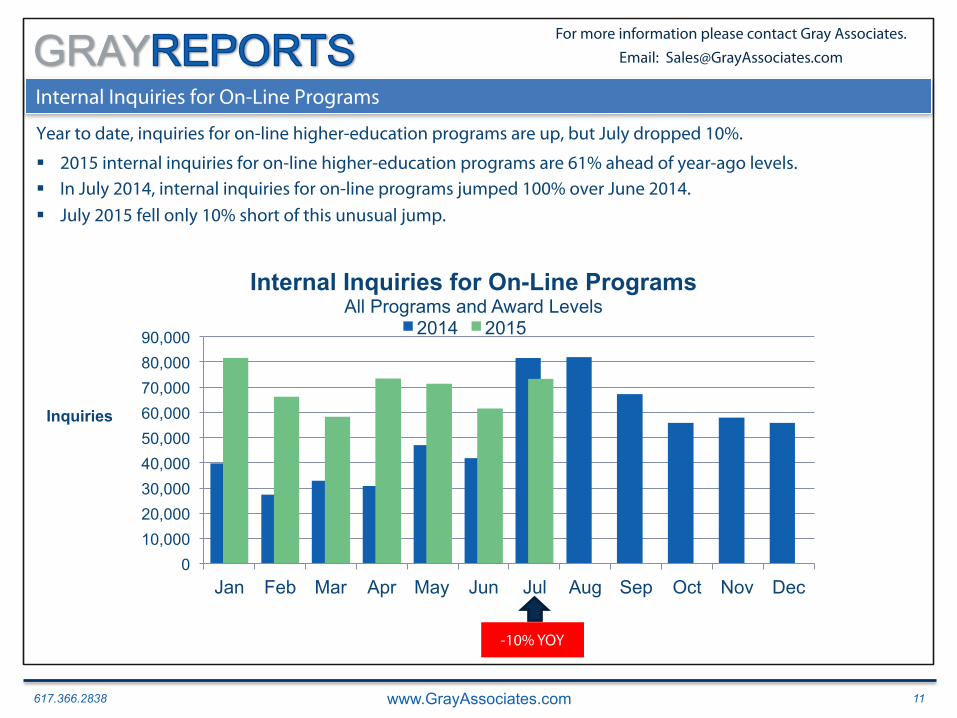
Internal Inquiries for On-Line Programs Education Industry Inquiries: YOY Percent Change Year to date, inquiries for on-line higher-education programs are up, but July dropped 10%.
§ 2015 internal inquiries for on-line higher-education programs are 61% ahead of year-ago levels. § In July 2014, internal inquiries for on-line programs jumped 100% over June 2014. § July 2015 fell only 10% short of this unusual jump.
0 10,000 20,000 30,000 40,000 50,000 60,000 70,000 80,000 90,000
Jan Feb Mar Apr May Jun Jul Aug Sep Oct Nov Dec
Inquiries
Internal Inquiries for On-Line Programs All Programs and Award Levels
2014 2015
-10% YOY

617.366.2838 www.GrayAssociates.com 12
GRAY For more information please contact Gray Associates. Email: [email protected]
Student Internal Inquiry Conversions for On-Line Programs
So far in 2015, conversions of internal inquiries for on-line programs consistently surpassed 2014 levels.
§ All mature months in 2015 exceeded 2014 conversions. But, May might break this trend. § The summer of 2014 had very strong conversion volumes; 2015 may not meet these levels.
1. Applications are counted in the month in which the inquiry was received (i.e., an inquiry that is received in January and converts in March will be counted as a January inquiry). Typically, the application rate will rise for at least three months after the month in which the inquiries were received.
0 500
1,000 1,500 2,000 2,500 3,000 3,500 4,000 4,500 5,000
Jan Feb Mar Apr May Jun Jul Aug Sep Oct Nov Dec
Internal Inquiry Conversions for On-Line Programs All Programs and Award Levels
2014 2015
Immature Months1

617.366.2838 www.GrayAssociates.com 13
GRAY For more information please contact Gray Associates. Email: [email protected]
Internal Inquiries for On-Ground Programs
Since February, internal inquiries for on-campus higher-education programs are down year-over-year.
§ January and February beat 2014 results. § Since May, results have dropped well below 2014. § July 2015 inquiries for on-ground programs fell almost 40% year-over-year.
2012
0 20,000 40,000 60,000 80,000
100,000 120,000 140,000 160,000
Jan Feb Mar Apr May Jun Jul Aug Sep Oct Nov Dec
Inquiries
Internal Inquiries for On-Ground Programs All Programs and Award Levels
2014 2015
-38% YOY
617.366.2838 www.GrayAssociates.com 14
GRAY For more information please contact Gray Associates. Email: [email protected]
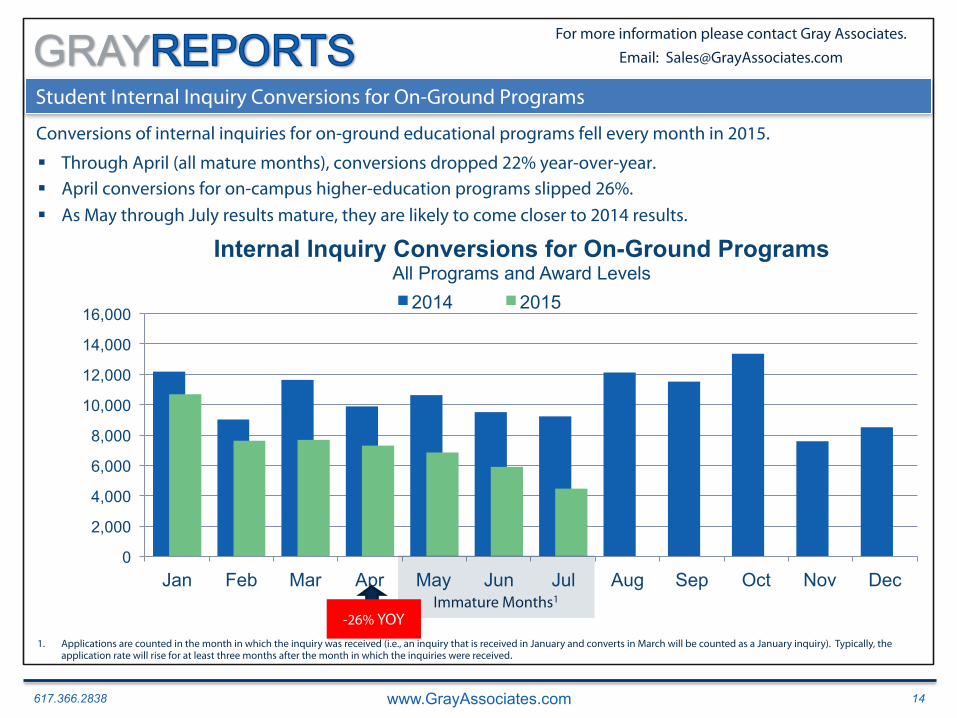
Conversions of internal inquiries for on-ground educational programs fell every month in 2015. § Through April (all mature months), conversions dropped 22% year-over-year. § April conversions for on-campus higher-education programs slipped 26%. § As May through July results mature, they are likely to come closer to 2014 results.
0
2,000
4,000
6,000
8,000
10,000
12,000
14,000
16,000
Jan Feb Mar Apr May Jun Jul Aug Sep Oct Nov Dec
Internal Inquiry Conversions for On-Ground Programs All Programs and Award Levels
2014 2015
Immature Months1
Student Internal Inquiry Conversions for On-Ground Programs
1. Applications are counted in the month in which the inquiry was received (i.e., an inquiry that is received in January and converts in March will be counted as a January inquiry). Typically, the application rate will rise for at least three months after the month in which the inquiries were received.
-26% YOY

617.366.2838 www.GrayAssociates.com 15
GRAY For more information please contact Gray Associates. Email: [email protected]
Agenda
1. National Inquiry Trends
2. Inquiries and Conversions: On-Line vs. On-Ground Programs
3. Views by Program and Segment
4. Program Evaluation System
5. Summary
617.366.2838 www.GrayAssociates.com 16
GRAY For more information please contact Gray Associates. Email: [email protected]
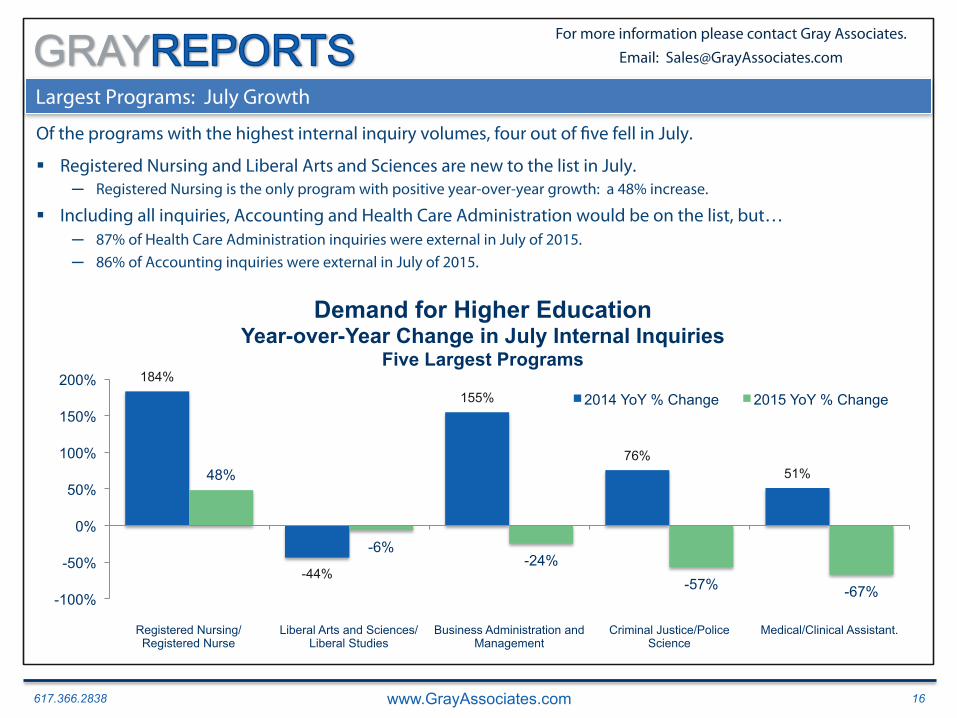
Largest Programs: July Growth
Of the programs with the highest internal inquiry volumes, four out of five fell in July.
§ Registered Nursing and Liberal Arts and Sciences are new to the list in July. ─ Registered Nursing is the only program with positive year-over-year growth: a 48% increase.
§ Including all inquiries, Accounting and Health Care Administration would be on the list, but… ─ 87% of Health Care Administration inquiries were external in July of 2015. ─ 86% of Accounting inquiries were external in July of 2015.
184%
-44%
155%
76% 51% 48%
-6% -24%
-57% -67% -100%
-50%
0%
50%
100%
150%
200%
Registered Nursing/Registered Nurse
Liberal Arts and Sciences/Liberal Studies
Business Administration and Management
Criminal Justice/Police Science
Medical/Clinical Assistant.
Demand for Higher Education Year-over-Year Change in July Internal Inquiries
Five Largest Programs
2014 YoY % Change 2015 YoY % Change

617.366.2838 www.GrayAssociates.com 17
GRAY For more information please contact Gray Associates. Email: [email protected]
95% 88%
19%
184%
13%
182%
98%
80%
48% 44%
0%
20%
40%
60%
80%
100%
120%
140%
160%
180%
200%
Education Medical Insurance Coding Specialist
Psychology Registered Nursing Business/Commerce
Year-over-Year Change in July Internal Inquiries Five Fastest-Growing Programs
2014 YoY % Change 2015 YoY % Change
The 5 Fastest-Growing Programs in July – Internal Inquiries
Education tops the list of the fastest-growing programs in higher education.
§ All 5 educational programs grew at least 40% year-over-year.
1. Includes only the top 75 programs (ranked on total inquiry volume since January 2012). Minimum of 1,000 internal inquiries in 2014.

617.366.2838 www.GrayAssociates.com 18
GRAY For more information please contact Gray Associates. Email: [email protected]
Internal Inquiries: Largest Cities
Phoenix replaced Atlanta on the list of cities with the most student demand for higher education. § Internal inquiries for higher education programs dropped over 25% in all 5 cities. § Los Angeles was hit the hardest. It had a 76% year-over-year decline in internal inquiries.
78%
56%
90%
42%
97%
-29% -34% -41% -43%
-76% -80%
-60%
-40%
-20%
0%
20%
40%
60%
80%
100%
120%
New York, NY Phoenix, AZ Chicago, IL Philadelphia, PA Los Angeles CA
Year-over-Year Change in July Internal Inquiries Top Five Cities for Inquiries
2014 YoY % Change 2015 YoY % Change
Note: The market for each city is defined as a 15-mile radius around the population center of its CBSA.

617.366.2838 www.GrayAssociates.com 19
GRAY For more information please contact Gray Associates. Email: [email protected]
Fastest-Growing Cities for All Internal Inquiries
Five new cities joined the “fastest-growing” list, with Miami, FL winning first place.
§ Even the “fast-growing” cities were down 15% or more. § Only Miami, FL and Columbus, OH beat the average decline of 18%.
1. Includes only the top 75 cities by inquiry volume since January 2012. Data includes a 15-mile radius from the center of the CBSA.
22%
69%
112%
62%
39%
-15% -17% -21% -23% -24% -40%
-20%
0%
20%
40%
60%
80%
100%
120%
140%
Miami, FL Columbus, OH Charlotte, NC Cleveland, OH Memphis, TN
Year-over-Year Change in July Internal Inquiries Five Fastest-Growing Cities for All Inquiries 2014 YoY % Change 2015 YoY % Change

617.366.2838 www.GrayAssociates.com 20
GRAY For more information please contact Gray Associates. Email: [email protected]
-31%
-31%
-27%
-21%
21%
27%
66%
120%
275%
-35% 15% 65% 115% 165% 215% 265%
Ground
Certificate
Associate's
Unknown Degree
Online
Bachelor's
Unknown Modality
Master's
Doctorate
Year-over-Year Percentage Change in Internal Inquiries 2014 vs. 2015 (May – July)
Internal Inquiry Volumes by Category – Trailing 3 Months
Internal inquiry volumes are rising for higher degrees levels—and dropping for Associate’s and below.
§ On-line internal inquiry volumes for educational programs are up 21% year-over-year for May-July. § Internal inquiries for lower-level degrees and on-ground campuses fell over 20%.
Monthly Average
617.366.2838 www.GrayAssociates.com 21
GRAY For more information please contact Gray Associates. Email: [email protected]
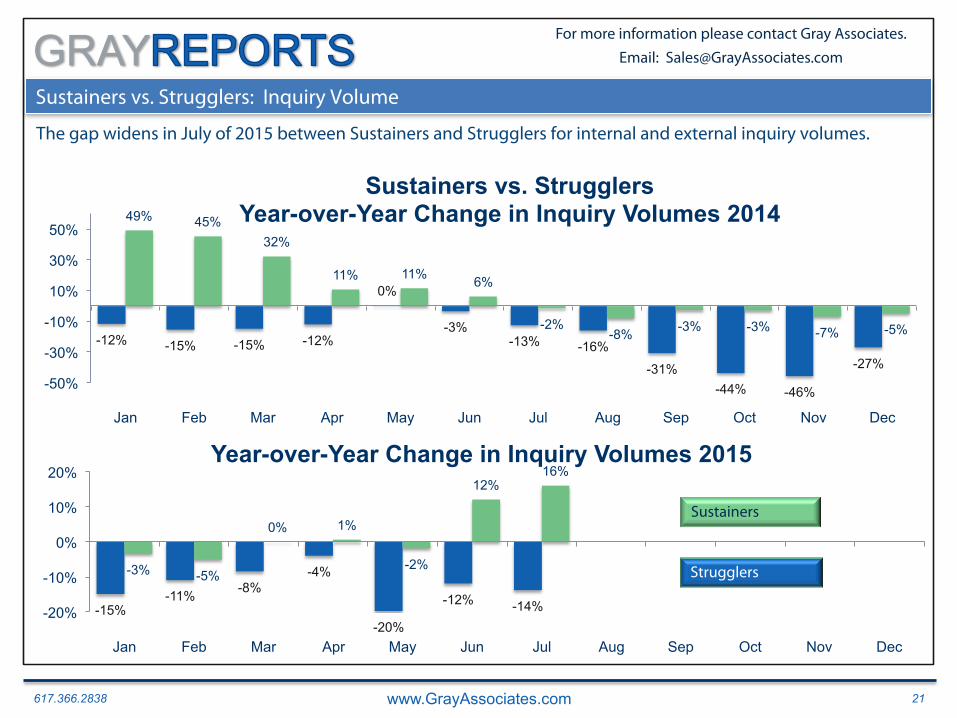
Sustainers vs. Strugglers: Inquiry Volume
The gap widens in July of 2015 between Sustainers and Strugglers for internal and external inquiry volumes.
-12% -15% -15% -12%
0%
-3% -13% -16%
-31% -44% -46%
-27%
49% 45% 32%
11% 11% 6%
-2% -8% -3% -3% -7% -5%
-50%
-30%
-10%
10%
30%
50%
Jan Feb Mar Apr May Jun Jul Aug Sep Oct Nov Dec
Sustainers vs. Strugglers Year-over-Year Change in Inquiry Volumes 2014
-15% -11% -8%
-4%
-20%
-12% -14%
-3% -5%
0% 1%
-2%
12% 16%
-20%
-10%
0%
10%
20%
Jan Feb Mar Apr May Jun Jul Aug Sep Oct Nov Dec
Year-over-Year Change in Inquiry Volumes 2015
Strugglers
Sustainers

617.366.2838 www.GrayAssociates.com 22
GRAY For more information please contact Gray Associates. Email: [email protected]
Agenda
1. National Inquiry Trends
2. Inquiries and Conversions: On-Line vs. On-Ground Programs
3. Views by Program and Segment
4. Program Evaluation System
5. Summary

617.366.2838 www.GrayAssociates.com 23
GRAY For more information please contact Gray Associates. Email: [email protected]
What is the Program Evaluator?
The Gray system enables you to make fast, informed program decisions by campus or market.
What Programs Should We Stop, Start, Sustain, or Grow?
§ The system evaluates 800 IPEDS programs in each of your markets. § The system has broad, deep and unique data on programs (see below). § It allows you to explore trends—such as fast-growing programs, or high employer demand. § It provides capabilities, such as heat maps, you can use to inform marketing and other decisions.
GrayData
Completions
Enrollment Pricing Employment BLS/O*NET
Placement Rates Gray Research
Industry Inquiries GrayReports
Demographics US Census
Job Postings
Competition (IPEDS)
To come

617.366.2838 www.GrayAssociates.com 24
GRAY For more information please contact Gray Associates. Email: [email protected]
How does the Gray system work?
We work with you to establish custom markets and scoring that reflect your priorities.
§ Your custom system will enable you to select: ─ Specific Programs (e.g., Medical Assisting) or groups of programs (e.g., Allied Health) ─ Specific markets or campuses ─ Custom distances around your campuses or cities to capture the market you serve.
Sample selections:

617.366.2838 www.GrayAssociates.com 25
GRAY For more information please contact Gray Associates. Email: [email protected]
The Gray System Capabilities
Data by Program and Market
§ Users will have the ability to view and download all of the data for any program in any market. § Users can also sort the data by any metric. § For example, you could sort by inquiries or inquiry growth to see which programs are large or growing in a
given market.
617.366.2838 www.GrayAssociates.com 26
GRAY For more information please contact Gray Associates. Email: [email protected]
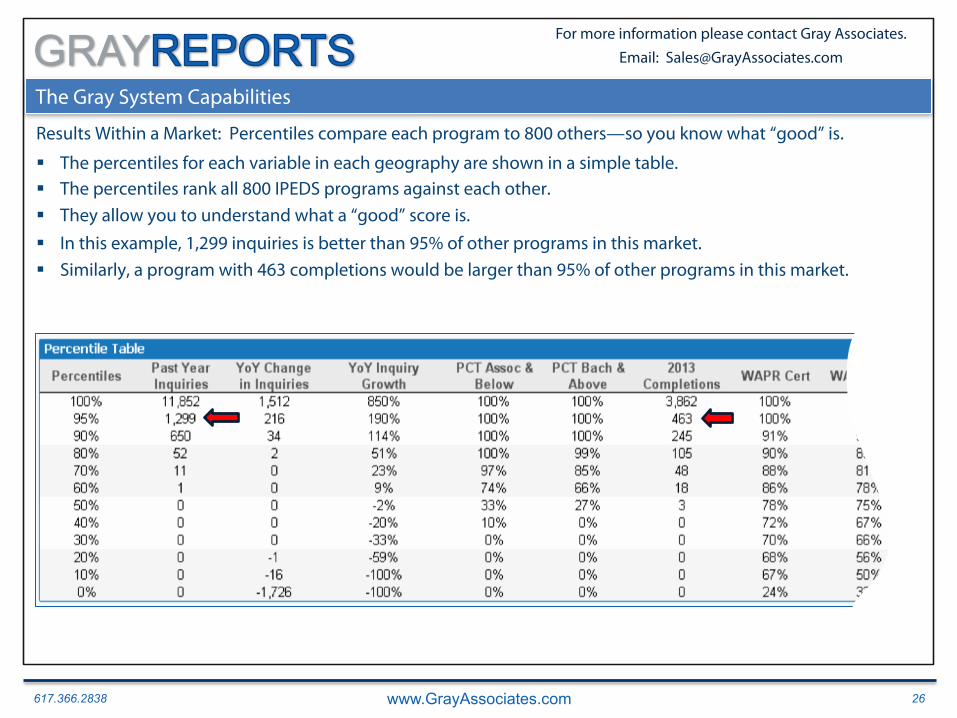
The Gray System Capabilities
Results Within a Market: Percentiles compare each program to 800 others—so you know what “good” is.
§ The percentiles for each variable in each geography are shown in a simple table. § The percentiles rank all 800 IPEDS programs against each other. § They allow you to understand what a “good” score is. § In this example, 1,299 inquiries is better than 95% of other programs in this market. § Similarly, a program with 463 completions would be larger than 95% of other programs in this market.

617.366.2838 www.GrayAssociates.com 27
GRAY For more information please contact Gray Associates. Email: [email protected]
The Gray System Capabilities
Program Scorecards summarize the results for each program and incorporate your custom scoring.
§ The Program Scorecard shows the results for over 20 variables in the selected market. § For example, it shows the number of inquiries, the percentile rank, and your score.

617.366.2838 www.GrayAssociates.com 28
GRAY For more information please contact Gray Associates. Email: [email protected]
The Gray System Capabilities
Scores by Program and Market allow you to decide where to “Stop, Start, Sustain, or Grow” a program.
§ This matrix allows users to compare all program scores across all of your markets.

617.366.2838 www.GrayAssociates.com 29
GRAY For more information please contact Gray Associates. Email: [email protected]
The Gray System Capabilities
Heat Maps allow you to visualize demand and other variables within a market.

617.366.2838 www.GrayAssociates.com 30
GRAY For more information please contact Gray Associates. Email: [email protected]
Agenda
1. National Inquiry Trends
2. Inquiries and Conversions: On-Line vs. On-Ground Programs
3. Views by Program and Segment
4. Program Evaluation System
5. Summary
617.366.2838 www.GrayAssociates.com 31
GRAY For more information please contact Gray Associates. Email: [email protected]
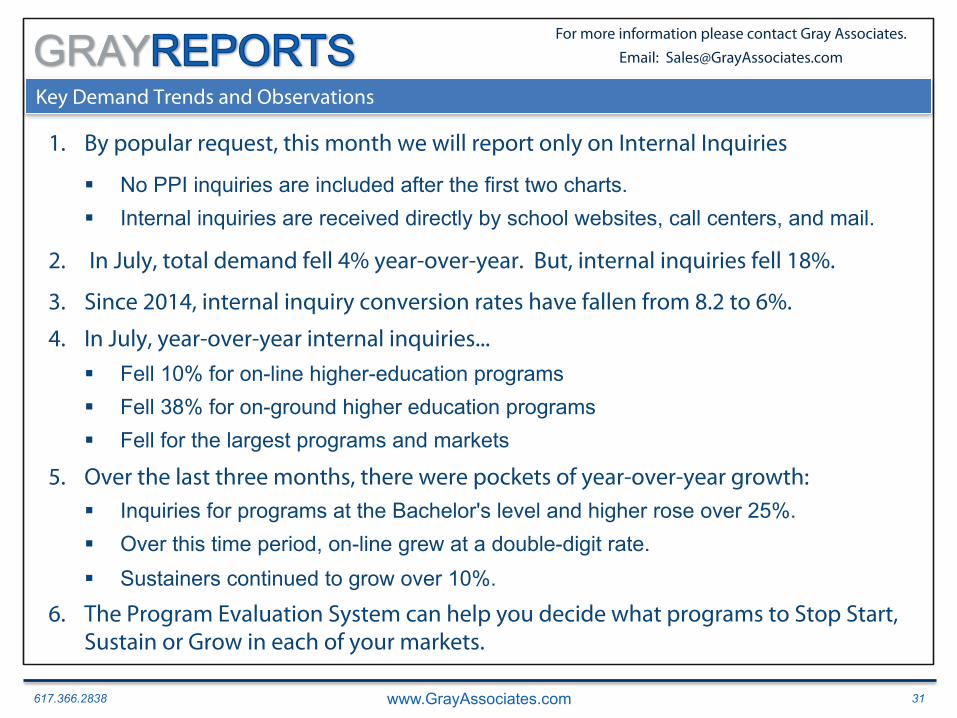
Key Demand Trends and Observations
1. By popular request, this month we will report only on Internal Inquiries
§ No PPI inquiries are included after the first two charts. § Internal inquiries are received directly by school websites, call centers, and mail.
2. In July, total demand fell 4% year-over-year. But, internal inquiries fell 18%.
3. Since 2014, internal inquiry conversion rates have fallen from 8.2 to 6%. 4. In July, year-over-year internal inquiries...
§ Fell 10% for on-line higher-education programs § Fell 38% for on-ground higher education programs § Fell for the largest programs and markets
5. Over the last three months, there were pockets of year-over-year growth: § Inquiries for programs at the Bachelor's level and higher rose over 25%. § Over this time period, on-line grew at a double-digit rate. § Sustainers continued to grow over 10%.
6. The Program Evaluation System can help you decide what programs to Stop Start, Sustain or Grow in each of your markets.

617.366.2838 www.GrayAssociates.com 32
GRAY For more information please contact Gray Associates. Email: [email protected]
Upcoming Gray Associates’ Webinars
Please join us next month!
September Webinar (August Results)
Wednesday, September 23rd at 2:00 PM EDT
617.366.2838 www.GrayAssociates.com 33
GRAY For more information please contact Gray Associates. Email: [email protected]
Questions and Contacts
Please feel free to contact: Bob Atkins
CEO Gray Associates, Inc.
617-366-2836