2014 November GrayReports - Student Demand Trends
31
GRAYREPORTS Demand for Educational Programs www.GrayAssociates.com Results through November 2014
-
Upload
gray-associates-inc -
Category
Education
-
view
55 -
download
1
Transcript of 2014 November GrayReports - Student Demand Trends

GRAYREPORTS Demand for Educational Programs
www.GrayAssociates.com
Results through November 2014

617.401.7662 www.GrayAssociates.com 2
GRAY For more information please contact Bob Atkins. Email: [email protected]
Who Is Gray?
GrayData
Completions IPEDS
Employment BLS/O*NET
Placement Rates Gray Research
Industry Inquiries GrayReports
Demographics US Census
Job Postings WANTED Analytics
Students Programs Strategy Locations § Demographic
priorities § Geo-priorities § Market share
§ City selection § Location selection § Relocation analysis § Consolidation
§ Program selection § Program development § Curriculum enhancement § Market reports
§ Business strategy § Strategy implementation § Pricing § Outcome improvement
Advanced Analytics Predictive Models
Geo-Analytics
Clients: Education Institutions and Investors Mission
Help clients do well by doing good

617.401.7662 www.GrayAssociates.com 3
GRAY For more information please contact Bob Atkins. Email: [email protected]
What is GrayReports?
Your access to information on demand and marketing trends in higher education § Overall industry trends, which we will review today § For subscribers we offer
─ Customized monthly reports for your specific programs and markets ─ On-Line access to detailed data for specific programs and markets
Over 34 million qualified inquiries January 2012 to the present
Over 650,000 new inquiries in November 2014 Over 185 programs with over 10,000 inquiries
Over 300 cities with over 10,000 inquiries

617.401.7662 www.GrayAssociates.com 4
GRAY For more information please contact Bob Atkins. Email: [email protected]
Key Demand Trends and Observations
1. Inquiries fell sharply, especially for online programs
2. Conversions declined for on-line, but on-ground programs are flat or up
3. There appears to be a “flight to quality:” conversion rates are up. - Higher-priced inquiries - More internally-generated inquiries - More complete inquiries
4. The market is bifurcating
- Struggling institutions are dropping fast - Sustainers are holding their own—or better

617.401.7662 www.GrayAssociates.com 5
GRAY For more information please contact Bob Atkins. Email: [email protected]
Agenda
1. National Inquiry Trends
2. Inquiries for On-Line Programs
3. Inquiries for On-Ground Programs
4. Internal and External Inquiries
5. Biggest and Fastest-Growing Programs and Markets
6. Variations by Segment
7. Summary
617.401.7662 www.GrayAssociates.com 6
GRAY For more information please contact Bob Atkins. Email: [email protected]
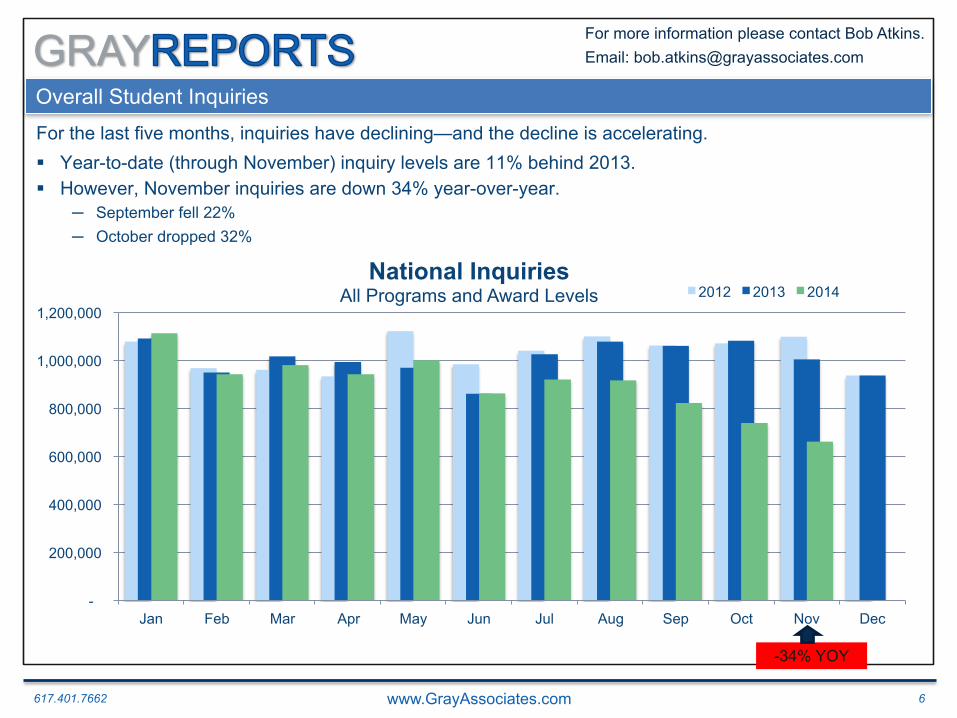
Overall Student Inquiries
For the last five months, inquiries have declining—and the decline is accelerating. § Year-to-date (through November) inquiry levels are 11% behind 2013. § However, November inquiries are down 34% year-over-year.
─ September fell 22% ─ October dropped 32%
-34% YOY
-
200,000
400,000
600,000
800,000
1,000,000
1,200,000
Jan Feb Mar Apr May Jun Jul Aug Sep Oct Nov Dec
National Inquiries All Programs and Award Levels 2012 2013 2014

617.401.7662 www.GrayAssociates.com 7
GRAY For more information please contact Bob Atkins. Email: [email protected]
1. Applications are counted in the month in which the inquiry was received (i.e., an inquiry that is received in January and converts in March will be counted as a January inquiry). Typically, the application rate will rise for at least three months after the month in which the inquiries were received.
3.0%
2.7%
3.1%
2.9%
3.0%
3.4%
3.2%
3.0%
2.7%
2.8%
2.8%
2.9%
0.0%
0.5%
1.0%
1.5%
2.0%
2.5%
3.0%
3.5%
4.0%
Jan Feb Mar Apr May Jun Jul Aug Sep Oct Nov Dec
Education Industry Inquiry Conversion Rates 2013 2014
Inquiry to Application: Conversion Rates
The decline in volume may reflect a “flight to quality:” conversion rates are up. § September and October are ahead of last year—and will further improve as they mature. § November is off to a strong start.
Immature Months1
2.9%
3.1%
1.5%

617.401.7662 www.GrayAssociates.com 8
GRAY For more information please contact Bob Atkins. Email: [email protected]
Immature Months1
0 5,000
10,000 15,000 20,000 25,000 30,000 35,000 40,000
Jan Feb Mar Apr May Jun Jul Aug Sep Oct Nov Dec
Education Industry Inquiry Conversions All Programs and Award Levels
2013 2014
Inquiry Conversions
After a 16% drop in August, the number of conversions in the November quarter will fall less than 10%. § September and October are down 12%, but they will improve a little more as they mature. § November is already at 50% of last year’s level—it may reach 2013 levels as it matures..
1. Applications are counted in the month in which the inquiry was received (i.e., an inquiry that is received in January and converts in March will be counted as a January inquiry). Typically, the application rate will rise for at least three months after the month in which the inquiries were received.
617.401.7662 www.GrayAssociates.com 9
GRAY For more information please contact Bob Atkins. Email: [email protected]
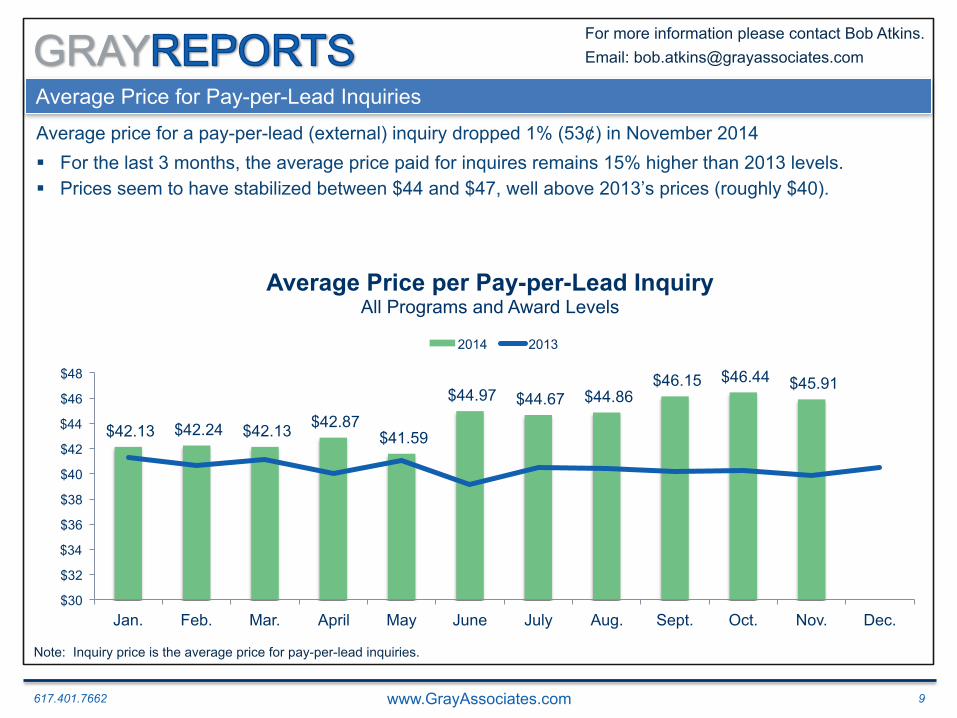
Average Price for Pay-per-Lead Inquiries
Average price for a pay-per-lead (external) inquiry dropped 1% (53¢) in November 2014 § For the last 3 months, the average price paid for inquires remains 15% higher than 2013 levels. § Prices seem to have stabilized between $44 and $47, well above 2013’s prices (roughly $40).
$42.13 $42.24 $42.13 $42.87 $41.59
$44.97 $44.67 $44.86 $46.15 $46.44 $45.91
$30
$32
$34
$36
$38
$40
$42
$44
$46
$48
Jan. Feb. Mar. April May June July Aug. Sept. Oct. Nov. Dec.
Average Price per Pay-per-Lead Inquiry All Programs and Award Levels
2014 2013
Note: Inquiry price is the average price for pay-per-lead inquiries.

617.401.7662 www.GrayAssociates.com 10
GRAY For more information please contact Bob Atkins. Email: [email protected]
Average Cost Per Converted Inquiry
Costs per conversion seems to be falling in line with 2013 levels of approximately $1,500 § September and October will be at or below 2013 levels when they mature. § November appears high now, but is likely to fall in line as it matures.
JAN FEB MAR APR MAY JUN JUL AUG SEP OCT NOV DEC 2013 1,373.56 1,528.45 1,331.70 1,394.16 1,383.94 1,147.34 1,281.60 1,338.82 1,473.66 1,422.98 1,398.36 1,397.91 2014 1,278.89 1,387.73 1,206.07 1,293.11 1,240.11 1,364.14 1,278.17 1,505.71 1,569.80 1,474.78 3,148.43
$0
$500
$1,000
$1,500
$2,000
$2,500
$3,000
$3,500 Cost Per Converted Inquiry All Programs and Award Levels

617.401.7662 www.GrayAssociates.com 11
GRAY For more information please contact Bob Atkins. Email: [email protected]
Agenda
1. National Inquiry Trends
2. Inquiries for On-Line Programs
3. Inquiries for On-Ground Programs
4. Internal and External Inquiries
5. Biggest and Fastest-Growing Programs and Markets
6. Variations by Segment
7. Summary

617.401.7662 www.GrayAssociates.com 12
GRAY For more information please contact Bob Atkins. Email: [email protected]
0 50,000
100,000 150,000 200,000 250,000 300,000 350,000 400,000 450,000
Jan Feb Mar Apr May Jun Jul Aug Sep Oct Nov Dec
Inquiries
Inquiries for On-Line Programs All Programs and Award Levels
2013
2014
Inquiries for On-Line Programs Education Industry Inquiries: YOY Percent Change November inquiries for on-line programs are 50% below year-ago levels. § Year to date, 2014 on-line inquiries are 26% behind 2013. § September, October, and November of 2014 fell to record lows—down 35% since July.
-50% YOY

617.401.7662 www.GrayAssociates.com 13
GRAY For more information please contact Bob Atkins. Email: [email protected]
Student Inquiry Conversions for On-Line Programs
On-line conversions appear to be dropping year-over-year. § September, October, and November are immature—but are unlikely to reach 2013 conversion volumes.
2012
-
2,000
4,000
6,000
8,000
10,000
12,000
Jan Feb Mar Apr May Jun Jul Aug Sep Oct Nov Dec
Inquiry Conversions for On-Line Programs All Programs and Award Levels
2013 2014
1. Applications are counted in the month in which the inquiry was received (i.e., an inquiry that is received in January and converts in March will be counted as a January inquiry). Typically, the application rate will rise for at least three months after the month in which the inquiries were received.
Immature Months1

617.401.7662 www.GrayAssociates.com 14
GRAY For more information please contact Bob Atkins. Email: [email protected]
Agenda
1. National Inquiry Trends
2. Inquiries for On-Line Programs
3. Inquiries for On-Ground Programs
4. Internal and External Inquiries
5. Biggest and Fastest-Growing Programs and Markets
6. Variations by Segment
7. Summary

617.401.7662 www.GrayAssociates.com 15
GRAY For more information please contact Bob Atkins. Email: [email protected]
Inquiries for On-Ground Programs
November inquiry volumes for on-ground programs only fell 22% year-over-year. § After a strong start in 2014, inquiry volume for on-ground programs has declined 27% since August. § November’s decline was slightly better than the 24% year-over-year drop in October.
2012
0 50,000
100,000 150,000 200,000 250,000 300,000 350,000 400,000 450,000 500,000
Jan Feb Mar Apr May Jun Jul Aug Sep Oct Nov Dec
Inquiries
Inquiries for On-Ground Programs All Programs and Award Levels
2013 2014
-22% YoY

617.401.7662 www.GrayAssociates.com 16
GRAY For more information please contact Bob Atkins. Email: [email protected]
Student Inquiry Conversions for On-Ground Programs
October conversion are already ahead of last year and November is on-track. § Year-to-date 2014 conversions are slightly ahead of 2013. § October is well ahead of last year—and will get better as it matures. § November got off to a healthy start.
2012
0 2,000 4,000 6,000 8,000
10,000 12,000 14,000 16,000 18,000 20,000
Jan Feb Mar Apr May Jun Jul Aug Sep Oct Nov Dec
Inquiry Conversions for On-Ground Programs All Programs and Award Levels 2013 2014
1. Applications are counted in the month in which the inquiry was received (i.e., an inquiry that is received in January and converts in March will be counted as a January inquiry). Typically, the application rate will rise for at least three months after the month in which the inquiries were received.
Immature Months1

617.401.7662 www.GrayAssociates.com 17
GRAY For more information please contact Bob Atkins. Email: [email protected]
Agenda
1. National Inquiry Trends
2. Inquiries for On-Line Programs
3. Inquiries for On-Ground Programs
4. Internal and External Inquiries
5. Biggest and Fastest-Growing Programs and Markets
6. Variations by Segment
7. Summary

617.401.7662 www.GrayAssociates.com 18
GRAY For more information please contact Bob Atkins. Email: [email protected]
-
2,000
4,000
6,000
8,000
10,000
12,000
14,000
16,000
18,000
20,000
Jan Feb Mar Apr May Jun Jul Aug Sep Oct Nov Dec
Conversions of External Inquiries All Programs and Award Levels 2013 2014
Conversions of External Inquiries
Conversions for pay-per-lead (external) inquiries have been weak since August. § August is now mature—and 22% below 2013. § September and October are down over 15%, but may still close the gap. § November is off to a reasonable start.
Immature Months

617.401.7662 www.GrayAssociates.com 19
GRAY For more information please contact Bob Atkins. Email: [email protected]
Conversions of Internal Inquiries
Conversions of internal inquiry are down—but less than10% § September and October still have a chance of reaching last year’s levels. § November is off to slow start.
-
5,000
10,000
15,000
20,000
25,000
Jan Feb Mar Apr May Jun Jul Aug Sep Oct Nov Dec
Conversions of Internal Inquiries All Programs and Award Levels
2013 2014

617.401.7662 www.GrayAssociates.com 20
GRAY For more information please contact Bob Atkins. Email: [email protected]
Agenda
1. National Inquiry Trends
2. Inquiries for On-Line Programs
3. Inquiries for On-Ground Programs
4. Internal and External Inquiries
5. Biggest and Fastest-Growing Programs and Markets
6. Variations by Segment
7. Summary

617.401.7662 www.GrayAssociates.com 21
GRAY For more information please contact Bob Atkins. Email: [email protected]
Largest Programs: November Growth
Four of the five largest programs had over 35% declines in inquiry volume.
§ Health Care Administration was a comparative bright spot—with 0% growth. § Criminal Justice/Police Science has declined over 70% year-over-year for two months in a row. § Medical Assisting, Business Administration, and Accounting all dropped over 35%.
-12%
9% 7% 4%
-12% 0%
-38%
-51%
-63%
-79% -90% -80% -70% -60% -50% -40% -30% -20% -10%
0% 10% 20%
Health Care Admin/Management
Medical Assisting Business Admin and Management
Accounting Criminal Justice/Police Science
Year-over-year Change in November Inquiries Five Largest Programs
2013 YoY % Change 2014 YoY % Change

617.401.7662 www.GrayAssociates.com 22
GRAY For more information please contact Bob Atkins. Email: [email protected]
Top 5 Fastest-Growing Programs in November
Game and Interactive Media Design joins the five fastest growing programs in November. § Welding Tech continues to be the fastest growing program with 429% year-over-year growth.
-9%
29%
576%
69%
153%
429%
206%
89% 36%
2%
-100%
0%
100%
200%
300%
400%
500%
600%
700%
Welding Tech Electrical, Electronic, and Comm. Tech
Health Information/Medical Records Admin
Web Page, Digital/ Multimedia Design
Game and Interactive Media Design
Year-over-Year Change in November Inquiries Five Fastest-Growing Programs
2013 YoY % Change 2014 YoY % Change
1. Includes only the top 75 programs (based on inquiry volume since January 2012)

617.401.7662 www.GrayAssociates.com 23
GRAY For more information please contact Bob Atkins. Email: [email protected]
Largest Cities for Inquiries
Inquiries in the largest cities all fell about 30%
-17%
13%
-18%
1%
-4%
-27% -29% -33% -34%
-39% -40%
-30%
-20%
-10%
0%
10%
20%
Los Angeles New York Chicago Philadelphia Atlanta
Year-over-Year Change in November Inquiries Top Five Cities for Inquiries
2013 YoY % Change 2014 YoY % Change
Note: The market for each city is defined as a 15-mile radius around the population center of its CBSA.
617.401.7662 www.GrayAssociates.com 24
GRAY For more information please contact Bob Atkins. Email: [email protected]
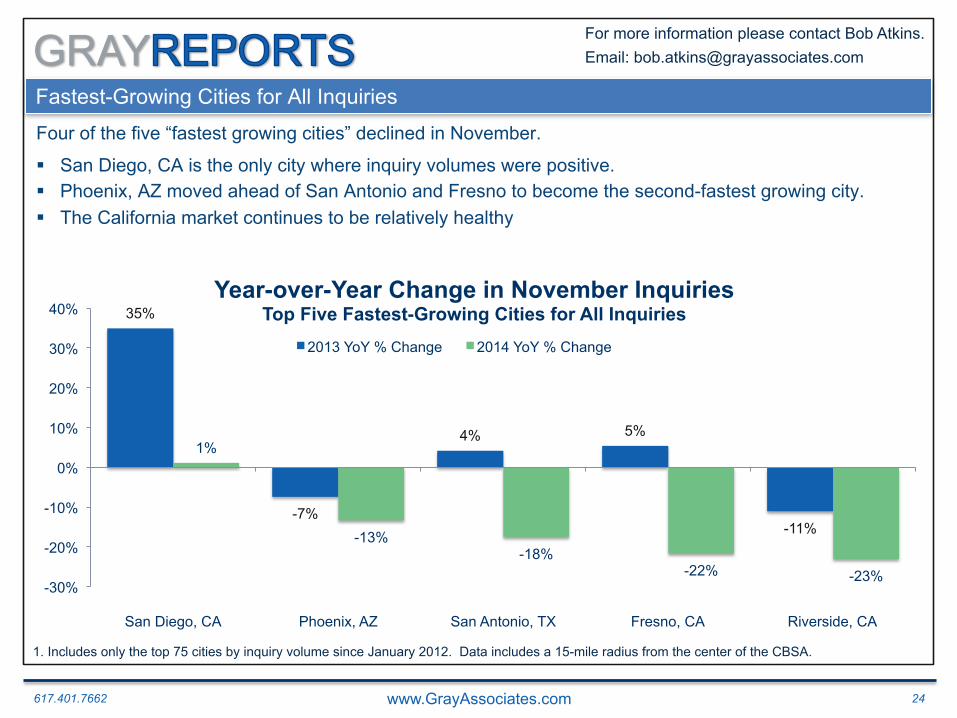
Fastest-Growing Cities for All Inquiries
Four of the five “fastest growing cities” declined in November.
§ San Diego, CA is the only city where inquiry volumes were positive. § Phoenix, AZ moved ahead of San Antonio and Fresno to become the second-fastest growing city. § The California market continues to be relatively healthy
35%
-7%
4% 5%
-11%
1%
-13% -18%
-22% -23% -30%
-20%
-10%
0%
10%
20%
30%
40%
San Diego, CA Phoenix, AZ San Antonio, TX Fresno, CA Riverside, CA
Year-over-Year Change in November Inquiries Top Five Fastest-Growing Cities for All Inquiries
2013 YoY % Change 2014 YoY % Change
1. Includes only the top 75 cities by inquiry volume since January 2012. Data includes a 15-mile radius from the center of the CBSA.

617.401.7662 www.GrayAssociates.com 25
GRAY For more information please contact Bob Atkins. Email: [email protected]
Agenda
1. National Inquiry Trends
2. Inquiries for On-Line Programs
3. Inquiries for On-Ground Programs
4. Internal and External Inquiries
5. Biggest and Fastest-Growing Programs and Markets
6. Variations by Segment
7. Summary

617.401.7662 www.GrayAssociates.com 26
GRAY For more information please contact Bob Atkins. Email: [email protected]
Sustainers vs. Strugglers: Inquiry Volume
Strugglers declined 46% year-over year in November, Sustainers only fell 10%.
-12% -15% -15% -12%
0%
-3% -13% -16%
-31%
-44% -46%
47% 44%
28%
10% 9% 7%
-6% -13%
-7% -7% -10%
-60%
-40%
-20%
0%
20%
40%
60%
Jan Feb Mar Apr May Jun Jul Aug Sep Oct Nov
Sustainers vs. Strugglers Year-over-Year Change in Inquiry Volumes
Sustainers
Strugglers

617.401.7662 www.GrayAssociates.com 27
GRAY For more information please contact Bob Atkins. Email: [email protected]
Decline in Inquiry Volumes by Category
Inquiry declines are especially high for incomplete inquiries, Online, Associates, and External (PPI). § Incomplete inquiries fell sharply, potentially indicating a “flight to quality”
- Inquiries that did not specify a degree level fell 45% - Inquires that did not have a preferred modality (on-ground vs. on-line) fell 28%
§ Graduate degrees are outperforming other categories
-11% -13%
-15% -16%
-19% -23%
-28% -33%
-39% -42%
-45%
-50% -40% -30% -20% -10% 0%
Master's Doctorate
Internal Certificate
Ground Bachelor's
Unknown Modality External
Associate's Online
Unknown Degree
Year-over-Year Percentage Change in Inquiries 2013 vs. 2014 (September – November)
% Change

617.401.7662 www.GrayAssociates.com 28
GRAY For more information please contact Bob Atkins. Email: [email protected]
Agenda
1. Introduction
2. National Inquiry Trends
3. Inquiries for On-Line Programs
4. Inquiries for On-Ground Programs
5. Internal and External Inquiries
6. Biggest and Fastest-Growing Programs and Markets
7. Variations by Segment
8. Summary

617.401.7662 www.GrayAssociates.com 29
GRAY For more information please contact Bob Atkins. Email: [email protected]
Key Findings
§ The mix of inquiries is shifting to higher quality sources, on-ground, and healthy schools.
§ As a result, conversion rates are up
- On-ground conversions remain healthy
- On-line conversion rate improvement could not offset the decline in inquiry volume
§ There are tremendous variations by city, program, and modality—you need a custom view that reflects the markets in which you compete.
617.401.7662 www.GrayAssociates.com 30
GRAY For more information please contact Bob Atkins. Email: [email protected]
Upcoming Gray Associates Webinars
GrayReports: January Webinar
(December Results)
Friday, January 23, 1:00 p.m. Eastern time
617.401.7662 www.GrayAssociates.com 31
GRAY For more information please contact Bob Atkins. Email: [email protected]
Questions and Contacts
Please feel free to contact: Bob Atkins
CEO Gray Associates, Inc.
617-401-7662
Today’s Presenter: Bob Atkins, Partner at Gray Associates