2011 September South Boston Market Update Web Version
2
SEPTEMBER 2011 MCCARTHY REPORT BUYING, SELLING OR RENTING PROPERTY IN SOUTH BOSTON PLEASE CONSIDER US FOR THIS IMPORTANT RESPONSIBILITY. Stephen McCarthy 617-320-7219 [email protected] Anne Doyle 617-794-2833 [email protected] Exclusive New Listing 821 East 6th Street #2 Just a short walk from the Sugar Bowl this is a superior new construction home in a superior location. Parking included! Asking $549,000 Find pictures, open house times and details at www.sb02127.com
-
Upload
stephen-mccarthy -
Category
Documents
-
view
116 -
download
1
description
South Boston Real Estate Market Report written by Stephen McCarthy
Transcript of 2011 September South Boston Market Update Web Version

SEPTEMBER 2011 MCCARTHY REPORT
BUYING, SELLING OR RENTING PROPERTY
IN SOUTH BOSTON PLEASE CONSIDER US
FOR THIS IMPORTANT RESPONSIBILITY.
Stephen McCarthy 617-320-7219
Anne Doyle 617-794-2833
Exclusive New Listing
821 East 6th Street #2
Just a short walk from the Sugar Bowl
this is a superior new construction home
in a superior location.
Parking included!
Asking $549,000
Find pictures, open house times and details at www.sb02127.com
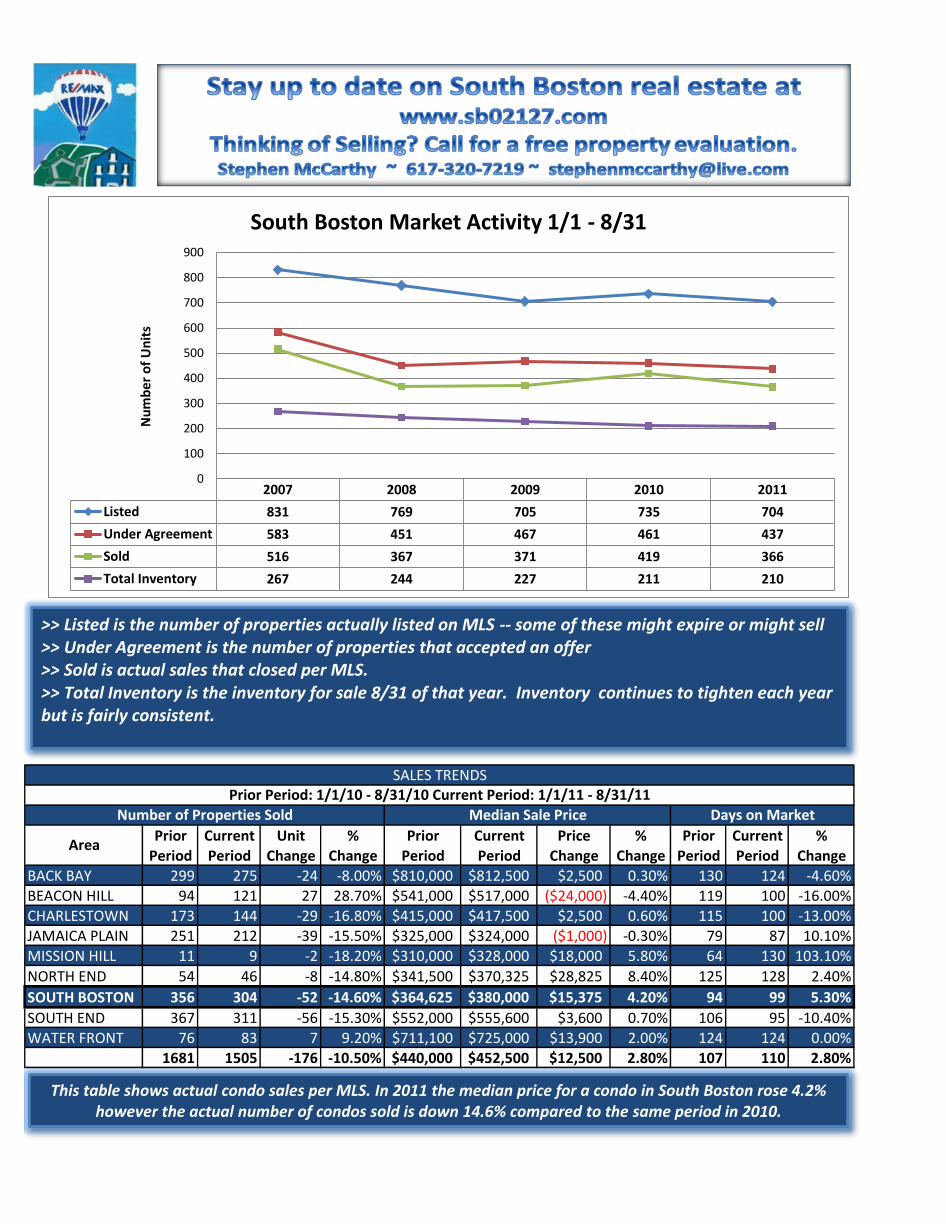
Prior Current Unit % Prior Current Price % Prior Current %
Period Period Change Change Period Period Change Change Period Period Change
BACK BAY 299 275 -24 -8.00% $810,000 $812,500 $2,500 0.30% 130 124 -4.60%
BEACON HILL 94 121 27 28.70% $541,000 $517,000 ($24,000) -4.40% 119 100 -16.00%
CHARLESTOWN 173 144 -29 -16.80% $415,000 $417,500 $2,500 0.60% 115 100 -13.00%
JAMAICA PLAIN 251 212 -39 -15.50% $325,000 $324,000 ($1,000) -0.30% 79 87 10.10%
MISSION HILL 11 9 -2 -18.20% $310,000 $328,000 $18,000 5.80% 64 130 103.10%
NORTH END 54 46 -8 -14.80% $341,500 $370,325 $28,825 8.40% 125 128 2.40%
SOUTH BOSTON 356 304 -52 -14.60% $364,625 $380,000 $15,375 4.20% 94 99 5.30%
SOUTH END 367 311 -56 -15.30% $552,000 $555,600 $3,600 0.70% 106 95 -10.40%
WATER FRONT 76 83 7 9.20% $711,100 $725,000 $13,900 2.00% 124 124 0.00%
1681 1505 -176 -10.50% $440,000 $452,500 $12,500 2.80% 107 110 2.80%
Area
SALES TRENDSPrior Period: 1/1/10 - 8/31/10 Current Period: 1/1/11 - 8/31/11
Number of Properties Sold Median Sale Price Days on Market
2007 2008 2009 2010 2011
Listed 831 769 705 735 704
Under Agreement 583 451 467 461 437
Sold 516 367 371 419 366
Total Inventory 267 244 227 211 210
0
100
200
300
400
500
600
700
800
900
Nu
mb
er
of
Un
its
South Boston Market Activity 1/1 - 8/31
This table shows actual condo sales per MLS. In 2011 the median price for a condo in South Boston rose 4.2% however the actual number of condos sold is down 14.6% compared to the same period in 2010.
>> Listed is the number of properties actually listed on MLS -- some of these might expire or might sell >> Under Agreement is the number of properties that accepted an offer >> Sold is actual sales that closed per MLS. >> Total Inventory is the inventory for sale 8/31 of that year. Inventory continues to tighten each year but is fairly consistent.