NEPOOL Participants Committee Meeting Boston, MA December 3, 2004

Update: Boston School Committee GoalsAlexandra Oliver-Dávila, Boston School Committee ChairpersonDr. Charles Grandson, Chief Equity & Strategy OfficerMonica Hogan, Senior Executive Director, Data and Accountability

Key Changes
Following the March 17 presentation of the School Committee’s goals, BSC engaged in feedback conversations with multiple stakeholders, including English Learners Task Force (ELTF), Special Education Parent Advisory Committee (SPEDPAC), Black Educators Association of Massachusetts (BEAM) and Black Student Achievement Network (BSAN), and the Opportunity & Achievement Gaps Task Force (OAGTF).
Revisions were made to the goals and values, including:● Changing the language of “Guardrails” to “Values” ● Identifying targets for each goal for each major student group● Clarifying language in the preamble to explicitly name eliminating opportunity and
achievement gaps as the primary goal● Connected each value to a commitment in the strategic plan
2


BPS will implement, with fidelity, opportunity and achievement gap-closing practices that are research-based and data-driven at the district, school, and classroom levels. Black, Latinx, and Asian students must have access to standards-aligned instruction by teachers who are trained in culturally and linguistically sustaining practices (CLSP). Students with special learning needs have a right to be educated in appropriate settings which include but are not limited to inclusive settings. English learners deserve language accessible high-quality curriculum and instruction across content areas that will allow them to reach their full potential and cultivate their native language. Native language access is critical for EL student success and demonstrates respect for the cultures and languages of our students and their families. The district’s professional learning will explicitly address these areas to ensure that educators are appropriately meeting the needs of our historically underserved student groups.
Values:Non-negotiable community values that must be honored while we pursue the goals.
Equity & Eliminating Opportunity Gaps:
Diverse & Effective Staffing:BPS will recruit and retain a highly effective, racially and linguistically diverse, culturally proficient workforce that can provide rigorous culturally and linguistically affirming inclusive curriculum and experiences that celebrate the assets of our students and provide a joyous and positive school experience.
Social, Emotional, & Physical Supports:BPS will deliver a universal Multi-Tiered System of Support that addresses the social, emotional, and physical well-being of all our students.
Student Voice & Family Engagement:BPS will leverage the cultural and linguistic wealth of students and families and honor their voices by engaging them in district and school level decision-making at the initiation of developing ideas whenever possible as our primary customers, and creating partnerships that recognize their value, assets, and needs.
Community Partnerships:BPS will work with community partners to prepare students for unlimited global and local opportunities. BPS will continue to engage key partners in decision-making in order to guide and develop coherent year-round wraparound services, learning experiences, and programming that meets the needs for all students.

Goal Language MeasureStudents will acquire strong foundational reading skills to ensure they arrive in grade 3 ready to thrive in school.
Measured by the percentage of K2 students who meet or exceed grade level expectations on the MAP Reading Fluency assessment at the end of the year.
English learners will demonstrate growth in English language proficiency.
Measured by the percentage of students who are English Learners who demonstrate a Student Growth Percentile on the ACCESS assessment of 50 or higher.
Students with disabilities will thrive and grow in appropriate settings which include but are not limited to inclusive settings.
Measured by the percentage of students with disabilities with a Student Growth Percentile (SGP) on the MCAS ELA and Math assessment of 50 or higher.
Students will be able to critically reason, discern, and demonstrate academic mastery of math, science, and literacy.
Measured by the average MCAS scaled score for 3rd-8th grade students in English Language Arts, Mathematics, and Science.
Students will graduate from high school with the agency to direct their futures.
Measured by the percentage of graduates meeting the city-wide definition of College, Career and Life Readiness.
● All goals will now have targets set for each major student group, in addition to all students:○ Black, Latinx, Asian, EL, SWD, EL SWD, Economically Disadvantaged
● The table below outlines changes to the goal language, with new language highlighted.
5
Adjustments to Goals
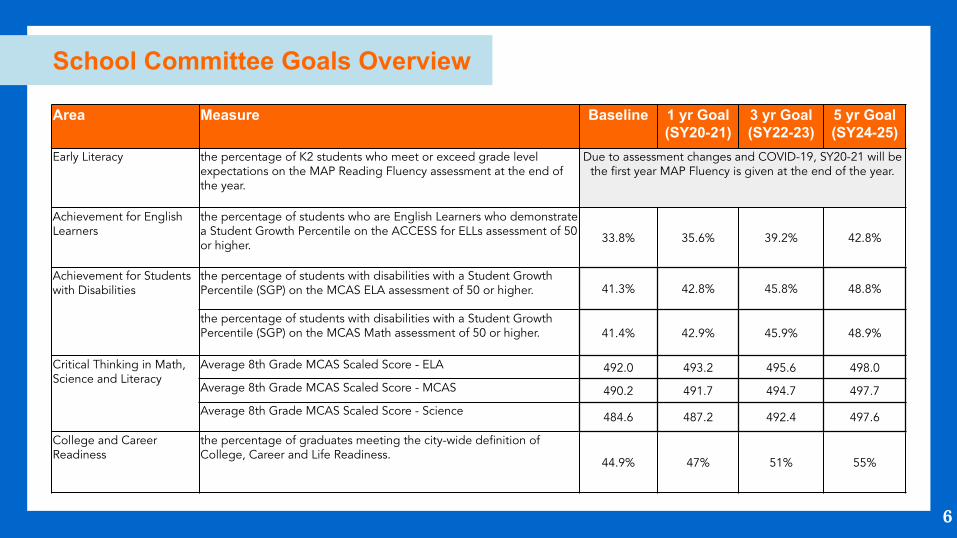
Area Measure Baseline 1 yr Goal (SY20-21)
3 yr Goal (SY22-23)
5 yr Goal (SY24-25)
Early Literacy the percentage of K2 students who meet or exceed grade level expectations on the MAP Reading Fluency assessment at the end of the year.
Due to assessment changes and COVID-19, SY20-21 will be the first year MAP Fluency is given at the end of the year.
Achievement for English Learners
the percentage of students who are English Learners who demonstrate a Student Growth Percentile on the ACCESS for ELLs assessment of 50 or higher. 33.8% 35.6% 39.2% 42.8%
Achievement for Students with Disabilities
the percentage of students with disabilities with a Student Growth Percentile (SGP) on the MCAS ELA assessment of 50 or higher. 41.3% 42.8% 45.8% 48.8%
the percentage of students with disabilities with a Student Growth Percentile (SGP) on the MCAS Math assessment of 50 or higher. 41.4% 42.9% 45.9% 48.9%
Critical Thinking in Math, Science and Literacy
Average 8th Grade MCAS Scaled Score - ELA 492.0 493.2 495.6 498.0
Average 8th Grade MCAS Scaled Score - MCAS 490.2 491.7 494.7 497.7
Average 8th Grade MCAS Scaled Score - Science 484.6 487.2 492.4 497.6
College and Career Readiness
the percentage of graduates meeting the city-wide definition of College, Career and Life Readiness.
44.9% 47% 51% 55%
6
School Committee Goals Overview

Goal 1: Students will acquire strong foundational reading skills to ensure they arrive in grade 3 ready to thrive in school.
7
Group Baseline1 Year Target
SY20-213 Year Target
SY22-235 Year Target
SY24-25All Students
Due to assessment changes and COVID-19, baseline data is not currently available for target setting.
Asian
Black
Latinx
White
EL
SWD
EL SWD
Economically Disadvantaged
Measured by the percentage of K2 students who meet or exceed grade level expectations on the MAP Reading Fluency assessment at the end of the year.

Goal 2: English learners will demonstrate growth in English language proficiency.
8
GroupBaselineSY19-20
1 Year TargetSY20-21
3 Year TargetSY22-23
5 Year TargetSY24-25
All ELs 33.8% 35.6% 39.2% 42.8%
Asian ELs 41.3% 43.1% 46.7% 50.3%
Black ELs 34.4% 36.2% 39.8% 43.4%
Latinx ELs 32.7% 34.5% 38.1% 41.7%
White ELs 30.3% 32.1% 35.7% 39.3%
EL SWD 27.4% 29.2% 32.8% 36.4%
Economically Disadvantaged ELs
34.2% 36.0% 39.6% 43.2%
Measured by the percentage of students who are English Learners who demonstrate a Student Growth Percentile on the ACCESS assessment of 50 or higher.

Measured by the percentage of students with disabilities with a Student Growth Percentile (SGP) on the MCAS ELA and Math assessment of 50 or higher.
9
GroupBaselineSY18-19
1 Year TargetSY20-21
3 Year TargetSY22-23
5 Year TargetSY24-25
All SWD 41.3% 42.8% 45.8% 48.8%
Asian SWD 44.8% 46.3% 49.3% 52.3%
Black SWD 38.9% 40.4% 43.4% 46.4%
Latinx SWD 40.5% 42.0% 45.0% 48.0%
White SWD 49.6% 51.1% 54.1% 57.1%
EL SWD 40.0% 41.5% 44.5% 47.5%
Economically Disadvantaged SWD
39.8% 41.3% 44.3% 47.3%
Goal 3: Students with disabilities will thrive and grow in appropriatesettings which include but are not limited to inclusive settings.

Goal 3: Students with disabilities will thrive and grow in appropriate settings which include but are not limited to inclusive settings.
10
GroupBaselineSY18-19
1 Year TargetSY20-21
3 Year TargetSY22-23
5 Year TargetSY24-25
All SWD 41.4% 42.9% 45.9% 48.9%
Asian SWD 50.6% 52.1% 55.1% 58.1%
Black SWD 38.7% 40.2% 43.2% 46.2%
Latinx SWD 41.8% 43.3% 46.3% 49.3%
White SWD 45.7% 47.2% 50.2% 53.2%
EL SWD 41.3% 42.8% 45.8% 48.8%
Economically Disadvantaged SWD
40.1% 41.6% 44.6% 47.6%
Measured by the percentage of students with disabilities with a Student Growth Percentile (SGP) on the MCAS ELA and Math assessment of 50 or higher.

Goal 4: Students will be able to critically reason, discern, and demonstrate academic mastery of math, science, and literacy.
11
GroupBaselineSY18-19
1 Year TargetSY20-21
3 Year TargetSY22-23
5 Year TargetSY24-25
All Students 492 493.2 495.6 498Asian 506.4 507.6 510 512.4Black 486.4 487.6 490 492.4Latinx 487.6 488.8 491.2 493.6White 507.3 508.5 510.9 513.3EL 480.3 481.5 483.9 486.3SWD 477.7 478.9 481.3 483.7EL SWD 473.9 475.1 477.5 479.9Economically Disadvantaged
486.8 488 490.4 492.8
Measured by the average MCAS scaled score for 3rd-8th grade students in English Language Arts, Mathematics, and Science.
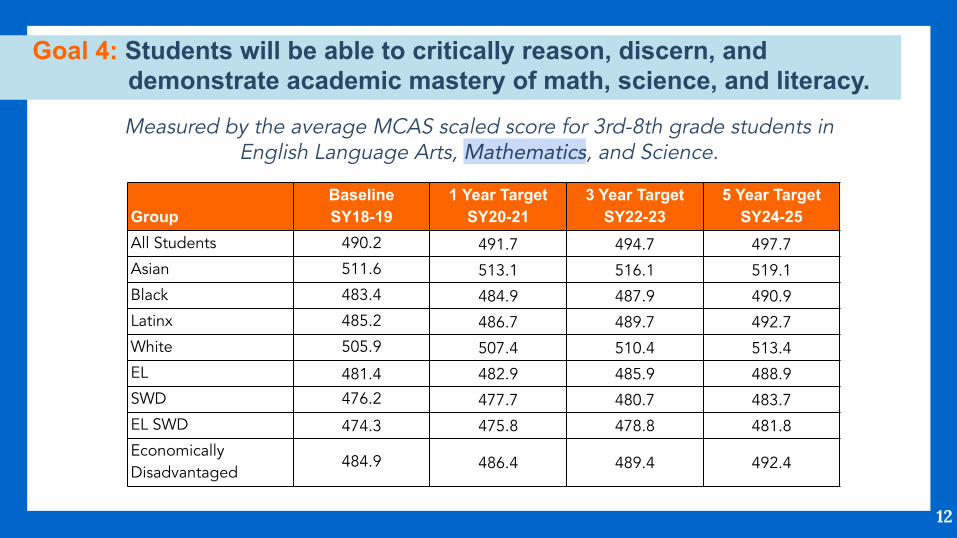
Goal 4: Students will be able to critically reason, discern, and demonstrate academic mastery of math, science, and literacy.
12
GroupBaselineSY18-19
1 Year TargetSY20-21
3 Year TargetSY22-23
5 Year TargetSY24-25
All Students 490.2 491.7 494.7 497.7Asian 511.6 513.1 516.1 519.1Black 483.4 484.9 487.9 490.9Latinx 485.2 486.7 489.7 492.7White 505.9 507.4 510.4 513.4EL 481.4 482.9 485.9 488.9SWD 476.2 477.7 480.7 483.7EL SWD 474.3 475.8 478.8 481.8Economically Disadvantaged
484.9 486.4 489.4 492.4
Measured by the average MCAS scaled score for 3rd-8th grade students in English Language Arts, Mathematics, and Science.

Goal 4: Students will be able to critically reason, discern, and demonstrate academic mastery of math, science, and literacy.
13
GroupBaselineSY18-19
1 Year TargetSY20-21
3 Year TargetSY22-23
5 Year TargetSY24-25
All Students 484.6 487.2 492.4 497.6Asian 499.7 502.3 507.5 512.7Black 478.8 481.4 486.6 491.8Latinx 480.1 482.7 487.9 493.1White 499.8 502.4 507.6 512.8EL 472 474.6 479.8 485SWD 472.3 474.9 480.1 485.3EL SWD 468.3 470.9 476.1 481.3Economically Disadvantaged 479.8 482.4 487.6 492.8
Measured by the average MCAS scaled score for 3rd-8th grade students in English Language Arts, Mathematics, and Science.
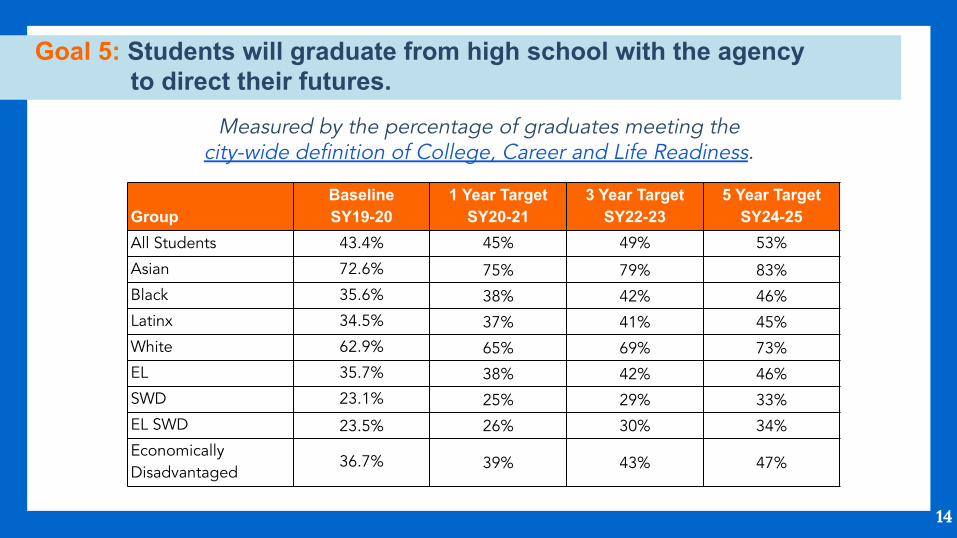
Goal 5: Students will graduate from high school with the agency to direct their futures.
14
GroupBaselineSY19-20
1 Year TargetSY20-21
3 Year TargetSY22-23
5 Year TargetSY24-25
All Students 43.4% 45% 49% 53%
Asian 72.6% 75% 79% 83%Black 35.6% 38% 42% 46%Latinx 34.5% 37% 41% 45%White 62.9% 65% 69% 73%EL 35.7% 38% 42% 46%SWD 23.1% 25% 29% 33%EL SWD 23.5% 26% 30% 34%Economically Disadvantaged
36.7% 39% 43% 47%
Measured by the percentage of graduates meeting the city-wide definition of College, Career and Life Readiness.

Value Language Aligned CommitmentStudent Voice & Family Engagement: BPS will leverage the cultural and linguistic wealth of students and families and honor their voices by engaging them in district and school level decision-making at the initiation of developing ideas whenever possible as our primary customers and creating partnerships that recognize their value, assets, and needs.
Commitment 3: Amplify All Voices
Community Partnerships: BPS will work with community partners to prepare students for unlimited global and local opportunities. BPS will continue to engage key partners in decision-making in order to guide and develop coherent year-round wraparound services, learning experiences, and programming that meets the needs for all students.
Commitment 6: Activate Partnerships
Equity & Eliminating Opportunity Gaps: BPS will implement, with fidelity, opportunity and achievement gap-closing practices that are research-based and data-driven at the district, school, and classroom levels. Black, Latinx, and Asian students must have access to standards-aligned instruction by teachers who are trained in culturally and linguistically sustaining practices (CLSP). Students with special learning needs have a right to be educated in appropriate settings which include but are not limited to inclusive settings. English learners deserve language accessible high-quality curriculum and instruction across content areas that will allow them to reach their full potential and cultivate their native language. Native language access is critical for EL student success and demonstrates respect for the cultures and languages of our students and their families. The district’s professional learning will explicitly address these areas to ensure that educators are appropriately meeting the needs of our historically underserved student groups.
Commitment 1: Eliminate Opportunity and Achievement Gaps
Commitment 2: Accelerate Learning
Diverse & Effective Staffing: BPS will recruit and retain a highly effective, racially and linguistically diverse, culturally proficient workforce that can provide rigorous culturally and linguistically affirming inclusive curriculum and experiences that celebrate the assets of our students and provide a joyous and positive school experience.
Commitment 5: Cultivate Trust
Social, Emotional, & Physical Supports: BPS will deliver a universal Multi-Tiered System of Support that addresses the social, emotional, and physical well-being of all our students.
Commitment 4: Expand Opportunity
Adjustments to Values● Each value has an identified aligned commitment from the strategic plan.● The table below outlines changes to the value language, with new language highlighted.
15
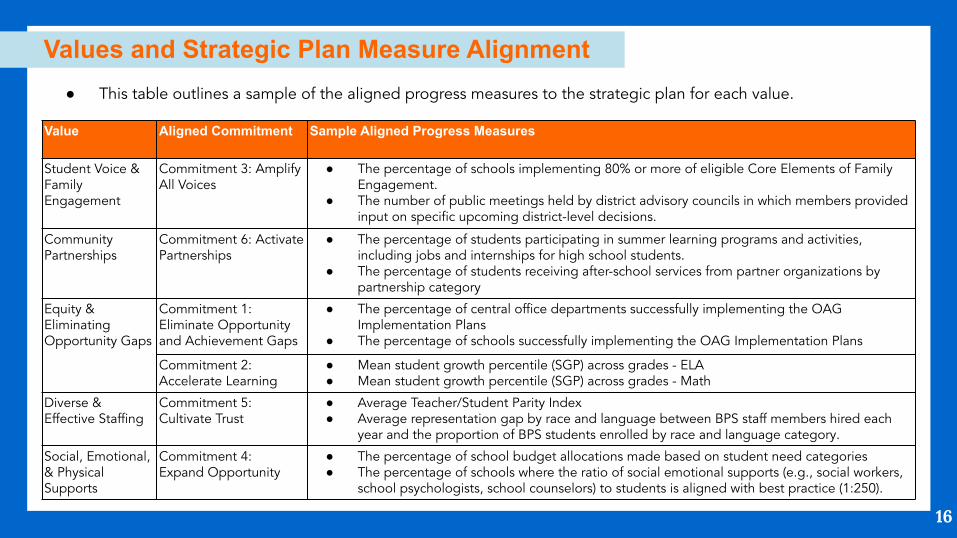
Value Aligned Commitment Sample Aligned Progress Measures
Student Voice & Family Engagement
Commitment 3: Amplify All Voices
● The percentage of schools implementing 80% or more of eligible Core Elements of Family Engagement.
● The number of public meetings held by district advisory councils in which members provided input on specific upcoming district-level decisions.
Community Partnerships
Commitment 6: Activate Partnerships
● The percentage of students participating in summer learning programs and activities, including jobs and internships for high school students.
● The percentage of students receiving after-school services from partner organizations by partnership category
Equity & Eliminating Opportunity Gaps
Commitment 1: Eliminate Opportunity and Achievement Gaps
● The percentage of central office departments successfully implementing the OAG Implementation Plans
● The percentage of schools successfully implementing the OAG Implementation Plans
Commitment 2: Accelerate Learning
● Mean student growth percentile (SGP) across grades - ELA ● Mean student growth percentile (SGP) across grades - Math
Diverse & Effective Staffing
Commitment 5: Cultivate Trust
● Average Teacher/Student Parity Index ● Average representation gap by race and language between BPS staff members hired each
year and the proportion of BPS students enrolled by race and language category.
Social, Emotional, & Physical Supports
Commitment 4: Expand Opportunity
● The percentage of school budget allocations made based on student need categories● The percentage of schools where the ratio of social emotional supports (e.g., social workers,
school psychologists, school counselors) to students is aligned with best practice (1:250).
Values and Strategic Plan Measure Alignment● This table outlines a sample of the aligned progress measures to the strategic plan for each value.
16
Next Steps
17
BSC will continue working with AJ Crabill from the Council of Great City Schools on creating systems for monitoring the district’s progress towards meeting these goals, including:
● Aligning School Committee work with the goals and values● Creating a calendar for School Committee meeting topics and monitoring report
template to monitor progress towards these goals and values● Redesigning School Committee agendas ● Revising School Committee operating procedures and policy● Alignment with strategic plan implementation: District logic model for strategic plan
implementation inputs that will achieve the student outcomes outlined in School Committee Goals & Values
APPENDIX
18

About the Measure: Goal 1
19
MAP Reading Fluency is an adaptive universal screening and progress monitoring assessment for grades pre-K to 5 developed by NWEA. Phonological awareness, the ability to distinguished letter sounds is a foundational pre-reading skill measured by MAP Fluency.
MAP in BPS● SY 18-19: MAP was piloted alongside Lexia Rapid in 26 schools● SY 19-20: MAP end-of-year assessments were not administered● SY 20-21: MAP Assessments have been administered remotely this school year
MAP participation is not 100% for all students or student groups
MAP is a relatively new assessment and we do not have historic data in order to analyze trends and gaps across the district. NWEA (the vendor providing the MAP assessment) have not made available national or a representative sample of district data in order to better understand student performance. Therefore we are not able to calculate baseline or target information at this time.
More information

About the Measure: Goal 2
20
The ACCESS Assessment for English Learners
● Is administered to Kindergarten through Grade 12 students who have been identified as English language learners (ELLs)
● Is given annually to monitor students' progress in learning academic English● Meets U.S. federal requirements of the Every Student Succeeds Act (ESSA) for monitoring and
reporting ELLs’ progress toward English language proficiency● Is anchored in the WIDA English Language Development Standards● Assesses the four language domains of Listening, Speaking, Reading and Writing
Educators use ACCESS results, along with other WIDA resources, to make decisions about students' English academic language and to facilitate their language development.
Student Growth Percentile assesses how much a student has progressed compared to his/her academic peers from the previous year. A growth percentile of 50 is considered typical growth. The percentage of students with at least an SGP of 50 indicates the amount of students that are growing at a rate similar to their peers across the state.
More information

About the Measure: Goal 3
21
The MCAS is the state assessment of students reading and writing skills. While some students with severe disabilities are assessed with an alternative portfolio based assessment, approximately 89% of Students with Disabilities assessed took the traditional MCAS in ELA and Math in 2019.
Student Growth Percentile assesses how much a student has progressed compared to his/her peers. A student growth percentile of 50 is considered typical growth. The percentage of students with at least an SGP of 50 indicates the amount of students with disabilities that are growing at a rate similar to their academic peers across the state.
More information

About the Measure: Goal 4
22
The MCAS is the state assessment and is administered annually in English Language Arts, and Mathematics in grades 3 through 8, and in Science in grades 5 and 8.
MCAS scaled scores range from 440 to 560● 440-469: Not Meeting Expectations● 470-499: Partially Meeting Expectations● 500-529: Meeting Expectations● 530-560: Exceeding Expectations
Average scaled score is a Massachusetts state accountability metric. Scaled score targets are set based on schools and district baseline data on an annual basis. State targets have not yet been set for the 20-21 school year.
More Information

About the Measure: Goal 5
The measure for College, Career, and Life Readiness includes BPS graduates who attain at least 2 of the three following criteria and complete Anywhere, Anytime Learning opportunities:
● Attendance of 94% or better● Grade Point Average of 2.7 or better ● Completed MassCore course of study as well as
enrolled in Advanced Coursework
(Anywhere, Anytime Learning gauged by internships and other extracurricular activities)
More information
Measure 2019 Cohort
Number of Graduates 3,181
94%+ Attendance 52%
2.7+ GPA 56%
MassCore + Advanced Coursework 31%
Anywhere, Anytime Learning 86%
2 of 3 high school achievement indicators (attendance, GPA, rigorous coursework) and “Anytime, Anywhere Learning”
44.9%
23
Boston graduates who are ready for college, career, and life have the power to find goals worth seeking, to figure out how to reach them, and to adapt as the world changes around them. These graduates have the power to navigate new situations and the skills that will enable them to move through any barriers they find along the way.