2007 - National Bank Of Georgia · PDF filenational bank of georgia Central Bank in Georgia...
104
NATIONAL BANK OF GEORGIA Central Bank in Georgia was first established in 1919 BALANCE OF PAYMENTS OF GEORGIA 2007
Transcript of 2007 - National Bank Of Georgia · PDF filenational bank of georgia Central Bank in Georgia...
nationalbank of georgia
Central Bank in Georgia was first established in 1919
balance ofpayments ofgeorgia2007

National Bank of Georgia
BalaNce of paymeNts of
GeorGia2007
tbilisi 2008
Balance of Payments of Georgia. 2007 �
coNteNts
1. Methodological Review ..............................................................................................................5
1.1. Methodological standards on the balance of payments ........................................................51.2. Methodological standards on the international investment position ...................................101.�. Methodological standards on the external debt .................................................................11
2. The Balance of Payments of Georgia for 2007 ....................................................................1�
2.1. General Overview ..............................................................................................................1�2.2. Current account ..................................................................................................................16
2.2.1. Goods .......................................................................................................................162.2.2. Services ...................................................................................................................222.2.�. Income .....................................................................................................................242.2.4. Current transfers ......................................................................................................26
2.�. Capital and Financial Account .............................................................................................282.�.1. Capital Transfers .......................................................................................................282.�.2. Foreign Direct Investment ........................................................................................292.�.�. Portfolio Investment .................................................................................................�02.�.4. Financial Derivatives ................................................................................................�02.�.5. Other Investment .....................................................................................................�12.�.6. Reserve Assets ........................................................................................................��
�. International Investment Position ..........................................................................................�4
4. External Debt ...........................................................................................................................�7
5. Data Source Description..........................................................................................................40
6. Appendices ................................................................................................................................42
Appendix 1. Balance of Payments of Georgia, 200�-2007 (standard precentation) .....................................................................................42
Appendix 2. Balance of Payments of Georgia, 200�-2007 (analitical precentation).................5�Appendix �. Balance of Payments of Georgia, quarters of 2007 (standard precentation)........54
Appendix 4. Balance of Payments of Georgia, quarters of 2007 (analitical precentation) .......6�
Appendix 5. Balance of Payments of Georgia, quarters 2007 (Standard presentation, short-form) .................................................................64
Appendix 6. International Investment Position of Georgia, 2005-2007 ....................................65
Appendix 7. International Investment Position of Georgia, 2007 quarter I ...............................68
Appendix 8. International Investment Position of Georgia, 2007 quarter II ..............................71
Appendix 9. International Investment Position of Georgia, 2007 quarter III .............................74
Appendix 10. International Investment Position of Georgia, 2007 quarter IV ...........................77
Appendix 11. Gross External Debt of Georgia, 2006-2007 .....................................................80
Appendix 12. Exports of goods by countries, 200�-2007 ........................................................82
4 National Bank of Georgia
Appendix 1�. Imports of goods by countries, 200�-2007 .........................................................85
Appendix 14. Exports by groups of goods, 200�-2007 .............................................................88
Appendix 15. Imports by groups of goods, 200�-2007 .............................................................90
Appendix 16. Exports to Turkey, 200�-2007 ............................................................................92
Appendix 17. Imports from Turkey, 200�-2007 ........................................................................94
Appendix 18. Exports of goods to EU countries, 200�-2007 ....................................................96
Appendix 19. Imports of goods from EU countries, 200�-2007 ................................................98
Appendix 20. Exports of goods to CIS countries, 200�-2007 .................................................100
Appendix 21. Imports of goods from CIS countries, 200�-2007 .............................................102
Balance of Payments of Georgia. 2007 5
1. methodoloGical review
National Bank of Georgia is responsible for Balance of Payments compilation since 2007.
The balance of payments, international investment position and external debt of Georgia are elaborated quarterly and annually in millions of US Dollars. These documents do not include data on external economic operations of Abkhazia and Tskhinvali region.
The balance of payments, international investment position and external debt statistics of Georgia are revised on a regular basis and can affect any period.
1.1. methodological standards on the balance of payments
The balance of payments (BOP) is a macroeconomic and statistical statement that systematically summarizes, for a specified time period, the economic transactions of an economy with the rest of the world. The data is classified and compiled according to the international standards recommended by the International Monetary Fund in the Balance of Payments Manual (fifth edition).
Definitions and General Principles
Balance of payments structurally consists of two parts: current account and capital and financial account. The current account comprises: goods, services, income, and current transfers. The capital and financial account comprises: capital transfers, direct investment, portfolio investment, financial derivatives, other investment, and reserve assets. Transactions reflected in BOP are operations made between residents and non-residents.
An economic unit is a resident unit when it has a center of economic interest and a permanent location in the economic territory of a country for more than one year irrespective of the citizenship.
6 National Bank of Georgia
The economic territory of a country con-sists of its geographic territory administered by a government, where the persons, goods and capital circulate freely and are subject of the same monetary and fiscal policy. Economic territory also consists of: airspace, territorial waters, territories from international waters over which the country has exclusive rights, territorial enclaves situated on the territory of other countries, such as embassies, military bases, free zones etc. In its turn the territorial enclaves of such type that belong to other countries are not included in the economic territory of the given country.
A physical or legal person has a center of economic interest within a country when there exists some location – dwelling, place of production, or other premises – within the economic territory of the country, or from, which the unit engages or intends to conti-nue engaging, either indefinitely or over a finite but long period of time (one or more than one year).
The main principle that must be followed as an evaluation base of the transactions is the market price that is defined as amounts of money that a willing buyer pays to acquire something from a willing seller, when both are independent parties and when all con-siderations are solely commercial.
The time at which a transaction is recorded is the real or estimated time at which ownership changes that is the time when currency operations are registered in the accounting records of the banks or enterprises.
The BOP does not use the notion of “payments“ in its general meaning, but in the meaning of transactions, because some international transactions do not involve pay-ments of money (for example barter), and some transactions do not elicit any such payments (for example inheritance).
economic sectorsFinancial account components of the BOP
– direct investment, portfolio investment, financial derivatives, and other investment are disaggregated by the economic sector
of residents involved in the operation. Four economic sectors are distinguished:– monetary authorities, the National Bank of
Georgia;– general government, which comprises
central government institutions and local public authorities;
– banking sector that includes all commercial banks in Georgia;
– other sectors comprise industrial and commercial enterprises, insurance com-panies, nonmonetary financial institutions, households.
types of transactions:• exchanges – most transactions likely to be
recorded in balance of payments may be characterized as exchanges in which one transactor provides an economic value to another transactor and receives an equal value in return;
• transfers – transactions in which one transactor provides an economic value to another transactor and does not receive an equivalent value in return;
• migrations – migrations of individuals from one economy to another result in migrations of assets and liabilities of given individuals.The last two types of transaction have
a unilateral character that is why, in order to respect the double entry principle of the BOP, another entry with an opposite sign is needed;• imputed transactions – in the case when
transactions are imputed and entries are made in the balance of payments accounts when no actual flows occur, for example the reinvestment of foreign investors’ profit;
• reclassification and revaluation of claims and liabilities – the classification of financial items in the BOP reveal the motivation of creditor or debtor. Financial items are subject to reclassification in accordance with changes in motivation.The transactions mentioned above, (except
for reclassification and revaluation which are included only in the international investment position) are reflected in different item of the BOP structured in the following way:
Balance of Payments of Georgia. 2007 7
Goods comprises transactions with goods that cross the border of the country and either involve changes of ownership between resi-dents and non-residents (general merchandise, goods procured by carriers and non monetary gold) or do not involve change of ownership (goods for processing, repairs of goods).
services cover all types of services that are performed by residents for nonresidents and vice versa:– transportation services include air, railway,
auto, sea transport, pipeline transportation. Passenger, freight and other transportation services (cargo handling, storage, mainte-nance and clearing of transportation equ-ipment, etc.) are specified for each type of transportation, except for pipeline transportation;
– travel services – this item records on credit side the expenditures of nonresidents travelers for business and personal pur-poses during their visits in Georgia. The residents’ travel expenditures abroad are recorded on debit side of this item;
– communications services item covers international communications transactions: postal and telecommunication services, data transmission etc.;
– financial services cover financial intermediary and auxiliary services conducted between residents and nonresidents;
– other services comprise services such as constructions, insurance services, com-puter and information services, royalties and license fees, other business services, personal, cultural and recreational ser-vices, government services etc.income registers two types of flows
between residents and nonresidents:– compensation of employees in the form
of salaries, wages or other benefits, in cash or in kind, paid by employers to the employees when parties belong to diffe-rent residency. These remunerations also include taxes paid in the host country, which are reflected as an opposite side entry at current transfers item. The employees expenditures in host country are registered as a counterpart record at travel item;
– investment income covers income recei-vable or payable associated, respectively, with residents’ holdings of external financial assets and with residents’ liabilities to nonresidents. Investment income consists of direct investment income, portfolio investment income, income on other investment and on reserve assets.transfers are defined as offsetting entries
for real resources or financial items provided without quid pro quo, by one economy to another. Transfers are divided into current transfers and capital transfers, which are further subdivided into governmental and other sectors’ transfers. The most common examples of current transfers are humanita-rian aid and technical assistance; of capital transfers – debt cancellation by creditor, mig-rants’ transfers.
direct investment is a category of inter-national investment in which a resident entity in one economy (the direct investor) acquires a lasting interest in an entity resident in another economy (the direct investment enterprise). The direct investor of an enterprise is an investor that owns 10 percent or more in the ordinary shares or voting power (for an incorporated enterprise) or the equivalent (for an unincorporated enterprise). The “direct investment“ relation is extended to the enter-prises in which goods and/or money are invested from enterprises associated with them, that is to the capital investment bet-ween associated enterprises, branches and their head offices. Direct investment includes equity capital, reinvested earnings and other capital. For the category of direct investment there are directional distinctions (abroad or in the reporting economy), for equity capital and other capital items within this category, assets and liabilities.
portfolio investment is in the form of:– equity securities (when the investor holds
less than 10% of equity capital);– debt securities which are subdivided
into bonds and notes, money market instruments.
8 National Bank of Georgia
financial derivatives are financial instruments that are linked to a specific financial instrument, indicator, or commodity and through which specific financial risks can be traded in financial markets in their own right. Financial derivatives comprise transactions with swaps, options, guarantees, deposits, etc. and are registered on net basis.
other investment is primarily divided into investment that represent the financial assets (claims on non-residents) and liabilities to non-residents. Within this asset and liability classification, other investment transactions are further divided into trade credits, loans, currency and deposits, and other assets/liabilities.
trade credits consist of claims and liabi-lities that arise from direct extension of credit from a supplier to a buyer – that is, when payment for goods and services is made at a time that differs from the time when ownership changes. Trade credit arrangements do not involve the issue of securities. In the BOP of Georgia advance payment/deliveries of traded goods are recorded under this item.
miscellaneous arrears are reflected at “other liabilities“ item that mainly consists of arrears on external debt service.
reserve assets are financial instruments available to monetary authorities for financing or regulating payment imbalances. They can be used by these authorities to finance directly the BOP’s deficit or to influence indirectly the given deficit (intervention in the foreign exchange market for the purpose of regulating the exchange rate of the national currency).
The items of financial accounts are structured by sectors: monetary authorities, general government, banks, other sectors; portfolio investment and other investment are additionally classified by long term and short term investments.
data registration
The BOP is constructed on the basis of the double entry book-keeping system. Every
recorded transaction is represented by two (or more) entries with equal values. One of these entries is recorded under credit side with positive sign; the other is recorded under debit with a negative sign. For example, in the case when an export operation is made, the transaction value in the BOP will be reflected as credit in “Export“ and as debit in “Assets – currency and deposits“. The sum of all credit entries and debit entries should be identical, and the net balance of all entries in the statement should be zero. In practice, however, the accounts frequently do not balance. Data for balance of payments estimates often are derived from different sources; as a result, there may be a summary net credit or net debit. The separate entry, equal to the amount with reversed sign, is then made to balance the accounts (net errors and omissions item).
Credit entries are recorded:– for real resources denoting export;– for financial items reflecting reduction
in foreign assets or increase in foreign liabilities.Debit entries are recorded:
– for real resources denoting import;– for financial items reflecting increase in
foreign assets or decrease in foreign liabilities.Transfers are shown as credits when the
entries to which the transfers provide the offsets are debits and as debits when those entries are credits.
data source
The main sources of information used for compilation of the BOP of Georgia are: statistics department of the Ministry of Economic Development of Georgia (data on trade of goods and services, enterprise survey, households’ survey, specific surveys), banking institutions, the Ministry of Finance, other ministries and public institutions, the international organizations representatives in Georgia, other countries embassies.
Balance of Payments of Georgia. 2007 9
Along with the data received through statistical reports some estimations and adjustments are made in order to improve the data quality.
Imports/exports of goods– Import and export of goods are reflected in
FOB prices in the balance of payments of Georgia;
– CIF prices of imported goods are converted into FOB prices. For this adjustment an estimate of transportation and insurance services are used as a 10 percent of CIF price of imported goods.;
– The official data on imports/exports of goods received from the Customs Depart-ment are supplemented with estimations made by the National Bank of Georgia.
services
Transportation services– The value of transportation services of im-
ported goods is adjusted by data derived from the conversion of CIF prices into FOB prices (see imports/exports of goods), and it is divided by type of transportation (rail transport, air transport, auto transport etc);
– Besides that data is collected from other sources as well: “Georgian Railway“ Ltd, “Sakaeronavigatsia“ Ltd, sea ports and airports in Georgia. Based on the data received from the Department of Border Defense indirect estimations on the export/import of transportation services are made.
Travel– The value of travel export/imports are
derived from the data received from households surveys. The value on business travel is additionally adjusted upon the data received from different government institutions (ministries, departments etc) and banking sector;
– Information received from the Department of Border Defense on individuals crossing the border is also used for indirect estimations.
Besides that estimations are made on the expenses abroad of those engaged in export/import operations in goods as well as expenses of those working abroad for less than one year.
Other services– The data on other services such as
consultation, construction, financial and others are collected from the enterprises using such services. Then the volumes of such services are adjusted. The data for foreign embassies, diplomatic missions and international organizations are estimated using indirect methods. The data on diplomatic missions of Georgia abroad are obtained from the Ministry of Foreign Affairs of Georgia. Information on financial services is obtained from commercial banks’ reports. Information about insurance services is provided by State Insurance Supervision Agency.
income– The estimates of compensation of employ-
ees are mainly based on the household survey data; information on electronic money transfers from commercial banks’ reports is also used. Incomes of the residents employed in international orga-nizations are also estimated;
– Investment income is calculated based on various sources: report of the Ministry of Finance about interest payments on debt under state guarantee; report of commercial banks on interest payments in banking sector.
current transfers– Worker’s remittances are estimated
using the same methodology as for the compensation of employees;
– Information on the technical and humani-tarian assistance received from external sector is obtained from the Ministry of Finance, international organizations and foundations that have their offices on the territory of Georgia.

10 National Bank of Georgia
– The Customs Department data on move-ment of humanitarian goods is also used;
– The Ministry of Foreign Affairs of Georgia presents the data on membership fees of various international organizations;
– The values of grants for education of Georgian students abroad are estimated from the data of Ministry of Education and from the household survey data.
capital account– Capital transfers are calculated based on
information provided by Department of Grants and Humanitarian and Technical Assistance of Ministry of Finance, as well as on other information sources;
– Migrant’s transfers are calculated based on information obtained from sample surveys carried out by the Department of Statistics. Information of the Department of Border Defense about individuals entering and leaving the country is also used in estimations.
financial account
Direct investment– The data on direct investments are
estimated from the enterprise survey. The data on banking sector is obtained from commercial banks’ reports and the data on insurance companies – from State Insurance Supervision Agency;
– As for the direct investments of Georgia abroad, they have not a large scale and information at our disposal about such enterprises is likely to be incomplete.Portfolio investment
– Since the security market is at the stage of development in Georgia, portfolio investments are relatively small. They are practically absent in the nonfinancial sector and are encountered at a small scale in the banking sector. Relatively significant portfolio investments were occurred in 2006. The data on portfolio investments is obtained from commercial banks’ reports.
Other investments– The data on trade credits is estimated
on basis of information from enterprise survey;
– The data on loans, except other sector, is calculated from the Ministry of Finance and commercial banks’ reports. As to loans in other sectors, they are mainly estimated from the data of the enterprise survey; a certain additional information is obtained from the reports of relevant divisions in the Ministry of Finance.Reserve assets
– The data source is the balance accounts of the National Bank of Georgia.
1.2. methodological standards on the international investment position
The international investment position (IIP) of Georgia is compiled in accordance with standards recommended by the International Monetary Fund in the Balance of Payments Manual (fifth edition).
International investment position of a country shows, at a particular point in time, the stock of external financial assets and liabilities. The IIP comprises the whole set of claims and liabilities on/to non-residents in different sectors of an economy: monetary authorities, general government, banks and other sectors. Main items of this document are identical to those from financial account of the balance of payments: direct investment, portfolio investment, financial derivatives, and other investment (trade credits, loans, currency and deposits, other assets/liabilities), and reserve assets.
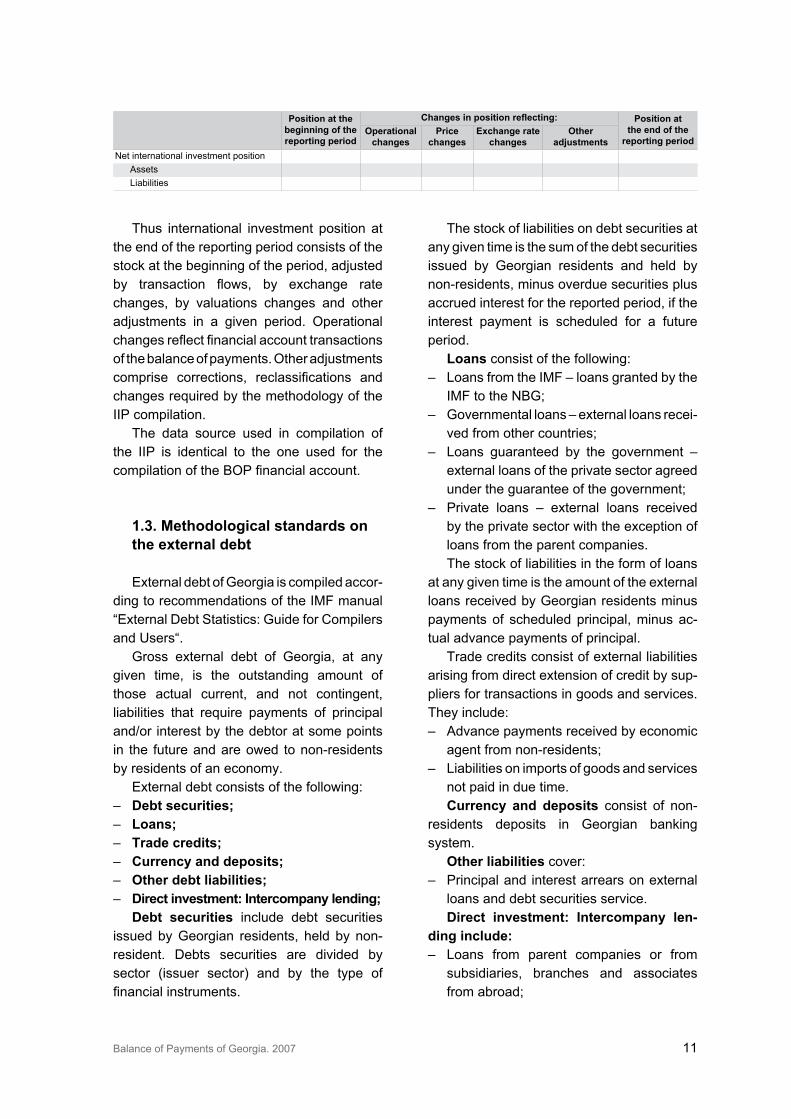
The difference between an economy’s financial assets and liabilities is economy’s net international investment position. Thus IIP can be net debtor or net creditor. The international investment position is worked out in the form of table containing following details:
Balance of Payments of Georgia. 2007 11
Thus international investment position at the end of the reporting period consists of the stock at the beginning of the period, adjusted by transaction flows, by exchange rate changes, by valuations changes and other adjustments in a given period. Operational changes reflect financial account transactions of the balance of payments. Other adjustments comprise corrections, reclassifications and changes required by the methodology of the IIP compilation.
The data source used in compilation of the IIP is identical to the one used for the compilation of the BOP financial account.
1.3. methodological standards on the external debt
External debt of Georgia is compiled accor-ding to recommendations of the IMF manual “External Debt Statistics: Guide for Compilers and Users“.
Gross external debt of Georgia, at any given time, is the outstanding amount of those actual current, and not contingent, liabilities that require payments of principal and/or interest by the debtor at some points in the future and are owed to non-residents by residents of an economy.
External debt consists of the following:– debt securities;– loans;– trade credits;– currency and deposits;– other debt liabilities;– direct investment: intercompany lending;
debt securities include debt securities issued by Georgian residents, held by non-resident. Debts securities are divided by sector (issuer sector) and by the type of financial instruments.
The stock of liabilities on debt securities at any given time is the sum of the debt securities issued by Georgian residents and held by non-residents, minus overdue securities plus accrued interest for the reported period, if the interest payment is scheduled for a future period.
loans consist of the following: – Loans from the IMF – loans granted by the
IMF to the NBG;– Governmental loans – external loans recei-
ved from other countries;– Loans guaranteed by the government –
external loans of the private sector agreed under the guarantee of the government;
– Private loans – external loans received by the private sector with the exception of loans from the parent companies.The stock of liabilities in the form of loans
at any given time is the amount of the external loans received by Georgian residents minus payments of scheduled principal, minus ac-tual advance payments of principal.
Trade credits consist of external liabilities arising from direct extension of credit by sup-pliers for transactions in goods and services. They include:– Advance payments received by economic
agent from non-residents;– Liabilities on imports of goods and services
not paid in due time.currency and deposits consist of non-
residents deposits in Georgian banking system.
other liabilities cover:– Principal and interest arrears on external
loans and debt securities service.direct investment: intercompany len
ding include:– Loans from parent companies or from
subsidiaries, branches and associates from abroad;
position at the beginning of the reporting period
Changes in position reflecting: position at the end of the
reporting periodoperational
changesprice
changesexchange rate
changesother
adjustmentsNet international investment position
AssetsLiabilities

12 National Bank of Georgia
– Principal and interest arrears on these loans.The stock of intercompany lending at
any given time is the amount of the external loans received by Georgian subsidiaries/direct investors from their parent companies/branches minus the payments of scheduled principal and minus actual advance payments of principal.
The external debt is disaggregated by institutional sector, following the classification from the BOP: monetary authorities, general
government, banking, and other sectors. External liabilities under the guarantee are attributed to the borrower’s sector; they are reclassified at the guarantor’s sector only when the guarantee is activated.
For the analytical purpose the external debt is presented by maturity: short-term and long-term on an original maturity basis.
The data source used for the external debt compilation is identical to the one used for the compilation of the BOP financial account and IIP.
Balance of Payments of Georgia. 2007 1�
2. the BalaNce of paymeNts of GeorGia for
2007
2.1. General overview
In 2007 economic growth in Georgia was significant, Gross Domestic Product’s (GDP) growth rate has reached 12,4 percent. Besides of 2007 two-digit growth of GDP has been fixed twice: in 1997 when it reached 10,5 percent and in 200� – 11,1 percent. 2006-2007 was the period of particular activation of foreign investors. During these two years Foreign Direct Investments realized in Georgian economy reached almost � Billion of USD, far more than in whole period of 19952005. Foreign Direct Investments inflow in 2007 was 1,75 Billion of USD. Investments inflow and economic growth has resulted activation of foreign sector of economy. As a consequence, there was recorded the growth of credit’s as well as debit’s figures of current account of Balance of Payments and the current account deficit has grown as well. In 2007 this figure was more than 2 005,8 Million of USD, which was 5,2 times higher than in 200�, and 70,9 percent higher than in previous year. The current account deficit ratio to Gross domestic Product was 9,6 percent in 200�, in 2006 – 15,1 percent and in 2007 – 19,7 percent.
In 200�-2007 foreign trade has developed appreciably, exports of goods have been increasing as well as imports. In 2007 exports has increased by 2,5 times as compared with 200� and has reached 2088,� million of USD. During 200� – 2005 exports growth rate was stable and was �4,6 percent on average. In 2006, putting embargo on Georgian imports by Russia has resulted reducing of Georgia’s exports growth rate to 1�,2 percent, but in 2007 it has increased again to 25,� percent. During the last four years exports of services was increasing and in 2007 it has reached 1 094,1 million of USD, that is 2,4 times higher than the same figure in 2003. In 2007 main exports’ products were Ferro-alloys, ferrous waste and scrap; remelting scrap ingots of iron or steel and copper ores and concentrates. Exports by main economic categories was distributed as following: the

14 National Bank of Georgia
biggest rate, 6�,2 percent had Intermediate goods, �2,2 percent – Consumer goods, and 4,5 percent – Investment goods.
Increase in imported goods was even more significant in 20032007 and it has been fluctuating from 34 to 37 percent in the analyzed period. As a result of such a high growth rate, the import of goods amounted to 4,984.1 million of US Dollars in 2007, which is �.4 times higher comparing to 200�. In the
last five years growth rate of import exceeded growth rate of export and resulted negative trade balance deterioration. Trade deficit constituted 2.9 billion of US Dollars by the end of analyzed period. In 2007, 15 percent of total import was investment goods, 45 percent was intermediary consumption goods, and �6 percent were consumption goods. It is possible to conclude that 64 percent of total import consists of industrial import.
taBle 2.1.1. maiN macroecoNomic iNdicators
economic indicator Unit 2003 2004 2005 2006 2007GDP current prices Mln of Lari 8 564.1 9 824.� 11 620.9 1� 789.9 16 998.6GDP current prices Mln of USD � 990.8 5 124.7 6 411.0 7 761.7 10 174.8Real GDP growth rate % 11.1 5.9 9.6 9.4 12.4Agriculture and fishing Mln of USD 770.� 840.2 946.9 869.2 955.8Industry (Mining and processing) Mln of USD �82.7 459.5 601.� 750.� 956.9Construction Mln of USD 255.1 41�.8 517.4 5��.2 680.7Trade Mln of USD 5�0.1 650.6 766.1 1 057.4 1 ���.8Transport Mln of USD 410.� 486.1 5�7.6 620.7 776.2Public administration Mln of USD 14�.� 299.� 414.0 661.1 1 �0�.0Monetary Aggregate (M�) end of period Mln of Lari 1 060.4 1 511.9 1 911.2 2 661.7 � 980.6Consumer price index end of period % 107.0 107.5 106.2 108.8 111.0Annual average exchange rate USD/Lari 2.1455 1.9167 1.8125 1.7764 1.670�Annual average exchange rate Euro/Lari 2.4247 2.�814 2.259� 2.2297 2.2862Current account Mln of USD -�8�.� -�5�.2 -709.7 -1 17�.7 -2 005.8Current account/GDP % -9.6 -6.9 -11.1 -15.1 -19.7Current account excluding transfers Mln of USD -56�.� -767.1 -1 068.5 -1 697.7 -2 695.1Current account excluding transfers/GDP % -14.1 -15.0 -16.7 -21.9 -26.5Balance of goods and services Mln of USD -576.8 -845.6 -1 1�0.7 -1 861.� -2 7�4.5Balance of goods and services/GDP % -14.5 -16.5 -17.6 -24.0 -26.9Export of goods and services Mln of USD 1 288.5 1 646.9 2 187.5 2 551.6 � 182.4Export of goods and services/GDP % �2.� �2.1 �4.1 �2.9 �1.�Current transfers Mln of USD 180.0 41�.9 �58.8 52�.9 689.�Net current transfers/GDP % 4.5 8.1 5.6 6.8 6.8
Export of goods and services/Import of goods end services % 69.1 66.1 65.9 57.8 5�.8
Import of goods end services Mln of USD 1 865.� 2 492.5 � �18.1 4 412.9 5 916.8Import of goods end services/GDP % 46.7 48.6 51.8 56.9 58.2International reserves Mln of USD 196.2 �86.6 478.5 9�0.8 1 �61.2International reserves/ Import of goods end services Month 1.� 1.9 1.7 2.5 2.8
Direct investment in Georgia (net flows) per capita USD 77.1 114.1 104.8 265.8 �98.�
Direct investment in Georgia (end of period stock) per capita USD �22.2 44�.4 550.7 808.7 1226.2
Government debt and government guarantied debt end of period stock Mln of USD 1 889.4 1 91�.4 1 786.4 1 747.� 1 848.5
Service of government debt and government guarantied external debt Mln of USD 95.2 155.2 102.5 195.9 106.�
State external debt/GDP % 47.� �7.� 27.9 22.5 18.2External debt service/Export of goods and services % 12.0 8.8 5.6 5.� �.6
During the analyzed period a slow increase of the export of goods and services comparing to the import has resulted of export to import
ratio worsening. Particularly, in 200� the coefficient was 69.1 but by the end of 2007 it declined by 15.� percentage point.
Balance of Payments of Georgia. 2007 15
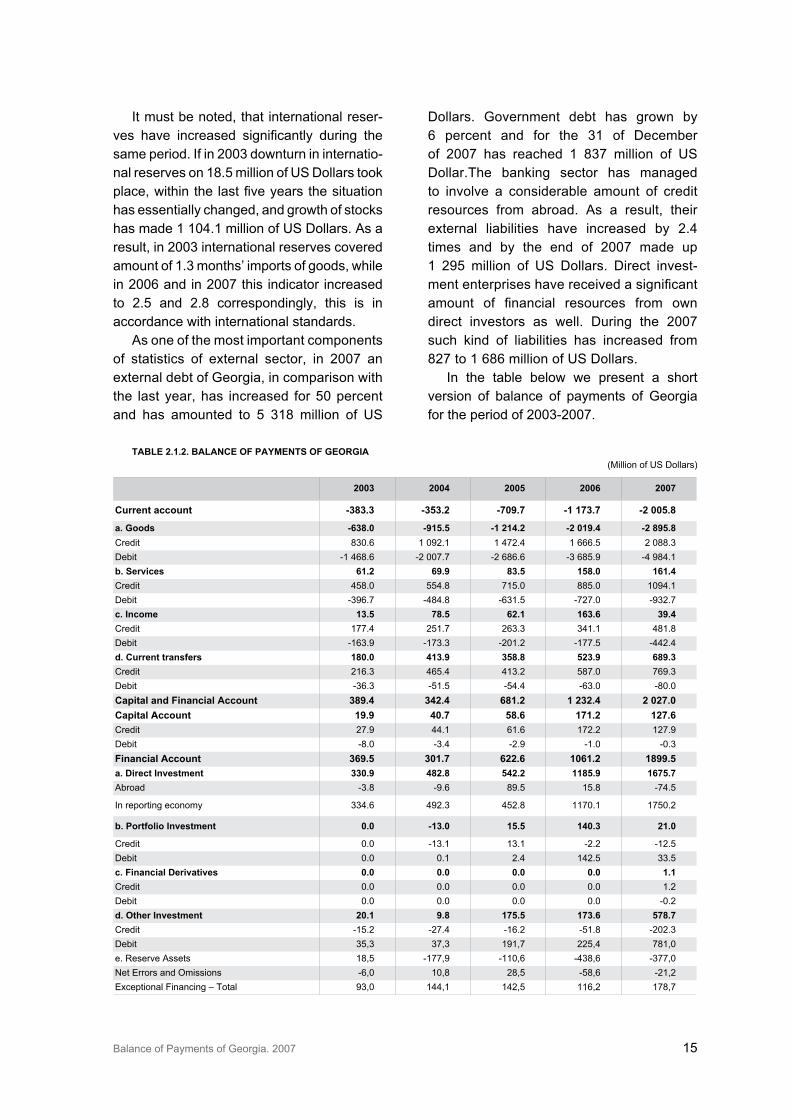
It must be noted, that international reser-ves have increased significantly during the same period. If in 200� downturn in internatio-nal reserves on 18.5 million of US Dollars took place, within the last five years the situation has essentially changed, and growth of stocks has made 1 104.1 million of US Dollars. As a result, in 200� international reserves covered amount of 1.� months’ imports of goods, while in 2006 and in 2007 this indicator increased to 2.5 and 2.8 correspondingly, this is in accordance with international standards.
As one of the most important components of statistics of external sector, in 2007 an external debt of Georgia, in comparison with the last year, has increased for 50 percent and has amounted to 5 �18 million of US
Dollars. Government debt has grown by 6 percent and for the �1 of December of 2007 has reached 1 8�7 million of US Dollar.The banking sector has managed to involve a considerable amount of credit resources from abroad. As a result, their external liabilities have increased by 2.4 times and by the end of 2007 made up 1 295 million of US Dollars. Direct invest-ment enterprises have received a significant amount of financial resources from own direct investors as well. During the 2007 such kind of liabilities has increased from 827 to 1 686 million of US Dollars.
In the table below we present a short version of balance of payments of Georgia for the period of 200�-2007.
taBle 2.1.2. BalaNce of paymeNts of GeorGia(Million of US Dollars)
2003 2004 2005 2006 2007
current account 383.3 353.2 709.7 1 173.7 2 005.8
a. Goods 638.0 915.5 1 214.2 2 019.4 2 895.8Credit 8�0.6 1 092.1 1 472.4 1 666.5 2 088.�Debit -1 468.6 -2 007.7 -2 686.6 -� 685.9 -4 984.1b. services 61.2 69.9 83.5 158.0 161.4Credit 458.0 554.8 715.0 885.0 1094.1Debit -�96.7 -484.8 -6�1.5 -727.0 -9�2.7c. income 13.5 78.5 62.1 163.6 39.4Credit 177.4 251.7 26�.� �41.1 481.8Debit -16�.9 -17�.� -201.2 -177.5 -442.4d. current transfers 180.0 413.9 358.8 523.9 689.3Credit 216.� 465.4 41�.2 587.0 769.�Debit -�6.� -51.5 -54.4 -6�.0 -80.0capital and financial account 389.4 342.4 681.2 1 232.4 2 027.0capital account 19.9 40.7 58.6 171.2 127.6Credit 27.9 44.1 61.6 172.2 127.9Debit -8.0 -�.4 -2.9 -1.0 -0.�financial account 369.5 301.7 622.6 1061.2 1899.5a. direct investment 330.9 482.8 542.2 1185.9 1675.7Abroad -�.8 -9.6 89.5 15.8 -74.5
In reporting economy ��4.6 492.� 452.8 1170.1 1750.2
b. portfolio investment 0.0 13.0 15.5 140.3 21.0
Credit 0.0 -1�.1 1�.1 -2.2 -12.5Debit 0.0 0.1 2.4 142.5 ��.5c. financial derivatives 0.0 0.0 0.0 0.0 1.1Credit 0.0 0.0 0.0 0.0 1.2Debit 0.0 0.0 0.0 0.0 -0.2d. other investment 20.1 9.8 175.5 173.6 578.7Credit -15.2 -27.4 -16.2 -51.8 -202.�Debit �5,� �7,� 191,7 225,4 781,0e. Reserve Assets 18,5 -177,9 -110,6 -4�8,6 -�77,0Net Errors and Omissions -6,0 10,8 28,5 -58,6 -21,2Exceptional Financing – Total 9�,0 144,1 142,5 116,2 178,7
16 National Bank of Georgia
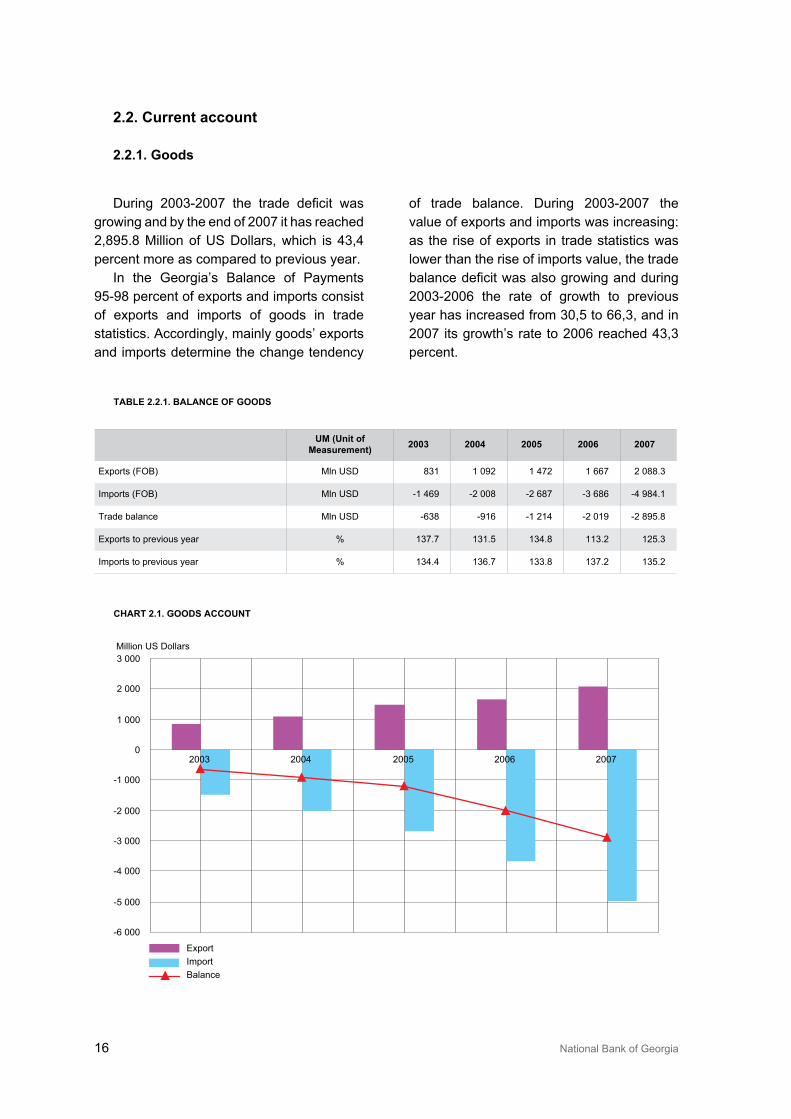
During 20032007 the trade deficit was growing and by the end of 2007 it has reached 2,895.8 Million of US Dollars, which is 4�,4 percent more as compared to previous year.
In the Georgia’s Balance of Payments 95-98 percent of exports and imports consist of exports and imports of goods in trade statistics. Accordingly, mainly goods’ exports and imports determine the change tendency
of trade balance. During 200�-2007 the value of exports and imports was increasing: as the rise of exports in trade statistics was lower than the rise of imports value, the trade balance deficit was also growing and during 200�-2006 the rate of growth to previous year has increased from �0,5 to 66,�, and in 2007 its growth’s rate to 2006 reached 4�,� percent.
2.2. current account
2.2.1. Goods
taBle 2.2.1. BalaNce of Goods
Um (Unit of measurement) 2003 2004 2005 2006 2007
Exports (FOB) Mln USD 8�1 1 092 1 472 1 667 2 088.�
Imports (FOB) Mln USD -1 469 -2 008 -2 687 -� 686 -4 984.1
Trade balance Mln USD -6�8 -916 -1 214 -2 019 -2 895.8
Exports to previous year % 1�7.7 1�1.5 1�4.8 11�.2 125.�
Imports to previous year % 1�4.4 1�6.7 1��.8 1�7.2 1�5.2
chart 2.1. Goods accoUNt
-6 000
-5 000
-4 000
-3 000
-2 000
-1 000
0
1 000
2 000
3 000
2003 2004 2005 2006 2007
Million US Dollars
ExportImportBalance
Balance of Payments of Georgia. 2007 17
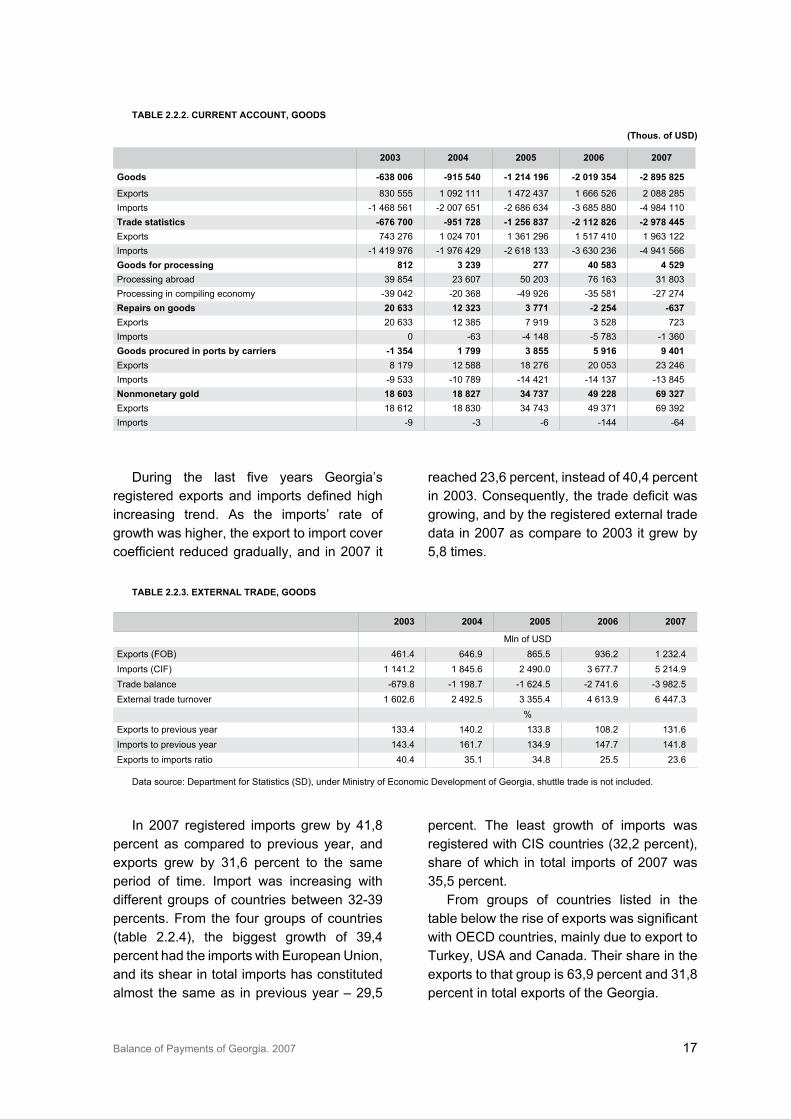
During the last five years Georgia’s registered exports and imports defined high increasing trend. As the imports’ rate of growth was higher, the export to import cover coefficient reduced gradually, and in 2007 it
reached 2�,6 percent, instead of 40,4 percent in 2003. Consequently, the trade deficit was growing, and by the registered external trade data in 2007 as compare to 200� it grew by 5,8 times.
taBle 2.2.2. cUrreNt accoUNt, Goods
(thous. of Usd)
2003 2004 2005 2006 2007
Goods 638 006 915 540 1 214 196 2 019 354 2 895 825
Exports 8�0 555 1 092 111 1 472 4�7 1 666 526 2 088 285Imports -1 468 561 -2 007 651 -2 686 6�4 -� 685 880 -4 984 110trade statistics 676 700 951 728 1 256 837 2 112 826 2 978 445Exports 74� 276 1 024 701 1 �61 296 1 517 410 1 96� 122Imports -1 419 976 -1 976 429 -2 618 1�� -� 6�0 2�6 -4 941 566Goods for processing 812 3 239 277 40 583 4 529Processing abroad �9 854 2� 607 50 20� 76 16� �1 80�Processing in compiling economy -�9 042 -20 �68 -49 926 -�5 581 -27 274repairs on goods 20 633 12 323 3 771 2 254 637Exports 20 6�� 12 �85 7 919 � 528 72�Imports 0 -6� -4 148 -5 78� -1 �60Goods procured in ports by carriers 1 354 1 799 3 855 5 916 9 401Exports 8 179 12 588 18 276 20 05� 2� 246Imports -9 5�� -10 789 -14 421 -14 1�7 -1� 845Nonmonetary gold 18 603 18 827 34 737 49 228 69 327Exports 18 612 18 8�0 �4 74� 49 �71 69 �92Imports -9 -� -6 -144 -64
taBle 2.2.3. exterNal trade, Goods
2003 2004 2005 2006 2007
Mln of USDExports (FOB) 461.4 646.9 865.5 9�6.2 1 2�2.4Imports (CIF) 1 141.2 1 845.6 2 490.0 � 677.7 5 214.9Trade balance -679.8 -1 198.7 -1 624.5 -2 741.6 -� 982.5External trade turnover 1 602.6 2 492.5 � �55.4 4 61�.9 6 447.�
%Exports to previous year 1��.4 140.2 1��.8 108.2 1�1.6Imports to previous year 14�.4 161.7 1�4.9 147.7 141.8Exports to imports ratio 40.4 �5.1 �4.8 25.5 2�.6
Data source: Department for Statistics (SD), under Ministry of Economic Development of Georgia, shuttle trade is not included.
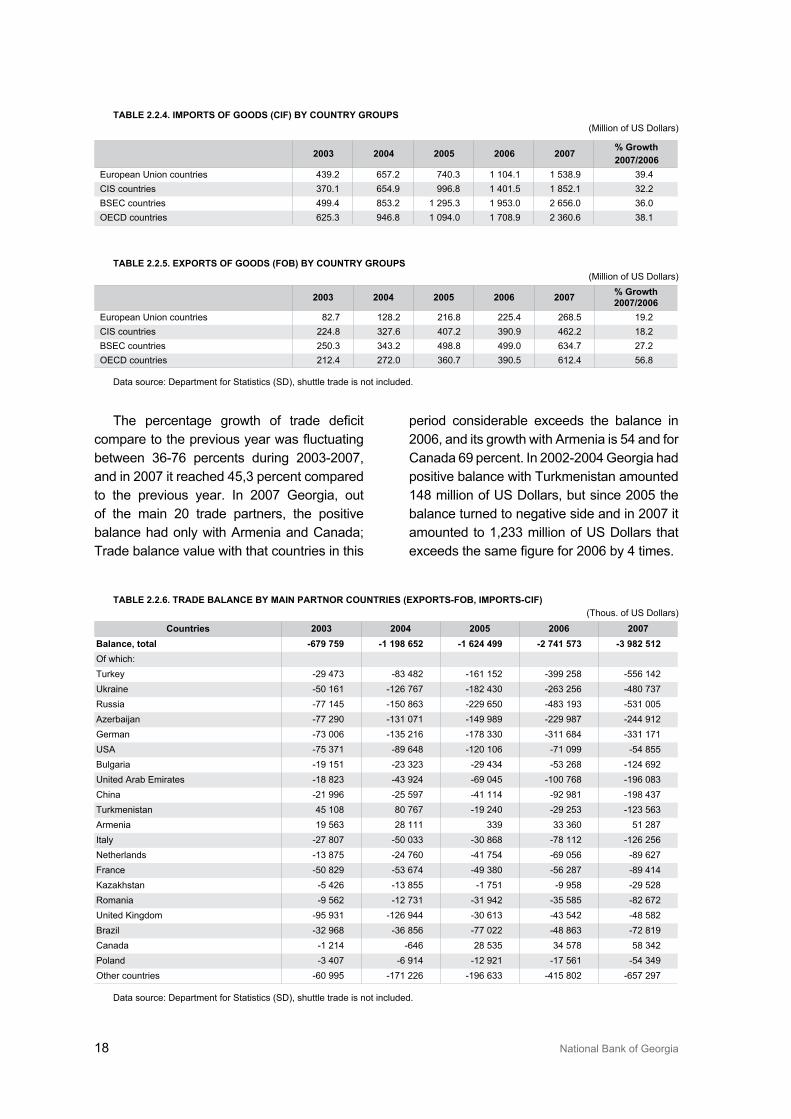
In 2007 registered imports grew by 41,8 percent as compared to previous year, and exports grew by �1,6 percent to the same period of time. Import was increasing with different groups of countries between �2-�9 percents. From the four groups of countries (table 2.2.4), the biggest growth of �9,4 percent had the imports with European Union, and its shear in total imports has constituted almost the same as in previous year – 29,5
percent. The least growth of imports was registered with CIS countries (�2,2 percent), share of which in total imports of 2007 was �5,5 percent.
From groups of countries listed in the table below the rise of exports was significant with OECD countries, mainly due to export to Turkey, USA and Canada. Their share in the exports to that group is 6�,9 percent and �1,8 percent in total exports of the Georgia.
18 National Bank of Georgia
The percentage growth of trade deficit compare to the previous year was fluctuating between �6-76 percents during 200�-2007, and in 2007 it reached 45,� percent compared to the previous year. In 2007 Georgia, out of the main 20 trade partners, the positive balance had only with Armenia and Canada; Trade balance value with that countries in this
period considerable exceeds the balance in 2006, and its growth with Armenia is 54 and for Canada 69 percent. In 2002-2004 Georgia had positive balance with Turkmenistan amounted 148 million of US Dollars, but since 2005 the balance turned to negative side and in 2007 it amounted to 1,2�� million of US Dollars that exceeds the same figure for 2006 by 4 times.
taBle 2.2.4. imports of Goods (cif) By coUNtry GroUps (Million of US Dollars)
2003 2004 2005 2006 2007% Growth2007/2006
European Union countries 4�9.2 657.2 740.� 1 104.1 1 5�8.9 �9.4CIS countries �70.1 654.9 996.8 1 401.5 1 852.1 �2.2BSEC countries 499.4 85�.2 1 295.� 1 95�.0 2 656.0 �6.0OECD countries 625.� 946.8 1 094.0 1 708.9 2 �60.6 �8.1
taBle 2.2.5. exports of Goods (foB) By coUNtry GroUps (Million of US Dollars)
2003 2004 2005 2006 2007 % Growth 2007/2006
European Union countries 82.7 128.2 216.8 225.4 268.5 19.2CIS countries 224.8 �27.6 407.2 �90.9 462.2 18.2BSEC countries 250.� �4�.2 498.8 499.0 6�4.7 27.2OECD countries 212.4 272.0 �60.7 �90.5 612.4 56.8
Data source: Department for Statistics (SD), shuttle trade is not included.
taBle 2.2.6. trade BalaNce By maiN partNor coUNtries (exportsfoB, importscif)(Thous. of US Dollars)
countries 2003 2004 2005 2006 2007Balance, total 679 759 1 198 652 1 624 499 2 741 573 3 982 512Of which:Turkey -29 47� -8� 482 -161 152 -�99 258 -556 142Ukraine -50 161 -126 767 -182 4�0 -26� 256 -480 7�7Russia -77 145 -150 86� -229 650 -48� 19� -5�1 005Azerbaijan -77 290 -1�1 071 -149 989 -229 987 -244 912German -7� 006 -1�5 216 -178 ��0 -�11 684 -��1 171USA -75 �71 -89 648 -120 106 -71 099 -54 855Bulgaria -19 151 -2� �2� -29 4�4 -5� 268 -124 692United Arab Emirates -18 82� -4� 924 -69 045 -100 768 -196 08�China -21 996 -25 597 -41 114 -92 981 -198 4�7Turkmenistan 45 108 80 767 -19 240 -29 25� -12� 56�Armenia 19 56� 28 111 ��9 �� �60 51 287Italy -27 807 -50 0�� -�0 868 -78 112 -126 256Netherlands -1� 875 -24 760 -41 754 -69 056 -89 627France -50 829 -5� 674 -49 �80 -56 287 -89 414Kazakhstan -5 426 -1� 855 -1 751 -9 958 -29 528Romania -9 562 -12 7�1 -�1 942 -�5 585 -82 672United Kingdom -95 9�1 -126 944 -�0 61� -4� 542 -48 582Brazil -�2 968 -�6 856 -77 022 -48 86� -72 819Canada -1 214 -646 28 5�5 �4 578 58 �42Poland -� 407 -6 914 -12 921 -17 561 -54 �49Other countries -60 995 -171 226 -196 6�� -415 802 -657 297
Data source: Department for Statistics (SD), shuttle trade is not included.
Balance of Payments of Georgia. 2007 19
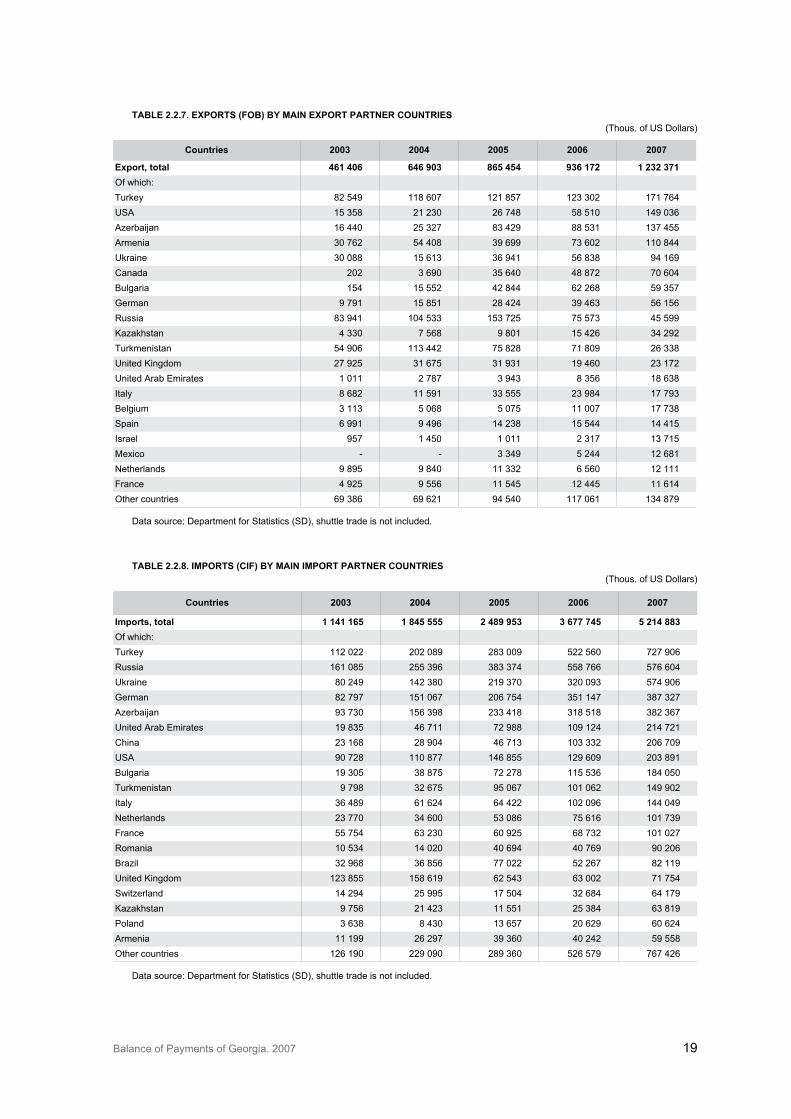
taBle 2.2.7. exports (foB) By maiN export partNer coUNtries (Thous. of US Dollars)
countries 2003 2004 2005 2006 2007
export, total 461 406 646 903 865 454 936 172 1 232 371Of which:Turkey 82 549 118 607 121 857 12� �02 171 764USA 15 �58 21 2�0 26 748 58 510 149 0�6Azerbaijan 16 440 25 �27 8� 429 88 5�1 1�7 455Armenia �0 762 54 408 �9 699 7� 602 110 844Ukraine �0 088 15 61� �6 941 56 8�8 94 169Canada 202 � 690 �5 640 48 872 70 604Bulgaria 154 15 552 42 844 62 268 59 �57German 9 791 15 851 28 424 �9 46� 56 156Russia 8� 941 104 5�� 15� 725 75 57� 45 599Kazakhstan 4 ��0 7 568 9 801 15 426 �4 292Turkmenistan 54 906 11� 442 75 828 71 809 26 ��8United Kingdom 27 925 �1 675 �1 9�1 19 460 2� 172United Arab Emirates 1 011 2 787 � 94� 8 �56 18 6�8Italy 8 682 11 591 �� 555 2� 984 17 79�Belgium � 11� 5 068 5 075 11 007 17 7�8Spain 6 991 9 496 14 2�8 15 544 14 415Israel 957 1 450 1 011 2 �17 1� 715Mexico - - � �49 5 244 12 681Netherlands 9 895 9 840 11 ��2 6 560 12 111France 4 925 9 556 11 545 12 445 11 614Other countries 69 �86 69 621 94 540 117 061 1�4 879
Data source: Department for Statistics (SD), shuttle trade is not included.
taBle 2.2.8. imports (cif) By maiN import partNer coUNtries (Thous. of US Dollars)
countries 2003 2004 2005 2006 2007
imports, total 1 141 165 1 845 555 2 489 953 3 677 745 5 214 883Of which:Turkey 112 022 202 089 28� 009 522 560 727 906Russia 161 085 255 �96 �8� �74 558 766 576 604Ukraine 80 249 142 �80 219 �70 �20 09� 574 906German 82 797 151 067 206 754 �51 147 �87 �27Azerbaijan 9� 7�0 156 �98 2�� 418 �18 518 �82 �67United Arab Emirates 19 8�5 46 711 72 988 109 124 214 721China 2� 168 28 904 46 71� 10� ��2 206 709USA 90 728 110 877 146 855 129 609 20� 891Bulgaria 19 �05 �8 875 72 278 115 5�6 184 050Turkmenistan 9 798 �2 675 95 067 101 062 149 902Italy �6 489 61 624 64 422 102 096 144 049Netherlands 2� 770 �4 600 5� 086 75 616 101 7�9France 55 754 6� 2�0 60 925 68 7�2 101 027Romania 10 5�4 14 020 40 694 40 769 90 206Brazil �2 968 �6 856 77 022 52 267 82 119United Kingdom 12� 855 158 619 62 54� 6� 002 71 754Switzerland 14 294 25 995 17 504 �2 684 64 179Kazakhstan 9 756 21 42� 11 551 25 �84 6� 819Poland � 6�8 8 4�0 1� 657 20 629 60 624Armenia 11 199 26 297 �9 �60 40 242 59 558Other countries 126 190 229 090 289 �60 526 579 767 426
Data source: Department for Statistics (SD), shuttle trade is not included.
20 National Bank of Georgia
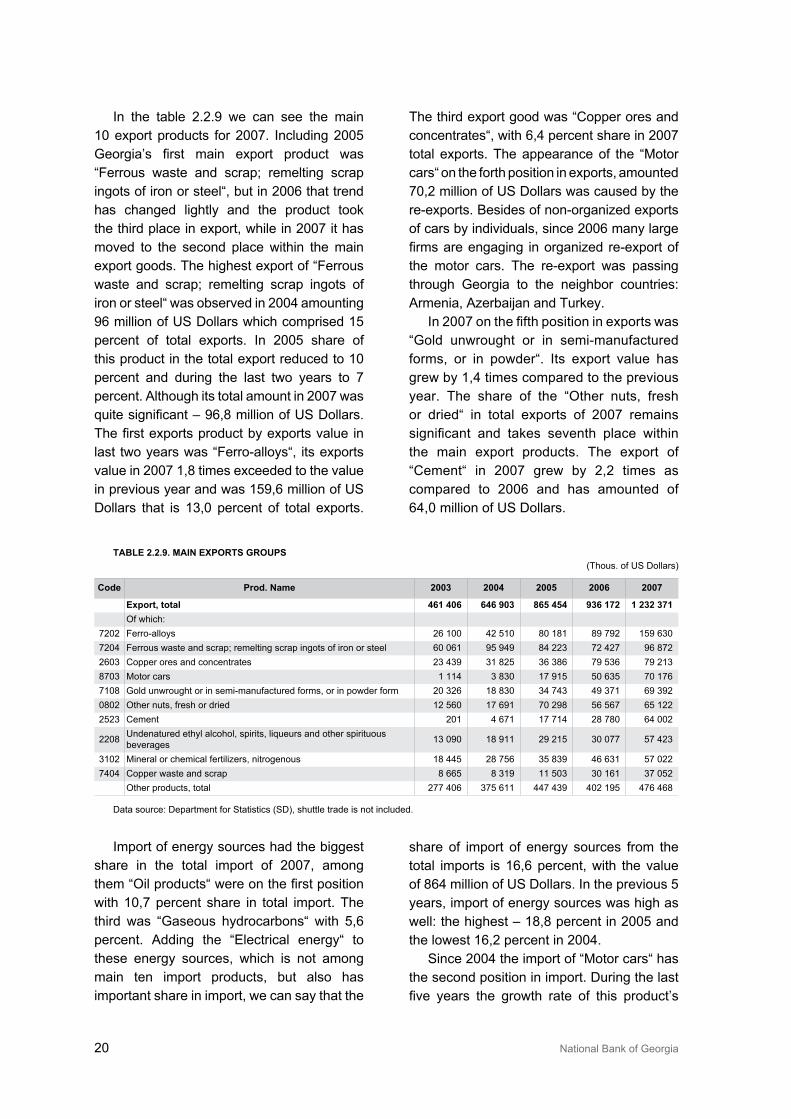
In the table 2.2.9 we can see the main 10 export products for 2007. Including 2005 Georgia’s first main export product was “Ferrous waste and scrap; remelting scrap ingots of iron or steel“, but in 2006 that trend has changed lightly and the product took the third place in export, while in 2007 it has moved to the second place within the main export goods. The highest export of “Ferrous waste and scrap; remelting scrap ingots of iron or steel“ was observed in 2004 amounting 96 million of US Dollars which comprised 15 percent of total exports. In 2005 share of this product in the total export reduced to 10 percent and during the last two years to 7 percent. Although its total amount in 2007 was quite significant – 96,8 million of US Dollars. The first exports product by exports value in last two years was “Ferro-alloys“, its exports value in 2007 1,8 times exceeded to the value in previous year and was 159,6 million of US Dollars that is 1�,0 percent of total exports.
The third export good was “Copper ores and concentrates“, with 6,4 percent share in 2007 total exports. The appearance of the “Motor cars“ on the forth position in exports, amounted 70,2 million of US Dollars was caused by the re-exports. Besides of non-organized exports of cars by individuals, since 2006 many large firms are engaging in organized reexport of the motor cars. The re-export was passing through Georgia to the neighbor countries: Armenia, Azerbaijan and Turkey.
In 2007 on the fifth position in exports was “Gold unwrought or in semi-manufactured forms, or in powder“. Its export value has grew by 1,4 times compared to the previous year. The share of the “Other nuts, fresh or dried“ in total exports of 2007 remains significant and takes seventh place within the main export products. The export of “Cement“ in 2007 grew by 2,2 times as compared to 2006 and has amounted of 64,0 million of US Dollars.
taBle 2.2.9. maiN exports GroUps (Thous. of US Dollars)
code prod. Name 2003 2004 2005 2006 2007
export, total 461 406 646 903 865 454 936 172 1 232 371Of which:
7202 Ferro-alloys 26 100 42 510 80 181 89 792 159 6�07204 Ferrous waste and scrap; remelting scrap ingots of iron or steel 60 061 95 949 84 22� 72 427 96 872260� Copper ores and concentrates 2� 4�9 �1 825 �6 �86 79 5�6 79 21�870� Motor cars 1 114 � 8�0 17 915 50 6�5 70 1767108 Gold unwrought or in semi-manufactured forms, or in powder form 20 �26 18 8�0 �4 74� 49 �71 69 �920802 Other nuts, fresh or dried 12 560 17 691 70 298 56 567 65 122252� Cement 201 4 671 17 714 28 780 64 002
2208 Undenatured ethyl alcohol, spirits, liqueurs and other spirituous beverages 1� 090 18 911 29 215 �0 077 57 42�
�102 Mineral or chemical fertilizers, nitrogenous 18 445 28 756 �5 8�9 46 6�1 57 0227404 Copper waste and scrap 8 665 8 �19 11 50� �0 161 �7 052
Other products, total 277 406 �75 611 447 4�9 402 195 476 468
Data source: Department for Statistics (SD), shuttle trade is not included.
Import of energy sources had the biggest share in the total import of 2007, among them “Oil products“ were on the first position with 10,7 percent share in total import. The third was “Gaseous hydrocarbons“ with 5,6 percent. Adding the “Electrical energy“ to these energy sources, which is not among main ten import products, but also has important share in import, we can say that the
share of import of energy sources from the total imports is 16,6 percent, with the value of 864 million of US Dollars. In the previous 5 years, import of energy sources was high as well: the highest – 18,8 percent in 2005 and the lowest 16,2 percent in 2004.
Since 2004 the import of “Motor cars“ has the second position in import. During the last five years the growth rate of this product’s
Balance of Payments of Georgia. 2007 21
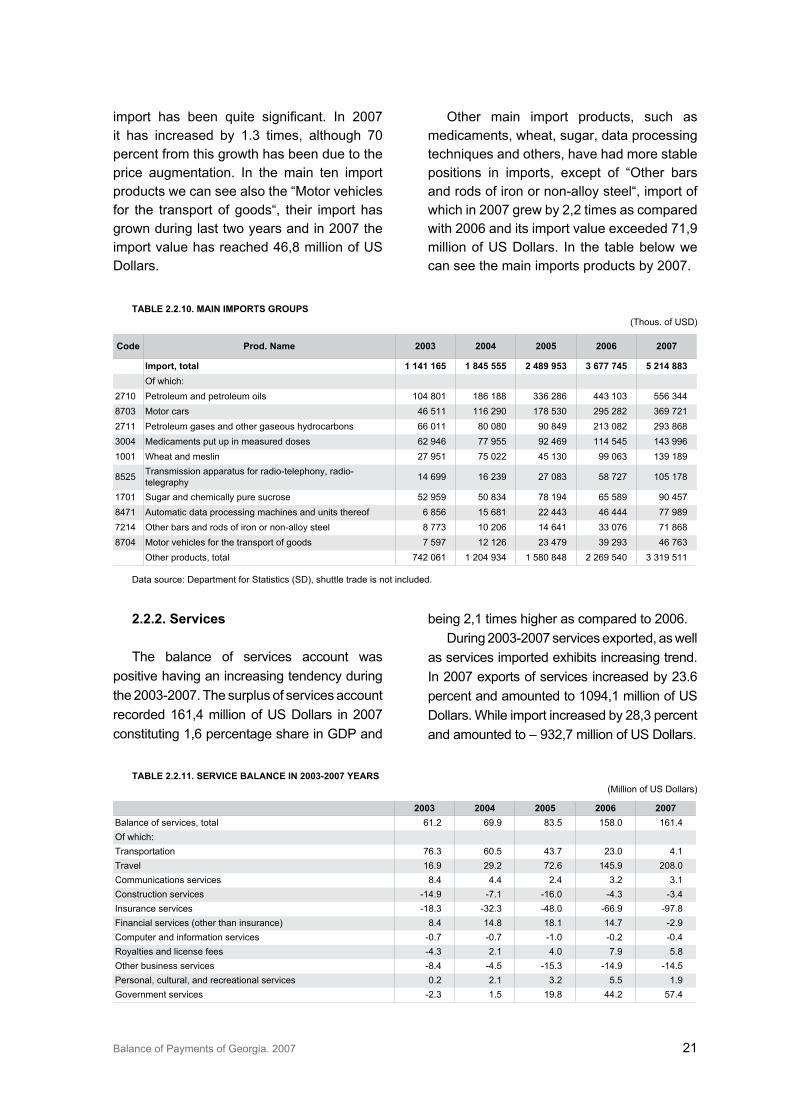
import has been quite significant. In 2007 it has increased by 1.� times, although 70 percent from this growth has been due to the price augmentation. In the main ten import products we can see also the “Motor vehicles for the transport of goods“, their import has grown during last two years and in 2007 the import value has reached 46,8 million of US Dollars.
Other main import products, such as medicaments, wheat, sugar, data processing techniques and others, have had more stable positions in imports, except of “Other bars and rods of iron or non-alloy steel“, import of which in 2007 grew by 2,2 times as compared with 2006 and its import value exceeded 71,9 million of US Dollars. In the table below we can see the main imports products by 2007.
taBle 2.2.10. maiN imports GroUps (Thous. of USD)
code prod. Name 2003 2004 2005 2006 2007
import, total 1 141 165 1 845 555 2 489 953 3 677 745 5 214 883Of which:
2710 Petroleum and petroleum oils 104 801 186 188 ��6 286 44� 10� 556 �44870� Motor cars 46 511 116 290 178 5�0 295 282 �69 7212711 Petroleum gases and other gaseous hydrocarbons 66 011 80 080 90 849 21� 082 29� 868�004 Medicaments put up in measured doses 62 946 77 955 92 469 114 545 14� 9961001 Wheat and meslin 27 951 75 022 45 1�0 99 06� 1�9 189
8525 Transmission apparatus for radio-telephony, radio-telegraphy 14 699 16 2�9 27 08� 58 727 105 178
1701 Sugar and chemically pure sucrose 52 959 50 8�4 78 194 65 589 90 4578471 Automatic data processing machines and units thereof 6 856 15 681 22 44� 46 444 77 9897214 Other bars and rods of iron or non-alloy steel 8 77� 10 206 14 641 �� 076 71 8688704 Motor vehicles for the transport of goods 7 597 12 126 2� 479 �9 29� 46 76�
Other products, total 742 061 1 204 9�4 1 580 848 2 269 540 � �19 511
Data source: Department for Statistics (SD), shuttle trade is not included.
2.2.2. services
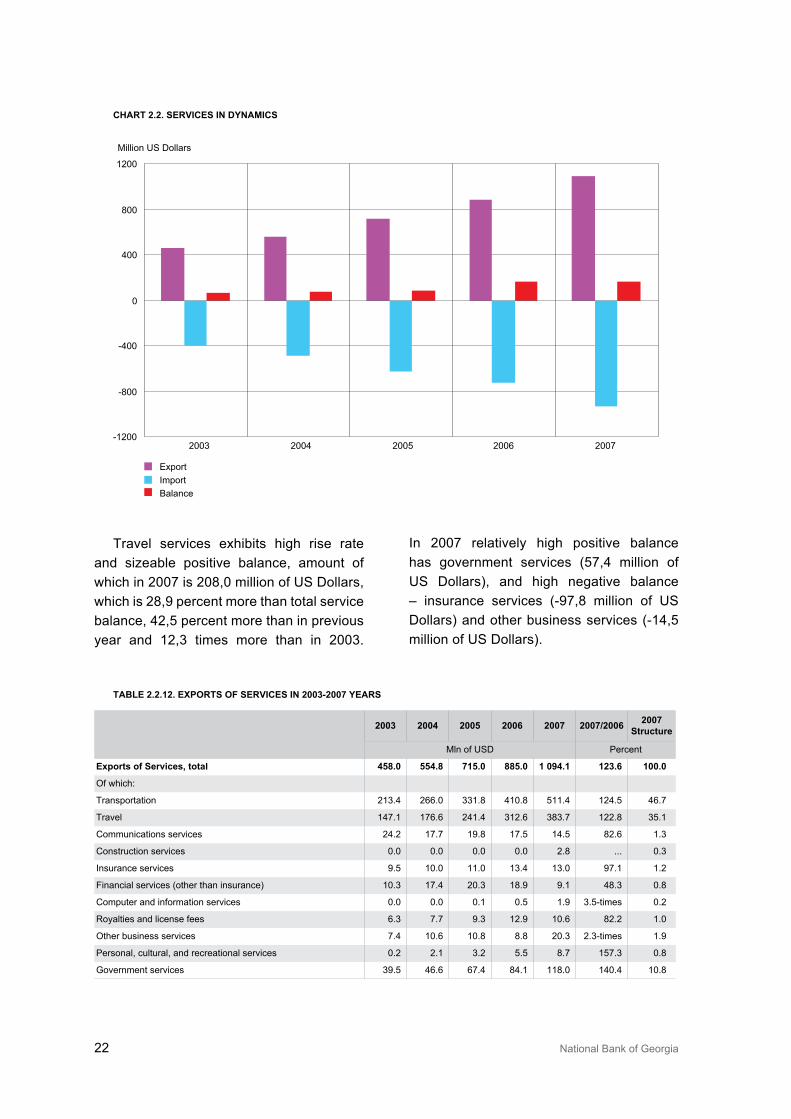
The balance of services account was positive having an increasing tendency during the 200�-2007. The surplus of services account recorded 161,4 million of US Dollars in 2007 constituting 1,6 percentage share in GDP and
being 2,1 times higher as compared to 2006.During 200�-2007 services exported, as well
as services imported exhibits increasing trend. In 2007 exports of services increased by 2�.6 percent and amounted to 1094,1 million of US Dollars. While import increased by 28,� percent and amounted to – 9�2,7 million of US Dollars.
taBle 2.2.11. service BalaNce iN 20032007 years(Million of US Dollars)
2003 2004 2005 2006 2007 Balance of services, total 61.2 69.9 8�.5 158.0 161.4Of which:Transportation 76.� 60.5 4�.7 2�.0 4.1Travel 16.9 29.2 72.6 145.9 208.0Communications services 8.4 4.4 2.4 �.2 �.1Construction services -14.9 -7.1 -16.0 -4.� -�.4Insurance services -18.� -�2.� -48.0 -66.9 -97.8Financial services (other than insurance) 8.4 14.8 18.1 14.7 -2.9Computer and information services -0.7 -0.7 -1.0 -0.2 -0.4Royalties and license fees -4.� 2.1 4.0 7.9 5.8Other business services -8.4 -4.5 -15.� -14.9 -14.5Personal, cultural, and recreational services 0.2 2.1 �.2 5.5 1.9Government services -2.� 1.5 19.8 44.2 57.4
22 National Bank of Georgia
chart 2.2. services iN dyNamics
Travel services exhibits high rise rate and sizeable positive balance, amount of which in 2007 is 208,0 million of US Dollars, which is 28,9 percent more than total service balance, 42,5 percent more than in previous year and 12,� times more than in 200�.
In 2007 relatively high positive balance has government services (57,4 million of US Dollars), and high negative balance – insurance services (-97,8 million of US Dollars) and other business services (-14,5 million of US Dollars).
taBle 2.2.12. exports of services iN 20032007 years
2003 2004 2005 2006 2007 2007/2006 2007 structure
Mln of USD Percent
exports of services, total 458.0 554.8 715.0 885.0 1 094.1 123.6 100.0
Of which:
Transportation 21�.4 266.0 ��1.8 410.8 511.4 124.5 46.7
Travel 147.1 176.6 241.4 �12.6 �8�.7 122.8 �5.1
Communications services 24.2 17.7 19.8 17.5 14.5 82.6 1.�
Construction services 0.0 0.0 0.0 0.0 2.8 ... 0.�
Insurance services 9.5 10.0 11.0 1�.4 1�.0 97.1 1.2
Financial services (other than insurance) 10.� 17.4 20.� 18.9 9.1 48.� 0.8
Computer and information services 0.0 0.0 0.1 0.5 1.9 �.5-times 0.2
Royalties and license fees 6.� 7.7 9.� 12.9 10.6 82.2 1.0
Other business services 7.4 10.6 10.8 8.8 20.� 2.�-times 1.9
Personal, cultural, and recreational services 0.2 2.1 �.2 5.5 8.7 157.� 0.8
Government services �9.5 46.6 67.4 84.1 118.0 140.4 10.8
-1200
-800
-400
0
400
800
1200
2003 2004 2005 2006 2007
Million US Dollars
ExportImportBalance
Balance of Payments of Georgia. 2007 2�
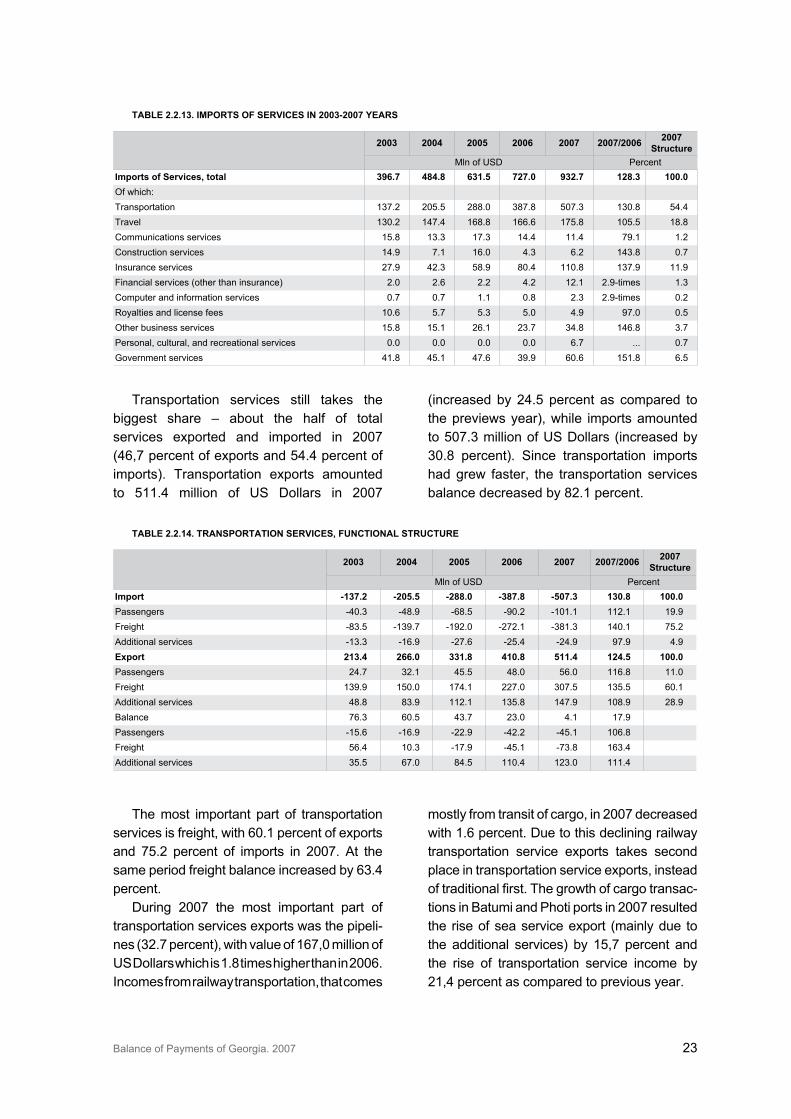
Transportation services still takes the biggest share – about the half of total services exported and imported in 2007 (46,7 percent of exports and 54.4 percent of imports). Transportation exports amounted to 511.4 million of US Dollars in 2007
(increased by 24.5 percent as compared to the previews year), while imports amounted to 507.� million of US Dollars (increased by �0.8 percent). Since transportation imports had grew faster, the transportation services balance decreased by 82.1 percent.
taBle 2.2.13. imports of services iN 20032007 years
2003 2004 2005 2006 2007 2007/2006 2007 structure
Mln of USD Percentimports of services, total 396.7 484.8 631.5 727.0 932.7 128.3 100.0Of which:Transportation 1�7.2 205.5 288.0 �87.8 507.� 1�0.8 54.4Travel 1�0.2 147.4 168.8 166.6 175.8 105.5 18.8Communications services 15.8 1�.� 17.� 14.4 11.4 79.1 1.2Construction services 14.9 7.1 16.0 4.� 6.2 14�.8 0.7Insurance services 27.9 42.� 58.9 80.4 110.8 1�7.9 11.9Financial services (other than insurance) 2.0 2.6 2.2 4.2 12.1 2.9-times 1.�Computer and information services 0.7 0.7 1.1 0.8 2.� 2.9-times 0.2Royalties and license fees 10.6 5.7 5.� 5.0 4.9 97.0 0.5Other business services 15.8 15.1 26.1 2�.7 �4.8 146.8 �.7Personal, cultural, and recreational services 0.0 0.0 0.0 0.0 6.7 ... 0.7Government services 41.8 45.1 47.6 �9.9 60.6 151.8 6.5
taBle 2.2.14. traNsportatioN services, fUNctioNal strUctUre
2003 2004 2005 2006 2007 2007/2006 2007 structure
Mln of USD Percentimport 137.2 205.5 288.0 387.8 507.3 130.8 100.0Passengers -40.� -48.9 -68.5 -90.2 -101.1 112.1 19.9Freight -8�.5 -1�9.7 -192.0 -272.1 -�81.� 140.1 75.2Additional services -1�.� -16.9 -27.6 -25.4 -24.9 97.9 4.9export 213.4 266.0 331.8 410.8 511.4 124.5 100.0Passengers 24.7 �2.1 45.5 48.0 56.0 116.8 11.0Freight 1�9.9 150.0 174.1 227.0 �07.5 1�5.5 60.1Additional services 48.8 8�.9 112.1 1�5.8 147.9 108.9 28.9Balance 76.� 60.5 4�.7 2�.0 4.1 17.9Passengers -15.6 -16.9 -22.9 -42.2 -45.1 106.8Freight 56.4 10.� -17.9 -45.1 -7�.8 16�.4Additional services �5.5 67.0 84.5 110.4 12�.0 111.4
The most important part of transportation services is freight, with 60.1 percent of exports and 75.2 percent of imports in 2007. At the same period freight balance increased by 6�.4 percent.
During 2007 the most important part of transportation services exports was the pipeli-nes (�2.7 percent), with value of 167,0 million of US Dollars which is 1.8 times higher than in 2006. Incomes from railway transportation, that comes
mostly from transit of cargo, in 2007 decreased with 1.6 percent. Due to this declining railway transportation service exports takes second place in transportation service exports, instead of traditional first. The growth of cargo transactions in Batumi and Photi ports in 2007 resulted the rise of sea service export (mainly due to the additional services) by 15,7 percent and the rise of transportation service income by 21,4 percent as compared to previous year.
24 National Bank of Georgia
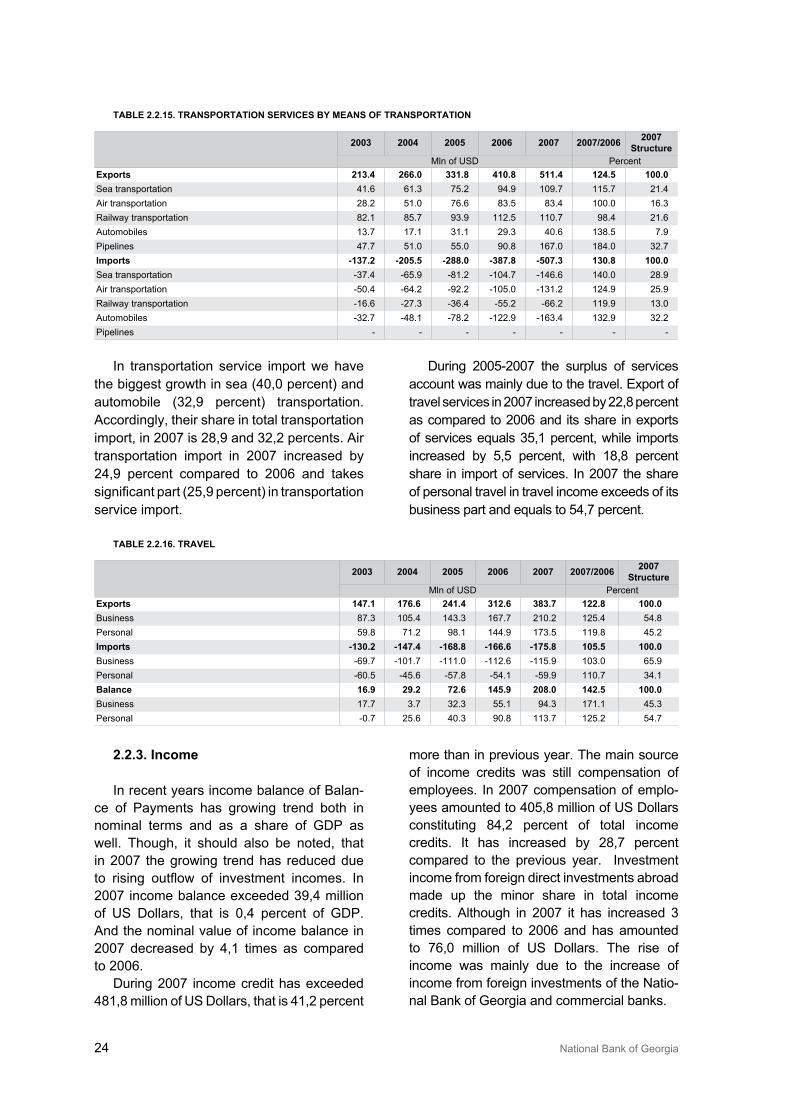
In transportation service import we have the biggest growth in sea (40,0 percent) and automobile (�2,9 percent) transportation. Accordingly, their share in total transportation import, in 2007 is 28,9 and �2,2 percents. Air transportation import in 2007 increased by 24,9 percent compared to 2006 and takes significant part (25,9 percent) in transportation service import.
During 2005-2007 the surplus of services account was mainly due to the travel. Export of travel services in 2007 increased by 22,8 percent as compared to 2006 and its share in exports of services equals �5,1 percent, while imports increased by 5,5 percent, with 18,8 percent share in import of services. In 2007 the share of personal travel in travel income exceeds of its business part and equals to 54,7 percent.
taBle 2.2.15. traNsportatioN services By meaNs of traNsportatioN
2003 2004 2005 2006 2007 2007/2006 2007 structure
Mln of USD Percentexports 213.4 266.0 331.8 410.8 511.4 124.5 100.0Sea transportation 41.6 61.� 75.2 94.9 109.7 115.7 21.4Air transportation 28.2 51.0 76.6 8�.5 8�.4 100.0 16.�Railway transportation 82.1 85.7 9�.9 112.5 110.7 98.4 21.6Automobiles 1�.7 17.1 �1.1 29.� 40.6 1�8.5 7.9Pipelines 47.7 51.0 55.0 90.8 167.0 184.0 �2.7imports 137.2 205.5 288.0 387.8 507.3 130.8 100.0Sea transportation -�7.4 -65.9 -81.2 -104.7 -146.6 140.0 28.9Air transportation -50.4 -64.2 -92.2 -105.0 -1�1.2 124.9 25.9Railway transportation -16.6 -27.� -�6.4 -55.2 -66.2 119.9 1�.0Automobiles -�2.7 -48.1 -78.2 -122.9 -16�.4 1�2.9 �2.2Pipelines - - - - - - -
taBle 2.2.16. travel
2003 2004 2005 2006 2007 2007/2006 2007 structure
Mln of USD Percentexports 147.1 176.6 241.4 312.6 383.7 122.8 100.0Business 87.� 105.4 14�.� 167.7 210.2 125.4 54.8Personal 59.8 71.2 98.1 144.9 17�.5 119.8 45.2imports 130.2 147.4 168.8 166.6 175.8 105.5 100.0Business -69.7 -101.7 -111.0 -112.6 -115.9 10�.0 65.9Personal -60.5 -45.6 -57.8 -54.1 -59.9 110.7 �4.1Balance 16.9 29.2 72.6 145.9 208.0 142.5 100.0Business 17.7 �.7 �2.� 55.1 94.� 171.1 45.�Personal -0.7 25.6 40.� 90.8 11�.7 125.2 54.7
2.2.3. income
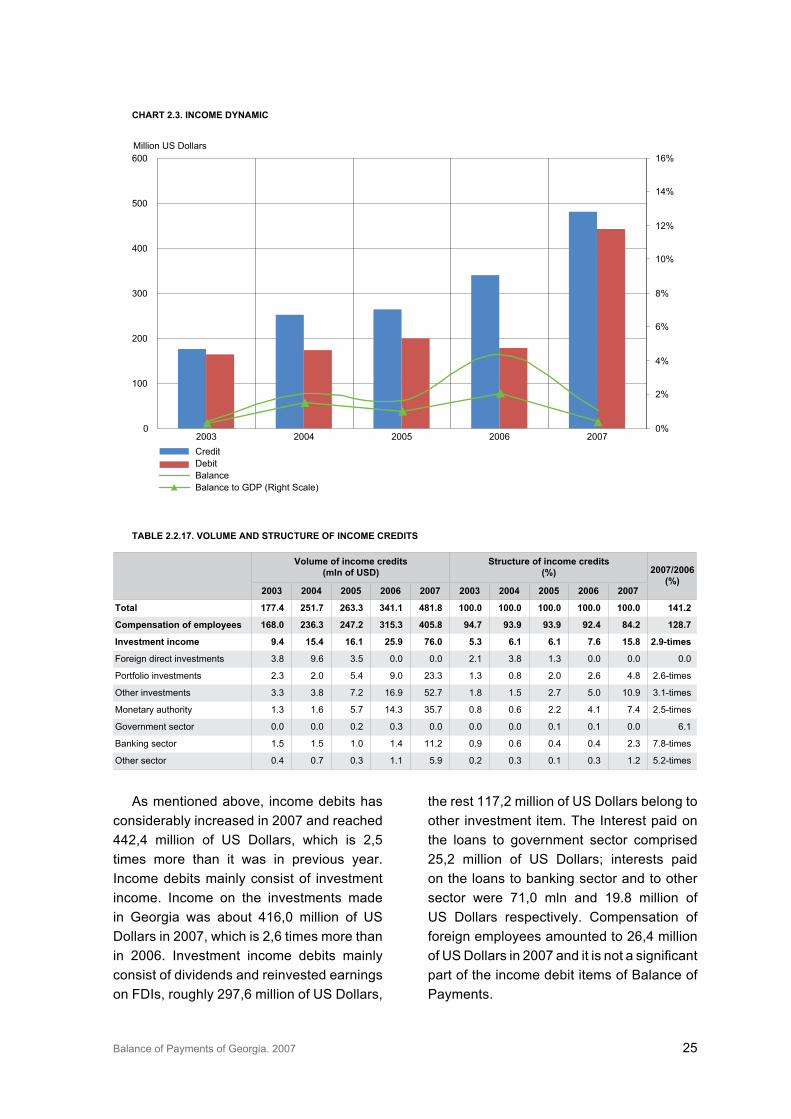
In recent years income balance of Balan-ce of Payments has growing trend both in nominal terms and as a share of GDP as well. Though, it should also be noted, that in 2007 the growing trend has reduced due to rising outflow of investment incomes. In 2007 income balance exceeded �9,4 million of US Dollars, that is 0,4 percent of GDP. And the nominal value of income balance in 2007 decreased by 4,1 times as compared to 2006.
During 2007 income credit has exceeded 481,8 million of US Dollars, that is 41,2 percent
more than in previous year. The main source of income credits was still compensation of employees. In 2007 compensation of emplo-yees amounted to 405,8 million of US Dollars constituting 84,2 percent of total income credits. It has increased by 28,7 percent compared to the previous year. Investment income from foreign direct investments abroad made up the minor share in total income credits. Although in 2007 it has increased � times compared to 2006 and has amounted to 76,0 million of US Dollars. The rise of income was mainly due to the increase of income from foreign investments of the Natio-nal Bank of Georgia and commercial banks.
Balance of Payments of Georgia. 2007 25
As mentioned above, income debits has considerably increased in 2007 and reached 442,4 million of US Dollars, which is 2,5 times more than it was in previous year. Income debits mainly consist of investment income. Income on the investments made in Georgia was about 416,0 million of US Dollars in 2007, which is 2,6 times more than in 2006. Investment income debits mainly consist of dividends and reinvested earnings on FDIs, roughly 297,6 million of US Dollars,
the rest 117,2 million of US Dollars belong to other investment item. The Interest paid on the loans to government sector comprised 25,2 million of US Dollars; interests paid on the loans to banking sector and to other sector were 71,0 mln and 19.8 million of US Dollars respectively. Compensation of foreign employees amounted to 26,4 million of US Dollars in 2007 and it is not a significant part of the income debit items of Balance of Payments.
chart 2.3. iNcome dyNamic
0
100
200
300
400
500
600
2003 2004 2005 2006 20070%
2%
4%
6%
8%
10%
12%
14%
16%Million US Dollars
CreditDebitBalanceBalance to GDP (Right Scale)
taBle 2.2.17. volUme aNd strUctUre of iNcome credits
volume of income credits
(mln of Usd)structure of income credits
(%) 2007/2006(%)
2003 2004 2005 2006 2007 2003 2004 2005 2006 2007
total 177.4 251.7 263.3 341.1 481.8 100.0 100.0 100.0 100.0 100.0 141.2
compensation of employees 168.0 236.3 247.2 315.3 405.8 94.7 93.9 93.9 92.4 84.2 128.7
investment income 9.4 15.4 16.1 25.9 76.0 5.3 6.1 6.1 7.6 15.8 2.9times
Foreign direct investments �.8 9.6 �.5 0.0 0.0 2.1 �.8 1.� 0.0 0.0 0.0
Portfolio investments 2.� 2.0 5.4 9.0 2�.� 1.� 0.8 2.0 2.6 4.8 2.6-times
Other investments �.� �.8 7.2 16.9 52.7 1.8 1.5 2.7 5.0 10.9 �.1-times
Monetary authority 1.� 1.6 5.7 14.� �5.7 0.8 0.6 2.2 4.1 7.4 2.5-times
Government sector 0.0 0.0 0.2 0.� 0.0 0.0 0.0 0.1 0.1 0.0 6.1
Banking sector 1.5 1.5 1.0 1.4 11.2 0.9 0.6 0.4 0.4 2.� 7.8-times
Other sector 0.4 0.7 0.� 1.1 5.9 0.2 0.� 0.1 0.� 1.2 5.2-times
26 National Bank of Georgia
2.2.4. current transfers
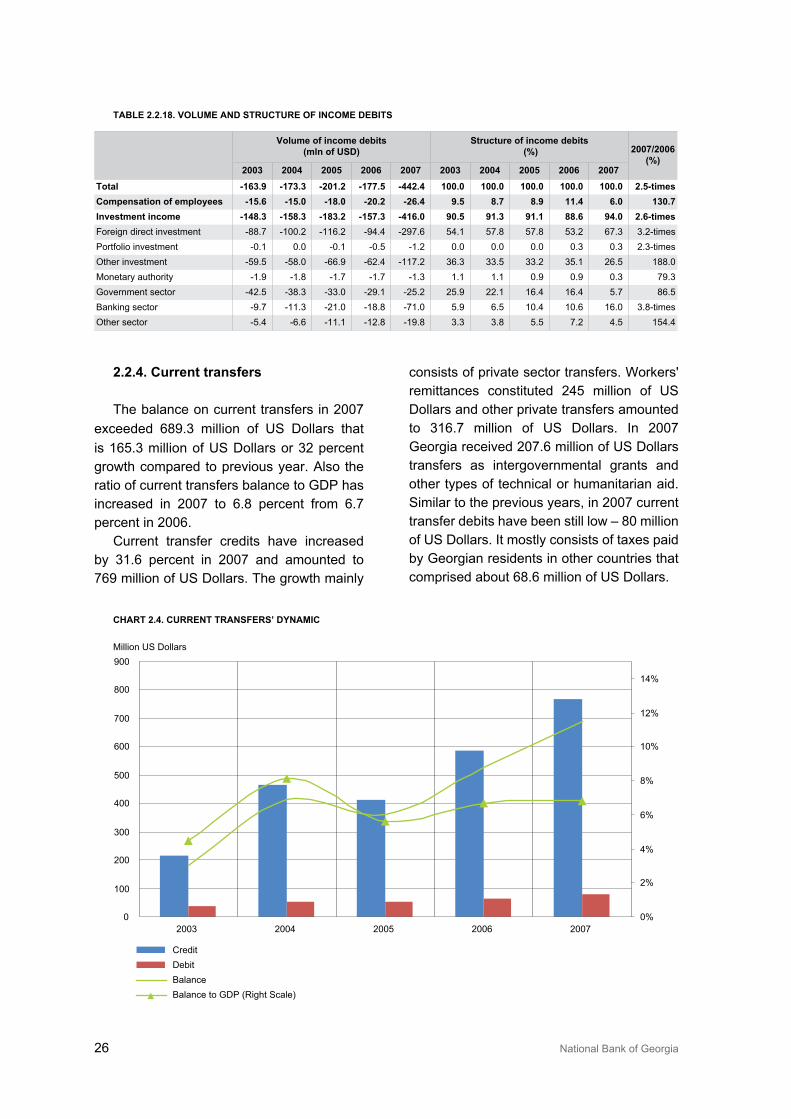
The balance on current transfers in 2007 exceeded 689.� million of US Dollars that is 165.� million of US Dollars or �2 percent growth compared to previous year. Also the ratio of current transfers balance to GDP has increased in 2007 to 6.8 percent from 6.7 percent in 2006.
Current transfer credits have increased by �1.6 percent in 2007 and amounted to 769 million of US Dollars. The growth mainly
consists of private sector transfers. Workers' remittances constituted 245 million of US Dollars and other private transfers amounted to �16.7 million of US Dollars. In 2007 Georgia received 207.6 million of US Dollars transfers as intergovernmental grants and other types of technical or humanitarian aid. Similar to the previous years, in 2007 current transfer debits have been still low – 80 million of US Dollars. It mostly consists of taxes paid by Georgian residents in other countries that comprised about 68.6 million of US Dollars.
taBle 2.2.18. volUme aNd strUctUre of iNcome deBits
volume of income debits
(mln of Usd)structure of income debits
(%) 2007/2006 (%)
2003 2004 2005 2006 2007 2003 2004 2005 2006 2007
total 163.9 173.3 201.2 177.5 442.4 100.0 100.0 100.0 100.0 100.0 2.5timescompensation of employees 15.6 15.0 18.0 20.2 26.4 9.5 8.7 8.9 11.4 6.0 130.7investment income 148.3 158.3 183.2 157.3 416.0 90.5 91.3 91.1 88.6 94.0 2.6timesForeign direct investment -88.7 -100.2 -116.2 -94.4 -297.6 54.1 57.8 57.8 5�.2 67.� �.2-timesPortfolio investment -0.1 0.0 -0.1 -0.5 -1.2 0.0 0.0 0.0 0.� 0.� 2.�-timesOther investment -59.5 -58.0 -66.9 -62.4 -117.2 �6.� ��.5 ��.2 �5.1 26.5 188.0Monetary authority -1.9 -1.8 -1.7 -1.7 -1.� 1.1 1.1 0.9 0.9 0.� 79.�Government sector -42.5 -�8.� -��.0 -29.1 -25.2 25.9 22.1 16.4 16.4 5.7 86.5Banking sector -9.7 -11.� -21.0 -18.8 -71.0 5.9 6.5 10.4 10.6 16.0 �.8-timesOther sector -5.4 -6.6 -11.1 -12.8 -19.8 �.� �.8 5.5 7.2 4.5 154.4
chart 2.4. cUrreNt traNsfers’ dyNamic
0
100
200
300
400
500
600
700
800
900
2003 2004 2005 2006 20070%
2%
4%
6%
8%
10%
12%
14%
Million US Dollars
CreditDebitBalanceBalance to GDP (Right Scale)
Balance of Payments of Georgia. 2007 27
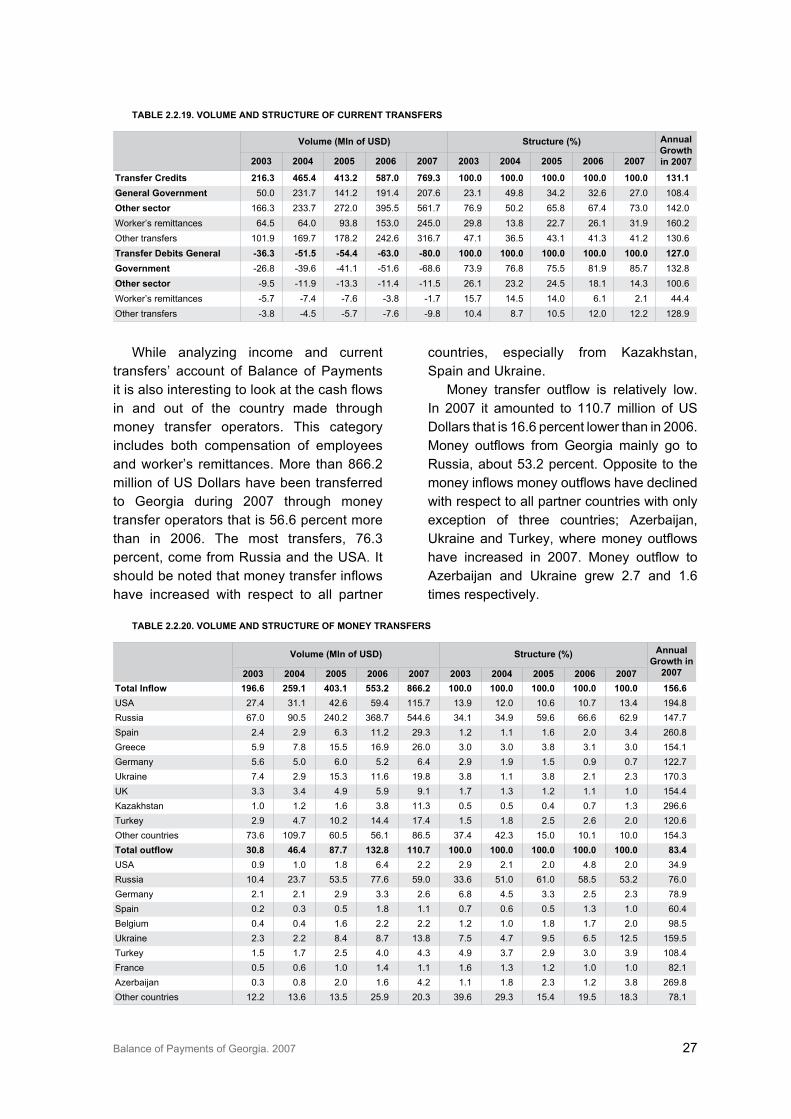
While analyzing income and current transfers’ account of Balance of Payments it is also interesting to look at the cash flows in and out of the country made through money transfer operators. This category includes both compensation of employees and worker’s remittances. More than 866.2 million of US Dollars have been transferred to Georgia during 2007 through money transfer operators that is 56.6 percent more than in 2006. The most transfers, 76.� percent, come from Russia and the USA. It should be noted that money transfer inflows have increased with respect to all partner
countries, especially from Kazakhstan, Spain and Ukraine.
Money transfer outflow is relatively low. In 2007 it amounted to 110.7 million of US Dollars that is 16.6 percent lower than in 2006. Money outflows from Georgia mainly go to Russia, about 5�.2 percent. Opposite to the money inflows money outflows have declined with respect to all partner countries with only exception of three countries; Azerbaijan, Ukraine and Turkey, where money outflows have increased in 2007. Money outflow to Azerbaijan and Ukraine grew 2.7 and 1.6 times respectively.
taBle 2.2.19. volUme aNd strUctUre of cUrreNt traNsfers
volume (mln of Usd) structure (%) annual Growth in 20072003 2004 2005 2006 2007 2003 2004 2005 2006 2007
transfer credits 216.3 465.4 413.2 587.0 769.3 100.0 100.0 100.0 100.0 100.0 131.1General Government 50.0 2�1.7 141.2 191.4 207.6 2�.1 49.8 �4.2 �2.6 27.0 108.4other sector 166.� 2��.7 272.0 �95.5 561.7 76.9 50.2 65.8 67.4 7�.0 142.0Worker’s remittances 64.5 64.0 9�.8 15�.0 245.0 29.8 1�.8 22.7 26.1 �1.9 160.2Other transfers 101.9 169.7 178.2 242.6 �16.7 47.1 �6.5 4�.1 41.� 41.2 1�0.6transfer debits General 36.3 51.5 54.4 63.0 80.0 100.0 100.0 100.0 100.0 100.0 127.0Government -26.8 -�9.6 -41.1 -51.6 -68.6 7�.9 76.8 75.5 81.9 85.7 1�2.8other sector -9.5 -11.9 -1�.� -11.4 -11.5 26.1 2�.2 24.5 18.1 14.� 100.6Worker’s remittances -5.7 -7.4 -7.6 -�.8 -1.7 15.7 14.5 14.0 6.1 2.1 44.4Other transfers -�.8 -4.5 -5.7 -7.6 -9.8 10.4 8.7 10.5 12.0 12.2 128.9
taBle 2.2.20. volUme aNd strUctUre of moNey traNsfers
volume (mln of Usd) structure (%) annual
Growth in 20072003 2004 2005 2006 2007 2003 2004 2005 2006 2007
Total Inflow 196.6 259.1 403.1 553.2 866.2 100.0 100.0 100.0 100.0 100.0 156.6USA 27.4 �1.1 42.6 59.4 115.7 1�.9 12.0 10.6 10.7 1�.4 194.8Russia 67.0 90.5 240.2 �68.7 544.6 �4.1 �4.9 59.6 66.6 62.9 147.7Spain 2.4 2.9 6.� 11.2 29.� 1.2 1.1 1.6 2.0 �.4 260.8Greece 5.9 7.8 15.5 16.9 26.0 �.0 �.0 �.8 �.1 �.0 154.1Germany 5.6 5.0 6.0 5.2 6.4 2.9 1.9 1.5 0.9 0.7 122.7Ukraine 7.4 2.9 15.� 11.6 19.8 �.8 1.1 �.8 2.1 2.� 170.�UK �.� �.4 4.9 5.9 9.1 1.7 1.� 1.2 1.1 1.0 154.4Kazakhstan 1.0 1.2 1.6 �.8 11.� 0.5 0.5 0.4 0.7 1.� 296.6Turkey 2.9 4.7 10.2 14.4 17.4 1.5 1.8 2.5 2.6 2.0 120.6Other countries 7�.6 109.7 60.5 56.1 86.5 �7.4 42.� 15.0 10.1 10.0 154.�Total outflow 30.8 46.4 87.7 132.8 110.7 100.0 100.0 100.0 100.0 100.0 83.4USA 0.9 1.0 1.8 6.4 2.2 2.9 2.1 2.0 4.8 2.0 �4.9Russia 10.4 2�.7 5�.5 77.6 59.0 ��.6 51.0 61.0 58.5 5�.2 76.0Germany 2.1 2.1 2.9 �.� 2.6 6.8 4.5 �.� 2.5 2.� 78.9Spain 0.2 0.� 0.5 1.8 1.1 0.7 0.6 0.5 1.� 1.0 60.4Belgium 0.4 0.4 1.6 2.2 2.2 1.2 1.0 1.8 1.7 2.0 98.5Ukraine 2.� 2.2 8.4 8.7 1�.8 7.5 4.7 9.5 6.5 12.5 159.5Turkey 1.5 1.7 2.5 4.0 4.� 4.9 �.7 2.9 �.0 �.9 108.4France 0.5 0.6 1.0 1.4 1.1 1.6 1.� 1.2 1.0 1.0 82.1Azerbaijan 0.� 0.8 2.0 1.6 4.2 1.1 1.8 2.� 1.2 �.8 269.8Other countries 12.2 1�.6 1�.5 25.9 20.� �9.6 29.� 15.4 19.5 18.� 78.1
28 National Bank of Georgia
2.3. capital and financial account
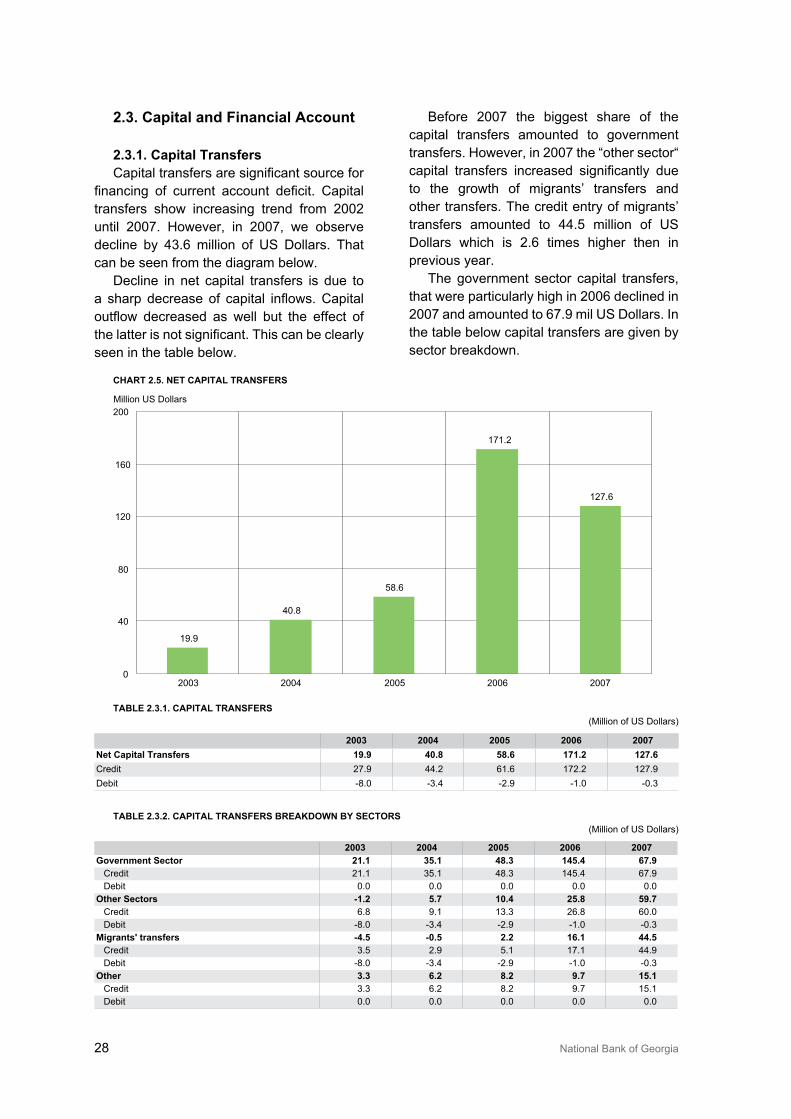
2.3.1. capital transfersCapital transfers are significant source for
financing of current account deficit. Capital transfers show increasing trend from 2002 until 2007. However, in 2007, we observe decline by 4�.6 million of US Dollars. That can be seen from the diagram below.
Decline in net capital transfers is due to a sharp decrease of capital inflows. Capital outflow decreased as well but the effect of the latter is not significant. This can be clearly seen in the table below.
Before 2007 the biggest share of the capital transfers amounted to government transfers. However, in 2007 the “other sector“ capital transfers increased significantly due to the growth of migrants’ transfers and other transfers. The credit entry of migrants’ transfers amounted to 44.5 million of US Dollars which is 2.6 times higher then in previous year.
The government sector capital transfers, that were particularly high in 2006 declined in 2007 and amounted to 67.9 mil US Dollars. In the table below capital transfers are given by sector breakdown.
chart 2.5. Net capital traNsfers
taBle 2.3.1. capital traNsfers(Million of US Dollars)
2003 2004 2005 2006 2007Net capital transfers 19.9 40.8 58.6 171.2 127.6Credit 27.9 44.2 61.6 172.2 127.9Debit -8.0 -�.4 -2.9 -1.0 -0.�
taBle 2.3.2. capital traNsfers BreakdowN By sectors (Million of US Dollars)
2003 2004 2005 2006 2007Government sector 21.1 35.1 48.3 145.4 67.9
Credit 21.1 �5.1 48.� 145.4 67.9Debit 0.0 0.0 0.0 0.0 0.0
other sectors 1.2 5.7 10.4 25.8 59.7Credit 6.8 9.1 1�.� 26.8 60.0Debit -8.0 -�.4 -2.9 -1.0 -0.�
migrants' transfers 4.5 0.5 2.2 16.1 44.5Credit �.5 2.9 5.1 17.1 44.9Debit -8.0 -�.4 -2.9 -1.0 -0.�
other 3.3 6.2 8.2 9.7 15.1Credit �.� 6.2 8.2 9.7 15.1Debit 0.0 0.0 0.0 0.0 0.0
19.9
40.8
58.6
171.2
127.6
0
40
80
120
160
200
2003 2004 2005 2006 2007
Million US Dollars
Balance of Payments of Georgia. 2007 29
There were no records made in the other component of the capital account – “Acquisition/disposal of non-produced, nonfinancial assets“ in 2007. More detailed information on capital account and capital transfers are given in the appendix 2 and �.
2.3.2 foreign direct investment
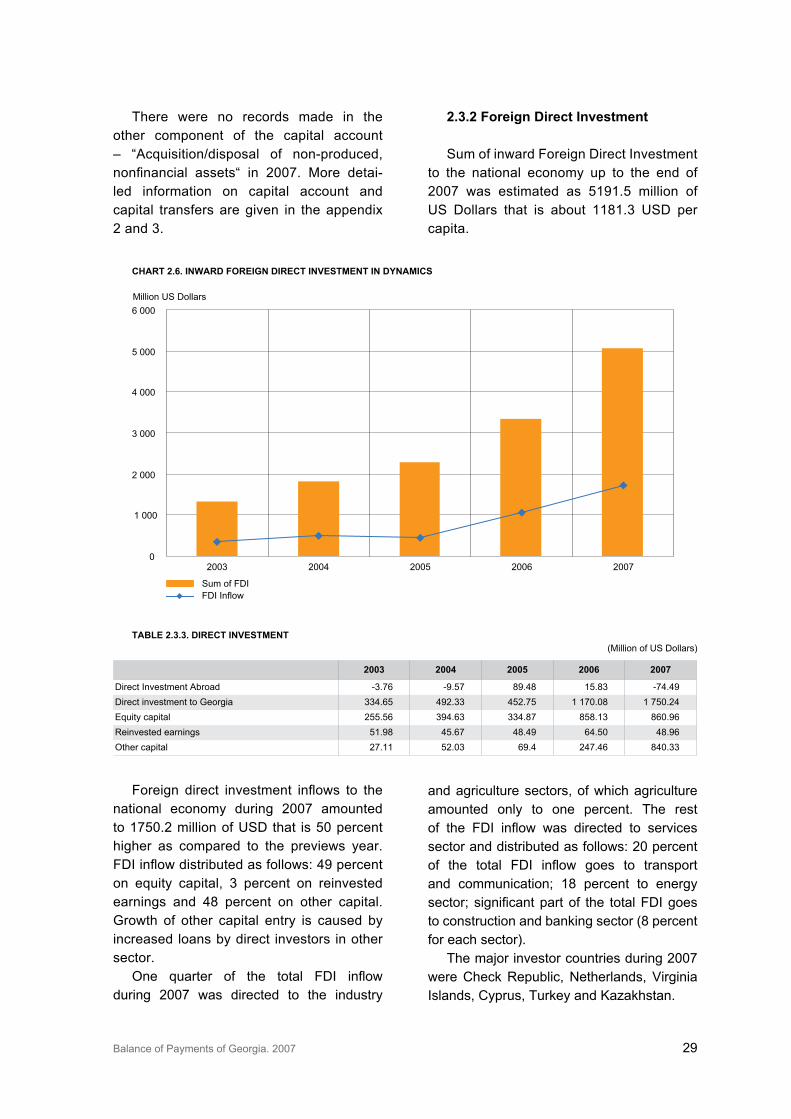
Sum of inward Foreign Direct Investment to the national economy up to the end of 2007 was estimated as 5191.5 million of US Dollars that is about 1181.� USD per capita.
chart 2.6. iNward foreiGN direct iNvestmeNt iN dyNamics
0
1 000
2 000
3 000
4 000
5 000
6 000
2003 2004 2005 2006 2007
Million US Dollars
Sum of FDIFDI Inflow
taBle 2.3.3. direct iNvestmeNt (Million of US Dollars)
2003 2004 2005 2006 2007
Direct Investment Abroad -�.76 -9.57 89.48 15.8� -74.49Direct investment to Georgia ��4.65 492.�� 452.75 1 170.08 1 750.24Equity capital 255.56 �94.6� ��4.87 858.1� 860.96Reinvested earnings 51.98 45.67 48.49 64.50 48.96Other capital 27.11 52.0� 69.4 247.46 840.��
Foreign direct investment inflows to the national economy during 2007 amounted to 1750.2 million of USD that is 50 percent higher as compared to the previews year. FDI inflow distributed as follows: 49 percent on equity capital, � percent on reinvested earnings and 48 percent on other capital. Growth of other capital entry is caused by increased loans by direct investors in other sector.
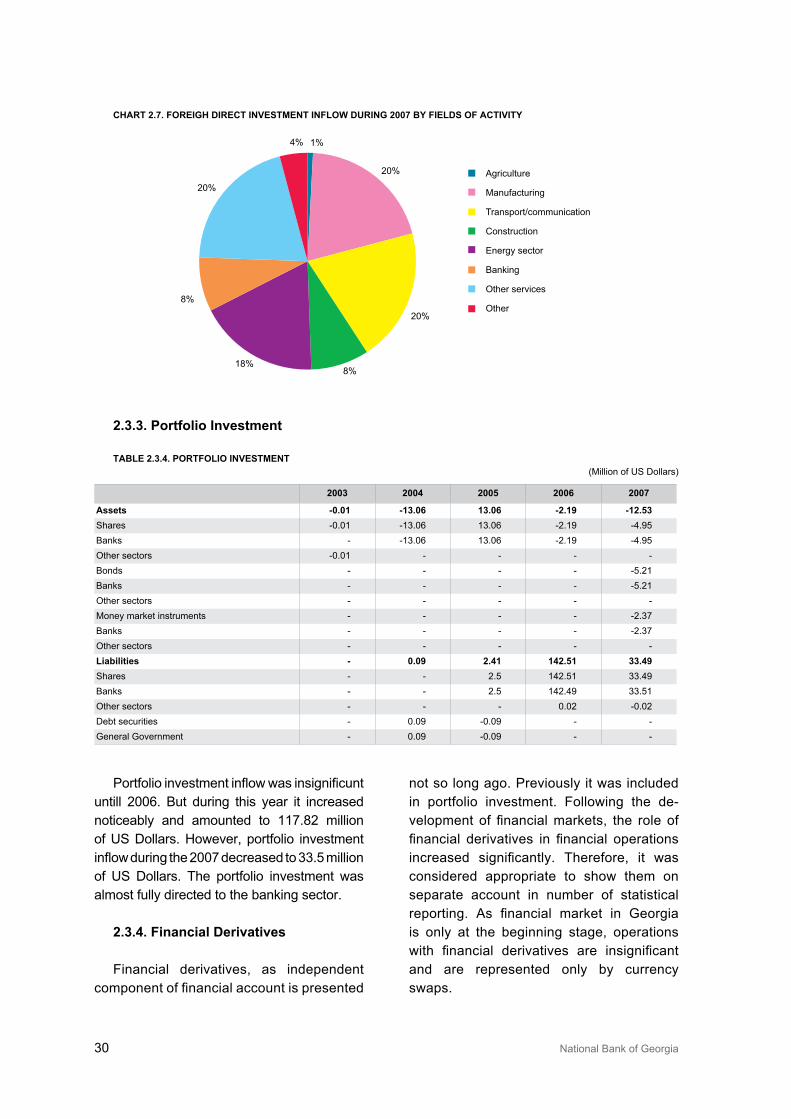
One quarter of the total FDI inflow during 2007 was directed to the industry
and agriculture sectors, of which agriculture amounted only to one percent. The rest of the FDI inflow was directed to services sector and distributed as follows: 20 percent of the total FDI inflow goes to transport and communication; 18 percent to energy sector; significant part of the total FDI goes to construction and banking sector (8 percent for each sector).
The major investor countries during 2007 were Check Republic, Netherlands, Virginia Islands, Cyprus, Turkey and Kazakhstan.
�0 National Bank of Georgia
Portfolio investment inflow was insignificunt untill 2006. But during this year it increased noticeably and amounted to 117.82 million of US Dollars. However, portfolio investment inflow during the 2007 decreased to 33.5 million of US Dollars. The portfolio investment was almost fully directed to the banking sector.
2.3.4. financial derivatives
Financial derivatives, as independent component of financial account is presented
not so long ago. Previously it was included in portfolio investment. Following the de-velopment of financial markets, the role of financial derivatives in financial operations increased significantly. Therefore, it was considered appropriate to show them on separate account in number of statistical reporting. As financial market in Georgia is only at the beginning stage, operations with financial derivatives are insignificant and are represented only by currency swaps.
chart 2.7. foreiGh direct iNvestmeNt iNflow dUriNG 2007 By fields of activity
1%
20%
20%
8%18%
8%
20%
4%
Agriculture
Manufacturing
Transport/communication
Construction
Energy sector
Banking
Other services
Other
2.3.3. portfolio investment
taBle 2.3.4. portfolio iNvestmeNt (Million of US Dollars)
2003 2004 2005 2006 2007
assets 0.01 13.06 13.06 2.19 12.53Shares -0.01 -1�.06 1�.06 -2.19 -4.95Banks - -1�.06 1�.06 -2.19 -4.95Other sectors -0.01 - - - -Bonds - - - - -5.21Banks - - - - -5.21Other sectors - - - - -Money market instruments - - - - -2.�7Banks - - - - -2.�7Other sectors - - - - -liabilities 0.09 2.41 142.51 33.49Shares - - 2.5 142.51 ��.49Banks - - 2.5 142.49 ��.51Other sectors - - - 0.02 -0.02Debt securities - 0.09 -0.09 - -General Government - 0.09 -0.09 - -
Balance of Payments of Georgia. 2007 �1
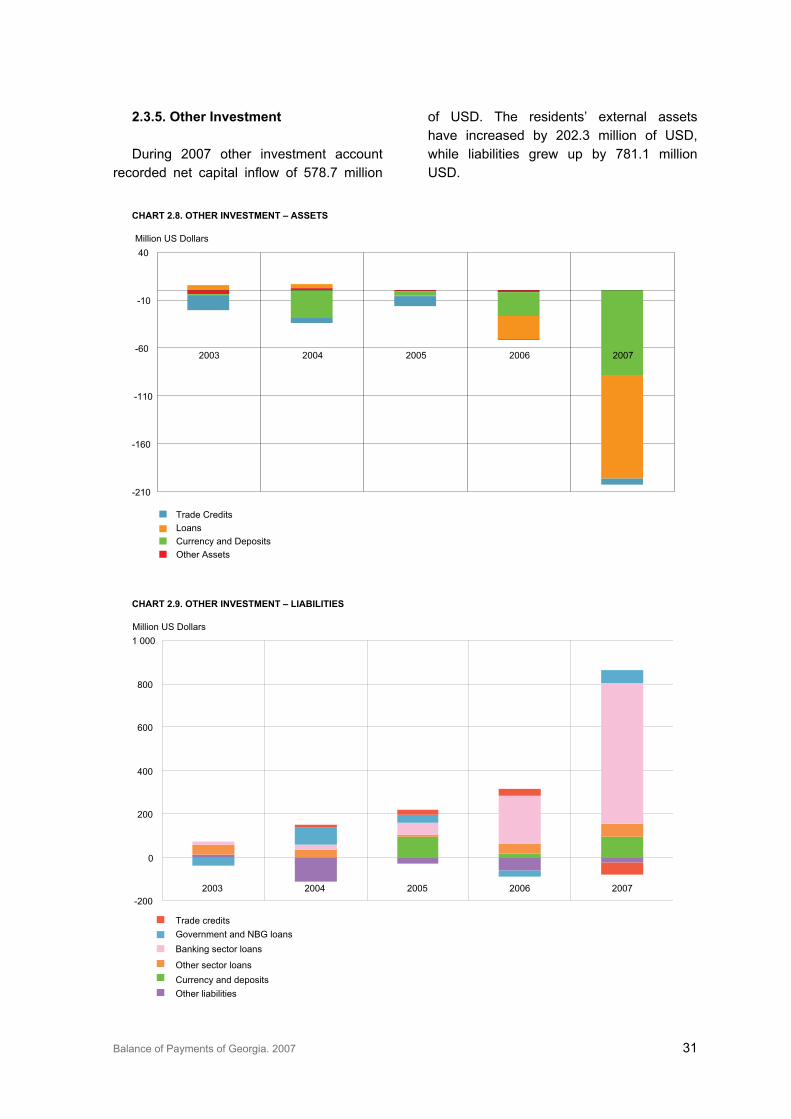
2.3.5. other investment
During 2007 other investment account recorded net capital inflow of 578.7 million
of USD. The residents’ external assets have increased by 202.� million of USD, while liabilities grew up by 781.1 million USD.
chart 2.8. other iNvestmeNt – assets
-210
-160
-110
-60
-10
40
2003 2004 2005 2006 2007
Trade CreditsLoansCurrency and DepositsOther Assets
Million US Dollars
chart 2.9. other iNvestmeNt – liaBilities
-200
0
200
400
600
800
1 000
2003 2004 2005 2006 2007
Million US Dollars
Trade creditsGovernment and NBG loansBanking sector loans
Other sector loansCurrency and depositsOther liabilities
�2 National Bank of Georgia
Increase of other investment asset posi-tion was due to increase of loans and fore-ign deposits. Increase of loans on asset side occurred in all sectors except for go-vernment sector. Growth of loan assets of National Bank of Georgia by 44.8 million of US Dollars is due to the letters of credit accounts. The lending of Banking sector increased by 51 million of US Dollars and those of other sector – by 11.8 million of US Dollars. As for currency and deposits, an asset
of banking sector has grown by 147.9 million of US Dollars during the accounting period.
On liability side, debt liabilities of govern-ment sector increased by 111.� million of US Dollars, those of banking sector by 647.1 million of US Dollars and other sector debt increased by 6�.� million of US Dollars. Generally debts are of long-term.
General government accumulated ar-rears decreased by �4.9 million of US Dollars during 2007.
taBle 2.3.5. loNGterm exterNal deBt (Million of US Dollars)
2002 2003 2004 2005 2006
Monetary authorities -47.96 -��.82 -12.87 -8.0� -5�.4�
Use of fund credits and loans -47.47 -�4.�� -12.7� -7.89 �.14
Drawings 0.00 20.47 41.80 40.91 42.60
Repayments -47.47 -54.80 -54.5� -48.80 -�9.46
Other long-term -0.48 0.51 -0.14 -0.14 -56.57
Drawings 0.00 0.79 0.�8 0.41 0.00
Repayments -0.48 0.28 0.52 0.55 -56.57
Government loans 14.77 110.59 48.�8 -21.89 111.05
Drawings 71.80 184.06 122.�1 149.28 156.02
Repayments -57.02 -7�.47 -7�.94 -171.17 -44.97
Banking loans 8.49 21.26 46.56 187.02 565.71
Drawings 71.22 94.12 148.8� 2�1.29 720.98
Repayments -62.7� -72.87 -102.27 -44.27 -155.27
Other sectors’ loans 47.96 ��.88 6.97 �4.96 79.04
Drawings 60.2� 42.�9 26.05 54.�4 116.04
Repayments -12.27 -8.51 -19.08 -19.�9 -�6.99
taBle 2.3.6. GeNeral accUmUlated GoverNmeNt arrears(Million of US Dollars)
2002 2003 2004 2005 2006
Net accumulated arrears 10.08 -119.01 -�5.97 -86.6 -�4.88
Accumulation of principal arrears 50.88 29.66 14.� 0.�7 0.00
Accumulation of interest arrears 18.19 15.18 12.14 4.99 1.54
Repayment of principal arrears -47 -102.49 -56.99 -64.72 -�6.4�
Repayment of interest arrears -11.99 -6.79 -5.41 -6.45 -
Rescheduling of principal arrears - -54.42 - - -
Rescheduling of interest arrears - -0.15 - - -
Cancellation of principal arrears - - - -15.19 -
Cancellation of interest arrears - - - -5.6 -
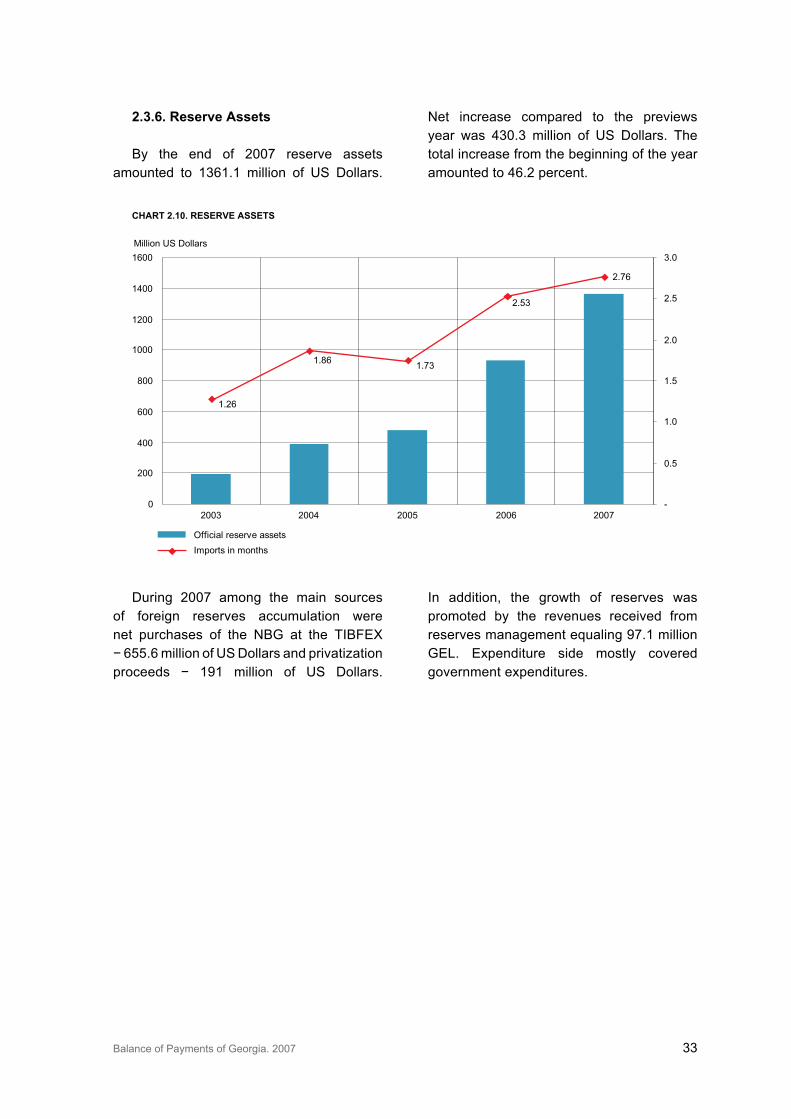
Balance of Payments of Georgia. 2007 ��
2.3.6. reserve assets
By the end of 2007 reserve assets amounted to 1�61.1 million of US Dollars.
Net increase compared to the previews year was 4�0.� million of US Dollars. The total increase from the beginning of the year amounted to 46.2 percent.
chart 2.10. reserve assets
1.26
1.86 1.73
2.53
2.76
0
200
400
600
800
1000
1200
1400
1600
2003 2004 2005 2006 2007-
0.5
1.0
1.5
2.0
2.5
3.0
Million US Dollars
Official reserve assetsImports in months
During 2007 among the main sources of foreign reserves accumulation were net purchases of the NBG at the TIBFEX − 655.6 million of US Dollars and privatization proceeds − 191 million of US Dollars.
In addition, the growth of reserves was promoted by the revenues received from reserves management equaling 97.1 million GEL. Expenditure side mostly covered government expenditures.
�4 National Bank of Georgia
3. iNterNatioNal iNvestmeNt positioN
International investment position of Georgia covering the whole economy has not been compiled until 2007. The National Bank of Georgia was compiling international investment position of only banking sector. Other sectors, which is quite significant part of the economy, were not included.
From 2007 Georgia subscribed for General Data dissemination System and with this took the responsibility of compiling international investment position of the country covering all sectors at least on annual basis according to international standards. Present report provides the full statistical data reflecting international investment position of Georgia for 2007. From the next year NBG intends to compile IIP on a quarterly basis. Below in the table 3.1 you can find short version of international investment position of Georgia, the full version is cited in the appendix. For the �1 of December of 2007 the international investment position of Georgia is negative and amounts to -71�9.4 million of US Dollars, compared to -5061,5 million of US Dollars for the end of 2006. As we can see, the international investment position has worsened by 2088.5 million of US Dollars or by 41.� percent, which is due to increased foreign investments in 2007 on one hand and current account deficit on the other hand.
By the end of 2007 the volume of total foreign assets amounted to 1,�99.7 million of US Dollars. During 2007 it has increased by 74�.7 million of US Dollars and by the end of the accounted period made up 214�.4 million of US Dollars. The main part of assets is represented by international reserves of the National Bank of Georgia − 67 percent of total assets at the end of the 2007, as compared to 6� percent in 2006. The important part of foreign assets comes from other investments, about 687.4 million of US Dollars, represented by currency and deposits and trade credits.
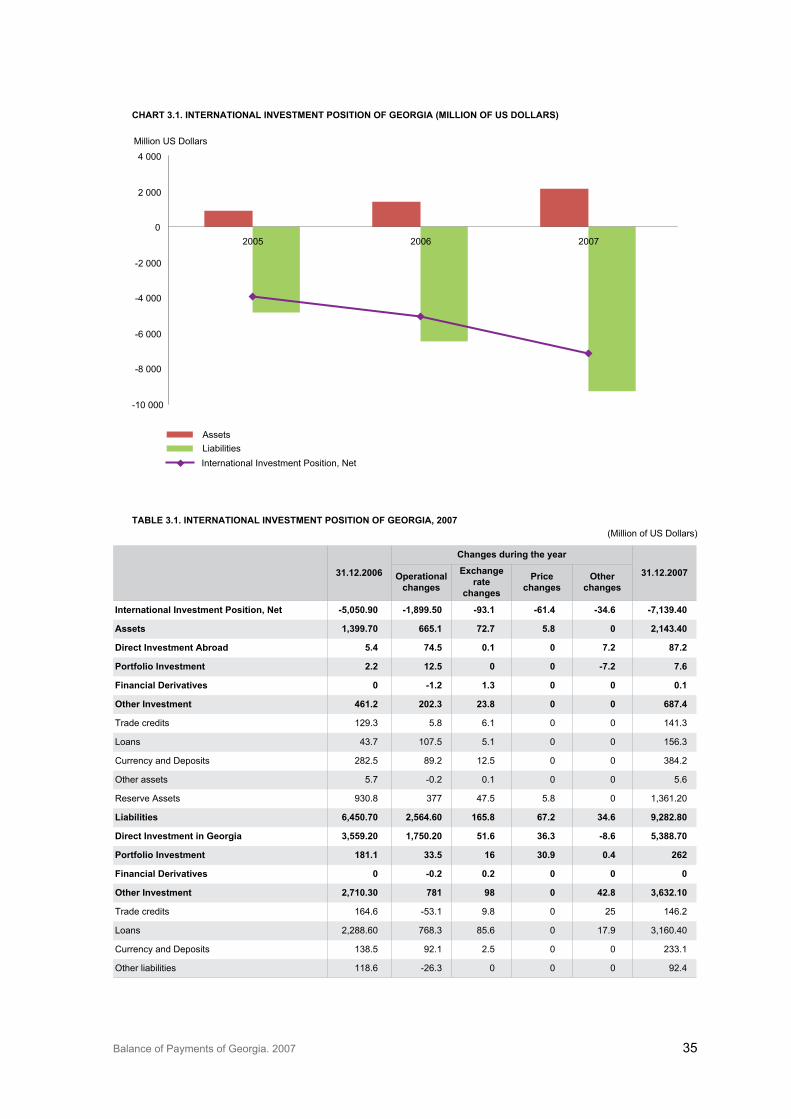
Balance of Payments of Georgia. 2007 �5
chart 3.1. iNterNatioNal iNvestmeNt positioN of GeorGia (millioN of Us dollars)
-10 000
-8 000
-6 000
-4 000
-2 000
0
2 000
4 000
2005 2006 2007
Million US Dollars
International Investment Position, Net
AssetsLiabilities
taBle 3.1. iNterNatioNal iNvestmeNt positioN of GeorGia, 2007 (Million of US Dollars)
31.12.2006
changes during the year
31.12.2007operational changes
exchange rate
changes
price changes
other changes
international investment position, Net 5,050.90 1,899.50 93.1 61.4 34.6 7,139.40
assets 1,399.70 665.1 72.7 5.8 0 2,143.40
direct investment abroad 5.4 74.5 0.1 0 7.2 87.2
portfolio investment 2.2 12.5 0 0 7.2 7.6
financial derivatives 0 1.2 1.3 0 0 0.1
other investment 461.2 202.3 23.8 0 0 687.4
Trade credits 129.� 5.8 6.1 0 0 141.�
Loans 4�.7 107.5 5.1 0 0 156.�
Currency and Deposits 282.5 89.2 12.5 0 0 �84.2
Other assets 5.7 -0.2 0.1 0 0 5.6
Reserve Assets 9�0.8 �77 47.5 5.8 0 1,�61.20
liabilities 6,450.70 2,564.60 165.8 67.2 34.6 9,282.80
direct investment in Georgia 3,559.20 1,750.20 51.6 36.3 8.6 5,388.70
portfolio investment 181.1 33.5 16 30.9 0.4 262
financial derivatives 0 0.2 0.2 0 0 0
other investment 2,710.30 781 98 0 42.8 3,632.10
Trade credits 164.6 -5�.1 9.8 0 25 146.2
Loans 2,288.60 768.� 85.6 0 17.9 �,160.40
Currency and Deposits 1�8.5 92.1 2.5 0 0 2��.1
Other liabilities 118.6 -26.� 0 0 0 92.4
�6 National Bank of Georgia
By the end of 2006 total foreign liabilities amounted to 6450.7 million of US Dollars. During 2007 liabilities have increased by 28�2.2 (4�.9 percent) and reached 9282.8 million of US Dollars by the end of accounting period. More than half of the foreign liabilities comprise direct investments – 5�88.7 million of US Dollars. Other investments are also significant part of total liabilities (3632.1 million of US Dollars) that mostly consist of loans from non-residents.
During 2007 the portfolio investment item in the liabilities of IIP has increased and due to the sizeable exchange rate changes has amounted to 262.0 million of US Dollars. That was caused by several reasons: portfolio investments (equaled ��.5 million of US Dollars) realized in the banking sector; price changes provoking �0.9 million of US Dollars increase in the same banking; reclassification of some
direct investments into portfolio investments.Increase in liabilities by 2564.6 million of
US Dollars mainly was due to the operational changes, 68.2 percent of which is foreign direct investments that is good news for Georgia. Loans received from external sector are also quite significant part of operational changes of total liabilities with �0 percent. The change of 5.9 percent in total liabilities is due to exchange rate changes. Main reason behind this is depreciation of USD both against Lari and EURO. Other factors’ influence on changes in total liabilities was quite insignificant. Changes in total liabilities due to price changes and other changes amounted to 67.2 and �4.6 million of US Dollars respectively. As a result, by the end of 2007 net international investment position exceeded -7 billion and amounted to -71�9.4 million of US Dollars.
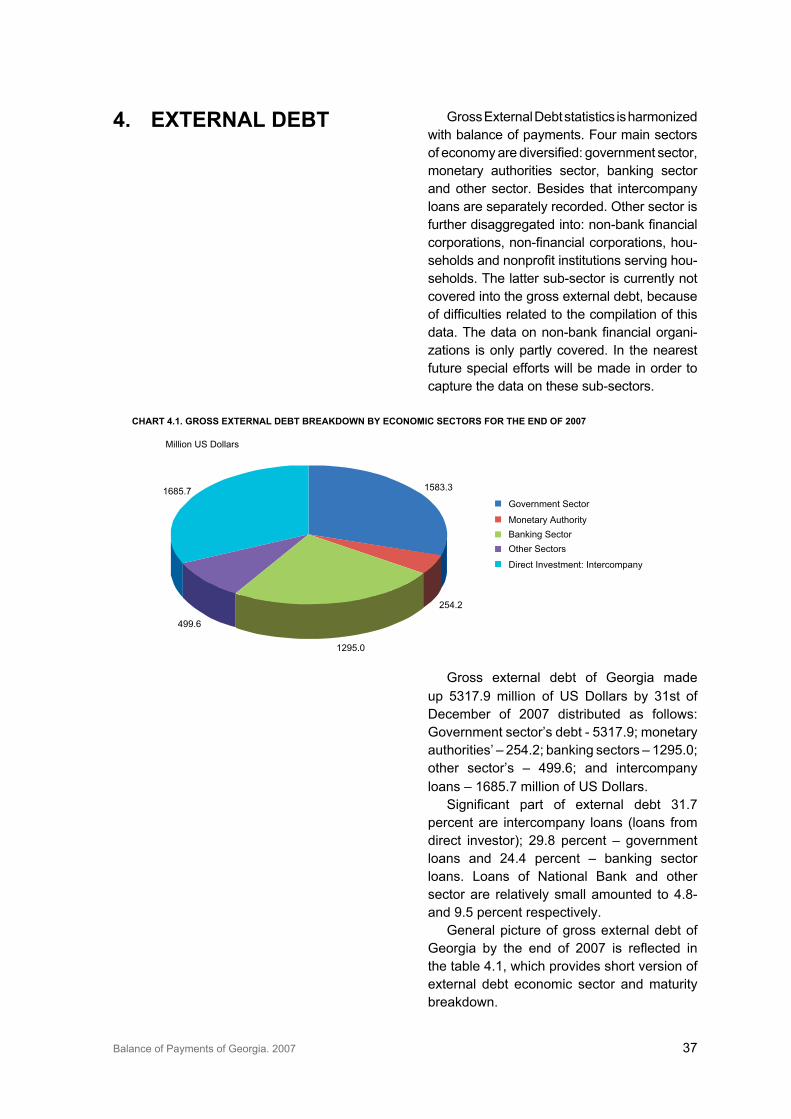
Balance of Payments of Georgia. 2007 �7
4. exterNal deBt Gross External Debt statistics is harmonized with balance of payments. Four main sectors of economy are diversified: government sector, monetary authorities sector, banking sector and other sector. Besides that intercompany loans are separately recorded. Other sector is further disaggregated into: nonbank financial corporations, nonfinancial corporations, households and nonprofit institutions serving households. The latter sub-sector is currently not covered into the gross external debt, because of difficulties related to the compilation of this data. The data on nonbank financial organizations is only partly covered. In the nearest future special efforts will be made in order to capture the data on these sub-sectors.
chart 4.1. Gross exterNal deBt BreakdowN By ecoNomic sectors for the eNd of 2007
1583.3
254.2
1295.0
499.6
1685.7
Million US Dollars
Government Sector
Monetary AuthorityBanking SectorOther Sectors
Direct Investment: Intercompany
Gross external debt of Georgia made up 5�17.9 million of US Dollars by �1st of December of 2007 distributed as follows: Government sector’s debt - 5�17.9; monetary authorities’ – 254.2; banking sectors – 1295.0; other sector’s – 499.6; and intercompany loans – 1685.7 million of US Dollars.
Significant part of external debt 31.7 percent are intercompany loans (loans from direct investor); 29.8 percent – government loans and 24.4 percent – banking sector loans. Loans of National Bank and other sector are relatively small amounted to 4.8- and 9.5 percent respectively.
General picture of gross external debt of Georgia by the end of 2007 is reflected in the table 4.1, which provides short version of external debt economic sector and maturity breakdown.
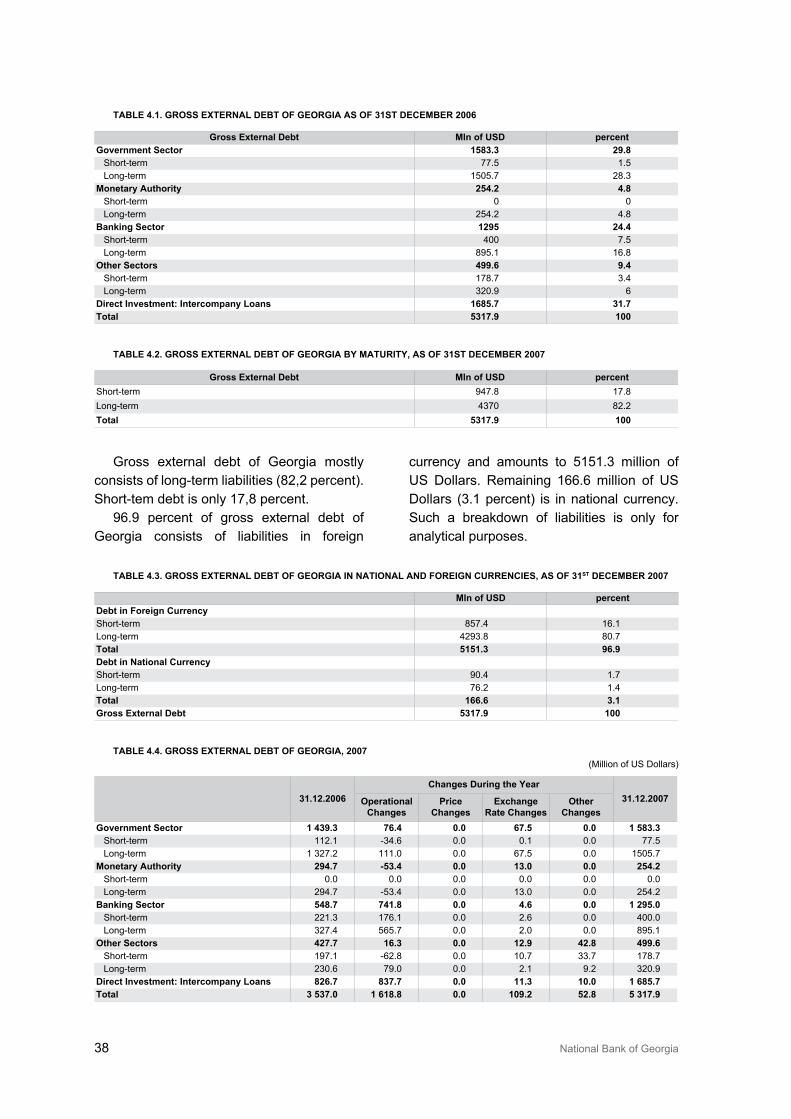
�8 National Bank of Georgia
Gross external debt of Georgia mostly consists of long-term liabilities (82,2 percent). Short-tem debt is only 17,8 percent.
96.9 percent of gross external debt of Georgia consists of liabilities in foreign
currency and amounts to 5151.� million of US Dollars. Remaining 166.6 million of US Dollars (�.1 percent) is in national currency. Such a breakdown of liabilities is only for analytical purposes.
taBle 4.1. Gross exterNal deBt of GeorGia as of 31st decemBer 2006
Gross external debt mln of Usd percentGovernment sector 1583.3 29.8
Short-term 77.5 1.5Long-term 1505.7 28.�
monetary authority 254.2 4.8Short-term 0 0Long-term 254.2 4.8
Banking sector 1295 24.4Short-term 400 7.5Long-term 895.1 16.8
other sectors 499.6 9.4Short-term 178.7 �.4Long-term �20.9 6
direct investment: intercompany loans 1685.7 31.7total 5317.9 100
taBle 4.2. Gross exterNal deBt of GeorGia By matUrity, as of 31st decemBer 2007
Gross external debt mln of Usd percentShort-term 947.8 17.8Long-term 4�70 82.2total 5317.9 100
taBle 4.3. Gross exterNal deBt of GeorGia iN NatioNal aNd foreiGN cUrreNcies, as of 31st decemBer 2007
mln of Usd percentdebt in foreign currencyShort-term 857.4 16.1Long-term 429�.8 80.7total 5151.3 96.9debt in National currencyShort-term 90.4 1.7Long-term 76.2 1.4total 166.6 3.1Gross external debt 5317.9 100
taBle 4.4. Gross exterNal deBt of GeorGia, 2007 (Million of US Dollars)
31.12.2006changes during the year
31.12.2007operational changes
price changes
exchange rate changes
other changes
Government sector 1 439.3 76.4 0.0 67.5 0.0 1 583.3Short-term 112.1 -�4.6 0.0 0.1 0.0 77.5Long-term 1 �27.2 111.0 0.0 67.5 0.0 1505.7
monetary authority 294.7 53.4 0.0 13.0 0.0 254.2Short-term 0.0 0.0 0.0 0.0 0.0 0.0Long-term 294.7 -5�.4 0.0 1�.0 0.0 254.2
Banking sector 548.7 741.8 0.0 4.6 0.0 1 295.0Short-term 221.� 176.1 0.0 2.6 0.0 400.0Long-term �27.4 565.7 0.0 2.0 0.0 895.1
other sectors 427.7 16.3 0.0 12.9 42.8 499.6Short-term 197.1 -62.8 0.0 10.7 ��.7 178.7Long-term 2�0.6 79.0 0.0 2.1 9.2 �20.9
direct investment: intercompany loans 826.7 837.7 0.0 11.3 10.0 1 685.7total 3 537.0 1 618.8 0.0 109.2 52.8 5 317.9
Balance of Payments of Georgia. 2007 �9
During 2007 total external debt of Georgia increased by 1780.8 million of US Dollars 48.2 percent of which (750 million of US Dollars) is intercompany debt and 41.9 percent (746.4 million of USD) is the banking sector debt. External debt of the National Bank has decreased by 40.5 million of US Dollars due to debt reclassification from the National Bank to the General government. As for currency composition, 1759.0 million of US Dollars from total increase is in foreign currency and 21.8 million of US Dollars – in national currency.
The main factors contributing to debt increase are new borrowings and depreciation of USD against other currencies, particularly
against Euro and SDR. During 2007 exchange rate changes amounted to 109.2 million of US Dollars. Predominantly significant contribution of exchange rate changes took place for the NBG and the government sector; particularly 1�.0 million of US Dollars for the NBG and 67.5 million of US Dollars for the government. Those sectors have large amount of foreign debt in SDR (World Bank debt) and Euro.
As for intercompany and banking sector external debt, 97.5- and 99.4 percent increase respectively are caused by operational changes. Exchange rate changes for above categories were insignificant and amounted to 11.� million of US Dollars for intercompany loans and 4.6 million of US Dollars for the banking sector loans.
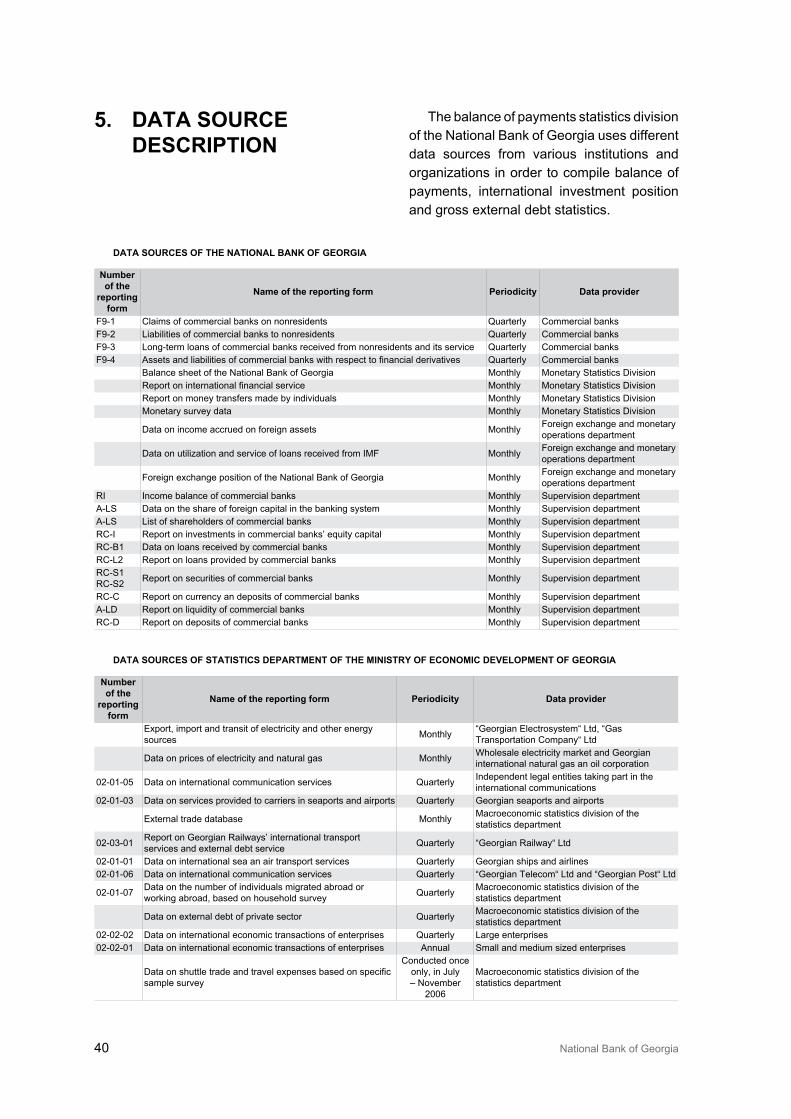
40 National Bank of Georgia
5. data soUrce descriptioN
The balance of payments statistics division of the National Bank of Georgia uses different data sources from various institutions and organizations in order to compile balance of payments, international investment position and gross external debt statistics.
data soUrces of the NatioNal BaNk of GeorGia
Number of the
reporting form
Name of the reporting form periodicity data provider
F9-1 Claims of commercial banks on nonresidents Quarterly Commercial banksF9-2 Liabilities of commercial banks to nonresidents Quarterly Commercial banksF9-� Long-term loans of commercial banks received from nonresidents and its service Quarterly Commercial banksF9-4 Assets and liabilities of commercial banks with respect to financial derivatives Quarterly Commercial banks
Balance sheet of the National Bank of Georgia Monthly Monetary Statistics DivisionReport on international financial service Monthly Monetary Statistics DivisionReport on money transfers made by individuals Monthly Monetary Statistics DivisionMonetary survey data Monthly Monetary Statistics Division
Data on income accrued on foreign assets Monthly Foreign exchange and monetary operations department
Data on utilization and service of loans received from IMF Monthly Foreign exchange and monetary operations department
Foreign exchange position of the National Bank of Georgia Monthly Foreign exchange and monetary operations department
RI Income balance of commercial banks Monthly Supervision departmentA-LS Data on the share of foreign capital in the banking system Monthly Supervision departmentA-LS List of shareholders of commercial banks Monthly Supervision departmentRC-I Report on investments in commercial banks’ equity capital Monthly Supervision departmentRC-B1 Data on loans received by commercial banks Monthly Supervision departmentRC-L2 Report on loans provided by commercial banks Monthly Supervision departmentRC-S1 RC-S2 Report on securities of commercial banks Monthly Supervision department
RC-C Report on currency an deposits of commercial banks Monthly Supervision departmentA-LD Report on liquidity of commercial banks Monthly Supervision departmentRC-D Report on deposits of commercial banks Monthly Supervision department
data soUrces of statistics departmeNt of the miNistry of ecoNomic developmeNt of GeorGia
Number of the
reporting form
Name of the reporting form periodicity data provider
Export, import and transit of electricity and other energy sources Monthly “Georgian Electrosystem“ Ltd, “Gas
Transportation Company“ Ltd
Data on prices of electricity and natural gas Monthly Wholesale electricity market and Georgian international natural gas an oil corporation
02-01-05 Data on international communication services Quarterly Independent legal entities taking part in the international communications
02-01-0� Data on services provided to carriers in seaports and airports Quarterly Georgian seaports and airports
External trade database Monthly Macroeconomic statistics division of the statistics department
02-0�-01 Report on Georgian Railways’ international transport services and external debt service Quarterly “Georgian Railway“ Ltd
02-01-01 Data on international sea an air transport services Quarterly Georgian ships and airlines02-01-06 Data on international communication services Quarterly “Georgian Telecom“ Ltd and “Georgian Post“ Ltd
02-01-07 Data on the number of individuals migrated abroad or working abroad, based on household survey Quarterly Macroeconomic statistics division of the
statistics department
Data on external debt of private sector Quarterly Macroeconomic statistics division of the statistics department
02-02-02 Data on international economic transactions of enterprises Quarterly Large enterprises02-02-01 Data on international economic transactions of enterprises Annual Small and medium sized enterprises
Data on shuttle trade and travel expenses based on specific sample survey
Conducted once only, in July – November
2006
Macroeconomic statistics division of the statistics department
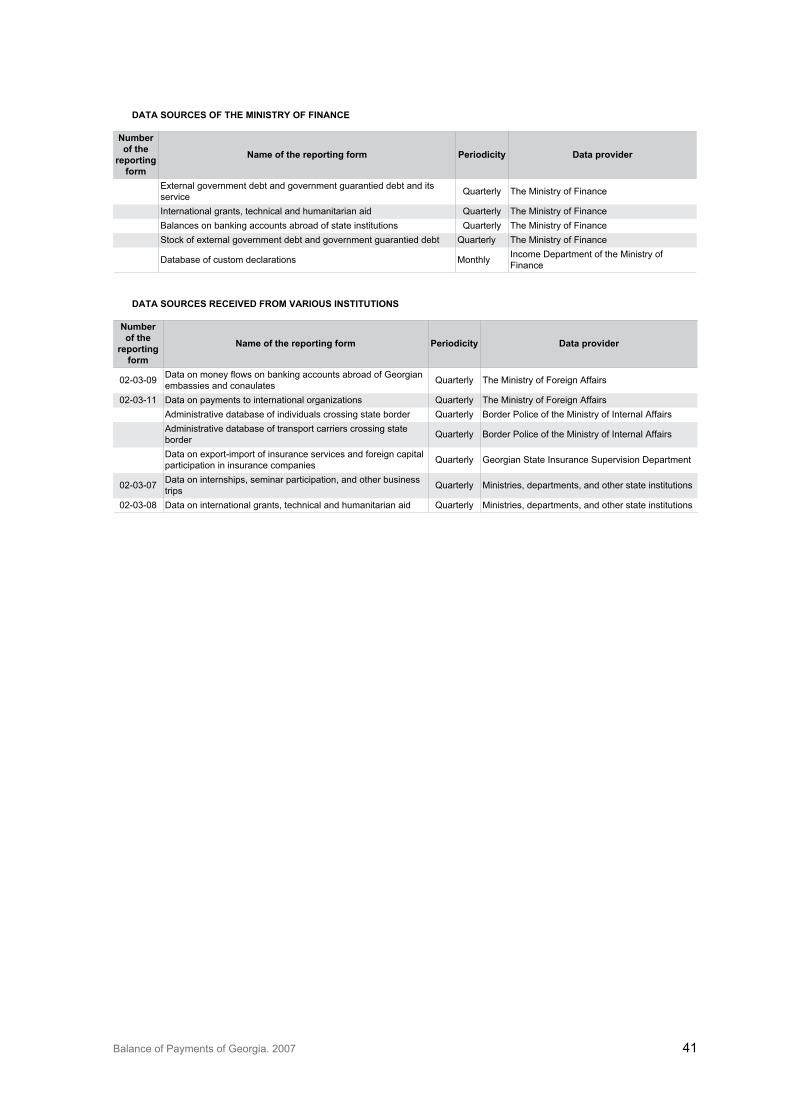
Balance of Payments of Georgia. 2007 41
data soUrces of the miNistry of fiNaNce
Number of the
reporting form
Name of the reporting form periodicity data provider
External government debt and government guarantied debt and its service Quarterly The Ministry of Finance
International grants, technical and humanitarian aid Quarterly The Ministry of FinanceBalances on banking accounts abroad of state institutions Quarterly The Ministry of FinanceStock of external government debt and government guarantied debt Quarterly The Ministry of Finance
Database of custom declarations Monthly Income Department of the Ministry of Finance
data soUrces received from varioUs iNstitUtioNs
Number of the
reporting form
Name of the reporting form periodicity data provider
02-0�-09 Data on money flows on banking accounts abroad of Georgian embassies and conaulates Quarterly The Ministry of Foreign Affairs
02-0�-11 Data on payments to international organizations Quarterly The Ministry of Foreign AffairsAdministrative database of individuals crossing state border Quarterly Border Police of the Ministry of Internal AffairsAdministrative database of transport carriers crossing state border Quarterly Border Police of the Ministry of Internal Affairs
Data on export-import of insurance services and foreign capital participation in insurance companies Quarterly Georgian State Insurance Supervision Department
02-0�-07 Data on internships, seminar participation, and other business trips Quarterly Ministries, departments, and other state institutions
02-0�-08 Data on international grants, technical and humanitarian aid Quarterly Ministries, departments, and other state institutions
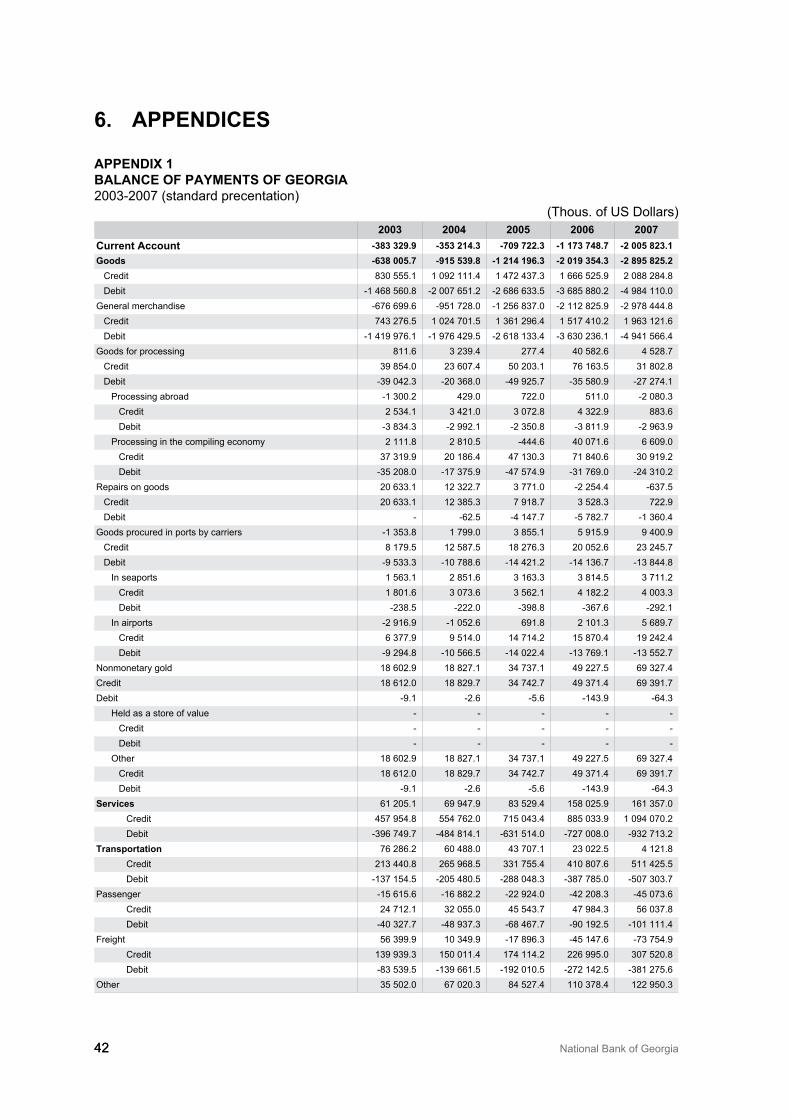
42 National Bank of Georgia42
6. appeNdices
appeNdix 1BalaNce of paymeNts of GeorGia200�-2007 (standard precentation)
(Thous. of US Dollars) 2003 2004 2005 2006 2007
current account 383 329.9 353 214.3 709 722.3 1 173 748.7 2 005 823.1Goods 638 005.7 915 539.8 1 214 196.3 2 019 354.3 2 895 825.2
Credit 8�0 555.1 1 092 111.4 1 472 4�7.� 1 666 525.9 2 088 284.8Debit -1 468 560.8 -2 007 651.2 -2 686 6��.5 -� 685 880.2 -4 984 110.0
General merchandise -676 699.6 -951 728.0 -1 256 8�7.0 -2 112 825.9 -2 978 444.8Credit 74� 276.5 1 024 701.5 1 �61 296.4 1 517 410.2 1 96� 121.6Debit -1 419 976.1 -1 976 429.5 -2 618 1��.4 -� 6�0 2�6.1 -4 941 566.4
Goods for processing 811.6 � 2�9.4 277.4 40 582.6 4 528.7Credit �9 854.0 2� 607.4 50 20�.1 76 16�.5 �1 802.8Debit -�9 042.� -20 �68.0 -49 925.7 -�5 580.9 -27 274.1
Processing abroad -1 �00.2 429.0 722.0 511.0 -2 080.�Credit 2 5�4.1 � 421.0 � 072.8 4 �22.9 88�.6Debit -� 8�4.� -2 992.1 -2 �50.8 -� 811.9 -2 96�.9
Processing in the compiling economy 2 111.8 2 810.5 -444.6 40 071.6 6 609.0Credit �7 �19.9 20 186.4 47 1�0.� 71 840.6 �0 919.2Debit -�5 208.0 -17 �75.9 -47 574.9 -�1 769.0 -24 �10.2
Repairs on goods 20 6��.1 12 �22.7 � 771.0 -2 254.4 -6�7.5Credit 20 6��.1 12 �85.� 7 918.7 � 528.� 722.9Debit - -62.5 -4 147.7 -5 782.7 -1 �60.4
Goods procured in ports by carriers -1 �5�.8 1 799.0 � 855.1 5 915.9 9 400.9Credit 8 179.5 12 587.5 18 276.� 20 052.6 2� 245.7Debit -9 5��.� -10 788.6 -14 421.2 -14 1�6.7 -1� 844.8
In seaports 1 56�.1 2 851.6 � 16�.� � 814.5 � 711.2Credit 1 801.6 � 07�.6 � 562.1 4 182.2 4 00�.�Debit -2�8.5 -222.0 -�98.8 -�67.6 -292.1
In airports -2 916.9 -1 052.6 691.8 2 101.� 5 689.7Credit 6 �77.9 9 514.0 14 714.2 15 870.4 19 242.4Debit -9 294.8 -10 566.5 -14 022.4 -1� 769.1 -1� 552.7
Nonmonetary gold 18 602.9 18 827.1 �4 7�7.1 49 227.5 69 �27.4Credit 18 612.0 18 829.7 �4 742.7 49 �71.4 69 �91.7Debit -9.1 -2.6 -5.6 -14�.9 -64.�
Held as a store of value - - - - -Credit - - - - -Debit - - - - -
Other 18 602.9 18 827.1 �4 7�7.1 49 227.5 69 �27.4Credit 18 612.0 18 829.7 �4 742.7 49 �71.4 69 �91.7Debit -9.1 -2.6 -5.6 -14�.9 -64.�
services 61 205.1 69 947.9 8� 529.4 158 025.9 161 �57.0Credit 457 954.8 554 762.0 715 04�.4 885 0��.9 1 094 070.2Debit -�96 749.7 -484 814.1 -6�1 514.0 -727 008.0 -9�2 71�.2
transportation 76 286.2 60 488.0 4� 707.1 2� 022.5 4 121.8Credit 21� 440.8 265 968.5 ��1 755.4 410 807.6 511 425.5Debit -1�7 154.5 -205 480.5 -288 048.� -�87 785.0 -507 �0�.7
Passenger -15 615.6 -16 882.2 -22 924.0 -42 208.� -45 07�.6Credit 24 712.1 �2 055.0 45 54�.7 47 984.� 56 0�7.8Debit -40 �27.7 -48 9�7.� -68 467.7 -90 192.5 -101 111.4
Freight 56 �99.9 10 �49.9 -17 896.� -45 147.6 -7� 754.9Credit 1�9 9�9.� 150 011.4 174 114.2 226 995.0 �07 520.8Debit -8� 5�9.5 -1�9 661.5 -192 010.5 -272 142.5 -�81 275.6
Other �5 502.0 67 020.� 84 527.4 110 �78.4 122 950.�
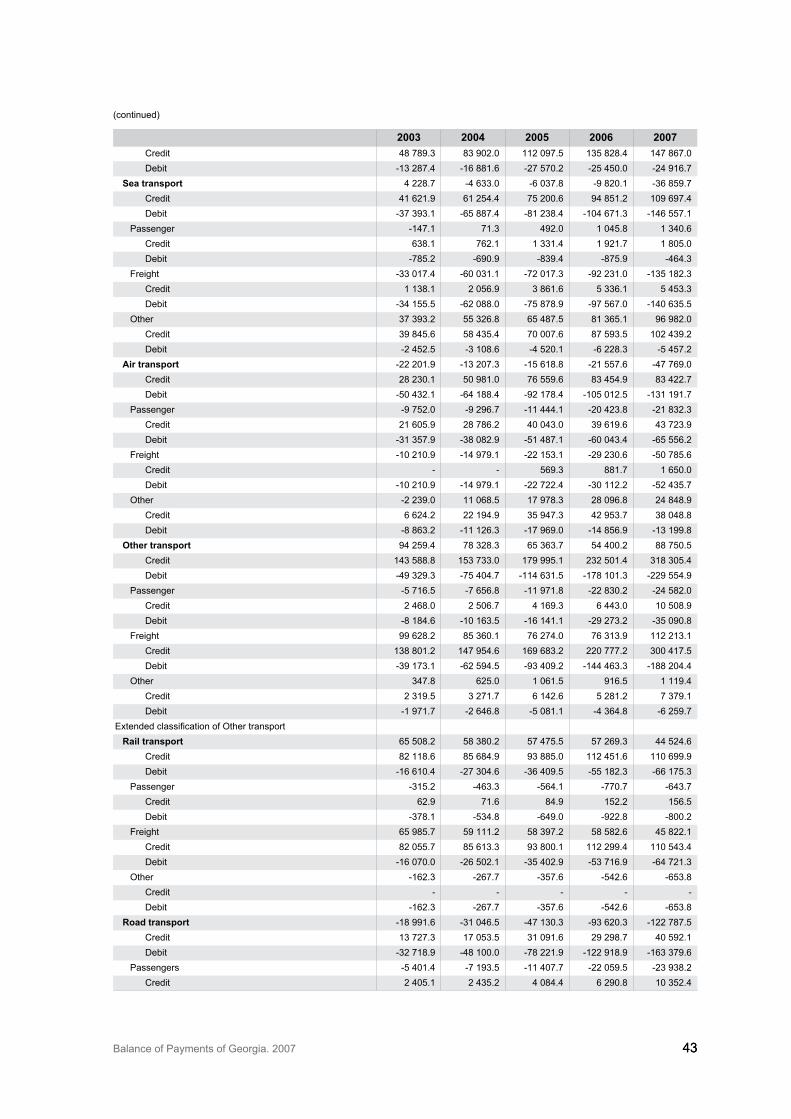
Balance of Payments of Georgia. 2007 4�4�
2003 2004 2005 2006 2007Credit 48 789.� 8� 902.0 112 097.5 1�5 828.4 147 867.0Debit -1� 287.4 -16 881.6 -27 570.2 -25 450.0 -24 916.7
sea transport 4 228.7 -4 6��.0 -6 0�7.8 -9 820.1 -�6 859.7Credit 41 621.9 61 254.4 75 200.6 94 851.2 109 697.4Debit -�7 �9�.1 -65 887.4 -81 2�8.4 -104 671.� -146 557.1
Passenger -147.1 71.� 492.0 1 045.8 1 �40.6Credit 6�8.1 762.1 1 ��1.4 1 921.7 1 805.0Debit -785.2 -690.9 -8�9.4 -875.9 -464.�
Freight -�� 017.4 -60 0�1.1 -72 017.� -92 2�1.0 -1�5 182.�Credit 1 1�8.1 2 056.9 � 861.6 5 ��6.1 5 45�.�Debit -�4 155.5 -62 088.0 -75 878.9 -97 567.0 -140 6�5.5
Other �7 �9�.2 55 �26.8 65 487.5 81 �65.1 96 982.0Credit �9 845.6 58 4�5.4 70 007.6 87 59�.5 102 4�9.2Debit -2 452.5 -� 108.6 -4 520.1 -6 228.� -5 457.2
air transport -22 201.9 -1� 207.� -15 618.8 -21 557.6 -47 769.0Credit 28 2�0.1 50 981.0 76 559.6 8� 454.9 8� 422.7Debit -50 4�2.1 -64 188.4 -92 178.4 -105 012.5 -1�1 191.7
Passenger -9 752.0 -9 296.7 -11 444.1 -20 42�.8 -21 8�2.�Credit 21 605.9 28 786.2 40 04�.0 �9 619.6 4� 72�.9Debit -�1 �57.9 -�8 082.9 -51 487.1 -60 04�.4 -65 556.2
Freight -10 210.9 -14 979.1 -22 15�.1 -29 2�0.6 -50 785.6Credit - - 569.� 881.7 1 650.0Debit -10 210.9 -14 979.1 -22 722.4 -�0 112.2 -52 4�5.7
Other -2 2�9.0 11 068.5 17 978.� 28 096.8 24 848.9Credit 6 624.2 22 194.9 �5 947.� 42 95�.7 �8 048.8Debit -8 86�.2 -11 126.� -17 969.0 -14 856.9 -1� 199.8
other transport 94 259.4 78 �28.� 65 �6�.7 54 400.2 88 750.5Credit 14� 588.8 15� 7��.0 179 995.1 2�2 501.4 �18 �05.4Debit -49 �29.� -75 404.7 -114 6�1.5 -178 101.� -229 554.9
Passenger -5 716.5 -7 656.8 -11 971.8 -22 8�0.2 -24 582.0Credit 2 468.0 2 506.7 4 169.� 6 44�.0 10 508.9Debit -8 184.6 -10 16�.5 -16 141.1 -29 27�.2 -�5 090.8
Freight 99 628.2 85 �60.1 76 274.0 76 �1�.9 112 21�.1Credit 1�8 801.2 147 954.6 169 68�.2 220 777.2 �00 417.5Debit -�9 17�.1 -62 594.5 -9� 409.2 -144 46�.� -188 204.4
Other �47.8 625.0 1 061.5 916.5 1 119.4Credit 2 �19.5 � 271.7 6 142.6 5 281.2 7 �79.1Debit -1 971.7 -2 646.8 -5 081.1 -4 �64.8 -6 259.7
Extended classification of Other transport rail transport 65 508.2 58 �80.2 57 475.5 57 269.� 44 524.6
Credit 82 118.6 85 684.9 9� 885.0 112 451.6 110 699.9Debit -16 610.4 -27 �04.6 -�6 409.5 -55 182.� -66 175.�
Passenger -�15.2 -46�.� -564.1 -770.7 -64�.7Credit 62.9 71.6 84.9 152.2 156.5Debit -�78.1 -5�4.8 -649.0 -922.8 -800.2
Freight 65 985.7 59 111.2 58 �97.2 58 582.6 45 822.1Credit 82 055.7 85 61�.� 9� 800.1 112 299.4 110 54�.4Debit -16 070.0 -26 502.1 -�5 402.9 -5� 716.9 -64 721.�
Other -162.� -267.7 -�57.6 -542.6 -65�.8Credit - - - - -Debit -162.� -267.7 -�57.6 -542.6 -65�.8
road transport -18 991.6 -�1 046.5 -47 1�0.� -9� 620.� -122 787.5Credit 1� 727.� 17 05�.5 �1 091.6 29 298.7 40 592.1Debit -�2 718.9 -48 100.0 -78 221.9 -122 918.9 -16� �79.6
Passengers -5 401.4 -7 19�.5 -11 407.7 -22 059.5 -2� 9�8.2Credit 2 405.1 2 4�5.2 4 084.4 6 290.8 10 �52.4
(continued)
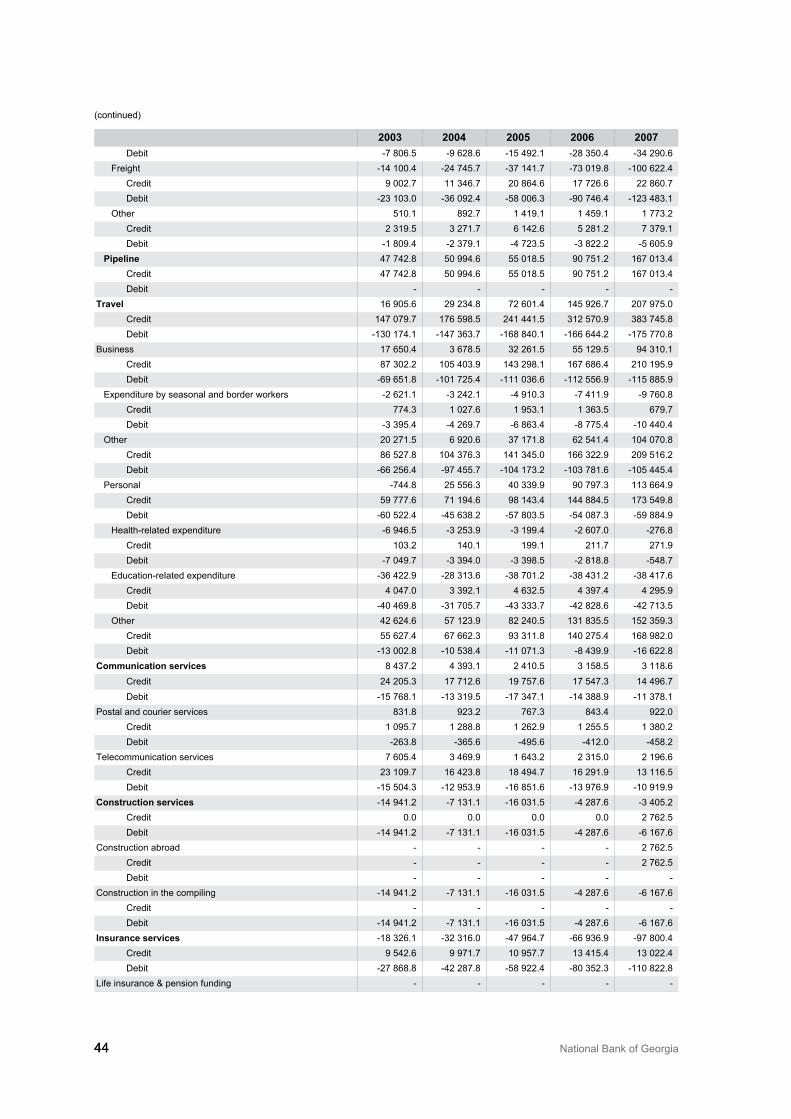
44 National Bank of Georgia44
2003 2004 2005 2006 2007Debit -7 806.5 -9 628.6 -15 492.1 -28 �50.4 -�4 290.6
Freight -14 100.4 -24 745.7 -�7 141.7 -7� 019.8 -100 622.4Credit 9 002.7 11 �46.7 20 864.6 17 726.6 22 860.7Debit -2� 10�.0 -�6 092.4 -58 006.� -90 746.4 -12� 48�.1
Other 510.1 892.7 1 419.1 1 459.1 1 77�.2Credit 2 �19.5 � 271.7 6 142.6 5 281.2 7 �79.1Debit -1 809.4 -2 �79.1 -4 72�.5 -� 822.2 -5 605.9
pipeline 47 742.8 50 994.6 55 018.5 90 751.2 167 01�.4Credit 47 742.8 50 994.6 55 018.5 90 751.2 167 01�.4Debit - - - - -
travel 16 905.6 29 2�4.8 72 601.4 145 926.7 207 975.0Credit 147 079.7 176 598.5 241 441.5 �12 570.9 �8� 745.8Debit -1�0 174.1 -147 �6�.7 -168 840.1 -166 644.2 -175 770.8
Business 17 650.4 � 678.5 �2 261.5 55 129.5 94 �10.1Credit 87 �02.2 105 40�.9 14� 298.1 167 686.4 210 195.9Debit -69 651.8 -101 725.4 -111 0�6.6 -112 556.9 -115 885.9
Expenditure by seasonal and border workers -2 621.1 -� 242.1 -4 910.� -7 411.9 -9 760.8Credit 774.� 1 027.6 1 95�.1 1 �6�.5 679.7Debit -� �95.4 -4 269.7 -6 86�.4 -8 775.4 -10 440.4
Other 20 271.5 6 920.6 �7 171.8 62 541.4 104 070.8Credit 86 527.8 104 �76.� 141 �45.0 166 �22.9 209 516.2Debit -66 256.4 -97 455.7 -104 17�.2 -10� 781.6 -105 445.4
Personal -744.8 25 556.� 40 ��9.9 90 797.� 11� 664.9Credit 59 777.6 71 194.6 98 14�.4 144 884.5 17� 549.8Debit -60 522.4 -45 6�8.2 -57 80�.5 -54 087.� -59 884.9
Health-related expenditure -6 946.5 -� 25�.9 -� 199.4 -2 607.0 -276.8Credit 10�.2 140.1 199.1 211.7 271.9Debit -7 049.7 -� �94.0 -� �98.5 -2 818.8 -548.7
Education-related expenditure -�6 422.9 -28 �1�.6 -�8 701.2 -�8 4�1.2 -�8 417.6Credit 4 047.0 � �92.1 4 6�2.5 4 �97.4 4 295.9Debit -40 469.8 -�1 705.7 -4� ���.7 -42 828.6 -42 71�.5
Other 42 624.6 57 12�.9 82 240.5 1�1 8�5.5 152 �59.�Credit 55 627.4 67 662.� 9� �11.8 140 275.4 168 982.0Debit -1� 002.8 -10 5�8.4 -11 071.� -8 4�9.9 -16 622.8
communication services 8 4�7.2 4 �9�.1 2 410.5 � 158.5 � 118.6Credit 24 205.� 17 712.6 19 757.6 17 547.� 14 496.7Debit -15 768.1 -1� �19.5 -17 �47.1 -14 �88.9 -11 �78.1
Postal and courier services 8�1.8 92�.2 767.� 84�.4 922.0Credit 1 095.7 1 288.8 1 262.9 1 255.5 1 �80.2Debit -26�.8 -�65.6 -495.6 -412.0 -458.2
Telecommunication services 7 605.4 � 469.9 1 64�.2 2 �15.0 2 196.6Credit 2� 109.7 16 42�.8 18 494.7 16 291.9 1� 116.5Debit -15 504.� -12 95�.9 -16 851.6 -1� 976.9 -10 919.9
construction services -14 941.2 -7 1�1.1 -16 0�1.5 -4 287.6 -� 405.2Credit 0.0 0.0 0.0 0.0 2 762.5Debit -14 941.2 -7 1�1.1 -16 0�1.5 -4 287.6 -6 167.6
Construction abroad - - - - 2 762.5Credit - - - - 2 762.5Debit - - - - -
Construction in the compiling -14 941.2 -7 1�1.1 -16 0�1.5 -4 287.6 -6 167.6Credit - - - - -Debit -14 941.2 -7 1�1.1 -16 0�1.5 -4 287.6 -6 167.6
insurance services -18 �26.1 -�2 �16.0 -47 964.7 -66 9�6.9 -97 800.4Credit 9 542.6 9 971.7 10 957.7 1� 415.4 1� 022.4Debit -27 868.8 -42 287.8 -58 922.4 -80 �52.� -110 822.8
Life insurance & pension funding - - - - -
(continued)
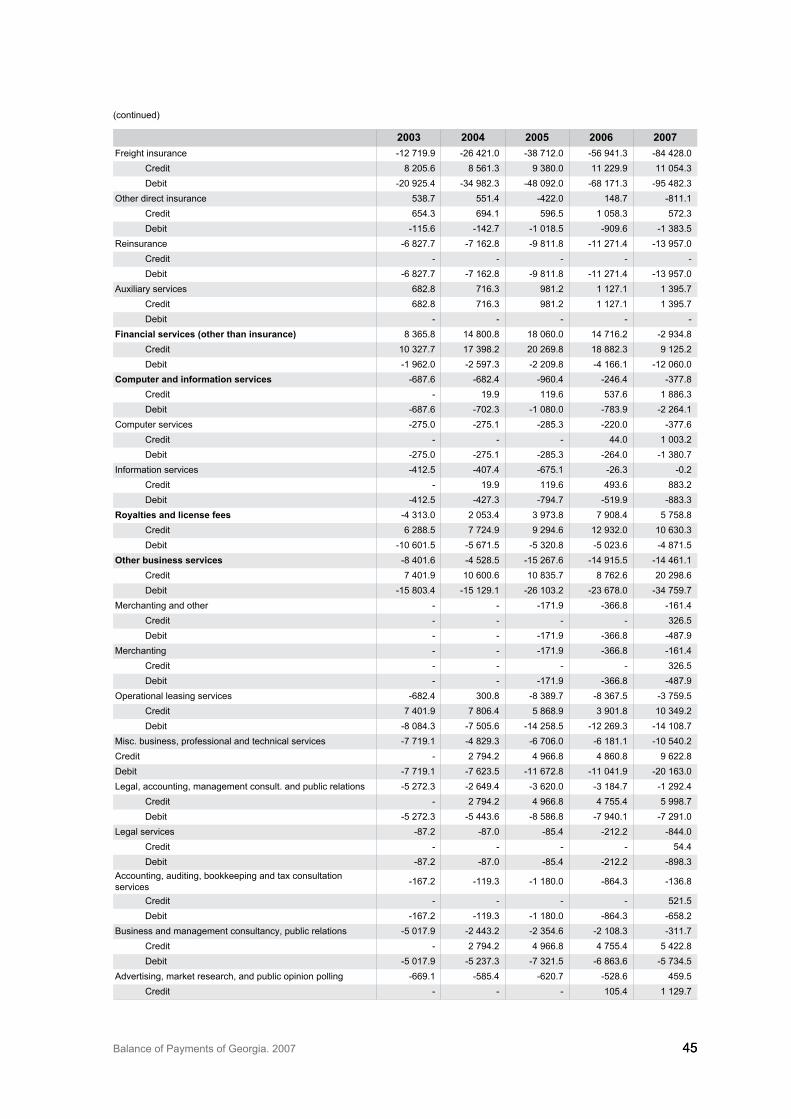
Balance of Payments of Georgia. 2007 4545
2003 2004 2005 2006 2007Freight insurance -12 719.9 -26 421.0 -�8 712.0 -56 941.� -84 428.0
Credit 8 205.6 8 561.� 9 �80.0 11 229.9 11 054.�Debit -20 925.4 -�4 982.� -48 092.0 -68 171.� -95 482.�
Other direct insurance 5�8.7 551.4 -422.0 148.7 -811.1Credit 654.� 694.1 596.5 1 058.� 572.�Debit -115.6 -142.7 -1 018.5 -909.6 -1 �8�.5
Reinsurance -6 827.7 -7 162.8 -9 811.8 -11 271.4 -1� 957.0Credit - - - - -Debit -6 827.7 -7 162.8 -9 811.8 -11 271.4 -1� 957.0
Auxiliary services 682.8 716.� 981.2 1 127.1 1 �95.7Credit 682.8 716.� 981.2 1 127.1 1 �95.7Debit - - - - -
financial services (other than insurance) 8 �65.8 14 800.8 18 060.0 14 716.2 -2 9�4.8Credit 10 �27.7 17 �98.2 20 269.8 18 882.� 9 125.2Debit -1 962.0 -2 597.� -2 209.8 -4 166.1 -12 060.0
computer and information services -687.6 -682.4 -960.4 -246.4 -�77.8Credit - 19.9 119.6 5�7.6 1 886.�Debit -687.6 -702.� -1 080.0 -78�.9 -2 264.1
Computer services -275.0 -275.1 -285.� -220.0 -�77.6Credit - - - 44.0 1 00�.2Debit -275.0 -275.1 -285.� -264.0 -1 �80.7
Information services -412.5 -407.4 -675.1 -26.� -0.2Credit - 19.9 119.6 49�.6 88�.2Debit -412.5 -427.� -794.7 -519.9 -88�.�
royalties and license fees -4 �1�.0 2 05�.4 � 97�.8 7 908.4 5 758.8Credit 6 288.5 7 724.9 9 294.6 12 9�2.0 10 6�0.�Debit -10 601.5 -5 671.5 -5 �20.8 -5 02�.6 -4 871.5
other business services -8 401.6 -4 528.5 -15 267.6 -14 915.5 -14 461.1Credit 7 401.9 10 600.6 10 8�5.7 8 762.6 20 298.6Debit -15 80�.4 -15 129.1 -26 10�.2 -2� 678.0 -�4 759.7
Merchanting and other - - -171.9 -�66.8 -161.4Credit - - - - �26.5Debit - - -171.9 -�66.8 -487.9
Merchanting - - -171.9 -�66.8 -161.4Credit - - - - �26.5Debit - - -171.9 -�66.8 -487.9
Operational leasing services -682.4 �00.8 -8 �89.7 -8 �67.5 -� 759.5Credit 7 401.9 7 806.4 5 868.9 � 901.8 10 �49.2Debit -8 084.� -7 505.6 -14 258.5 -12 269.� -14 108.7
Misc. business, professional and technical services -7 719.1 -4 829.� -6 706.0 -6 181.1 -10 540.2Credit - 2 794.2 4 966.8 4 860.8 9 622.8Debit -7 719.1 -7 62�.5 -11 672.8 -11 041.9 -20 16�.0Legal, accounting, management consult. and public relations -5 272.� -2 649.4 -� 620.0 -� 184.7 -1 292.4
Credit - 2 794.2 4 966.8 4 755.4 5 998.7Debit -5 272.� -5 44�.6 -8 586.8 -7 940.1 -7 291.0
Legal services -87.2 -87.0 -85.4 -212.2 -844.0Credit - - - - 54.4Debit -87.2 -87.0 -85.4 -212.2 -898.�
Accounting, auditing, bookkeeping and tax consultation services -167.2 -119.� -1 180.0 -864.� -1�6.8
Credit - - - - 521.5Debit -167.2 -119.� -1 180.0 -864.� -658.2
Business and management consultancy, public relations -5 017.9 -2 44�.2 -2 �54.6 -2 108.� -�11.7Credit - 2 794.2 4 966.8 4 755.4 5 422.8Debit -5 017.9 -5 2�7.� -7 �21.5 -6 86�.6 -5 7�4.5
Advertising, market research, and public opinion polling -669.1 -585.4 -620.7 -528.6 459.5Credit - - - 105.4 1 129.7
(continued)
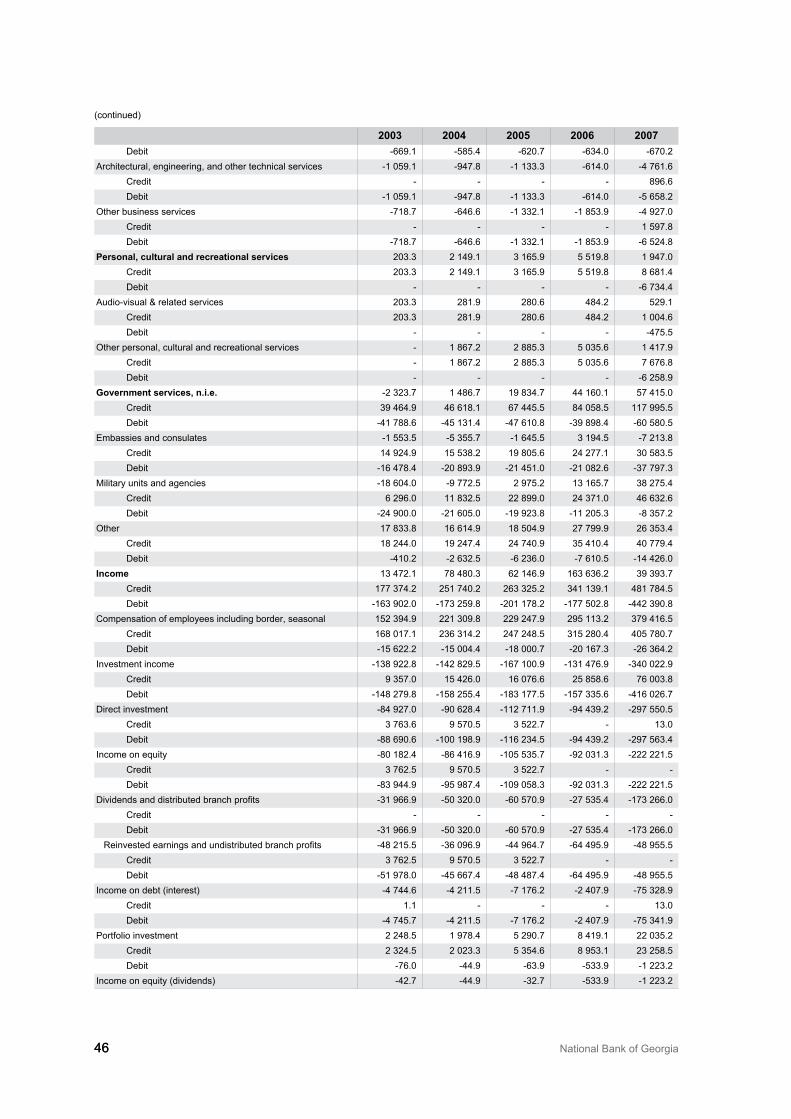
46 National Bank of Georgia46
2003 2004 2005 2006 2007Debit -669.1 -585.4 -620.7 -6�4.0 -670.2
Architectural, engineering, and other technical services -1 059.1 -947.8 -1 1��.� -614.0 -4 761.6Credit - - - - 896.6Debit -1 059.1 -947.8 -1 1��.� -614.0 -5 658.2
Other business services -718.7 -646.6 -1 ��2.1 -1 85�.9 -4 927.0Credit - - - - 1 597.8Debit -718.7 -646.6 -1 ��2.1 -1 85�.9 -6 524.8
personal, cultural and recreational services 20�.� 2 149.1 � 165.9 5 519.8 1 947.0Credit 20�.� 2 149.1 � 165.9 5 519.8 8 681.4Debit - - - - -6 7�4.4
Audio-visual & related services 20�.� 281.9 280.6 484.2 529.1Credit 20�.� 281.9 280.6 484.2 1 004.6Debit - - - - -475.5
Other personal, cultural and recreational services - 1 867.2 2 885.� 5 0�5.6 1 417.9Credit - 1 867.2 2 885.� 5 0�5.6 7 676.8Debit - - - - -6 258.9
Government services, n.i.e. -2 �2�.7 1 486.7 19 8�4.7 44 160.1 57 415.0Credit �9 464.9 46 618.1 67 445.5 84 058.5 117 995.5Debit -41 788.6 -45 1�1.4 -47 610.8 -�9 898.4 -60 580.5
Embassies and consulates -1 55�.5 -5 �55.7 -1 645.5 � 194.5 -7 21�.8Credit 14 924.9 15 5�8.2 19 805.6 24 277.1 �0 58�.5Debit -16 478.4 -20 89�.9 -21 451.0 -21 082.6 -�7 797.�
Military units and agencies -18 604.0 -9 772.5 2 975.2 1� 165.7 �8 275.4Credit 6 296.0 11 8�2.5 22 899.0 24 �71.0 46 6�2.6Debit -24 900.0 -21 605.0 -19 92�.8 -11 205.� -8 �57.2
Other 17 8��.8 16 614.9 18 504.9 27 799.9 26 �5�.4Credit 18 244.0 19 247.4 24 740.9 �5 410.4 40 779.4Debit -410.2 -2 6�2.5 -6 2�6.0 -7 610.5 -14 426.0
income 1� 472.1 78 480.� 62 146.9 16� 6�6.2 �9 �9�.7Credit 177 �74.2 251 740.2 26� �25.2 �41 1�9.1 481 784.5Debit -16� 902.0 -17� 259.8 -201 178.2 -177 502.8 -442 �90.8
Compensation of employees including border, seasonal 152 �94.9 221 �09.8 229 247.9 295 11�.2 �79 416.5Credit 168 017.1 2�6 �14.2 247 248.5 �15 280.4 405 780.7Debit -15 622.2 -15 004.4 -18 000.7 -20 167.� -26 �64.2
Investment income -1�8 922.8 -142 829.5 -167 100.9 -1�1 476.9 -�40 022.9Credit 9 �57.0 15 426.0 16 076.6 25 858.6 76 00�.8Debit -148 279.8 -158 255.4 -18� 177.5 -157 ��5.6 -416 026.7
Direct investment -84 927.0 -90 628.4 -112 711.9 -94 4�9.2 -297 550.5Credit � 76�.6 9 570.5 � 522.7 - 1�.0Debit -88 690.6 -100 198.9 -116 2�4.5 -94 4�9.2 -297 56�.4
Income on equity -80 182.4 -86 416.9 -105 5�5.7 -92 0�1.� -222 221.5Credit � 762.5 9 570.5 � 522.7 - -Debit -8� 944.9 -95 987.4 -109 058.� -92 0�1.� -222 221.5
Dividends and distributed branch profits -�1 966.9 -50 �20.0 -60 570.9 -27 5�5.4 -17� 266.0Credit - - - - -Debit -�1 966.9 -50 �20.0 -60 570.9 -27 5�5.4 -17� 266.0
Reinvested earnings and undistributed branch profits -48 215.5 -�6 096.9 -44 964.7 -64 495.9 -48 955.5Credit � 762.5 9 570.5 � 522.7 - -Debit -51 978.0 -45 667.4 -48 487.4 -64 495.9 -48 955.5
Income on debt (interest) -4 744.6 -4 211.5 -7 176.2 -2 407.9 -75 �28.9Credit 1.1 - - - 1�.0Debit -4 745.7 -4 211.5 -7 176.2 -2 407.9 -75 �41.9
Portfolio investment 2 248.5 1 978.4 5 290.7 8 419.1 22 0�5.2Credit 2 �24.5 2 02�.� 5 �54.6 8 95�.1 2� 258.5Debit -76.0 -44.9 -6�.9 -5��.9 -1 22�.2
Income on equity (dividends) -42.7 -44.9 -�2.7 -5��.9 -1 22�.2
(continued)
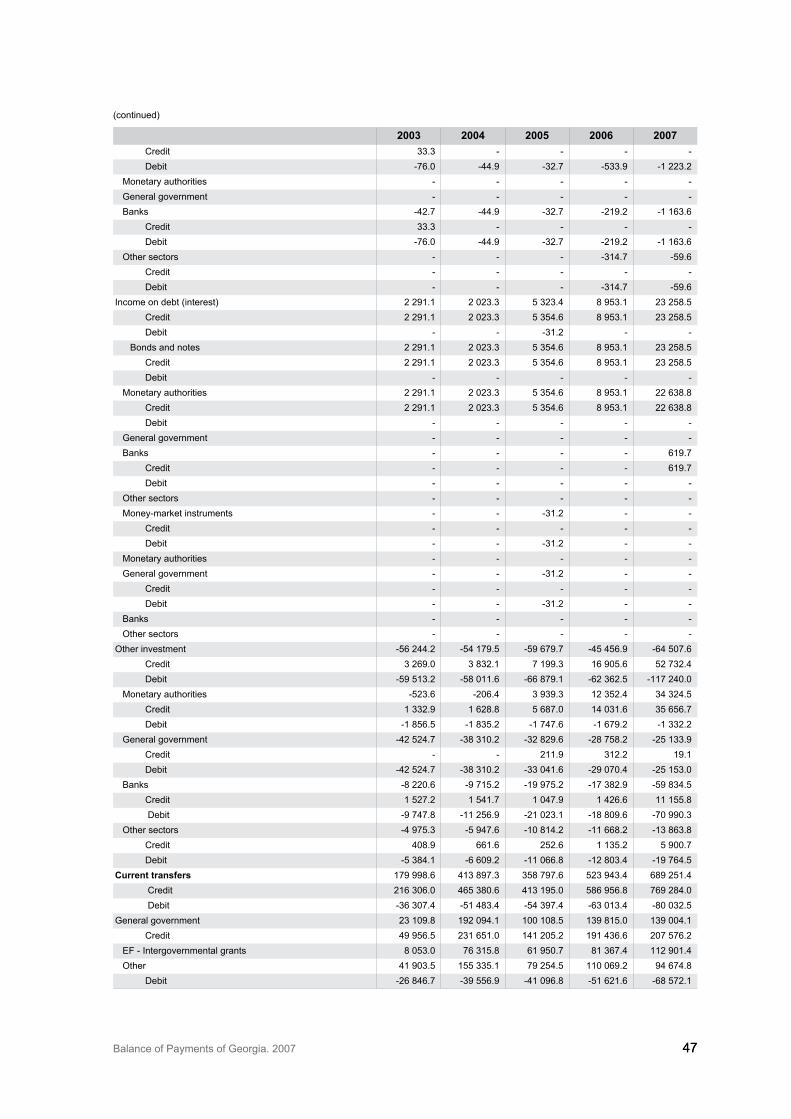
Balance of Payments of Georgia. 2007 4747
2003 2004 2005 2006 2007Credit ��.� - - - -Debit -76.0 -44.9 -�2.7 -5��.9 -1 22�.2
Monetary authorities - - - - -General government - - - - -Banks -42.7 -44.9 -�2.7 -219.2 -1 16�.6
Credit ��.� - - - -Debit -76.0 -44.9 -�2.7 -219.2 -1 16�.6
Other sectors - - - -�14.7 -59.6Credit - - - - -Debit - - - -�14.7 -59.6
Income on debt (interest) 2 291.1 2 02�.� 5 �2�.4 8 95�.1 2� 258.5Credit 2 291.1 2 02�.� 5 �54.6 8 95�.1 2� 258.5Debit - - -�1.2 - -
Bonds and notes 2 291.1 2 02�.� 5 �54.6 8 95�.1 2� 258.5Credit 2 291.1 2 02�.� 5 �54.6 8 95�.1 2� 258.5Debit - - - - -
Monetary authorities 2 291.1 2 02�.� 5 �54.6 8 95�.1 22 6�8.8Credit 2 291.1 2 02�.� 5 �54.6 8 95�.1 22 6�8.8Debit - - - - -
General government - - - - -Banks - - - - 619.7
Credit - - - - 619.7Debit - - - - -
Other sectors - - - - -Money-market instruments - - -�1.2 - -
Credit - - - - -Debit - - -�1.2 - -
Monetary authorities - - - - -General government - - -�1.2 - -
Credit - - - - -Debit - - -�1.2 - -
Banks - - - - -Other sectors - - - - -
Other investment -56 244.2 -54 179.5 -59 679.7 -45 456.9 -64 507.6Credit � 269.0 � 8�2.1 7 199.� 16 905.6 52 7�2.4Debit -59 51�.2 -58 011.6 -66 879.1 -62 �62.5 -117 240.0
Monetary authorities -52�.6 -206.4 � 9�9.� 12 �52.4 �4 �24.5Credit 1 ��2.9 1 628.8 5 687.0 14 0�1.6 �5 656.7Debit -1 856.5 -1 8�5.2 -1 747.6 -1 679.2 -1 ��2.2
General government -42 524.7 -�8 �10.2 -�2 829.6 -28 758.2 -25 1��.9Credit - - 211.9 �12.2 19.1Debit -42 524.7 -�8 �10.2 -�� 041.6 -29 070.4 -25 15�.0
Banks -8 220.6 -9 715.2 -19 975.2 -17 �82.9 -59 8�4.5Credit 1 527.2 1 541.7 1 047.9 1 426.6 11 155.8 Debit -9 747.8 -11 256.9 -21 02�.1 -18 809.6 -70 990.�
Other sectors -4 975.� -5 947.6 -10 814.2 -11 668.2 -1� 86�.8Credit 408.9 661.6 252.6 1 1�5.2 5 900.7Debit -5 �84.1 -6 609.2 -11 066.8 -12 80�.4 -19 764.5
current transfers 179 998.6 41� 897.� �58 797.6 52� 94�.4 689 251.4 Credit 216 �06.0 465 �80.6 41� 195.0 586 956.8 769 284.0 Debit -�6 �07.4 -51 48�.4 -54 �97.4 -6� 01�.4 -80 0�2.5
General government 2� 109.8 192 094.1 100 108.5 1�9 815.0 1�9 004.1Credit 49 956.5 2�1 651.0 141 205.2 191 4�6.6 207 576.2
EF - Intergovernmental grants 8 05�.0 76 �15.8 61 950.7 81 �67.4 112 901.4Other 41 90�.5 155 ��5.1 79 254.5 110 069.2 94 674.8
Debit -26 846.7 -�9 556.9 -41 096.8 -51 621.6 -68 572.1
(continued)
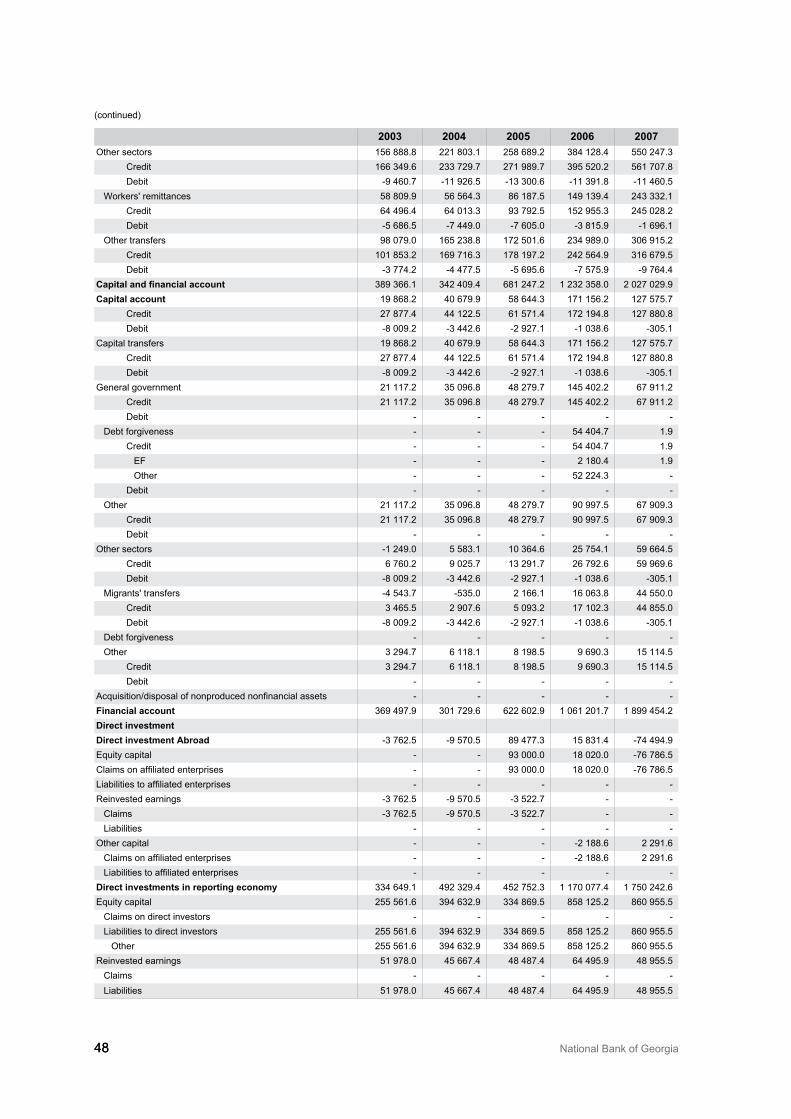
48 National Bank of Georgia48
2003 2004 2005 2006 2007Other sectors 156 888.8 221 80�.1 258 689.2 �84 128.4 550 247.�
Credit 166 �49.6 2�� 729.7 271 989.7 �95 520.2 561 707.8Debit -9 460.7 -11 926.5 -1� �00.6 -11 �91.8 -11 460.5
Workers' remittances 58 809.9 56 564.� 86 187.5 149 1�9.4 24� ��2.1Credit 64 496.4 64 01�.� 9� 792.5 152 955.� 245 028.2Debit -5 686.5 -7 449.0 -7 605.0 -� 815.9 -1 696.1
Other transfers 98 079.0 165 2�8.8 172 501.6 2�4 989.0 �06 915.2Credit 101 85�.2 169 716.� 178 197.2 242 564.9 �16 679.5Debit -� 774.2 -4 477.5 -5 695.6 -7 575.9 -9 764.4
Capital and financial account �89 �66.1 �42 409.4 681 247.2 1 2�2 �58.0 2 027 029.9capital account 19 868.2 40 679.9 58 644.� 171 156.2 127 575.7
Credit 27 877.4 44 122.5 61 571.4 172 194.8 127 880.8Debit -8 009.2 -� 442.6 -2 927.1 -1 0�8.6 -�05.1
Capital transfers 19 868.2 40 679.9 58 644.� 171 156.2 127 575.7Credit 27 877.4 44 122.5 61 571.4 172 194.8 127 880.8Debit -8 009.2 -� 442.6 -2 927.1 -1 0�8.6 -�05.1
General government 21 117.2 �5 096.8 48 279.7 145 402.2 67 911.2Credit 21 117.2 �5 096.8 48 279.7 145 402.2 67 911.2Debit - - - - -
Debt forgiveness - - - 54 404.7 1.9Credit - - - 54 404.7 1.9
EF - - - 2 180.4 1.9Other - - - 52 224.� -
Debit - - - - -Other 21 117.2 �5 096.8 48 279.7 90 997.5 67 909.�
Credit 21 117.2 �5 096.8 48 279.7 90 997.5 67 909.�Debit - - - - -
Other sectors -1 249.0 5 58�.1 10 �64.6 25 754.1 59 664.5Credit 6 760.2 9 025.7 1� 291.7 26 792.6 59 969.6Debit -8 009.2 -� 442.6 -2 927.1 -1 0�8.6 -�05.1
Migrants' transfers -4 54�.7 -5�5.0 2 166.1 16 06�.8 44 550.0Credit � 465.5 2 907.6 5 09�.2 17 102.� 44 855.0Debit -8 009.2 -� 442.6 -2 927.1 -1 0�8.6 -�05.1
Debt forgiveness - - - - -Other � 294.7 6 118.1 8 198.5 9 690.� 15 114.5
Credit � 294.7 6 118.1 8 198.5 9 690.� 15 114.5Debit - - - - -
Acquisition/disposal of nonproduced nonfinancial assets - - - - -financial account �69 497.9 �01 729.6 622 602.9 1 061 201.7 1 899 454.2direct investmentdirect investment abroad -� 762.5 -9 570.5 89 477.� 15 8�1.4 -74 494.9Equity capital - - 9� 000.0 18 020.0 -76 786.5Claims on affiliated enterprises - - 9� 000.0 18 020.0 -76 786.5Liabilities to affiliated enterprises - - - - -Reinvested earnings -� 762.5 -9 570.5 -� 522.7 - -
Claims -� 762.5 -9 570.5 -� 522.7 - -Liabilities - - - - -
Other capital - - - -2 188.6 2 291.6Claims on affiliated enterprises - - - -2 188.6 2 291.6Liabilities to affiliated enterprises - - - - -
direct investments in reporting economy ��4 649.1 492 �29.4 452 752.� 1 170 077.4 1 750 242.6Equity capital 255 561.6 �94 6�2.9 ��4 869.5 858 125.2 860 955.5
Claims on direct investors - - - - -Liabilities to direct investors 255 561.6 �94 6�2.9 ��4 869.5 858 125.2 860 955.5
Other 255 561.6 �94 6�2.9 ��4 869.5 858 125.2 860 955.5Reinvested earnings 51 978.0 45 667.4 48 487.4 64 495.9 48 955.5
Claims - - - - -Liabilities 51 978.0 45 667.4 48 487.4 64 495.9 48 955.5
(continued)
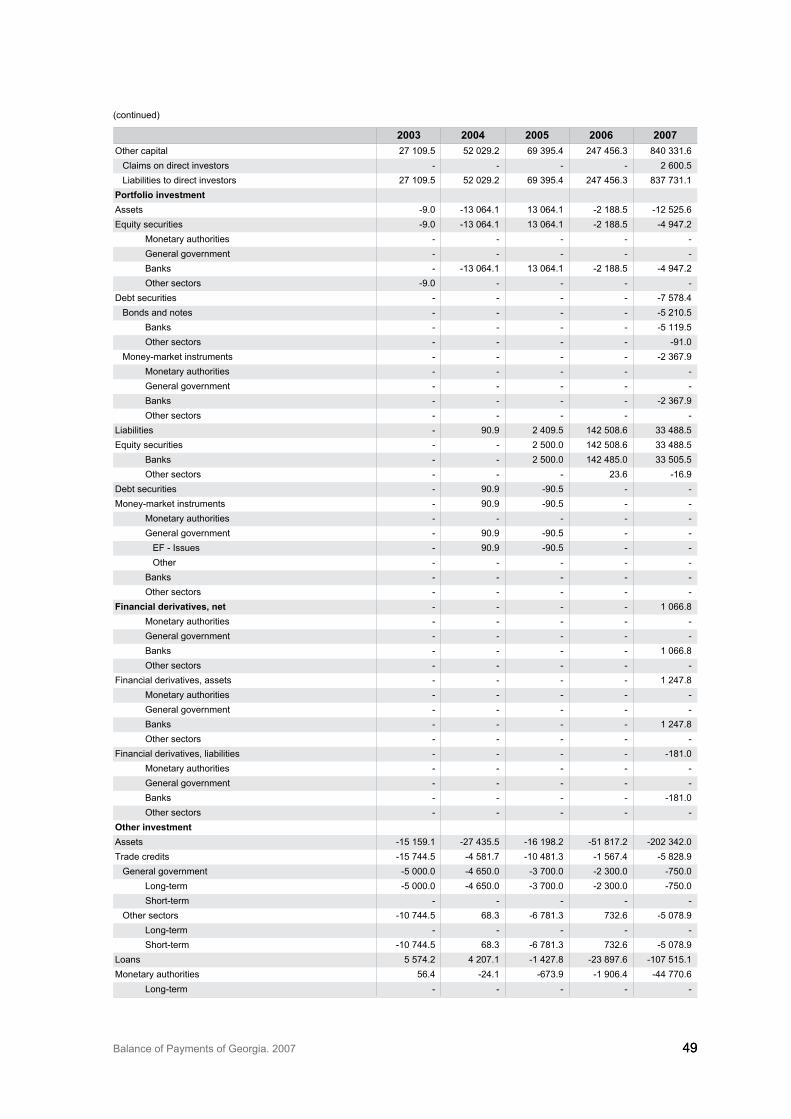
Balance of Payments of Georgia. 2007 4949
2003 2004 2005 2006 2007Other capital 27 109.5 52 029.2 69 �95.4 247 456.� 840 ��1.6
Claims on direct investors - - - - 2 600.5Liabilities to direct investors 27 109.5 52 029.2 69 �95.4 247 456.� 8�7 7�1.1
portfolio investmentAssets -9.0 -1� 064.1 1� 064.1 -2 188.5 -12 525.6Equity securities -9.0 -1� 064.1 1� 064.1 -2 188.5 -4 947.2
Monetary authorities - - - - -General government - - - - -Banks - -1� 064.1 1� 064.1 -2 188.5 -4 947.2Other sectors -9.0 - - - -
Debt securities - - - - -7 578.4Bonds and notes - - - - -5 210.5
Banks - - - - -5 119.5Other sectors - - - - -91.0
Money-market instruments - - - - -2 �67.9Monetary authorities - - - - -General government - - - - -Banks - - - - -2 �67.9Other sectors - - - - -
Liabilities - 90.9 2 409.5 142 508.6 �� 488.5Equity securities - - 2 500.0 142 508.6 �� 488.5
Banks - - 2 500.0 142 485.0 �� 505.5Other sectors - - - 2�.6 -16.9
Debt securities - 90.9 -90.5 - -Money-market instruments - 90.9 -90.5 - -
Monetary authorities - - - - -General government - 90.9 -90.5 - -
EF - Issues - 90.9 -90.5 - -Other - - - - -
Banks - - - - -Other sectors - - - - -
financial derivatives, net - - - - 1 066.8Monetary authorities - - - - -General government - - - - -Banks - - - - 1 066.8Other sectors - - - - -
Financial derivatives, assets - - - - 1 247.8Monetary authorities - - - - -General government - - - - -Banks - - - - 1 247.8Other sectors - - - - -
Financial derivatives, liabilities - - - - -181.0Monetary authorities - - - - -General government - - - - -Banks - - - - -181.0Other sectors - - - - -
other investmentAssets -15 159.1 -27 4�5.5 -16 198.2 -51 817.2 -202 �42.0Trade credits -15 744.5 -4 581.7 -10 481.� -1 567.4 -5 828.9
General government -5 000.0 -4 650.0 -� 700.0 -2 �00.0 -750.0Long-term -5 000.0 -4 650.0 -� 700.0 -2 �00.0 -750.0Short-term - - - - -
Other sectors -10 744.5 68.� -6 781.� 7�2.6 -5 078.9Long-term - - - - -Short-term -10 744.5 68.� -6 781.� 7�2.6 -5 078.9
Loans 5 574.2 4 207.1 -1 427.8 -2� 897.6 -107 515.1Monetary authorities 56.4 -24.1 -67�.9 -1 906.4 -44 770.6
Long-term - - - - -
(continued)
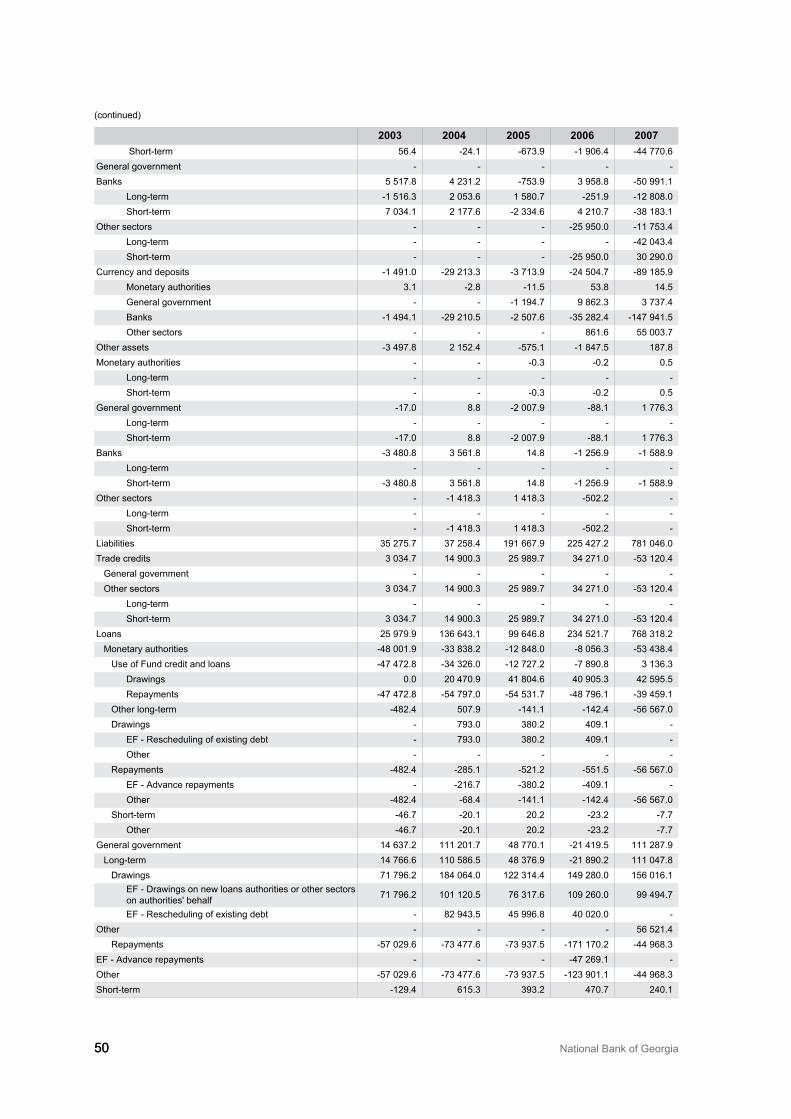
50 National Bank of Georgia50
2003 2004 2005 2006 2007 Short-term 56.4 -24.1 -67�.9 -1 906.4 -44 770.6
General government - - - - -Banks 5 517.8 4 2�1.2 -75�.9 � 958.8 -50 991.1
Long-term -1 516.� 2 05�.6 1 580.7 -251.9 -12 808.0Short-term 7 0�4.1 2 177.6 -2 ��4.6 4 210.7 -�8 18�.1
Other sectors - - - -25 950.0 -11 75�.4Long-term - - - - -42 04�.4Short-term - - - -25 950.0 �0 290.0
Currency and deposits -1 491.0 -29 21�.� -� 71�.9 -24 504.7 -89 185.9Monetary authorities �.1 -2.8 -11.5 5�.8 14.5General government - - -1 194.7 9 862.� � 7�7.4Banks -1 494.1 -29 210.5 -2 507.6 -�5 282.4 -147 941.5Other sectors - - - 861.6 55 00�.7
Other assets -� 497.8 2 152.4 -575.1 -1 847.5 187.8Monetary authorities - - -0.� -0.2 0.5
Long-term - - - - -Short-term - - -0.� -0.2 0.5
General government -17.0 8.8 -2 007.9 -88.1 1 776.�Long-term - - - - -Short-term -17.0 8.8 -2 007.9 -88.1 1 776.�
Banks -� 480.8 � 561.8 14.8 -1 256.9 -1 588.9Long-term - - - - -Short-term -� 480.8 � 561.8 14.8 -1 256.9 -1 588.9
Other sectors - -1 418.� 1 418.� -502.2 -Long-term - - - - -Short-term - -1 418.� 1 418.� -502.2 -
Liabilities �5 275.7 �7 258.4 191 667.9 225 427.2 781 046.0Trade credits � 0�4.7 14 900.� 25 989.7 �4 271.0 -5� 120.4
General government - - - - -Other sectors � 0�4.7 14 900.� 25 989.7 �4 271.0 -5� 120.4
Long-term - - - - -Short-term � 0�4.7 14 900.� 25 989.7 �4 271.0 -5� 120.4
Loans 25 979.9 1�6 64�.1 99 646.8 2�4 521.7 768 �18.2Monetary authorities -48 001.9 -�� 8�8.2 -12 848.0 -8 056.� -5� 4�8.4
Use of Fund credit and loans -47 472.8 -�4 �26.0 -12 727.2 -7 890.8 � 1�6.�Drawings 0.0 20 470.9 41 804.6 40 905.� 42 595.5Repayments -47 472.8 -54 797.0 -54 5�1.7 -48 796.1 -�9 459.1
Other long-term -482.4 507.9 -141.1 -142.4 -56 567.0Drawings - 79�.0 �80.2 409.1 -
EF - Rescheduling of existing debt - 79�.0 �80.2 409.1 -Other - - - - -
Repayments -482.4 -285.1 -521.2 -551.5 -56 567.0EF - Advance repayments - -216.7 -�80.2 -409.1 -Other -482.4 -68.4 -141.1 -142.4 -56 567.0
Short-term -46.7 -20.1 20.2 -2�.2 -7.7Other -46.7 -20.1 20.2 -2�.2 -7.7
General government 14 6�7.2 111 201.7 48 770.1 -21 419.5 111 287.9Long-term 14 766.6 110 586.5 48 �76.9 -21 890.2 111 047.8
Drawings 71 796.2 184 064.0 122 �14.4 149 280.0 156 016.1EF - Drawings on new loans authorities or other sectors on authorities' behalf 71 796.2 101 120.5 76 �17.6 109 260.0 99 494.7
EF - Rescheduling of existing debt - 82 94�.5 45 996.8 40 020.0 -Other - - - - 56 521.4
Repayments -57 029.6 -7� 477.6 -7� 9�7.5 -171 170.2 -44 968.�EF - Advance repayments - - - -47 269.1 -Other -57 029.6 -7� 477.6 -7� 9�7.5 -12� 901.1 -44 968.�Short-term -129.4 615.� �9�.2 470.7 240.1
(continued)
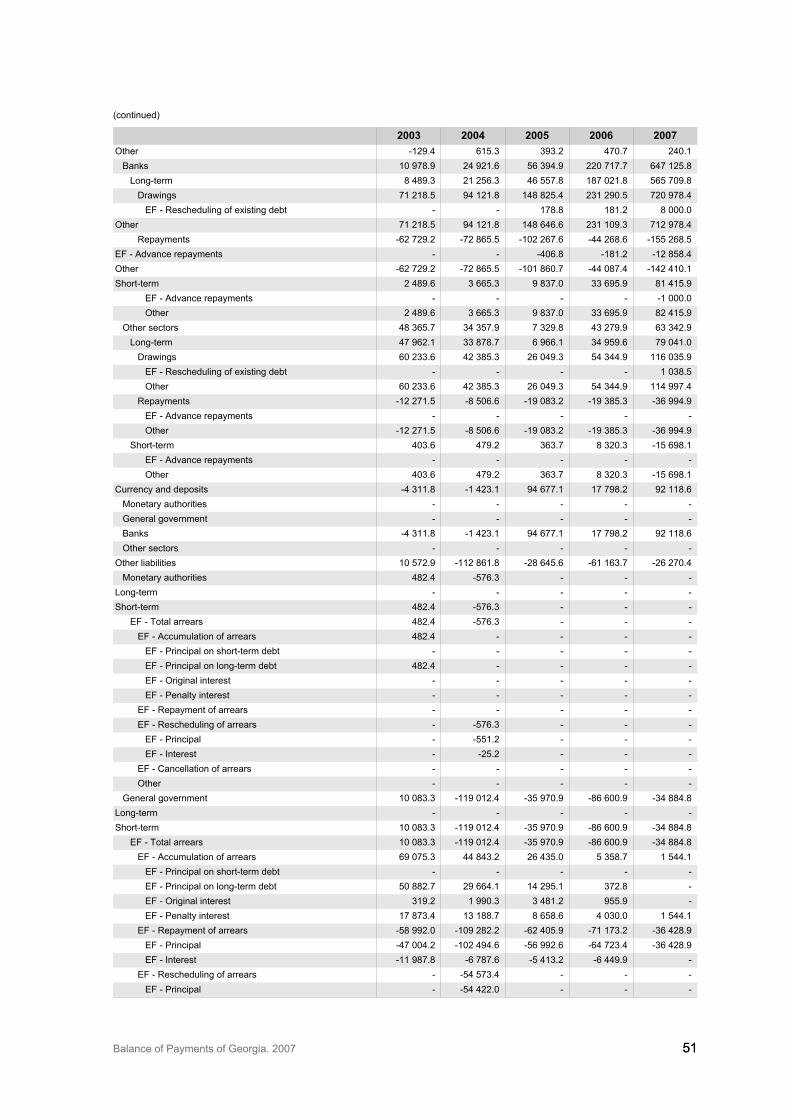
Balance of Payments of Georgia. 2007 5151
2003 2004 2005 2006 2007Other -129.4 615.� �9�.2 470.7 240.1
Banks 10 978.9 24 921.6 56 �94.9 220 717.7 647 125.8Long-term 8 489.� 21 256.� 46 557.8 187 021.8 565 709.8
Drawings 71 218.5 94 121.8 148 825.4 2�1 290.5 720 978.4EF - Rescheduling of existing debt - - 178.8 181.2 8 000.0
Other 71 218.5 94 121.8 148 646.6 2�1 109.� 712 978.4Repayments -62 729.2 -72 865.5 -102 267.6 -44 268.6 -155 268.5
EF - Advance repayments - - -406.8 -181.2 -12 858.4Other -62 729.2 -72 865.5 -101 860.7 -44 087.4 -142 410.1Short-term 2 489.6 � 665.� 9 8�7.0 �� 695.9 81 415.9
EF - Advance repayments - - - - -1 000.0Other 2 489.6 � 665.� 9 8�7.0 �� 695.9 82 415.9
Other sectors 48 �65.7 �4 �57.9 7 �29.8 4� 279.9 6� �42.9Long-term 47 962.1 �� 878.7 6 966.1 �4 959.6 79 041.0
Drawings 60 2��.6 42 �85.� 26 049.� 54 �44.9 116 0�5.9EF - Rescheduling of existing debt - - - - 1 0�8.5Other 60 2��.6 42 �85.� 26 049.� 54 �44.9 114 997.4
Repayments -12 271.5 -8 506.6 -19 08�.2 -19 �85.� -�6 994.9EF - Advance repayments - - - - -Other -12 271.5 -8 506.6 -19 08�.2 -19 �85.� -�6 994.9
Short-term 40�.6 479.2 �6�.7 8 �20.� -15 698.1EF - Advance repayments - - - - -Other 40�.6 479.2 �6�.7 8 �20.� -15 698.1
Currency and deposits -4 �11.8 -1 42�.1 94 677.1 17 798.2 92 118.6Monetary authorities - - - - -General government - - - - -Banks -4 �11.8 -1 42�.1 94 677.1 17 798.2 92 118.6Other sectors - - - - -
Other liabilities 10 572.9 -112 861.8 -28 645.6 -61 16�.7 -26 270.4Monetary authorities 482.4 -576.� - - -
Long-term - - - - -Short-term 482.4 -576.� - - -
EF - Total arrears 482.4 -576.� - - -EF - Accumulation of arrears 482.4 - - - -
EF - Principal on short-term debt - - - - -EF - Principal on long-term debt 482.4 - - - -EF - Original interest - - - - -EF - Penalty interest - - - - -
EF - Repayment of arrears - - - - -EF - Rescheduling of arrears - -576.� - - -
EF - Principal - -551.2 - - -EF - Interest - -25.2 - - -
EF - Cancellation of arrears - - - - -Other - - - - -
General government 10 08�.� -119 012.4 -�5 970.9 -86 600.9 -�4 884.8Long-term - - - - -Short-term 10 08�.� -119 012.4 -�5 970.9 -86 600.9 -�4 884.8
EF - Total arrears 10 08�.� -119 012.4 -�5 970.9 -86 600.9 -�4 884.8EF - Accumulation of arrears 69 075.� 44 84�.2 26 4�5.0 5 �58.7 1 544.1
EF - Principal on short-term debt - - - - -EF - Principal on long-term debt 50 882.7 29 664.1 14 295.1 �72.8 -EF - Original interest �19.2 1 990.� � 481.2 955.9 -EF - Penalty interest 17 87�.4 1� 188.7 8 658.6 4 0�0.0 1 544.1
EF - Repayment of arrears -58 992.0 -109 282.2 -62 405.9 -71 17�.2 -�6 428.9EF - Principal -47 004.2 -102 494.6 -56 992.6 -64 72�.4 -�6 428.9EF - Interest -11 987.8 -6 787.6 -5 41�.2 -6 449.9 -
EF - Rescheduling of arrears - -54 57�.4 - - -EF - Principal - -54 422.0 - - -
(continued)
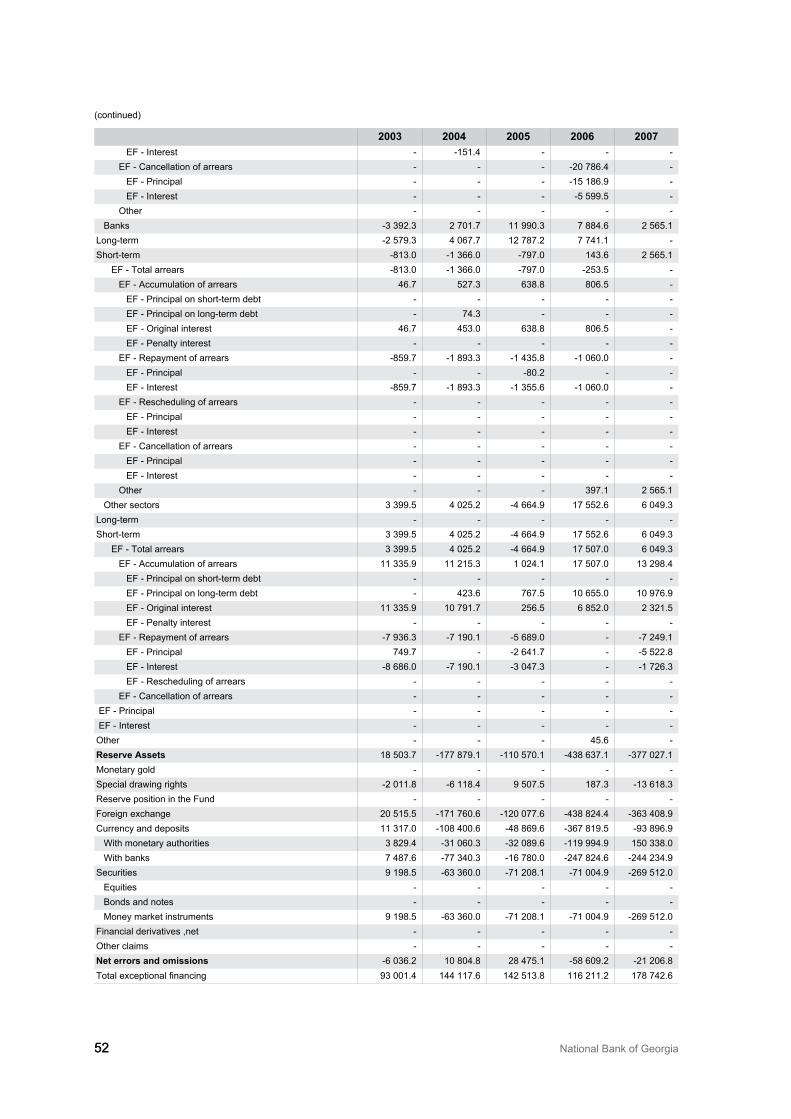
52 National Bank of Georgia52
2003 2004 2005 2006 2007EF - Interest - -151.4 - - -
EF - Cancellation of arrears - - - -20 786.4 -EF - Principal - - - -15 186.9 -EF - Interest - - - -5 599.5 -
Other - - - - -Banks -� �92.� 2 701.7 11 990.� 7 884.6 2 565.1
Long-term -2 579.� 4 067.7 12 787.2 7 741.1 -Short-term -81�.0 -1 �66.0 -797.0 14�.6 2 565.1
EF - Total arrears -81�.0 -1 �66.0 -797.0 -25�.5 -EF - Accumulation of arrears 46.7 527.� 6�8.8 806.5 -
EF - Principal on short-term debt - - - - -EF - Principal on long-term debt - 74.� - - -EF - Original interest 46.7 45�.0 6�8.8 806.5 -EF - Penalty interest - - - - -
EF - Repayment of arrears -859.7 -1 89�.� -1 4�5.8 -1 060.0 -EF - Principal - - -80.2 - -EF - Interest -859.7 -1 89�.� -1 �55.6 -1 060.0 -
EF - Rescheduling of arrears - - - - -EF - Principal - - - - -EF - Interest - - - - -
EF - Cancellation of arrears - - - - -EF - Principal - - - - -EF - Interest - - - - -
Other - - - �97.1 2 565.1Other sectors � �99.5 4 025.2 -4 664.9 17 552.6 6 049.�
Long-term - - - - -Short-term � �99.5 4 025.2 -4 664.9 17 552.6 6 049.�
EF - Total arrears � �99.5 4 025.2 -4 664.9 17 507.0 6 049.�EF - Accumulation of arrears 11 ��5.9 11 215.� 1 024.1 17 507.0 1� 298.4
EF - Principal on short-term debt - - - - -EF - Principal on long-term debt - 42�.6 767.5 10 655.0 10 976.9EF - Original interest 11 ��5.9 10 791.7 256.5 6 852.0 2 �21.5EF - Penalty interest - - - - -
EF - Repayment of arrears -7 9�6.� -7 190.1 -5 689.0 - -7 249.1EF - Principal 749.7 - -2 641.7 - -5 522.8EF - Interest -8 686.0 -7 190.1 -� 047.� - -1 726.�EF - Rescheduling of arrears - - - - -
EF - Cancellation of arrears - - - - - EF - Principal - - - - - EF - Interest - - - - -Other - - - 45.6 -reserve assets 18 50�.7 -177 879.1 -110 570.1 -4�8 6�7.1 -�77 027.1Monetary gold - - - - -Special drawing rights -2 011.8 -6 118.4 9 507.5 187.� -1� 618.�Reserve position in the Fund - - - - -Foreign exchange 20 515.5 -171 760.6 -120 077.6 -4�8 824.4 -�6� 408.9Currency and deposits 11 �17.0 -108 400.6 -48 869.6 -�67 819.5 -9� 896.9
With monetary authorities � 829.4 -�1 060.� -�2 089.6 -119 994.9 150 ��8.0With banks 7 487.6 -77 �40.� -16 780.0 -247 824.6 -244 2�4.9
Securities 9 198.5 -6� �60.0 -71 208.1 -71 004.9 -269 512.0Equities - - - - -Bonds and notes - - - - -Money market instruments 9 198.5 -6� �60.0 -71 208.1 -71 004.9 -269 512.0
Financial derivatives ,net - - - - -Other claims - - - - -Net errors and omissions -6 0�6.2 10 804.8 28 475.1 -58 609.2 -21 206.8Total exceptional financing 9� 001.4 144 117.6 142 51�.8 116 211.2 178 742.6
(continued)
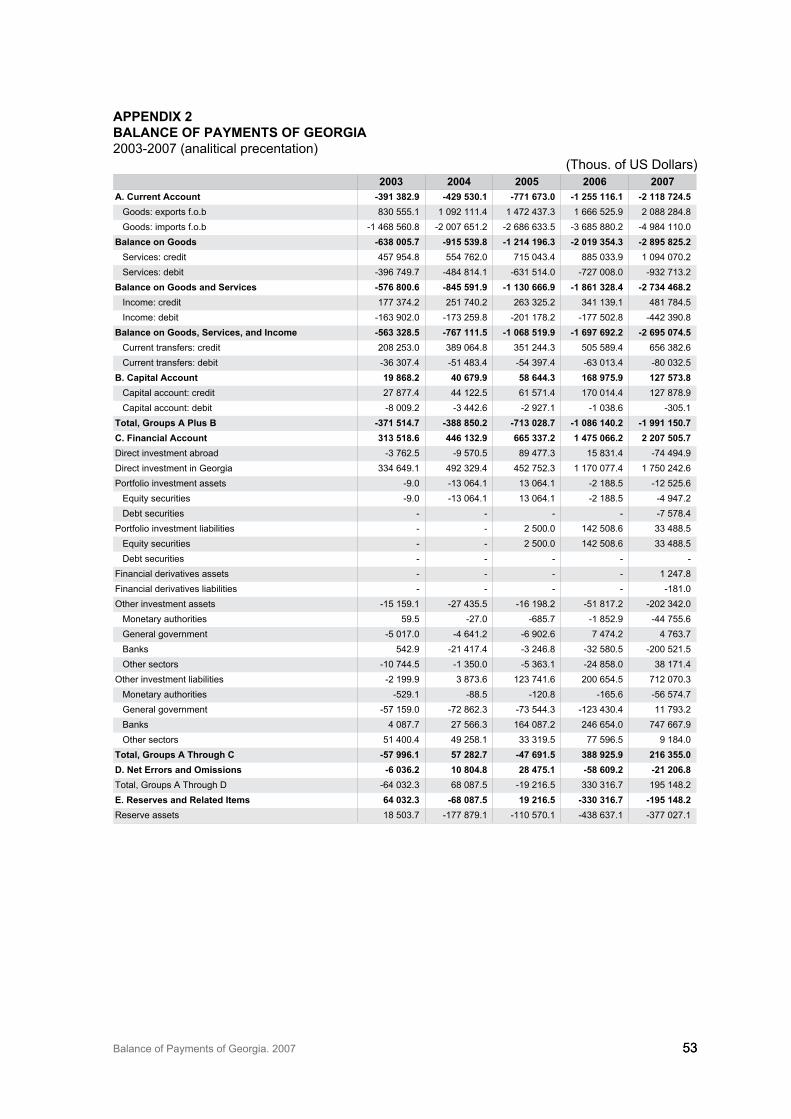
Balance of Payments of Georgia. 2007 5�5�
appeNdix 2BalaNce of paymeNts of GeorGia200�-2007 (analitical precentation)
(Thous. of US Dollars) 2003 2004 2005 2006 2007
a. current account 391 382.9 429 530.1 771 673.0 1 255 116.1 2 118 724.5Goods: exports f.o.b 8�0 555.1 1 092 111.4 1 472 4�7.� 1 666 525.9 2 088 284.8Goods: imports f.o.b -1 468 560.8 -2 007 651.2 -2 686 6��.5 -� 685 880.2 -4 984 110.0
Balance on Goods 638 005.7 915 539.8 1 214 196.3 2 019 354.3 2 895 825.2Services: credit 457 954.8 554 762.0 715 04�.4 885 0��.9 1 094 070.2Services: debit -�96 749.7 -484 814.1 -6�1 514.0 -727 008.0 -9�2 71�.2
Balance on Goods and services 576 800.6 845 591.9 1 130 666.9 1 861 328.4 2 734 468.2Income: credit 177 �74.2 251 740.2 26� �25.2 �41 1�9.1 481 784.5Income: debit -16� 902.0 -17� 259.8 -201 178.2 -177 502.8 -442 �90.8
Balance on Goods, services, and income 563 328.5 767 111.5 1 068 519.9 1 697 692.2 2 695 074.5Current transfers: credit 208 25�.0 �89 064.8 �51 244.� 505 589.4 656 �82.6Current transfers: debit -�6 �07.4 -51 48�.4 -54 �97.4 -6� 01�.4 -80 0�2.5
B. capital account 19 868.2 40 679.9 58 644.3 168 975.9 127 573.8Capital account: credit 27 877.4 44 122.5 61 571.4 170 014.4 127 878.9Capital account: debit -8 009.2 -� 442.6 -2 927.1 -1 0�8.6 -�05.1
total, Groups a plus B 371 514.7 388 850.2 713 028.7 1 086 140.2 1 991 150.7c. financial account 313 518.6 446 132.9 665 337.2 1 475 066.2 2 207 505.7Direct investment abroad -� 762.5 -9 570.5 89 477.� 15 8�1.4 -74 494.9Direct investment in Georgia ��4 649.1 492 �29.4 452 752.� 1 170 077.4 1 750 242.6Portfolio investment assets -9.0 -1� 064.1 1� 064.1 -2 188.5 -12 525.6
Equity securities -9.0 -1� 064.1 1� 064.1 -2 188.5 -4 947.2Debt securities - - - - -7 578.4
Portfolio investment liabilities - - 2 500.0 142 508.6 �� 488.5Equity securities - - 2 500.0 142 508.6 �� 488.5Debt securities - - - - -
Financial derivatives assets - - - - 1 247.8Financial derivatives liabilities - - - - -181.0Other investment assets -15 159.1 -27 4�5.5 -16 198.2 -51 817.2 -202 �42.0
Monetary authorities 59.5 -27.0 -685.7 -1 852.9 -44 755.6General government -5 017.0 -4 641.2 -6 902.6 7 474.2 4 76�.7Banks 542.9 -21 417.4 -� 246.8 -�2 580.5 -200 521.5Other sectors -10 744.5 -1 �50.0 -5 �6�.1 -24 858.0 �8 171.4
Other investment liabilities -2 199.9 � 87�.6 12� 741.6 200 654.5 712 070.�Monetary authorities -529.1 -88.5 -120.8 -165.6 -56 574.7General government -57 159.0 -72 862.� -7� 544.� -12� 4�0.4 11 79�.2Banks 4 087.7 27 566.� 164 087.2 246 654.0 747 667.9Other sectors 51 400.4 49 258.1 �� �19.5 77 596.5 9 184.0
total, Groups a through c 57 996.1 57 282.7 47 691.5 388 925.9 216 355.0d. Net errors and omissions 6 036.2 10 804.8 28 475.1 58 609.2 21 206.8Total, Groups A Through D -64 0�2.� 68 087.5 -19 216.5 ��0 �16.7 195 148.2e. reserves and related items 64 032.3 68 087.5 19 216.5 330 316.7 195 148.2Reserve assets 18 50�.7 -177 879.1 -110 570.1 -4�8 6�7.1 -�77 027.1

54 National Bank of Georgia54
appeNdix 3BalaNce of paymeNts of GeorGiaQuarters of 2007 (standard precentation)
(Thous. of US Dollars) i Q ii Q iii Q iv Q total
current account 396 827.3 409 073.2 406 316.4 793 606.2 2 005 823.1Goods 599 210.8 568 517.6 694 913.5 1 033 183.3 2 895 825.2
Credit �88 989.0 545 606.0 547 94�.7 605 746.1 2 088 284.8Debit -988 199.7 -1 114 12�.6 -1 242 857.2 -1 6�8 929.4 4 984 110.0
General merchandise -610 895.6 -602 477.� -706 48�.7 -1 058 588.1 2 978 444.8Credit �71 6�9.7 505 697.� 517 65�.5 568 1�1.1 1 963 121.6Debit -982 5�5.4 -1 108 174.6 -1 224 1�7.2 -1 626 719.1 4 941 566.4
Goods for processing 248.2 17 �91.1 -9 852.1 -� 258.5 4 528.7Credit 2 891.4 20 024.8 4 �50.7 4 5�5.9 31 802.8Debit -2 64�.2 -2 6��.6 -14 202.8 -7 794.4 27 274.1
Processing abroad -9�9.4 -466.7 -674.0 -0.2 2 080.3Credit 4.9 121.8 756.9 - 883.6Debit -944.2 -588.5 -1 4�0.9 -0.2 2 963.9
Processing in the compiling economy 1 187.6 17 857.8 -9 178.1 -� 258.� 6 609.0Credit 2 886.5 19 90�.0 � 59�.8 4 5�5.9 30 919.2Debit -1 699.0 -2 045.1 -12 771.9 -7 794.2 24 310.2
Repairs on goods -�05.5 -248.5 6.4 -89.8 637.5Credit 100.8 4.2 114.0 504.0 722.9Debit -406.� -252.7 -107.6 -59�.8 1 360.4
Goods procured in ports by carriers 2 �02.7 2 �62.9 2 106.0 2 629.4 9 400.9Credit 4 917.6 5 420.2 6 515.5 6 �92.4 23 245.7Debit -2 614.9 -� 057.� -4 409.6 -� 76�.0 13 844.8
In seaports 951.6 1 017.0 964.� 778.4 3 711.2Credit 1 0��.2 1 080.6 1 047.0 842.5 4 003.3Debit -81.6 -6�.6 -82.7 -64.1 292.1
In airports 1 �51.1 1 �46.0 1 141.7 1 851.0 5 689.7Credit � 884.4 4 ��9.6 5 468.5 5 549.9 19 242.4Debit -2 5��.� -2 99�.6 -4 �26.9 -� 698.9 13 552.7
Nonmonetary gold 9 4�9.4 14 454.2 19 �10.1 26 12�.8 69 327.4Credit 9 4�9.4 14 459.5 19 �10.1 26 182.7 69 391.7Debit - -5.4 - -59.0 64.3
Held as a store of value - - - - Other 9 4�9.4 14 454.2 19 �10.1 26 12�.8 69 327.4
Credit 9 4�9.4 14 459.5 19 �10.1 26 182.7 69 391.7Debit - -5.4 - -59.0 64.3
services 20 995.5 59 689.8 80 021.6 650.1 161 357.0Credit 206 857.6 266 15�.0 �25 422.6 295 6�7.0 1 094 070.2Debit -185 862.1 -206 46�.1 -245 401.0 -294 986.9 932 713.2
transportation 1 260.5 9 581.7 6 879.2 -1� 599.5 4 121.8Credit 97 468.8 12� 917.8 14� 776.6 146 262.� 511 425.5Debit -96 208.4 -114 ��6.1 -1�6 897.4 -159 861.8 507 303.7
Passenger -10 149.4 -10 97�.8 -10 899.1 -1� 051.� 45 073.6Credit 9 06�.1 1� 092.2 20 297.5 1� 584.9 56 037.8Debit -19 212.5 -24 066.1 -�1 196.5 -26 6�6.� 101 111.4
Freight -14 948.� -11 875.0 -17 �75.8 -29 555.8 73 754.9Credit 56 814.8 72 505.1 81 145.7 97 055.2 307 520.8Debit -71 76�.1 -84 �80.1 -98 521.4 -126 611.0 381 275.6
Other 26 �58.2 �2 4�0.4 �5 154.1 29 007.6 122 950.3Credit �1 590.9 �8 �20.4 42 ���.5 �5 622.2 147 867.0Debit -5 2�2.7 -5 890.0 -7 179.4 -6 614.6 24 916.7
sea transport -5 405.1 -5 0�0.1 -6 41�.1 -20 011.4 36 859.7Credit 24 024.4 28 852.6 �1 �88.4 25 4�2.0 109 697.4Debit -29 429.5 -�� 882.7 -�7 801.5 -45 44�.4 146 557.1
Passenger �58.6 426.8 452.0 10�.2 1 340.6Credit 490.0 540.2 557.9 216.9 1 805.0Debit -1�1.4 -11�.4 -105.9 -11�.7 464.3
Freight -26 250.4 -�0 822.9 -�5 100.2 -4� 008.8 135 182.3Credit 1 41�.8 1 446.7 1 282.� 1 �10.4 5 453.3Debit -27 664.� -�2 269.6 -�6 �82.5 -44 �19.1 140 635.5
Other 20 486.7 25 �66.0 28 2�5.1 22 894.2 96 982.0Credit 22 120.5 26 865.8 29 548.2 2� 904.7 102 439.2Debit -1 6��.8 -1 499.7 -1 �1�.1 -1 010.5 5 457.2
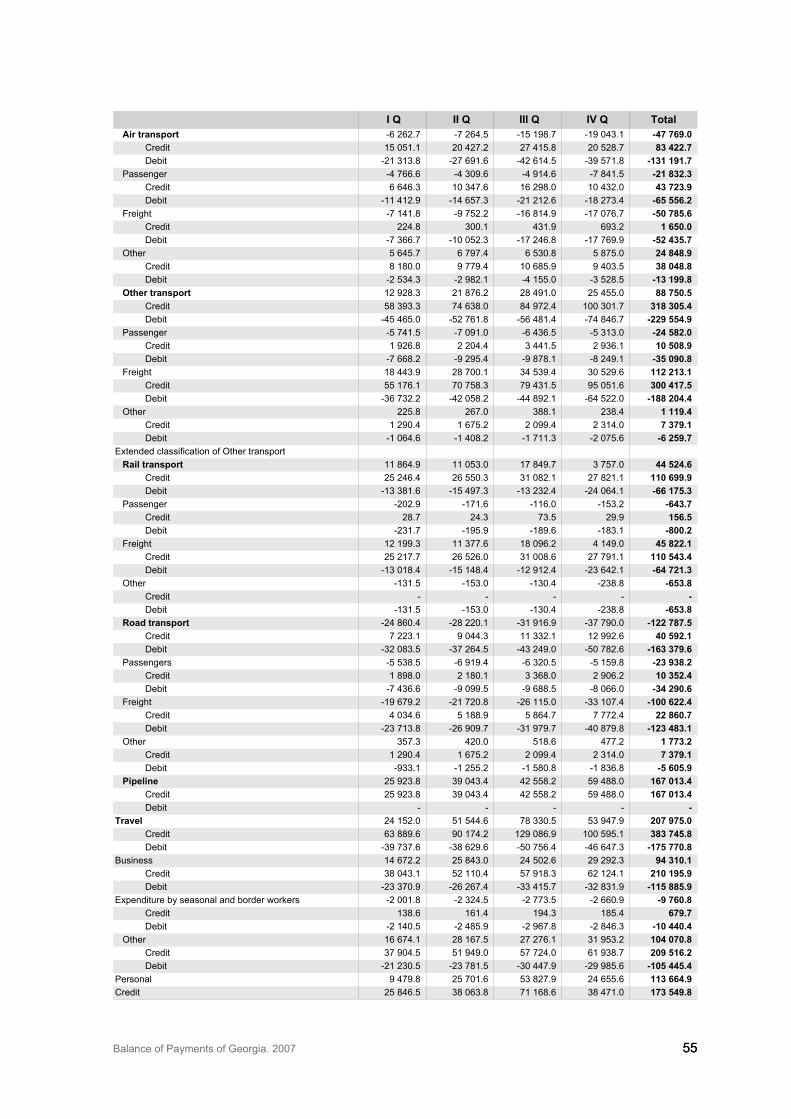
Balance of Payments of Georgia. 2007 5555
i Q ii Q iii Q iv Q totalair transport -6 262.7 -7 264.5 -15 198.7 -19 04�.1 47 769.0
Credit 15 051.1 20 427.2 27 415.8 20 528.7 83 422.7Debit -21 �1�.8 -27 691.6 -42 614.5 -�9 571.8 131 191.7
Passenger -4 766.6 -4 �09.6 -4 914.6 -7 841.5 21 832.3Credit 6 646.� 10 �47.6 16 298.0 10 4�2.0 43 723.9Debit -11 412.9 -14 657.� -21 212.6 -18 27�.4 65 556.2
Freight -7 141.8 -9 752.2 -16 814.9 -17 076.7 50 785.6Credit 224.8 �00.1 4�1.9 69�.2 1 650.0Debit -7 �66.7 -10 052.� -17 246.8 -17 769.9 52 435.7
Other 5 645.7 6 797.4 6 5�0.8 5 875.0 24 848.9Credit 8 180.0 9 779.4 10 685.9 9 40�.5 38 048.8Debit -2 5�4.� -2 982.1 -4 155.0 -� 528.5 13 199.8
other transport 12 928.� 21 876.2 28 491.0 25 455.0 88 750.5Credit 58 �9�.� 74 6�8.0 84 972.4 100 �01.7 318 305.4Debit -45 465.0 -52 761.8 -56 481.4 -74 846.7 229 554.9
Passenger -5 741.5 -7 091.0 -6 4�6.5 -5 �1�.0 24 582.0Credit 1 926.8 2 204.4 � 441.5 2 9�6.1 10 508.9Debit -7 668.2 -9 295.4 -9 878.1 -8 249.1 35 090.8
Freight 18 44�.9 28 700.1 �4 5�9.4 �0 529.6 112 213.1Credit 55 176.1 70 758.� 79 4�1.5 95 051.6 300 417.5Debit -�6 7�2.2 -42 058.2 -44 892.1 -64 522.0 188 204.4
Other 225.8 267.0 �88.1 2�8.4 1 119.4Credit 1 290.4 1 675.2 2 099.4 2 �14.0 7 379.1Debit -1 064.6 -1 408.2 -1 711.� -2 075.6 6 259.7
Extended classification of Other transport rail transport 11 864.9 11 05�.0 17 849.7 � 757.0 44 524.6
Credit 25 246.4 26 550.� �1 082.1 27 821.1 110 699.9Debit -1� �81.6 -15 497.� -1� 2�2.4 -24 064.1 66 175.3
Passenger -202.9 -171.6 -116.0 -15�.2 643.7Credit 28.7 24.� 7�.5 29.9 156.5Debit -2�1.7 -195.9 -189.6 -18�.1 800.2
Freight 12 199.� 11 �77.6 18 096.2 4 149.0 45 822.1Credit 25 217.7 26 526.0 �1 008.6 27 791.1 110 543.4Debit -1� 018.4 -15 148.4 -12 912.4 -2� 642.1 64 721.3
Other -1�1.5 -15�.0 -1�0.4 -2�8.8 653.8Credit - - - - Debit -1�1.5 -15�.0 -1�0.4 -2�8.8 653.8
road transport -24 860.4 -28 220.1 -�1 916.9 -�7 790.0 122 787.5Credit 7 22�.1 9 044.� 11 ��2.1 12 992.6 40 592.1Debit -�2 08�.5 -�7 264.5 -4� 249.0 -50 782.6 163 379.6
Passengers -5 5�8.5 -6 919.4 -6 �20.5 -5 159.8 23 938.2Credit 1 898.0 2 180.1 � �68.0 2 906.2 10 352.4Debit -7 4�6.6 -9 099.5 -9 688.5 -8 066.0 34 290.6
Freight -19 679.2 -21 720.8 -26 115.0 -�� 107.4 100 622.4Credit 4 0�4.6 5 188.9 5 864.7 7 772.4 22 860.7Debit -2� 71�.8 -26 909.7 -�1 979.7 -40 879.8 123 483.1
Other �57.� 420.0 518.6 477.2 1 773.2Credit 1 290.4 1 675.2 2 099.4 2 �14.0 7 379.1Debit -9��.1 -1 255.2 -1 580.8 -1 8�6.8 5 605.9
pipeline 25 92�.8 �9 04�.4 42 558.2 59 488.0 167 013.4Credit 25 92�.8 �9 04�.4 42 558.2 59 488.0 167 013.4Debit - - - -
travel 24 152.0 51 544.6 78 ��0.5 5� 947.9 207 975.0Credit 6� 889.6 90 174.2 129 086.9 100 595.1 383 745.8Debit -�9 7�7.6 -�8 629.6 -50 756.4 -46 647.� 175 770.8
Business 14 672.2 25 84�.0 24 502.6 29 292.� 94 310.1Credit �8 04�.1 52 110.4 57 918.� 62 124.1 210 195.9Debit -2� �70.9 -26 267.4 -�� 415.7 -�2 8�1.9 115 885.9
Expenditure by seasonal and border workers -2 001.8 -2 �24.5 -2 77�.5 -2 660.9 9 760.8Credit 1�8.6 161.4 194.� 185.4 679.7Debit -2 140.5 -2 485.9 -2 967.8 -2 846.� 10 440.4
Other 16 674.1 28 167.5 27 276.1 �1 95�.2 104 070.8Credit �7 904.5 51 949.0 57 724.0 61 9�8.7 209 516.2Debit -21 2�0.5 -2� 781.5 -�0 447.9 -29 985.6 105 445.4
Personal 9 479.8 25 701.6 5� 827.9 24 655.6 113 664.9Credit 25 846.5 �8 06�.8 71 168.6 �8 471.0 173 549.8
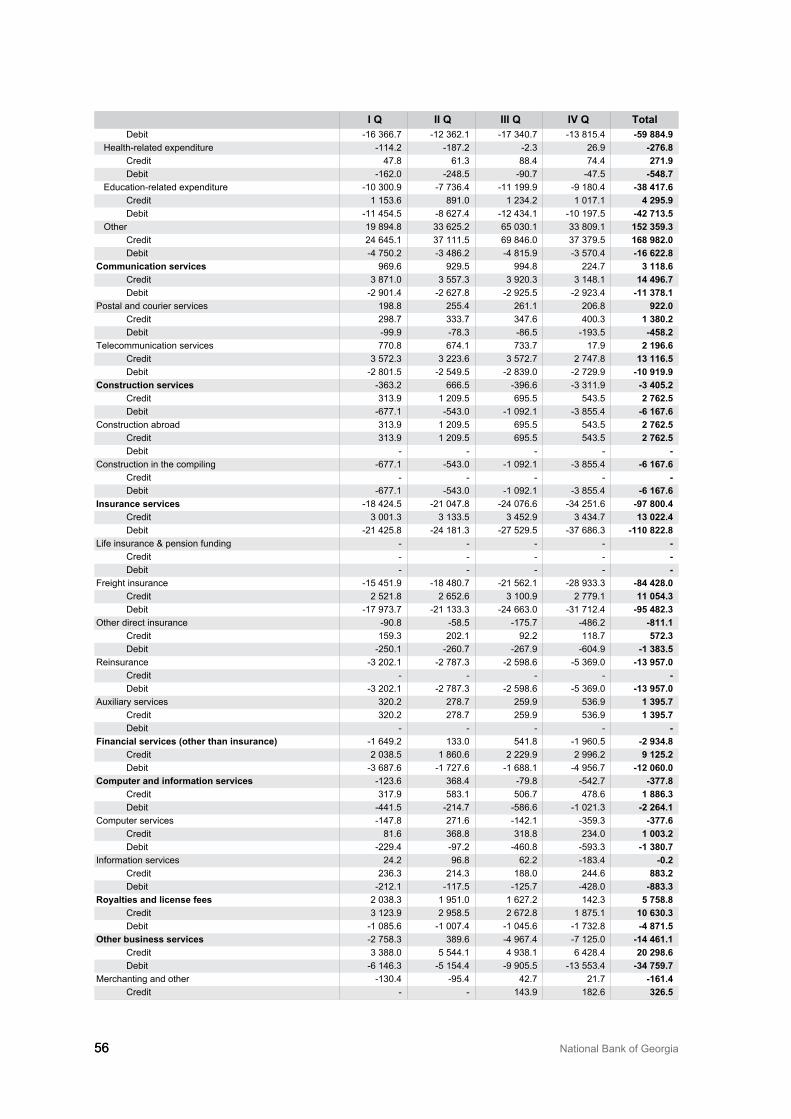
56 National Bank of Georgia56
i Q ii Q iii Q iv Q totalDebit -16 �66.7 -12 �62.1 -17 �40.7 -1� 815.4 59 884.9
Health-related expenditure -114.2 -187.2 -2.� 26.9 276.8Credit 47.8 61.� 88.4 74.4 271.9Debit -162.0 -248.5 -90.7 -47.5 548.7
Education-related expenditure -10 �00.9 -7 7�6.4 -11 199.9 -9 180.4 38 417.6Credit 1 15�.6 891.0 1 2�4.2 1 017.1 4 295.9Debit -11 454.5 -8 627.4 -12 4�4.1 -10 197.5 42 713.5
Other 19 894.8 �� 625.2 65 0�0.1 �� 809.1 152 359.3Credit 24 645.1 �7 111.5 69 846.0 �7 �79.5 168 982.0Debit -4 750.2 -� 486.2 -4 815.9 -� 570.4 16 622.8
communication services 969.6 929.5 994.8 224.7 3 118.6Credit � 871.0 � 557.� � 920.� � 148.1 14 496.7Debit -2 901.4 -2 627.8 -2 925.5 -2 92�.4 11 378.1
Postal and courier services 198.8 255.4 261.1 206.8 922.0Credit 298.7 ���.7 �47.6 400.� 1 380.2Debit -99.9 -78.� -86.5 -19�.5 458.2
Telecommunication services 770.8 674.1 7��.7 17.9 2 196.6Credit � 572.� � 22�.6 � 572.7 2 747.8 13 116.5Debit -2 801.5 -2 549.5 -2 8�9.0 -2 729.9 10 919.9
construction services -�6�.2 666.5 -�96.6 -� �11.9 3 405.2Credit �1�.9 1 209.5 695.5 54�.5 2 762.5Debit -677.1 -54�.0 -1 092.1 -� 855.4 6 167.6
Construction abroad �1�.9 1 209.5 695.5 54�.5 2 762.5Credit �1�.9 1 209.5 695.5 54�.5 2 762.5Debit - - - -
Construction in the compiling -677.1 -54�.0 -1 092.1 -� 855.4 6 167.6Credit - - - - Debit -677.1 -54�.0 -1 092.1 -� 855.4 6 167.6
insurance services -18 424.5 -21 047.8 -24 076.6 -�4 251.6 97 800.4Credit � 001.� � 1��.5 � 452.9 � 4�4.7 13 022.4Debit -21 425.8 -24 181.� -27 529.5 -�7 686.� 110 822.8
Life insurance & pension funding - - - - Credit - - - - Debit - - - -
Freight insurance -15 451.9 -18 480.7 -21 562.1 -28 9��.� 84 428.0Credit 2 521.8 2 652.6 � 100.9 2 779.1 11 054.3Debit -17 97�.7 -21 1��.� -24 66�.0 -�1 712.4 95 482.3
Other direct insurance -90.8 -58.5 -175.7 -486.2 811.1Credit 159.� 202.1 92.2 118.7 572.3Debit -250.1 -260.7 -267.9 -604.9 1 383.5
Reinsurance -� 202.1 -2 787.� -2 598.6 -5 �69.0 13 957.0Credit - - - - Debit -� 202.1 -2 787.� -2 598.6 -5 �69.0 13 957.0
Auxiliary services �20.2 278.7 259.9 5�6.9 1 395.7Credit �20.2 278.7 259.9 5�6.9 1 395.7Debit - - - -
financial services (other than insurance) -1 649.2 1��.0 541.8 -1 960.5 2 934.8Credit 2 0�8.5 1 860.6 2 229.9 2 996.2 9 125.2Debit -� 687.6 -1 727.6 -1 688.1 -4 956.7 12 060.0
computer and information services -12�.6 �68.4 -79.8 -542.7 377.8Credit �17.9 58�.1 506.7 478.6 1 886.3Debit -441.5 -214.7 -586.6 -1 021.� 2 264.1
Computer services -147.8 271.6 -142.1 -�59.� 377.6Credit 81.6 �68.8 �18.8 2�4.0 1 003.2Debit -229.4 -97.2 -460.8 -59�.� 1 380.7
Information services 24.2 96.8 62.2 -18�.4 0.2Credit 2�6.� 214.� 188.0 244.6 883.2Debit -212.1 -117.5 -125.7 -428.0 883.3
royalties and license fees 2 0�8.� 1 951.0 1 627.2 142.� 5 758.8Credit � 12�.9 2 958.5 2 672.8 1 875.1 10 630.3Debit -1 085.6 -1 007.4 -1 045.6 -1 7�2.8 4 871.5
other business services -2 758.� �89.6 -4 967.4 -7 125.0 14 461.1Credit � �88.0 5 544.1 4 9�8.1 6 428.4 20 298.6Debit -6 146.� -5 154.4 -9 905.5 -1� 55�.4 34 759.7
Merchanting and other -1�0.4 -95.4 42.7 21.7 161.4Credit - - 14�.9 182.6 326.5
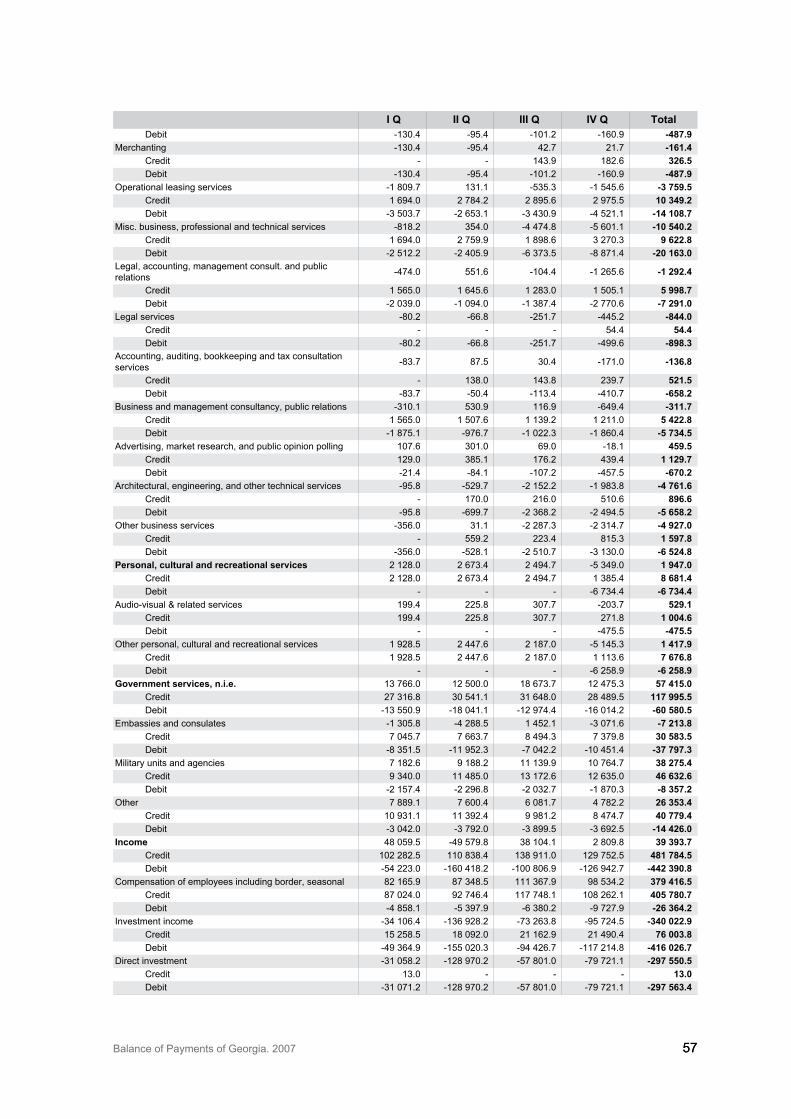
Balance of Payments of Georgia. 2007 5757
i Q ii Q iii Q iv Q totalDebit -1�0.4 -95.4 -101.2 -160.9 487.9
Merchanting -1�0.4 -95.4 42.7 21.7 161.4Credit - - 14�.9 182.6 326.5Debit -1�0.4 -95.4 -101.2 -160.9 487.9
Operational leasing services -1 809.7 1�1.1 -5�5.� -1 545.6 3 759.5Credit 1 694.0 2 784.2 2 895.6 2 975.5 10 349.2Debit -� 50�.7 -2 65�.1 -� 4�0.9 -4 521.1 14 108.7
Misc. business, professional and technical services -818.2 �54.0 -4 474.8 -5 601.1 10 540.2Credit 1 694.0 2 759.9 1 898.6 � 270.� 9 622.8Debit -2 512.2 -2 405.9 -6 �7�.5 -8 871.4 20 163.0
Legal, accounting, management consult. and public relations -474.0 551.6 -104.4 -1 265.6 1 292.4
Credit 1 565.0 1 645.6 1 28�.0 1 505.1 5 998.7Debit -2 0�9.0 -1 094.0 -1 �87.4 -2 770.6 7 291.0
Legal services -80.2 -66.8 -251.7 -445.2 844.0Credit - - - 54.4 54.4Debit -80.2 -66.8 -251.7 -499.6 898.3
Accounting, auditing, bookkeeping and tax consultation services -8�.7 87.5 �0.4 -171.0 136.8
Credit - 1�8.0 14�.8 2�9.7 521.5Debit -8�.7 -50.4 -11�.4 -410.7 658.2
Business and management consultancy, public relations -�10.1 5�0.9 116.9 -649.4 311.7Credit 1 565.0 1 507.6 1 1�9.2 1 211.0 5 422.8Debit -1 875.1 -976.7 -1 022.� -1 860.4 5 734.5
Advertising, market research, and public opinion polling 107.6 �01.0 69.0 -18.1 459.5Credit 129.0 �85.1 176.2 4�9.4 1 129.7Debit -21.4 -84.1 -107.2 -457.5 670.2
Architectural, engineering, and other technical services -95.8 -529.7 -2 152.2 -1 98�.8 4 761.6Credit - 170.0 216.0 510.6 896.6Debit -95.8 -699.7 -2 �68.2 -2 494.5 5 658.2
Other business services -�56.0 �1.1 -2 287.� -2 �14.7 4 927.0Credit - 559.2 22�.4 815.� 1 597.8Debit -�56.0 -528.1 -2 510.7 -� 1�0.0 6 524.8
personal, cultural and recreational services 2 128.0 2 67�.4 2 494.7 -5 �49.0 1 947.0Credit 2 128.0 2 67�.4 2 494.7 1 �85.4 8 681.4Debit - - - -6 7�4.4 6 734.4
Audio-visual & related services 199.4 225.8 �07.7 -20�.7 529.1Credit 199.4 225.8 �07.7 271.8 1 004.6Debit - - - -475.5 475.5
Other personal, cultural and recreational services 1 928.5 2 447.6 2 187.0 -5 145.� 1 417.9Credit 1 928.5 2 447.6 2 187.0 1 11�.6 7 676.8Debit - - - -6 258.9 6 258.9
Government services, n.i.e. 1� 766.0 12 500.0 18 67�.7 12 475.� 57 415.0Credit 27 �16.8 �0 541.1 �1 648.0 28 489.5 117 995.5Debit -1� 550.9 -18 041.1 -12 974.4 -16 014.2 60 580.5
Embassies and consulates -1 �05.8 -4 288.5 1 452.1 -� 071.6 7 213.8Credit 7 045.7 7 66�.7 8 494.� 7 �79.8 30 583.5Debit -8 �51.5 -11 952.� -7 042.2 -10 451.4 37 797.3
Military units and agencies 7 182.6 9 188.2 11 1�9.9 10 764.7 38 275.4Credit 9 �40.0 11 485.0 1� 172.6 12 6�5.0 46 632.6Debit -2 157.4 -2 296.8 -2 0�2.7 -1 870.� 8 357.2
Other 7 889.1 7 600.4 6 081.7 4 782.2 26 353.4Credit 10 9�1.1 11 �92.4 9 981.2 8 474.7 40 779.4Debit -� 042.0 -� 792.0 -� 899.5 -� 692.5 14 426.0
income 48 059.5 -49 579.8 �8 104.1 2 809.8 39 393.7Credit 102 282.5 110 8�8.4 1�8 911.0 129 752.5 481 784.5Debit -54 22�.0 -160 418.2 -100 806.9 -126 942.7 442 390.8
Compensation of employees including border, seasonal 82 165.9 87 �48.5 111 �67.9 98 5�4.2 379 416.5Credit 87 024.0 92 746.4 117 748.1 108 262.1 405 780.7Debit -4 858.1 -5 �97.9 -6 �80.2 -9 727.9 26 364.2
Investment income -�4 106.4 -1�6 928.2 -7� 26�.8 -95 724.5 340 022.9Credit 15 258.5 18 092.0 21 162.9 21 490.4 76 003.8Debit -49 �64.9 -155 020.� -94 426.7 -117 214.8 416 026.7
Direct investment -�1 058.2 -128 970.2 -57 801.0 -79 721.1 297 550.5Credit 1�.0 - - - 13.0Debit -�1 071.2 -128 970.2 -57 801.0 -79 721.1 297 563.4
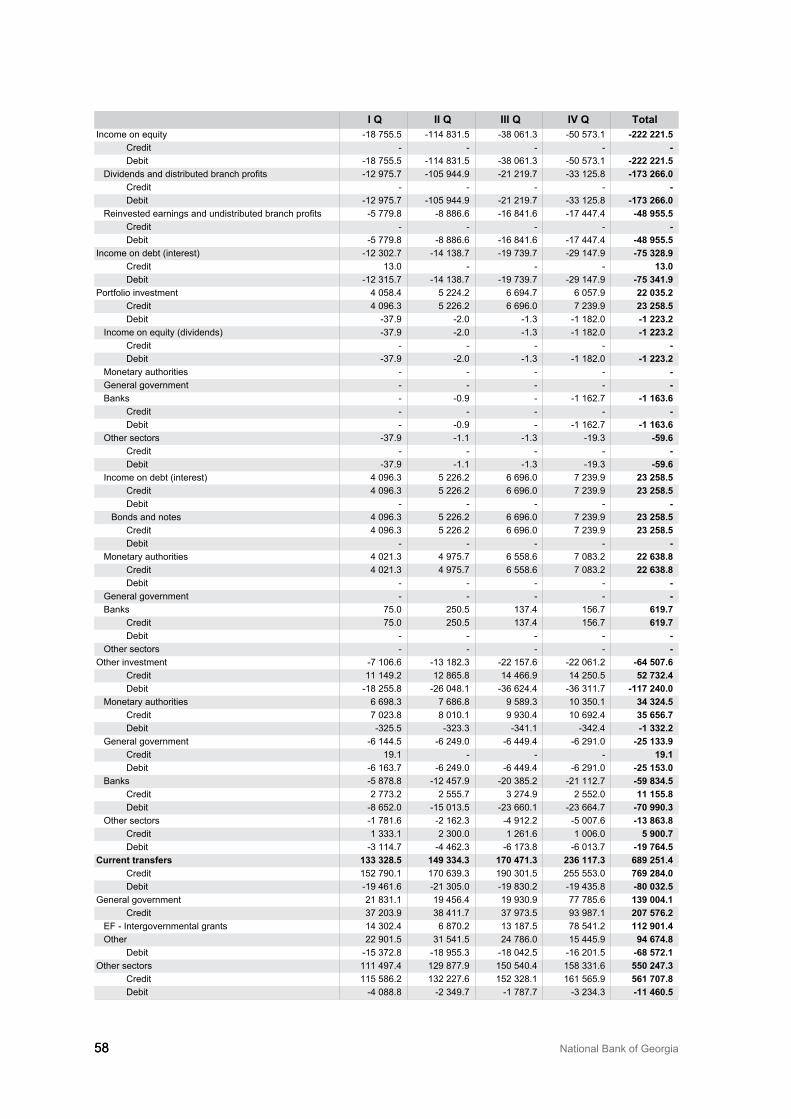
58 National Bank of Georgia58
i Q ii Q iii Q iv Q totalIncome on equity -18 755.5 -114 8�1.5 -�8 061.� -50 57�.1 222 221.5
Credit - - - - Debit -18 755.5 -114 8�1.5 -�8 061.� -50 57�.1 222 221.5
Dividends and distributed branch profits -12 975.7 -105 944.9 -21 219.7 -�� 125.8 173 266.0Credit - - - - Debit -12 975.7 -105 944.9 -21 219.7 -�� 125.8 173 266.0
Reinvested earnings and undistributed branch profits -5 779.8 -8 886.6 -16 841.6 -17 447.4 48 955.5Credit - - - - Debit -5 779.8 -8 886.6 -16 841.6 -17 447.4 48 955.5
Income on debt (interest) -12 �02.7 -14 1�8.7 -19 7�9.7 -29 147.9 75 328.9Credit 1�.0 - - - 13.0Debit -12 �15.7 -14 1�8.7 -19 7�9.7 -29 147.9 75 341.9
Portfolio investment 4 058.4 5 224.2 6 694.7 6 057.9 22 035.2Credit 4 096.� 5 226.2 6 696.0 7 2�9.9 23 258.5Debit -�7.9 -2.0 -1.� -1 182.0 1 223.2
Income on equity (dividends) -�7.9 -2.0 -1.� -1 182.0 1 223.2Credit - - - - Debit -�7.9 -2.0 -1.� -1 182.0 1 223.2
Monetary authorities - - - - General government - - - - Banks - -0.9 - -1 162.7 1 163.6
Credit - - - - Debit - -0.9 - -1 162.7 1 163.6
Other sectors -�7.9 -1.1 -1.� -19.� 59.6Credit - - - - Debit -�7.9 -1.1 -1.� -19.� 59.6
Income on debt (interest) 4 096.� 5 226.2 6 696.0 7 2�9.9 23 258.5Credit 4 096.� 5 226.2 6 696.0 7 2�9.9 23 258.5Debit - - - -
Bonds and notes 4 096.� 5 226.2 6 696.0 7 2�9.9 23 258.5Credit 4 096.� 5 226.2 6 696.0 7 2�9.9 23 258.5Debit - - - -
Monetary authorities 4 021.� 4 975.7 6 558.6 7 08�.2 22 638.8Credit 4 021.� 4 975.7 6 558.6 7 08�.2 22 638.8Debit - - - -
General government - - - - Banks 75.0 250.5 1�7.4 156.7 619.7
Credit 75.0 250.5 1�7.4 156.7 619.7Debit - - - -
Other sectors - - - - Other investment -7 106.6 -1� 182.� -22 157.6 -22 061.2 64 507.6
Credit 11 149.2 12 865.8 14 466.9 14 250.5 52 732.4Debit -18 255.8 -26 048.1 -�6 624.4 -�6 �11.7 117 240.0
Monetary authorities 6 698.� 7 686.8 9 589.� 10 �50.1 34 324.5Credit 7 02�.8 8 010.1 9 9�0.4 10 692.4 35 656.7Debit -�25.5 -�2�.� -�41.1 -�42.4 1 332.2
General government -6 144.5 -6 249.0 -6 449.4 -6 291.0 25 133.9Credit 19.1 - - - 19.1Debit -6 16�.7 -6 249.0 -6 449.4 -6 291.0 25 153.0
Banks -5 878.8 -12 457.9 -20 �85.2 -21 112.7 59 834.5Credit 2 77�.2 2 555.7 � 274.9 2 552.0 11 155.8Debit -8 652.0 -15 01�.5 -2� 660.1 -2� 664.7 70 990.3
Other sectors -1 781.6 -2 162.� -4 912.2 -5 007.6 13 863.8Credit 1 ���.1 2 �00.0 1 261.6 1 006.0 5 900.7Debit -� 114.7 -4 462.� -6 17�.8 -6 01�.7 19 764.5
current transfers 133 328.5 149 334.3 170 471.3 236 117.3 689 251.4Credit 152 790.1 170 6�9.� 190 �01.5 255 55�.0 769 284.0Debit -19 461.6 -21 �05.0 -19 8�0.2 -19 4�5.8 80 032.5
General government 21 8�1.1 19 456.4 19 9�0.9 77 785.6 139 004.1Credit �7 20�.9 �8 411.7 �7 97�.5 9� 987.1 207 576.2
EF - Intergovernmental grants 14 �02.4 6 870.2 1� 187.5 78 541.2 112 901.4Other 22 901.5 �1 541.5 24 786.0 15 445.9 94 674.8
Debit -15 �72.8 -18 955.� -18 042.5 -16 201.5 68 572.1Other sectors 111 497.4 129 877.9 150 540.4 158 ��1.6 550 247.3
Credit 115 586.2 1�2 227.6 152 �28.1 161 565.9 561 707.8Debit -4 088.8 -2 �49.7 -1 787.7 -� 2�4.� 11 460.5
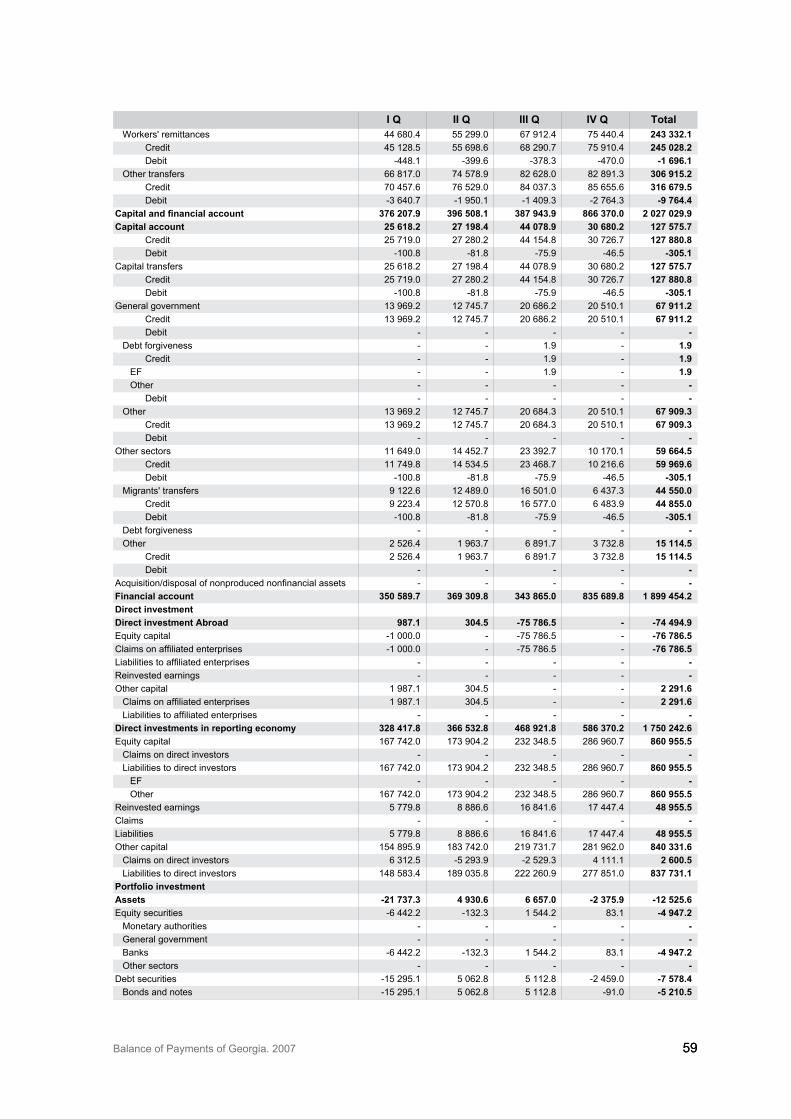
Balance of Payments of Georgia. 2007 5959
i Q ii Q iii Q iv Q totalWorkers' remittances 44 680.4 55 299.0 67 912.4 75 440.4 243 332.1
Credit 45 128.5 55 698.6 68 290.7 75 910.4 245 028.2Debit -448.1 -�99.6 -�78.� -470.0 1 696.1
Other transfers 66 817.0 74 578.9 82 628.0 82 891.� 306 915.2Credit 70 457.6 76 529.0 84 0�7.� 85 655.6 316 679.5Debit -� 640.7 -1 950.1 -1 409.� -2 764.� 9 764.4
Capital and financial account 376 207.9 396 508.1 387 943.9 866 370.0 2 027 029.9capital account 25 618.2 27 198.4 44 078.9 30 680.2 127 575.7
Credit 25 719.0 27 280.2 44 154.8 �0 726.7 127 880.8Debit -100.8 -81.8 -75.9 -46.5 305.1
Capital transfers 25 618.2 27 198.4 44 078.9 �0 680.2 127 575.7Credit 25 719.0 27 280.2 44 154.8 �0 726.7 127 880.8Debit -100.8 -81.8 -75.9 -46.5 305.1
General government 1� 969.2 12 745.7 20 686.2 20 510.1 67 911.2Credit 1� 969.2 12 745.7 20 686.2 20 510.1 67 911.2Debit - - - -
Debt forgiveness - - 1.9 - 1.9Credit - - 1.9 - 1.9
EF - - 1.9 - 1.9Other - - - -
Debit - - - - Other 1� 969.2 12 745.7 20 684.� 20 510.1 67 909.3
Credit 1� 969.2 12 745.7 20 684.� 20 510.1 67 909.3Debit - - - -
Other sectors 11 649.0 14 452.7 2� �92.7 10 170.1 59 664.5Credit 11 749.8 14 5�4.5 2� 468.7 10 216.6 59 969.6Debit -100.8 -81.8 -75.9 -46.5 305.1
Migrants' transfers 9 122.6 12 489.0 16 501.0 6 4�7.� 44 550.0Credit 9 22�.4 12 570.8 16 577.0 6 48�.9 44 855.0Debit -100.8 -81.8 -75.9 -46.5 305.1
Debt forgiveness - - - - Other 2 526.4 1 96�.7 6 891.7 � 7�2.8 15 114.5
Credit 2 526.4 1 96�.7 6 891.7 � 7�2.8 15 114.5Debit - - - -
Acquisition/disposal of nonproduced nonfinancial assets - - - - financial account 350 589.7 369 309.8 343 865.0 835 689.8 1 899 454.2direct investmentdirect investment abroad 987.1 304.5 75 786.5 74 494.9Equity capital -1 000.0 - -75 786.5 - 76 786.5Claims on affiliated enterprises -1 000.0 - -75 786.5 - 76 786.5Liabilities to affiliated enterprises - - - - Reinvested earnings - - - - Other capital 1 987.1 �04.5 - - 2 291.6
Claims on affiliated enterprises 1 987.1 �04.5 - - 2 291.6Liabilities to affiliated enterprises - - - -
direct investments in reporting economy 328 417.8 366 532.8 468 921.8 586 370.2 1 750 242.6Equity capital 167 742.0 17� 904.2 2�2 �48.5 286 960.7 860 955.5
Claims on direct investors - - - - Liabilities to direct investors 167 742.0 17� 904.2 2�2 �48.5 286 960.7 860 955.5
EF - - - - Other 167 742.0 17� 904.2 2�2 �48.5 286 960.7 860 955.5
Reinvested earnings 5 779.8 8 886.6 16 841.6 17 447.4 48 955.5Claims - - - - Liabilities 5 779.8 8 886.6 16 841.6 17 447.4 48 955.5Other capital 154 895.9 18� 742.0 219 7�1.7 281 962.0 840 331.6
Claims on direct investors 6 �12.5 -5 29�.9 -2 529.� 4 111.1 2 600.5Liabilities to direct investors 148 58�.4 189 0�5.8 222 260.9 277 851.0 837 731.1
portfolio investmentassets 21 737.3 4 930.6 6 657.0 2 375.9 12 525.6Equity securities -6 442.2 -1�2.� 1 544.2 8�.1 4 947.2
Monetary authorities - - - - General government - - - - Banks -6 442.2 -1�2.� 1 544.2 8�.1 4 947.2Other sectors - - - -
Debt securities -15 295.1 5 062.8 5 112.8 -2 459.0 7 578.4Bonds and notes -15 295.1 5 062.8 5 112.8 -91.0 5 210.5
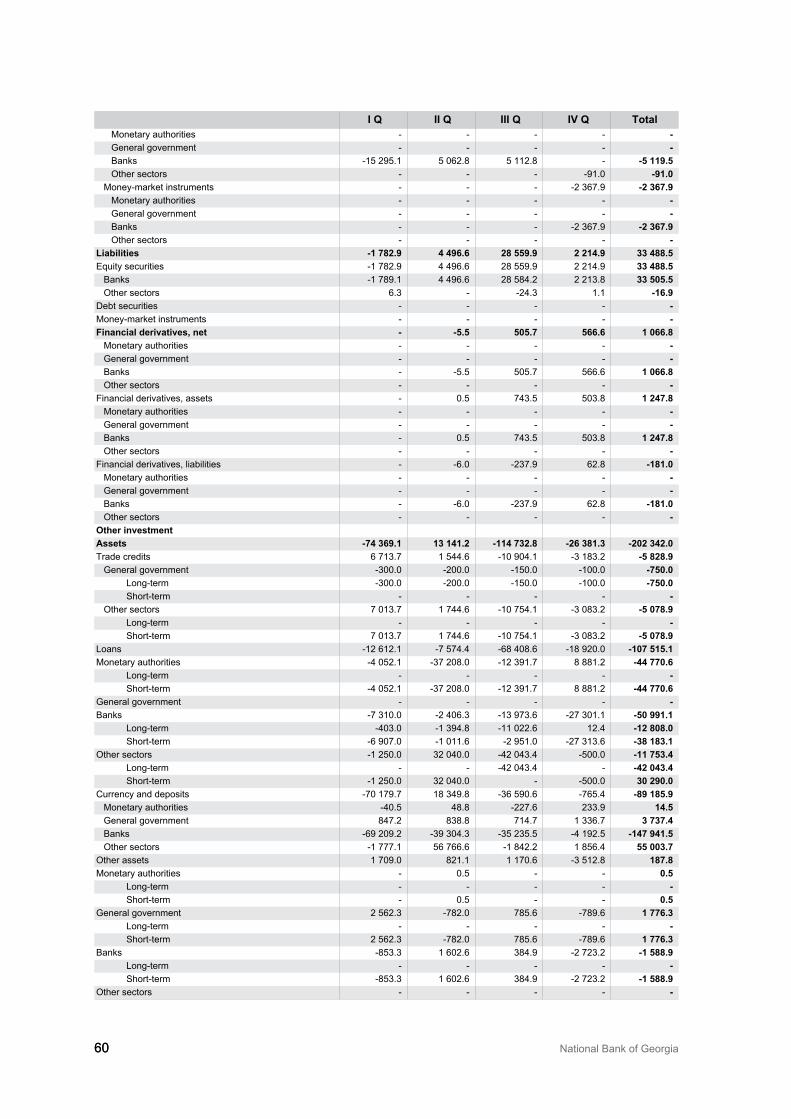
60 National Bank of Georgia60
i Q ii Q iii Q iv Q totalMonetary authorities - - - - General government - - - - Banks -15 295.1 5 062.8 5 112.8 - 5 119.5Other sectors - - - -91.0 91.0
Money-market instruments - - - -2 �67.9 2 367.9Monetary authorities - - - - General government - - - - Banks - - - -2 �67.9 2 367.9Other sectors - - - -
liabilities 1 782.9 4 496.6 28 559.9 2 214.9 33 488.5Equity securities -1 782.9 4 496.6 28 559.9 2 214.9 33 488.5
Banks -1 789.1 4 496.6 28 584.2 2 21�.8 33 505.5Other sectors 6.� - -24.� 1.1 16.9
Debt securities - - - - Money-market instruments - - - - financial derivatives, net 5.5 505.7 566.6 1 066.8
Monetary authorities - - - - General government - - - - Banks - -5.5 505.7 566.6 1 066.8Other sectors - - - -
Financial derivatives, assets - 0.5 74�.5 50�.8 1 247.8Monetary authorities - - - - General government - - - - Banks - 0.5 74�.5 50�.8 1 247.8Other sectors - - - -
Financial derivatives, liabilities - -6.0 -2�7.9 62.8 181.0Monetary authorities - - - - General government - - - - Banks - -6.0 -2�7.9 62.8 181.0Other sectors - - - -
other investmentassets 74 369.1 13 141.2 114 732.8 26 381.3 202 342.0Trade credits 6 71�.7 1 544.6 -10 904.1 -� 18�.2 5 828.9
General government -�00.0 -200.0 -150.0 -100.0 750.0Long-term -�00.0 -200.0 -150.0 -100.0 750.0Short-term - - - -
Other sectors 7 01�.7 1 744.6 -10 754.1 -� 08�.2 5 078.9Long-term - - - - Short-term 7 01�.7 1 744.6 -10 754.1 -� 08�.2 5 078.9
Loans -12 612.1 -7 574.4 -68 408.6 -18 920.0 107 515.1Monetary authorities -4 052.1 -�7 208.0 -12 �91.7 8 881.2 44 770.6
Long-term - - - - Short-term -4 052.1 -�7 208.0 -12 �91.7 8 881.2 44 770.6
General government - - - - Banks -7 �10.0 -2 406.� -1� 97�.6 -27 �01.1 50 991.1
Long-term -40�.0 -1 �94.8 -11 022.6 12.4 12 808.0Short-term -6 907.0 -1 011.6 -2 951.0 -27 �1�.6 38 183.1
Other sectors -1 250.0 �2 040.0 -42 04�.4 -500.0 11 753.4Long-term - - -42 04�.4 - 42 043.4Short-term -1 250.0 �2 040.0 - -500.0 30 290.0
Currency and deposits -70 179.7 18 �49.8 -�6 590.6 -765.4 89 185.9Monetary authorities -40.5 48.8 -227.6 2��.9 14.5General government 847.2 8�8.8 714.7 1 ��6.7 3 737.4Banks -69 209.2 -�9 �04.� -�5 2�5.5 -4 192.5 147 941.5Other sectors -1 777.1 56 766.6 -1 842.2 1 856.4 55 003.7
Other assets 1 709.0 821.1 1 170.6 -� 512.8 187.8Monetary authorities - 0.5 - - 0.5
Long-term - - - - Short-term - 0.5 - - 0.5
General government 2 562.� -782.0 785.6 -789.6 1 776.3Long-term - - - - Short-term 2 562.� -782.0 785.6 -789.6 1 776.3
Banks -85�.� 1 602.6 �84.9 -2 72�.2 1 588.9Long-term - - - - Short-term -85�.� 1 602.6 �84.9 -2 72�.2 1 588.9
Other sectors - - - -
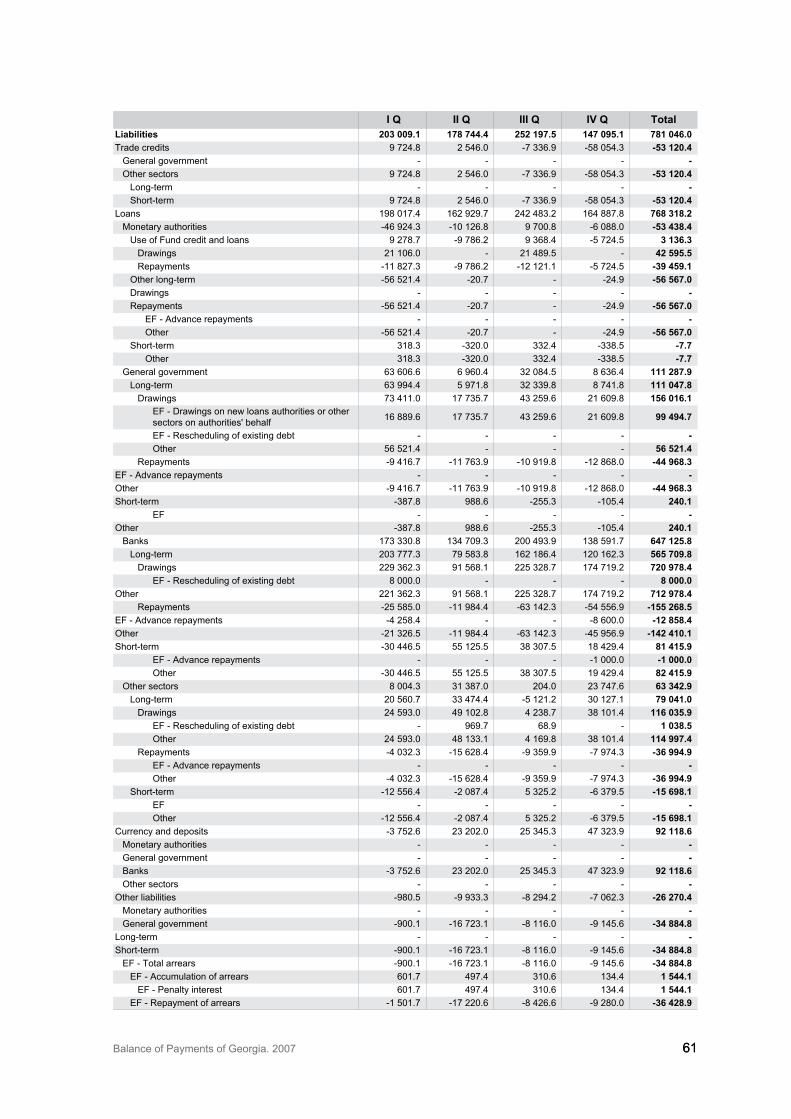
Balance of Payments of Georgia. 2007 6161
i Q ii Q iii Q iv Q totalliabilities 203 009.1 178 744.4 252 197.5 147 095.1 781 046.0Trade credits 9 724.8 2 546.0 -7 ��6.9 -58 054.� 53 120.4
General government - - - - Other sectors 9 724.8 2 546.0 -7 ��6.9 -58 054.� 53 120.4
Long-term - - - - Short-term 9 724.8 2 546.0 -7 ��6.9 -58 054.� 53 120.4
Loans 198 017.4 162 929.7 242 48�.2 164 887.8 768 318.2Monetary authorities -46 924.� -10 126.8 9 700.8 -6 088.0 53 438.4
Use of Fund credit and loans 9 278.7 -9 786.2 9 �68.4 -5 724.5 3 136.3Drawings 21 106.0 - 21 489.5 - 42 595.5Repayments -11 827.� -9 786.2 -12 121.1 -5 724.5 39 459.1
Other long-term -56 521.4 -20.7 - -24.9 56 567.0Drawings - - - - Repayments -56 521.4 -20.7 - -24.9 56 567.0
EF - Advance repayments - - - - Other -56 521.4 -20.7 - -24.9 56 567.0
Short-term �18.� -�20.0 ��2.4 -��8.5 7.7Other �18.� -�20.0 ��2.4 -��8.5 7.7
General government 6� 606.6 6 960.4 �2 084.5 8 6�6.4 111 287.9Long-term 6� 994.4 5 971.8 �2 ��9.8 8 741.8 111 047.8
Drawings 7� 411.0 17 7�5.7 4� 259.6 21 609.8 156 016.1EF - Drawings on new loans authorities or other sectors on authorities' behalf 16 889.6 17 7�5.7 4� 259.6 21 609.8 99 494.7
EF - Rescheduling of existing debt - - - - Other 56 521.4 - - - 56 521.4
Repayments -9 416.7 -11 76�.9 -10 919.8 -12 868.0 44 968.3EF - Advance repayments - - - - Other -9 416.7 -11 76�.9 -10 919.8 -12 868.0 44 968.3Short-term -�87.8 988.6 -255.� -105.4 240.1
EF - - - - Other -�87.8 988.6 -255.� -105.4 240.1
Banks 17� ��0.8 1�4 709.� 200 49�.9 1�8 591.7 647 125.8Long-term 20� 777.� 79 58�.8 162 186.4 120 162.� 565 709.8
Drawings 229 �62.� 91 568.1 225 �28.7 174 719.2 720 978.4EF - Rescheduling of existing debt 8 000.0 - - - 8 000.0
Other 221 �62.� 91 568.1 225 �28.7 174 719.2 712 978.4Repayments -25 585.0 -11 984.4 -6� 142.� -54 556.9 155 268.5
EF - Advance repayments -4 258.4 - - -8 600.0 12 858.4Other -21 �26.5 -11 984.4 -6� 142.� -45 956.9 142 410.1Short-term -�0 446.5 55 125.5 �8 �07.5 18 429.4 81 415.9
EF - Advance repayments - - - -1 000.0 1 000.0Other -�0 446.5 55 125.5 �8 �07.5 19 429.4 82 415.9
Other sectors 8 004.� �1 �87.0 204.0 2� 747.6 63 342.9Long-term 20 560.7 �� 474.4 -5 121.2 �0 127.1 79 041.0
Drawings 24 59�.0 49 102.8 4 2�8.7 �8 101.4 116 035.9EF - Rescheduling of existing debt - 969.7 68.9 - 1 038.5Other 24 59�.0 48 1��.1 4 169.8 �8 101.4 114 997.4
Repayments -4 0�2.� -15 628.4 -9 �59.9 -7 974.� 36 994.9EF - Advance repayments - - - - Other -4 0�2.� -15 628.4 -9 �59.9 -7 974.� 36 994.9
Short-term -12 556.4 -2 087.4 5 �25.2 -6 �79.5 15 698.1EF - - - - Other -12 556.4 -2 087.4 5 �25.2 -6 �79.5 15 698.1
Currency and deposits -� 752.6 2� 202.0 25 �45.� 47 �2�.9 92 118.6Monetary authorities - - - - General government - - - - Banks -� 752.6 2� 202.0 25 �45.� 47 �2�.9 92 118.6Other sectors - - - -
Other liabilities -980.5 -9 9��.� -8 294.2 -7 062.� 26 270.4Monetary authorities - - - - General government -900.1 -16 72�.1 -8 116.0 -9 145.6 34 884.8
Long-term - - - - Short-term -900.1 -16 72�.1 -8 116.0 -9 145.6 34 884.8
EF - Total arrears -900.1 -16 72�.1 -8 116.0 -9 145.6 34 884.8EF - Accumulation of arrears 601.7 497.4 �10.6 1�4.4 1 544.1
EF - Penalty interest 601.7 497.4 �10.6 1�4.4 1 544.1EF - Repayment of arrears -1 501.7 -17 220.6 -8 426.6 -9 280.0 36 428.9
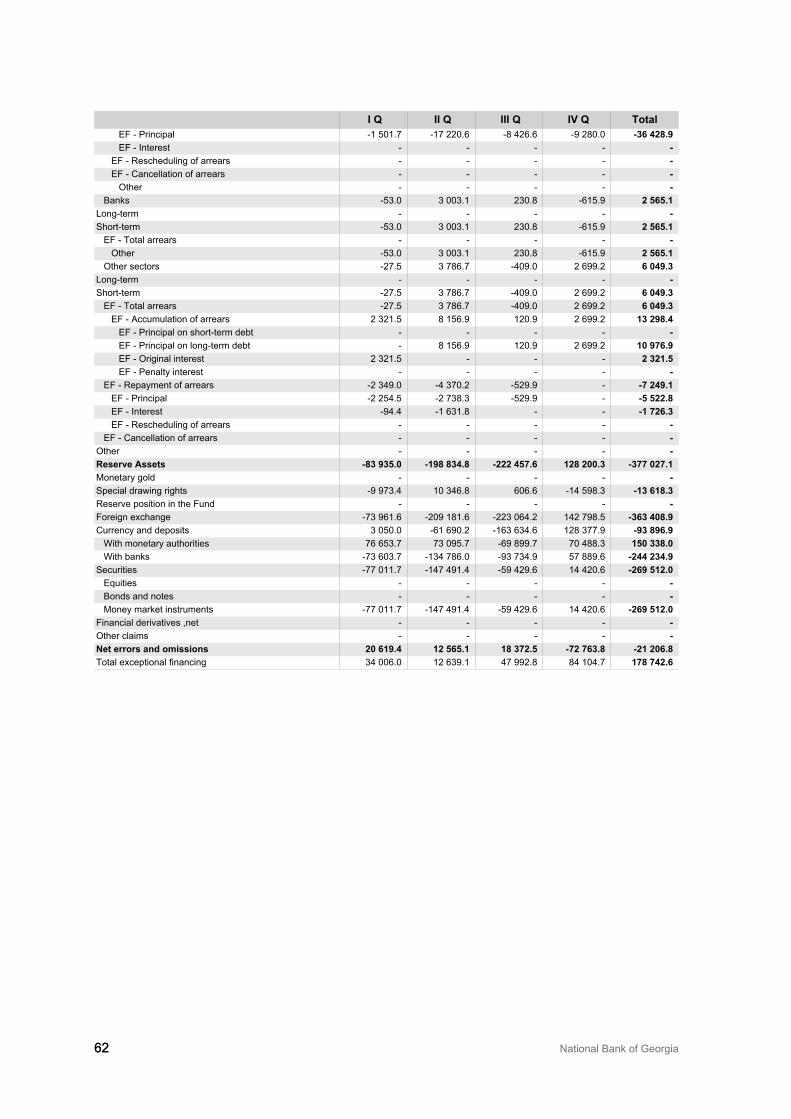
62 National Bank of Georgia62
i Q ii Q iii Q iv Q totalEF - Principal -1 501.7 -17 220.6 -8 426.6 -9 280.0 36 428.9EF - Interest - - - -
EF - Rescheduling of arrears - - - - EF - Cancellation of arrears - - - -
Other - - - - Banks -5�.0 � 00�.1 2�0.8 -615.9 2 565.1
Long-term - - - - Short-term -5�.0 � 00�.1 2�0.8 -615.9 2 565.1
EF - Total arrears - - - - Other -5�.0 � 00�.1 2�0.8 -615.9 2 565.1
Other sectors -27.5 � 786.7 -409.0 2 699.2 6 049.3Long-term - - - - Short-term -27.5 � 786.7 -409.0 2 699.2 6 049.3
EF - Total arrears -27.5 � 786.7 -409.0 2 699.2 6 049.3EF - Accumulation of arrears 2 �21.5 8 156.9 120.9 2 699.2 13 298.4
EF - Principal on short-term debt - - - - EF - Principal on long-term debt - 8 156.9 120.9 2 699.2 10 976.9EF - Original interest 2 �21.5 - - - 2 321.5EF - Penalty interest - - - -
EF - Repayment of arrears -2 �49.0 -4 �70.2 -529.9 - 7 249.1EF - Principal -2 254.5 -2 7�8.� -529.9 - 5 522.8EF - Interest -94.4 -1 6�1.8 - - 1 726.3EF - Rescheduling of arrears - - - -
EF - Cancellation of arrears - - - - Other - - - - reserve assets 83 935.0 198 834.8 222 457.6 128 200.3 377 027.1Monetary gold - - - - Special drawing rights -9 97�.4 10 �46.8 606.6 -14 598.� 13 618.3Reserve position in the Fund - - - - Foreign exchange -7� 961.6 -209 181.6 -22� 064.2 142 798.5 363 408.9Currency and deposits � 050.0 -61 690.2 -16� 6�4.6 128 �77.9 93 896.9
With monetary authorities 76 65�.7 7� 095.7 -69 899.7 70 488.� 150 338.0With banks -7� 60�.7 -1�4 786.0 -9� 7�4.9 57 889.6 244 234.9
Securities -77 011.7 -147 491.4 -59 429.6 14 420.6 269 512.0Equities - - - - Bonds and notes - - - - Money market instruments -77 011.7 -147 491.4 -59 429.6 14 420.6 269 512.0
Financial derivatives ,net - - - - Other claims - - - - Net errors and omissions 20 619.4 12 565.1 18 372.5 72 763.8 21 206.8Total exceptional financing �4 006.0 12 6�9.1 47 992.8 84 104.7 178 742.6
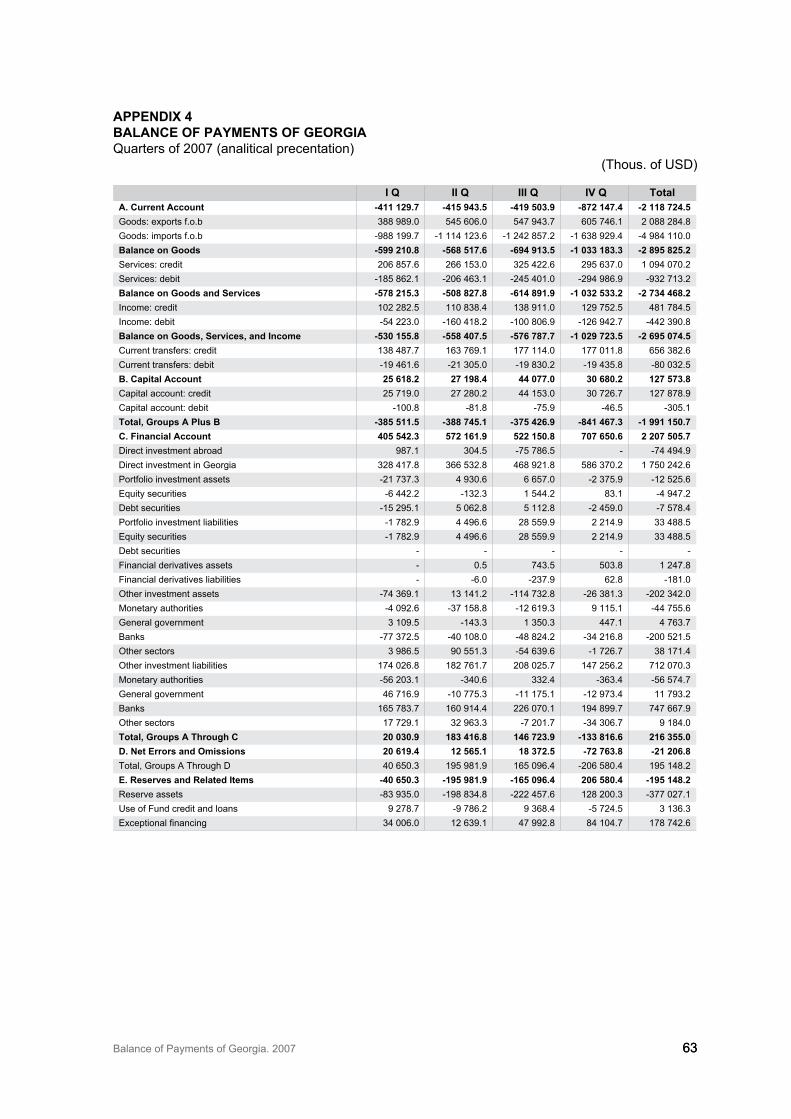
Balance of Payments of Georgia. 2007 6�6�
i Q ii Q iii Q iv Q totala. current account 411 129.7 415 943.5 419 503.9 872 147.4 2 118 724.5Goods: exports f.o.b �88 989.0 545 606.0 547 94�.7 605 746.1 2 088 284.8Goods: imports f.o.b -988 199.7 -1 114 12�.6 -1 242 857.2 -1 6�8 929.4 -4 984 110.0Balance on Goods 599 210.8 568 517.6 694 913.5 1 033 183.3 2 895 825.2Services: credit 206 857.6 266 15�.0 �25 422.6 295 6�7.0 1 094 070.2Services: debit -185 862.1 -206 46�.1 -245 401.0 -294 986.9 -9�2 71�.2Balance on Goods and services 578 215.3 508 827.8 614 891.9 1 032 533.2 2 734 468.2Income: credit 102 282.5 110 8�8.4 1�8 911.0 129 752.5 481 784.5Income: debit -54 22�.0 -160 418.2 -100 806.9 -126 942.7 -442 �90.8Balance on Goods, services, and income 530 155.8 558 407.5 576 787.7 1 029 723.5 2 695 074.5Current transfers: credit 1�8 487.7 16� 769.1 177 114.0 177 011.8 656 �82.6Current transfers: debit -19 461.6 -21 �05.0 -19 8�0.2 -19 4�5.8 -80 0�2.5B. capital account 25 618.2 27 198.4 44 077.0 30 680.2 127 573.8Capital account: credit 25 719.0 27 280.2 44 15�.0 �0 726.7 127 878.9Capital account: debit -100.8 -81.8 -75.9 -46.5 -�05.1total, Groups a plus B 385 511.5 388 745.1 375 426.9 841 467.3 1 991 150.7c. financial account 405 542.3 572 161.9 522 150.8 707 650.6 2 207 505.7Direct investment abroad 987.1 �04.5 -75 786.5 - -74 494.9Direct investment in Georgia �28 417.8 �66 5�2.8 468 921.8 586 �70.2 1 750 242.6Portfolio investment assets -21 7�7.� 4 9�0.6 6 657.0 -2 �75.9 -12 525.6Equity securities -6 442.2 -1�2.� 1 544.2 8�.1 -4 947.2Debt securities -15 295.1 5 062.8 5 112.8 -2 459.0 -7 578.4Portfolio investment liabilities -1 782.9 4 496.6 28 559.9 2 214.9 �� 488.5Equity securities -1 782.9 4 496.6 28 559.9 2 214.9 �� 488.5Debt securities - - - - -Financial derivatives assets - 0.5 74�.5 50�.8 1 247.8Financial derivatives liabilities - -6.0 -2�7.9 62.8 -181.0Other investment assets -74 �69.1 1� 141.2 -114 7�2.8 -26 �81.� -202 �42.0Monetary authorities -4 092.6 -�7 158.8 -12 619.� 9 115.1 -44 755.6General government � 109.5 -14�.� 1 �50.� 447.1 4 76�.7Banks -77 �72.5 -40 108.0 -48 824.2 -�4 216.8 -200 521.5Other sectors � 986.5 90 551.� -54 6�9.6 -1 726.7 �8 171.4Other investment liabilities 174 026.8 182 761.7 208 025.7 147 256.2 712 070.�Monetary authorities -56 20�.1 -�40.6 ��2.4 -�6�.4 -56 574.7General government 46 716.9 -10 775.� -11 175.1 -12 97�.4 11 79�.2Banks 165 78�.7 160 914.4 226 070.1 194 899.7 747 667.9Other sectors 17 729.1 �2 96�.� -7 201.7 -�4 �06.7 9 184.0total, Groups a through c 20 030.9 183 416.8 146 723.9 133 816.6 216 355.0d. Net errors and omissions 20 619.4 12 565.1 18 372.5 72 763.8 21 206.8Total, Groups A Through D 40 650.� 195 981.9 165 096.4 -206 580.4 195 148.2e. reserves and related items 40 650.3 195 981.9 165 096.4 206 580.4 195 148.2Reserve assets -8� 9�5.0 -198 8�4.8 -222 457.6 128 200.� -�77 027.1Use of Fund credit and loans 9 278.7 -9 786.2 9 �68.4 -5 724.5 � 1�6.�Exceptional financing �4 006.0 12 6�9.1 47 992.8 84 104.7 178 742.6
appeNdix 4BalaNce of paymeNts of GeorGiaQuarters of 2007 (analitical precentation)
(Thous. of USD)
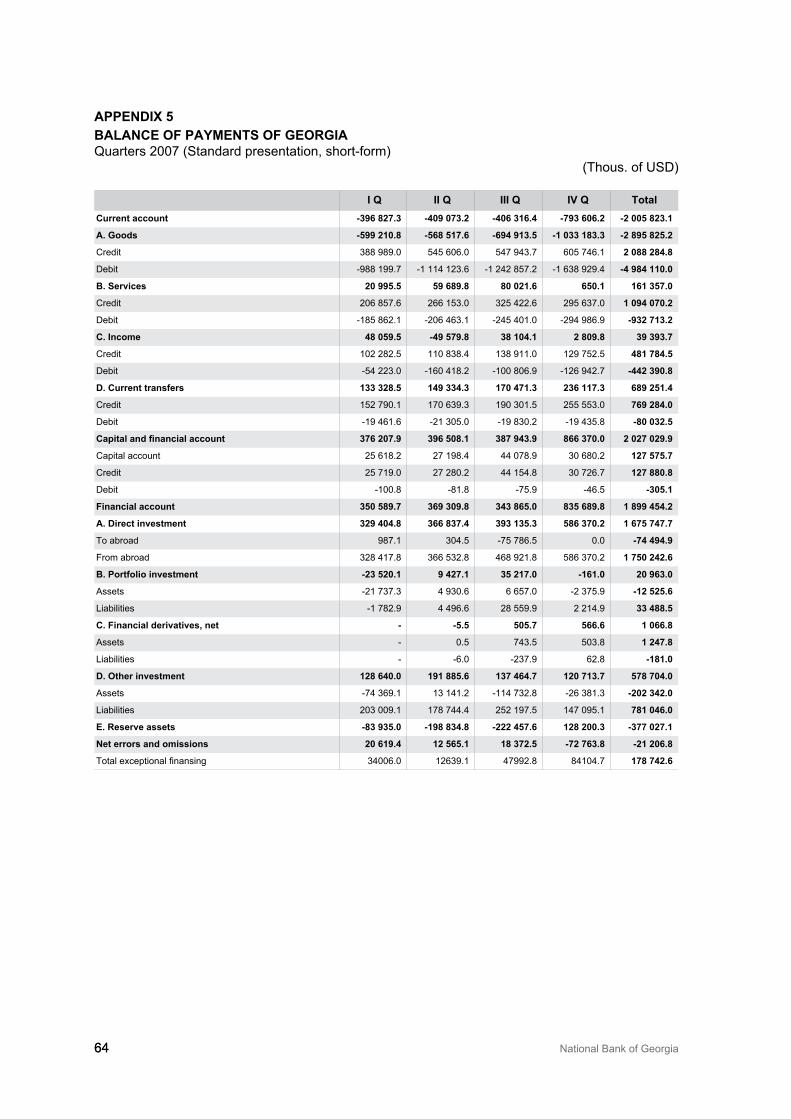
64 National Bank of Georgia64
i Q ii Q iii Q iv Q totalcurrent account 396 827.3 409 073.2 406 316.4 793 606.2 2 005 823.1
a. Goods 599 210.8 568 517.6 694 913.5 1 033 183.3 2 895 825.2
Credit �88 989.0 545 606.0 547 94�.7 605 746.1 2 088 284.8
Debit -988 199.7 -1 114 12�.6 -1 242 857.2 -1 6�8 929.4 4 984 110.0
B. services 20 995.5 59 689.8 80 021.6 650.1 161 357.0
Credit 206 857.6 266 15�.0 �25 422.6 295 6�7.0 1 094 070.2
Debit -185 862.1 -206 46�.1 -245 401.0 -294 986.9 932 713.2
c. income 48 059.5 49 579.8 38 104.1 2 809.8 39 393.7
Credit 102 282.5 110 8�8.4 1�8 911.0 129 752.5 481 784.5
Debit -54 22�.0 -160 418.2 -100 806.9 -126 942.7 442 390.8
d. current transfers 133 328.5 149 334.3 170 471.3 236 117.3 689 251.4
Credit 152 790.1 170 6�9.� 190 �01.5 255 55�.0 769 284.0
Debit -19 461.6 -21 �05.0 -19 8�0.2 -19 4�5.8 80 032.5
Capital and financial account 376 207.9 396 508.1 387 943.9 866 370.0 2 027 029.9
Capital account 25 618.2 27 198.4 44 078.9 �0 680.2 127 575.7
Credit 25 719.0 27 280.2 44 154.8 �0 726.7 127 880.8
Debit -100.8 -81.8 -75.9 -46.5 305.1
financial account 350 589.7 369 309.8 343 865.0 835 689.8 1 899 454.2
a. direct investment 329 404.8 366 837.4 393 135.3 586 370.2 1 675 747.7
To abroad 987.1 �04.5 -75 786.5 0.0 74 494.9
From abroad �28 417.8 �66 5�2.8 468 921.8 586 �70.2 1 750 242.6
B. portfolio investment 23 520.1 9 427.1 35 217.0 161.0 20 963.0
Assets -21 7�7.� 4 9�0.6 6 657.0 -2 �75.9 12 525.6
Liabilities -1 782.9 4 496.6 28 559.9 2 214.9 33 488.5
c. financial derivatives, net 5.5 505.7 566.6 1 066.8
Assets - 0.5 74�.5 50�.8 1 247.8
Liabilities - -6.0 -2�7.9 62.8 181.0
d. other investment 128 640.0 191 885.6 137 464.7 120 713.7 578 704.0
Assets -74 �69.1 1� 141.2 -114 7�2.8 -26 �81.� 202 342.0
Liabilities 20� 009.1 178 744.4 252 197.5 147 095.1 781 046.0
e. reserve assets 83 935.0 198 834.8 222 457.6 128 200.3 377 027.1
Net errors and omissions 20 619.4 12 565.1 18 372.5 72 763.8 21 206.8
Total exceptional finansing �4006.0 126�9.1 47992.8 84104.7 178 742.6
appeNdix 5BalaNce of paymeNts of GeorGiaQuarters 2007 (Standard presentation, short-form)
(Thous. of USD)
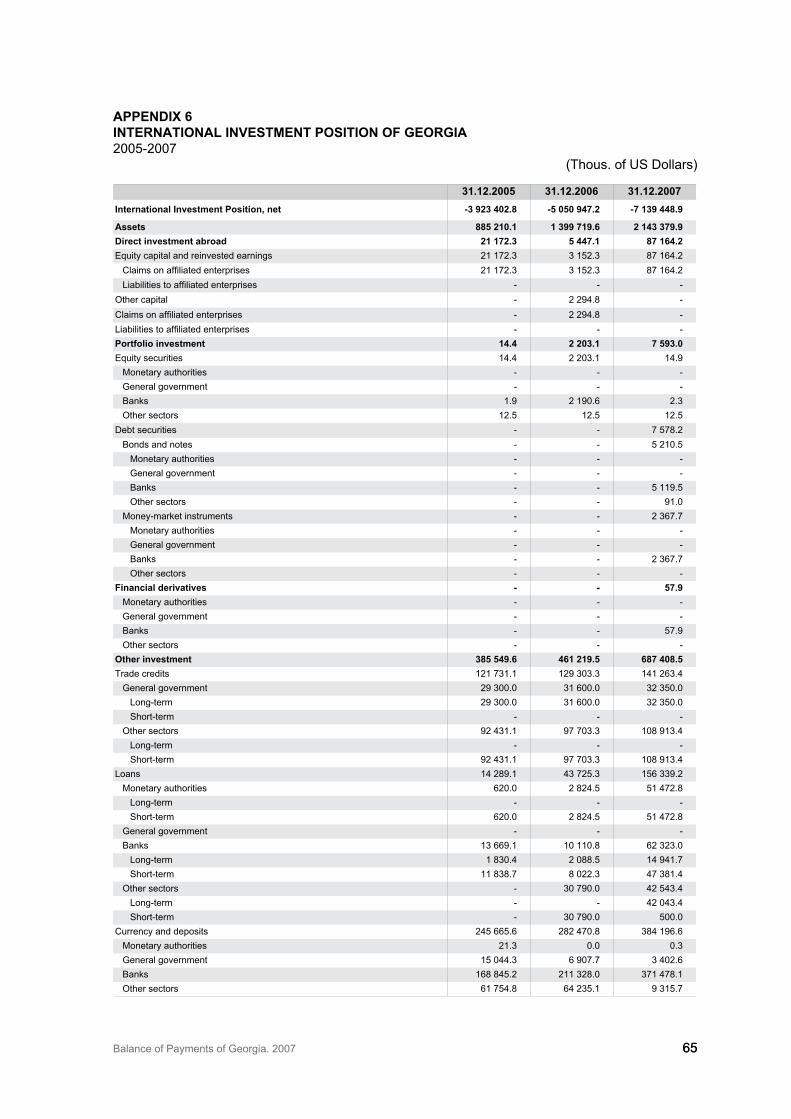
Balance of Payments of Georgia. 2007 6565
appeNdix 6iNterNatioNal iNvestmeNt positioN of GeorGia2005-2007
(Thous. of US Dollars)
31.12.2005 31.12.2006 31.12.2007international investment position, net 3 923 402.8 5 050 947.2 7 139 448.9
assets 885 210.1 1 399 719.6 2 143 379.9direct investment abroad 21 172.3 5 447.1 87 164.2Equity capital and reinvested earnings 21 172.� � 152.� 87 164.2
Claims on affiliated enterprises 21 172.� � 152.� 87 164.2Liabilities to affiliated enterprises - - -
Other capital - 2 294.8 -Claims on affiliated enterprises - 2 294.8 -Liabilities to affiliated enterprises - - -portfolio investment 14.4 2 203.1 7 593.0Equity securities 14.4 2 20�.1 14.9
Monetary authorities - - -General government - - -Banks 1.9 2 190.6 2.�Other sectors 12.5 12.5 12.5
Debt securities - - 7 578.2Bonds and notes - - 5 210.5
Monetary authorities - - -General government - - -Banks - - 5 119.5Other sectors - - 91.0
Money-market instruments - - 2 �67.7Monetary authorities - - -General government - - -Banks - - 2 �67.7Other sectors - - -
financial derivatives 57.9Monetary authorities - - -General government - - -Banks - - 57.9Other sectors - - -
other investment 385 549.6 461 219.5 687 408.5Trade credits 121 7�1.1 129 �0�.� 141 26�.4
General government 29 �00.0 �1 600.0 �2 �50.0Long-term 29 �00.0 �1 600.0 �2 �50.0Short-term - - -
Other sectors 92 4�1.1 97 70�.� 108 91�.4Long-term - - -Short-term 92 4�1.1 97 70�.� 108 91�.4
Loans 14 289.1 4� 725.� 156 ��9.2Monetary authorities 620.0 2 824.5 51 472.8
Long-term - - -Short-term 620.0 2 824.5 51 472.8
General government - - -Banks 1� 669.1 10 110.8 62 �2�.0
Long-term 1 8�0.4 2 088.5 14 941.7Short-term 11 8�8.7 8 022.� 47 �81.4
Other sectors - �0 790.0 42 54�.4Long-term - - 42 04�.4Short-term - �0 790.0 500.0
Currency and deposits 245 665.6 282 470.8 �84 196.6Monetary authorities 21.� 0.0 0.�General government 15 044.� 6 907.7 � 402.6Banks 168 845.2 211 �28.0 �71 478.1Other sectors 61 754.8 64 2�5.1 9 �15.7
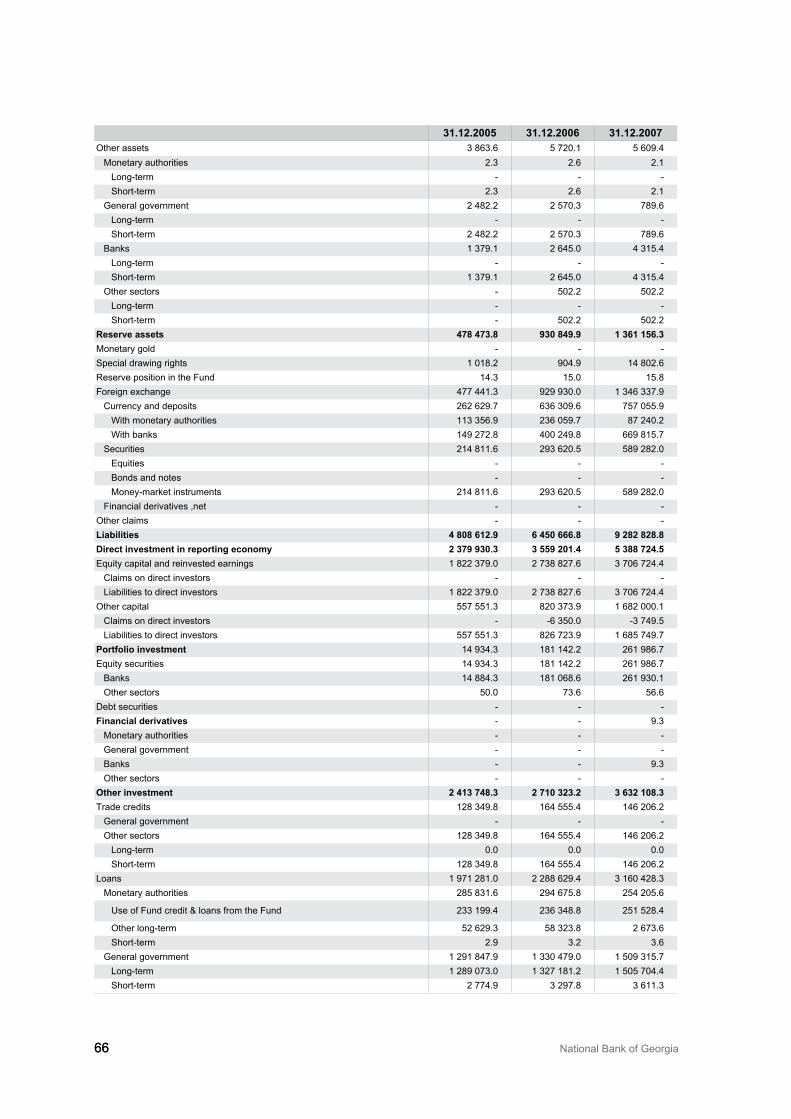
66 National Bank of Georgia66
31.12.2005 31.12.2006 31.12.2007Other assets � 86�.6 5 720.1 5 609.4
Monetary authorities 2.� 2.6 2.1Long-term - - -Short-term 2.� 2.6 2.1
General government 2 482.2 2 570.� 789.6Long-term - - -Short-term 2 482.2 2 570.� 789.6
Banks 1 �79.1 2 645.0 4 �15.4Long-term - - -Short-term 1 �79.1 2 645.0 4 �15.4
Other sectors - 502.2 502.2Long-term - - -Short-term - 502.2 502.2
reserve assets 478 473.8 930 849.9 1 361 156.3Monetary gold - - -Special drawing rights 1 018.2 904.9 14 802.6Reserve position in the Fund 14.� 15.0 15.8Foreign exchange 477 441.� 929 9�0.0 1 �46 ��7.9
Currency and deposits 262 629.7 6�6 �09.6 757 055.9With monetary authorities 11� �56.9 2�6 059.7 87 240.2With banks 149 272.8 400 249.8 669 815.7
Securities 214 811.6 29� 620.5 589 282.0Equities - - -Bonds and notes - - -Money-market instruments 214 811.6 29� 620.5 589 282.0
Financial derivatives ,net - - -Other claims - - -liabilities 4 808 612.9 6 450 666.8 9 282 828.8direct investment in reporting economy 2 379 930.3 3 559 201.4 5 388 724.5Equity capital and reinvested earnings 1 822 �79.0 2 7�8 827.6 � 706 724.4
Claims on direct investors - - -Liabilities to direct investors 1 822 �79.0 2 7�8 827.6 � 706 724.4
Other capital 557 551.� 820 �7�.9 1 682 000.1Claims on direct investors - -6 �50.0 -� 749.5Liabilities to direct investors 557 551.� 826 72�.9 1 685 749.7
portfolio investment 14 9�4.� 181 142.2 261 986.7Equity securities 14 9�4.� 181 142.2 261 986.7
Banks 14 884.� 181 068.6 261 9�0.1Other sectors 50.0 7�.6 56.6
Debt securities - - -financial derivatives - - 9.�
Monetary authorities - - -General government - - -Banks - - 9.�Other sectors - - -
other investment 2 413 748.3 2 710 323.2 3 632 108.3Trade credits 128 �49.8 164 555.4 146 206.2
General government - - -Other sectors 128 �49.8 164 555.4 146 206.2
Long-term 0.0 0.0 0.0Short-term 128 �49.8 164 555.4 146 206.2
Loans 1 971 281.0 2 288 629.4 � 160 428.�Monetary authorities 285 8�1.6 294 675.8 254 205.6
Use of Fund credit & loans from the Fund 2�� 199.4 2�6 �48.8 251 528.4
Other long-term 52 629.� 58 �2�.8 2 67�.6Short-term 2.9 �.2 �.6
General government 1 291 847.9 1 ��0 479.0 1 509 �15.7Long-term 1 289 07�.0 1 �27 181.2 1 505 704.4Short-term 2 774.9 � 297.8 � 611.�
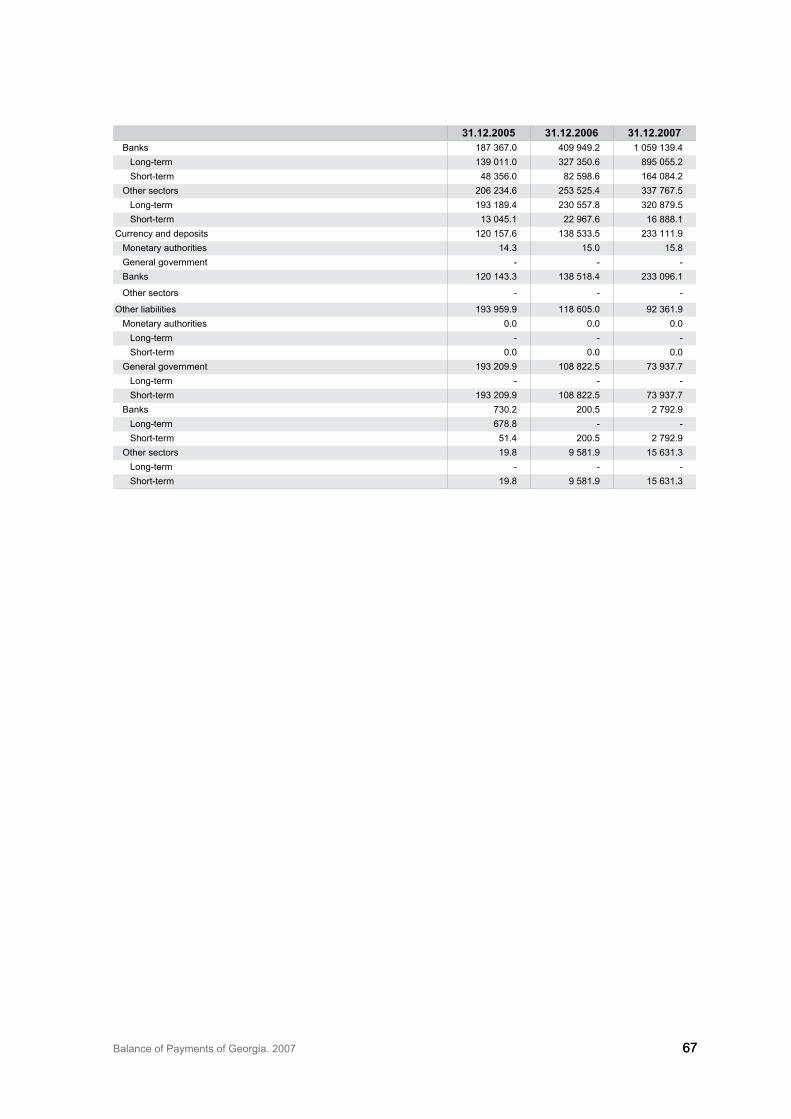
Balance of Payments of Georgia. 2007 6767
31.12.2005 31.12.2006 31.12.2007Banks 187 �67.0 409 949.2 1 059 1�9.4
Long-term 1�9 011.0 �27 �50.6 895 055.2Short-term 48 �56.0 82 598.6 164 084.2
Other sectors 206 2�4.6 25� 525.4 ��7 767.5Long-term 19� 189.4 2�0 557.8 �20 879.5Short-term 1� 045.1 22 967.6 16 888.1
Currency and deposits 120 157.6 1�8 5��.5 2�� 111.9Monetary authorities 14.� 15.0 15.8General government - - -Banks 120 14�.� 1�8 518.4 2�� 096.1
Other sectors - - -
Other liabilities 19� 959.9 118 605.0 92 �61.9Monetary authorities 0.0 0.0 0.0
Long-term - - -Short-term 0.0 0.0 0.0
General government 19� 209.9 108 822.5 7� 9�7.7Long-term - - -Short-term 19� 209.9 108 822.5 7� 9�7.7
Banks 7�0.2 200.5 2 792.9Long-term 678.8 - -Short-term 51.4 200.5 2 792.9
Other sectors 19.8 9 581.9 15 6�1.�Long-term - - -Short-term 19.8 9 581.9 15 6�1.�
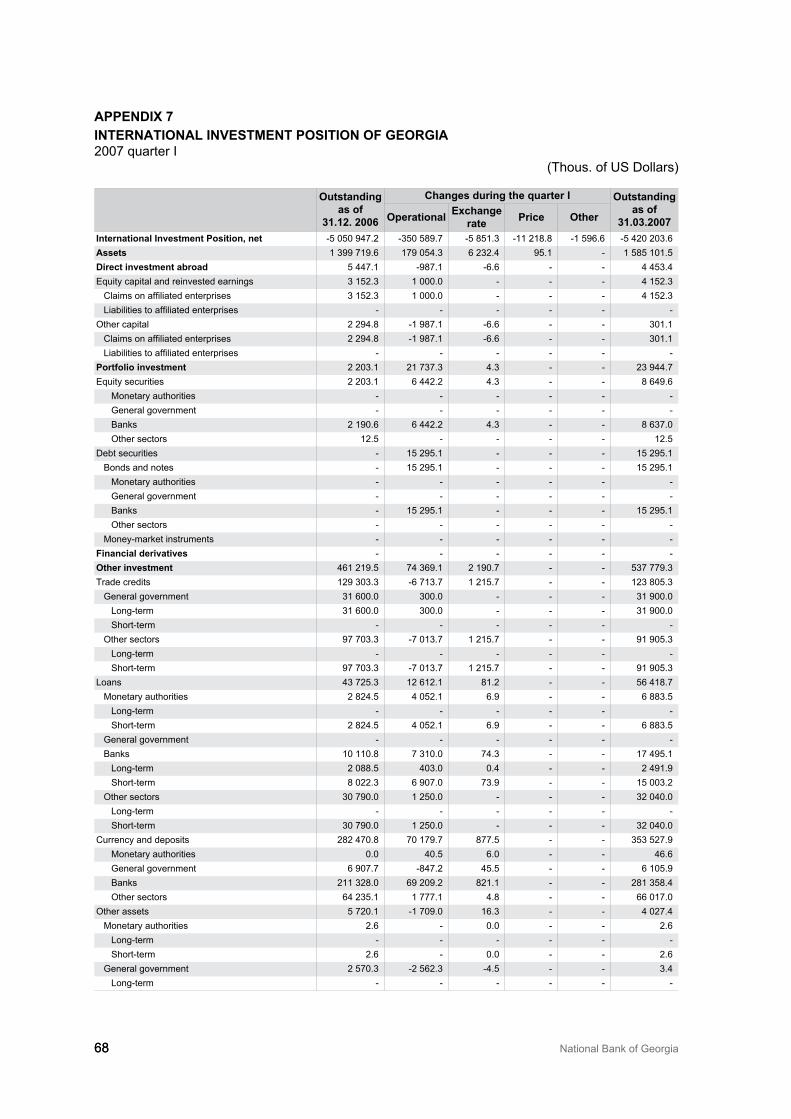
68 National Bank of Georgia68
appeNdix 7iNterNatioNal iNvestmeNt positioN of GeorGia2007 quarter I
(Thous. of US Dollars)
outstanding as of
31.12. 2006
changes during the quarter i outstanding as of
31.03.2007operational exchange rate price other
international investment position, net -5 050 947.2 -�50 589.7 -5 851.� -11 218.8 -1 596.6 -5 420 20�.6assets 1 �99 719.6 179 054.� 6 2�2.4 95.1 - 1 585 101.5direct investment abroad 5 447.1 -987.1 -6.6 - - 4 45�.4Equity capital and reinvested earnings � 152.� 1 000.0 - - - 4 152.�
Claims on affiliated enterprises � 152.� 1 000.0 - - - 4 152.�Liabilities to affiliated enterprises - - - - - -
Other capital 2 294.8 -1 987.1 -6.6 - - �01.1Claims on affiliated enterprises 2 294.8 -1 987.1 -6.6 - - �01.1Liabilities to affiliated enterprises - - - - - -
portfolio investment 2 20�.1 21 7�7.� 4.� - - 2� 944.7Equity securities 2 20�.1 6 442.2 4.� - - 8 649.6
Monetary authorities - - - - - -General government - - - - - -Banks 2 190.6 6 442.2 4.� - - 8 6�7.0Other sectors 12.5 - - - - 12.5
Debt securities - 15 295.1 - - - 15 295.1Bonds and notes - 15 295.1 - - - 15 295.1
Monetary authorities - - - - - -General government - - - - - -Banks - 15 295.1 - - - 15 295.1Other sectors - - - - - -
Money-market instruments - - - - - -financial derivatives - - - - - -other investment 461 219.5 74 �69.1 2 190.7 - - 5�7 779.�Trade credits 129 �0�.� -6 71�.7 1 215.7 - - 12� 805.�
General government �1 600.0 �00.0 - - - �1 900.0Long-term �1 600.0 �00.0 - - - �1 900.0Short-term - - - - - -
Other sectors 97 70�.� -7 01�.7 1 215.7 - - 91 905.�Long-term - - - - - -Short-term 97 70�.� -7 01�.7 1 215.7 - - 91 905.�
Loans 4� 725.� 12 612.1 81.2 - - 56 418.7Monetary authorities 2 824.5 4 052.1 6.9 - - 6 88�.5
Long-term - - - - - -Short-term 2 824.5 4 052.1 6.9 - - 6 88�.5
General government - - - - - -Banks 10 110.8 7 �10.0 74.� - - 17 495.1
Long-term 2 088.5 40�.0 0.4 - - 2 491.9Short-term 8 022.� 6 907.0 7�.9 - - 15 00�.2
Other sectors �0 790.0 1 250.0 - - - �2 040.0Long-term - - - - - -Short-term �0 790.0 1 250.0 - - - �2 040.0
Currency and deposits 282 470.8 70 179.7 877.5 - - �5� 527.9Monetary authorities 0.0 40.5 6.0 - - 46.6General government 6 907.7 -847.2 45.5 - - 6 105.9Banks 211 �28.0 69 209.2 821.1 - - 281 �58.4Other sectors 64 2�5.1 1 777.1 4.8 - - 66 017.0
Other assets 5 720.1 -1 709.0 16.� - - 4 027.4Monetary authorities 2.6 - 0.0 - - 2.6
Long-term - - - - - -Short-term 2.6 - 0.0 - - 2.6
General government 2 570.� -2 562.� -4.5 - - �.4Long-term - - - - - -
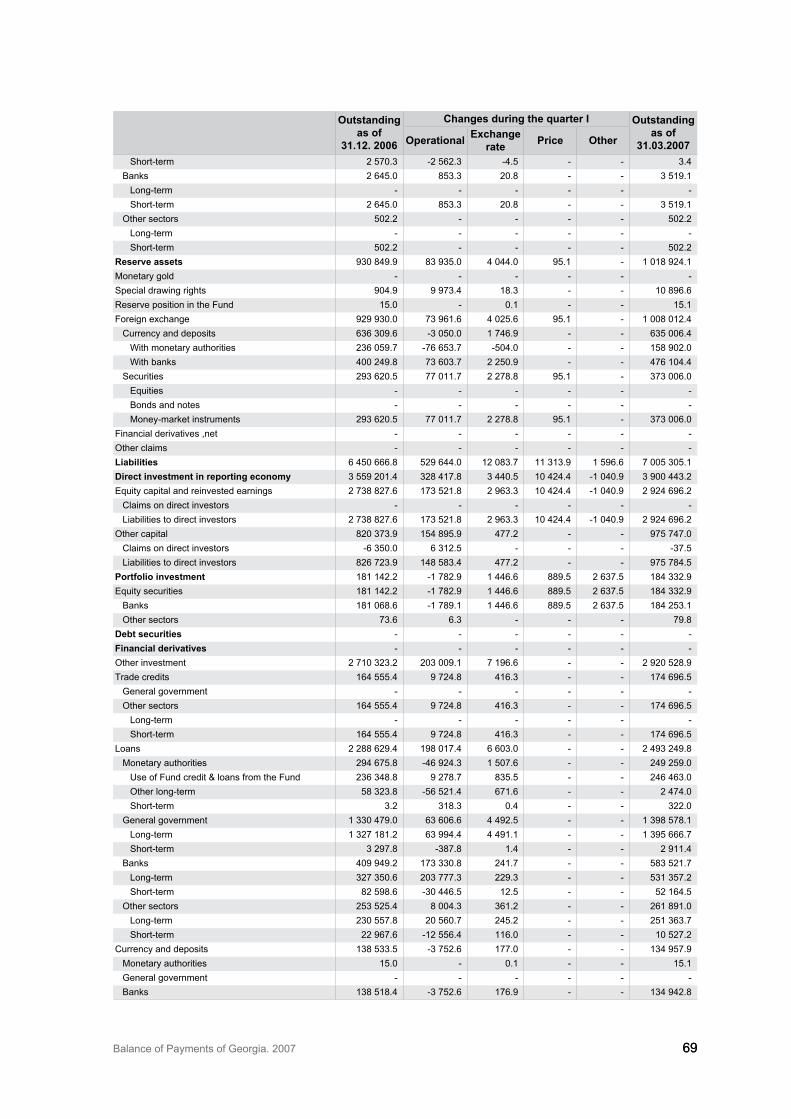
Balance of Payments of Georgia. 2007 6969
outstanding as of
31.12. 2006
changes during the quarter i outstanding as of
31.03.2007operational exchange rate price other
Short-term 2 570.� -2 562.� -4.5 - - �.4Banks 2 645.0 85�.� 20.8 - - � 519.1
Long-term - - - - - -Short-term 2 645.0 85�.� 20.8 - - � 519.1
Other sectors 502.2 - - - - 502.2Long-term - - - - - -Short-term 502.2 - - - - 502.2
reserve assets 9�0 849.9 8� 9�5.0 4 044.0 95.1 - 1 018 924.1Monetary gold - - - - - -Special drawing rights 904.9 9 97�.4 18.� - - 10 896.6Reserve position in the Fund 15.0 - 0.1 - - 15.1Foreign exchange 929 9�0.0 7� 961.6 4 025.6 95.1 - 1 008 012.4
Currency and deposits 6�6 �09.6 -� 050.0 1 746.9 - - 6�5 006.4With monetary authorities 2�6 059.7 -76 65�.7 -504.0 - - 158 902.0With banks 400 249.8 7� 60�.7 2 250.9 - - 476 104.4
Securities 29� 620.5 77 011.7 2 278.8 95.1 - �7� 006.0Equities - - - - - -Bonds and notes - - - - - -Money-market instruments 29� 620.5 77 011.7 2 278.8 95.1 - �7� 006.0
Financial derivatives ,net - - - - - -Other claims - - - - - -liabilities 6 450 666.8 529 644.0 12 08�.7 11 �1�.9 1 596.6 7 005 �05.1direct investment in reporting economy � 559 201.4 �28 417.8 � 440.5 10 424.4 -1 040.9 � 900 44�.2Equity capital and reinvested earnings 2 7�8 827.6 17� 521.8 2 96�.� 10 424.4 -1 040.9 2 924 696.2
Claims on direct investors - - - - - -Liabilities to direct investors 2 7�8 827.6 17� 521.8 2 96�.� 10 424.4 -1 040.9 2 924 696.2
Other capital 820 �7�.9 154 895.9 477.2 - - 975 747.0Claims on direct investors -6 �50.0 6 �12.5 - - - -�7.5Liabilities to direct investors 826 72�.9 148 58�.4 477.2 - - 975 784.5
portfolio investment 181 142.2 -1 782.9 1 446.6 889.5 2 6�7.5 184 ��2.9Equity securities 181 142.2 -1 782.9 1 446.6 889.5 2 6�7.5 184 ��2.9
Banks 181 068.6 -1 789.1 1 446.6 889.5 2 6�7.5 184 25�.1Other sectors 7�.6 6.� - - - 79.8
debt securities - - - - - -financial derivatives - - - - - -Other investment 2 710 �2�.2 20� 009.1 7 196.6 - - 2 920 528.9Trade credits 164 555.4 9 724.8 416.� - - 174 696.5
General government - - - - - -Other sectors 164 555.4 9 724.8 416.� - - 174 696.5
Long-term - - - - - -Short-term 164 555.4 9 724.8 416.� - - 174 696.5
Loans 2 288 629.4 198 017.4 6 60�.0 - - 2 49� 249.8Monetary authorities 294 675.8 -46 924.� 1 507.6 - - 249 259.0
Use of Fund credit & loans from the Fund 2�6 �48.8 9 278.7 8�5.5 - - 246 46�.0Other long-term 58 �2�.8 -56 521.4 671.6 - - 2 474.0Short-term �.2 �18.� 0.4 - - �22.0
General government 1 ��0 479.0 6� 606.6 4 492.5 - - 1 �98 578.1Long-term 1 �27 181.2 6� 994.4 4 491.1 - - 1 �95 666.7Short-term � 297.8 -�87.8 1.4 - - 2 911.4
Banks 409 949.2 17� ��0.8 241.7 - - 58� 521.7Long-term �27 �50.6 20� 777.� 229.� - - 5�1 �57.2Short-term 82 598.6 -�0 446.5 12.5 - - 52 164.5
Other sectors 25� 525.4 8 004.� �61.2 - - 261 891.0Long-term 2�0 557.8 20 560.7 245.2 - - 251 �6�.7Short-term 22 967.6 -12 556.4 116.0 - - 10 527.2
Currency and deposits 1�8 5��.5 -� 752.6 177.0 - - 1�4 957.9Monetary authorities 15.0 - 0.1 - - 15.1General government - - - - - -Banks 1�8 518.4 -� 752.6 176.9 - - 1�4 942.8
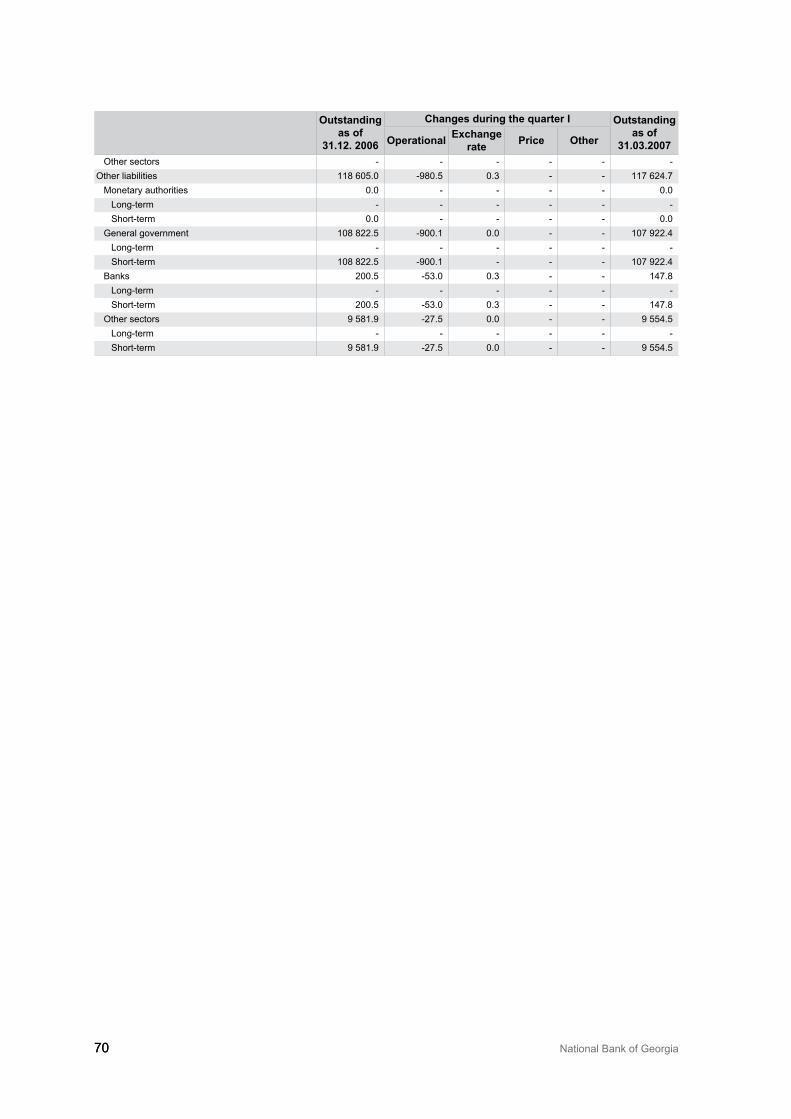
70 National Bank of Georgia70
outstanding as of
31.12. 2006
changes during the quarter i outstanding as of
31.03.2007operational exchange rate price other
Other sectors - - - - - -Other liabilities 118 605.0 -980.5 0.� - - 117 624.7
Monetary authorities 0.0 - - - - 0.0Long-term - - - - - -Short-term 0.0 - - - - 0.0
General government 108 822.5 -900.1 0.0 - - 107 922.4Long-term - - - - - -Short-term 108 822.5 -900.1 - - - 107 922.4
Banks 200.5 -5�.0 0.� - - 147.8Long-term - - - - - -Short-term 200.5 -5�.0 0.� - - 147.8
Other sectors 9 581.9 -27.5 0.0 - - 9 554.5Long-term - - - - - -Short-term 9 581.9 -27.5 0.0 - - 9 554.5
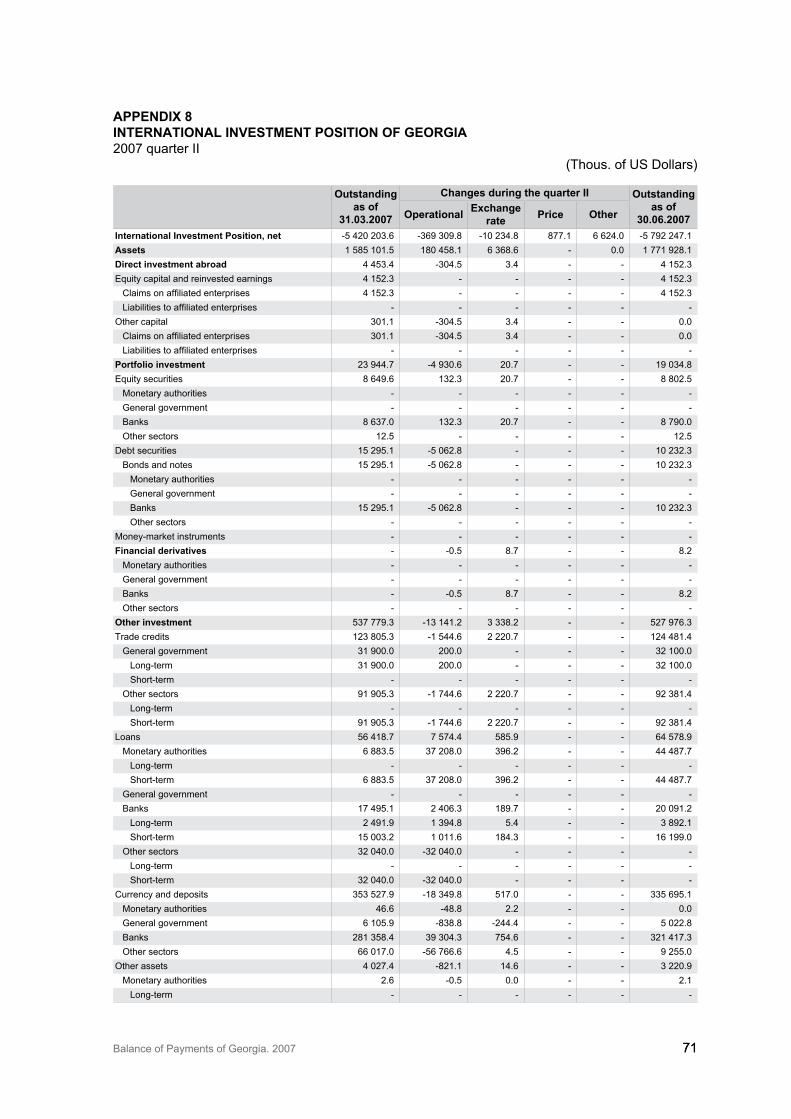
Balance of Payments of Georgia. 2007 7171
appeNdix 8iNterNatioNal iNvestmeNt positioN of GeorGia2007 quarter II
(Thous. of US Dollars)
outstanding as of
31.03.2007
changes during the quarter ii outstanding as of
30.06.2007operational exchange rate price other
international investment position, net -5 420 20�.6 -�69 �09.8 -10 2�4.8 877.1 6 624.0 -5 792 247.1assets 1 585 101.5 180 458.1 6 �68.6 - 0.0 1 771 928.1direct investment abroad 4 45�.4 -�04.5 �.4 - - 4 152.�Equity capital and reinvested earnings 4 152.� - - - - 4 152.�
Claims on affiliated enterprises 4 152.� - - - - 4 152.�Liabilities to affiliated enterprises - - - - - -
Other capital �01.1 -�04.5 �.4 - - 0.0Claims on affiliated enterprises �01.1 -�04.5 �.4 - - 0.0Liabilities to affiliated enterprises - - - - - -
portfolio investment 2� 944.7 -4 9�0.6 20.7 - - 19 0�4.8Equity securities 8 649.6 1�2.� 20.7 - - 8 802.5
Monetary authorities - - - - - -General government - - - - - -Banks 8 6�7.0 1�2.� 20.7 - - 8 790.0Other sectors 12.5 - - - - 12.5
Debt securities 15 295.1 -5 062.8 - - - 10 2�2.�Bonds and notes 15 295.1 -5 062.8 - - - 10 2�2.�
Monetary authorities - - - - - -General government - - - - - -Banks 15 295.1 -5 062.8 - - - 10 2�2.�Other sectors - - - - - -
Money-market instruments - - - - - -financial derivatives - -0.5 8.7 - - 8.2
Monetary authorities - - - - - -General government - - - - - -Banks - -0.5 8.7 - - 8.2Other sectors - - - - - -
other investment 5�7 779.� -1� 141.2 � ��8.2 - - 527 976.�Trade credits 12� 805.� -1 544.6 2 220.7 - - 124 481.4
General government �1 900.0 200.0 - - - �2 100.0Long-term �1 900.0 200.0 - - - �2 100.0Short-term - - - - - -
Other sectors 91 905.� -1 744.6 2 220.7 - - 92 �81.4Long-term - - - - - -Short-term 91 905.� -1 744.6 2 220.7 - - 92 �81.4
Loans 56 418.7 7 574.4 585.9 - - 64 578.9Monetary authorities 6 88�.5 �7 208.0 �96.2 - - 44 487.7
Long-term - - - - - -Short-term 6 88�.5 �7 208.0 �96.2 - - 44 487.7
General government - - - - - -Banks 17 495.1 2 406.� 189.7 - - 20 091.2
Long-term 2 491.9 1 �94.8 5.4 - - � 892.1Short-term 15 00�.2 1 011.6 184.� - - 16 199.0
Other sectors �2 040.0 -�2 040.0 - - - -Long-term - - - - - -Short-term �2 040.0 -�2 040.0 - - - -
Currency and deposits �5� 527.9 -18 �49.8 517.0 - - ��5 695.1Monetary authorities 46.6 -48.8 2.2 - - 0.0General government 6 105.9 -8�8.8 -244.4 - - 5 022.8Banks 281 �58.4 �9 �04.� 754.6 - - �21 417.�Other sectors 66 017.0 -56 766.6 4.5 - - 9 255.0
Other assets 4 027.4 -821.1 14.6 - - � 220.9Monetary authorities 2.6 -0.5 0.0 - - 2.1
Long-term - - - - - -

72 National Bank of Georgia72
outstanding as of
31.03.2007
changes during the quarter ii outstanding as of
30.06.2007operational exchange rate price other
Short-term 2.6 -0.5 0.0 - - 2.1General government �.4 782.0 -0.1 - - 785.4
Long-term - - - - - -Short-term �.4 782.0 -0.1 - - 785.4
Banks � 519.1 -1 602.6 14.7 - - 1 9�1.2Long-term - - - - - -Short-term � 519.1 -1 602.6 14.7 - - 1 9�1.2
Other sectors 502.2 - - - - 502.2Long-term - - - - - -Short-term 502.2 - - - - 502.2
reserve assets 1 018 924.1 198 8�4.8 2 997.6 - - 1 220 756.4Monetary gold - - - - - -Special drawing rights 10 896.6 -10 �46.8 66.1 - - 615.8Reserve position in the Fund 15.1 - 0.1 - - 15.2Foreign exchange 1 008 012.4 209 181.6 2 9�1.5 - - 1 220 125.5
Currency and deposits 6�5 006.4 61 690.2 1 165.4 - - 697 862.0With monetary authorities 158 902.0 -7� 095.7 -286.� - - 85 520.0With banks 476 104.4 1�4 786.0 1 451.6 - - 612 �42.0
Securities �7� 006.0 147 491.4 1 766.1 - - 522 26�.5Money-market instruments �7� 006.0 147 491.4 1 766.1 - - 522 26�.5
Other claims - - - - - -liabilities 7 005 �05.1 549 767.8 16 60�.� -877.1 -6 624.0 7 564 175.2direct investment in reporting economy � 900 44�.2 �66 5�2.8 6 406.8 -877.1 -2 601.4 4 269 904.4Equity capital and reinvested earnings 2 924 696.2 182 790.9 6 287.9 -877.1 -22 407.0 � 090 491.0
Claims on direct investors - - - - - -Liabilities to direct investors 2 924 696.2 182 790.9 6 287.9 -877.1 -22 407.0 � 090 491.0
Other capital 975 747.0 18� 742.0 118.9 - 19 805.6 1 179 41�.5Claims on direct investors -�7.5 -5 29�.9 - - - -5 ��1.�Liabilities to direct investors 975 784.5 189 0�5.8 118.9 - 19 805.6 1 184 744.8
portfolio investment 184 ��2.9 4 496.6 � �62.4 - -4 022.6 188 169.�Equity securities 184 ��2.9 4 496.6 � �62.4 - -4 022.6 188 169.�
Banks 184 25�.1 4 496.6 � �62.4 - -4 022.6 188 089.5Other sectors 79.8 - - - - 79.8
Debt securities - - - - - -financial derivatives - -6.0 42.8 - - �6.9
Monetary authorities - - - - - -General government - - - - - -Banks - -6.0 42.8 - - �6.9Other sectors - - - - - -
other investment 2 920 528.9 178 744.4 6 791.� - - � 106 064.6Trade credits 174 696.5 2 546.0 1 717.9 - - 178 960.4
General government - - - - - -Other sectors 174 696.5 2 546.0 1 717.9 - - 178 960.4
Long-term - - - - - -Short-term 174 696.5 2 546.0 1 717.9 - - 178 960.4
Loans 2 49� 249.8 162 929.7 4 791.7 - - 2 660 971.2Monetary authorities 249 259.0 -10 126.8 914.5 - - 240 046.7
Use of Fund credit & loans from the Fund 246 46�.0 -9 786.2 888.8 - - 2�7 565.6Other long-term 2 474.0 -20.7 24.4 - - 2 477.8Short-term �22.0 -�20.0 1.4 - - �.�
General government 1 �98 578.1 6 960.4 � 202.5 - - 1 408 741.0Long-term 1 �95 666.7 5 971.8 � 196.4 - - 1 404 8�5.0Short-term 2 911.4 988.6 6.0 - - � 906.0
Banks 58� 521.7 1�4 709.� �25.6 - - 718 556.6Long-term 5�1 �57.2 79 58�.8 �09.� - - 611 250.�Short-term 52 164.5 55 125.5 16.� - - 107 �06.�
Other sectors 261 891.0 �1 �87.0 �49.1 - - 29� 627.0Long-term 251 �6�.7 �� 474.4 2�9.9 - - 285 078.0Short-term 10 527.2 -2 087.4 109.2 - - 8 549.0
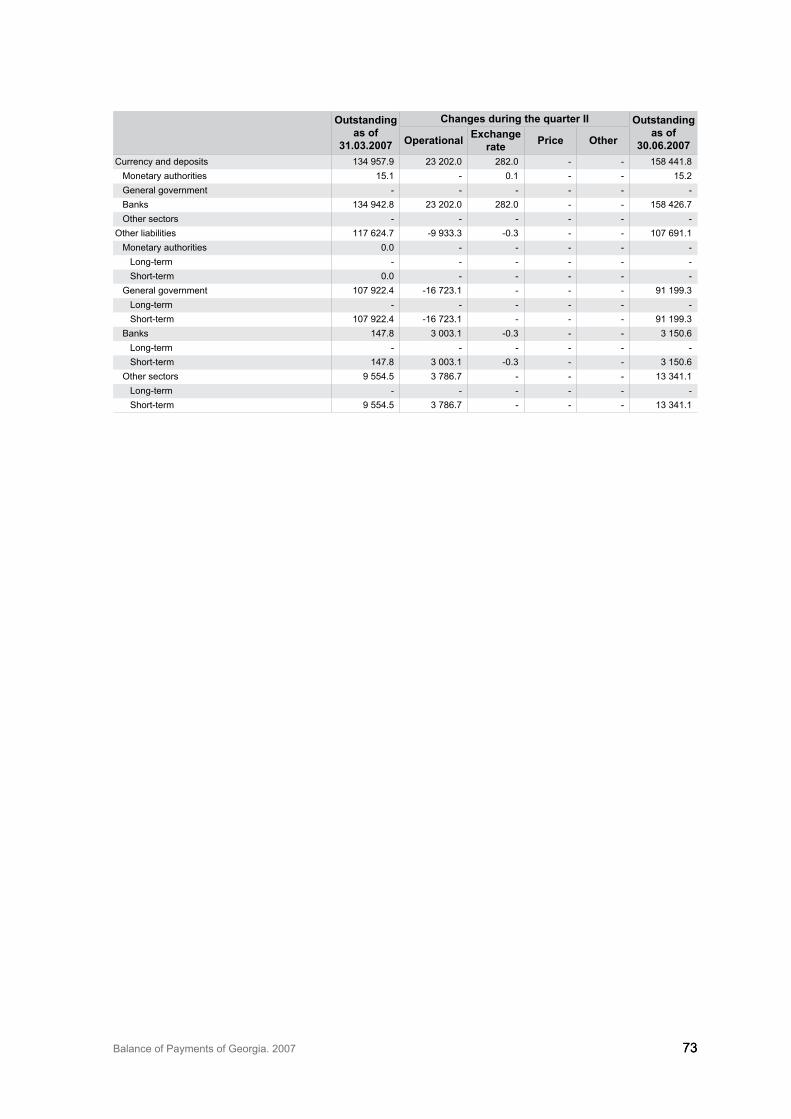
Balance of Payments of Georgia. 2007 7�7�
outstanding as of
31.03.2007
changes during the quarter ii outstanding as of
30.06.2007operational exchange rate price other
Currency and deposits 1�4 957.9 2� 202.0 282.0 - - 158 441.8Monetary authorities 15.1 - 0.1 - - 15.2General government - - - - - -Banks 1�4 942.8 2� 202.0 282.0 - - 158 426.7Other sectors - - - - - -
Other liabilities 117 624.7 -9 9��.� -0.� - - 107 691.1Monetary authorities 0.0 - - - - -
Long-term - - - - - -Short-term 0.0 - - - - -
General government 107 922.4 -16 72�.1 - - - 91 199.�Long-term - - - - - -Short-term 107 922.4 -16 72�.1 - - - 91 199.�
Banks 147.8 � 00�.1 -0.� - - � 150.6Long-term - - - - - -Short-term 147.8 � 00�.1 -0.� - - � 150.6
Other sectors 9 554.5 � 786.7 - - - 1� �41.1Long-term - - - - - -Short-term 9 554.5 � 786.7 - - - 1� �41.1
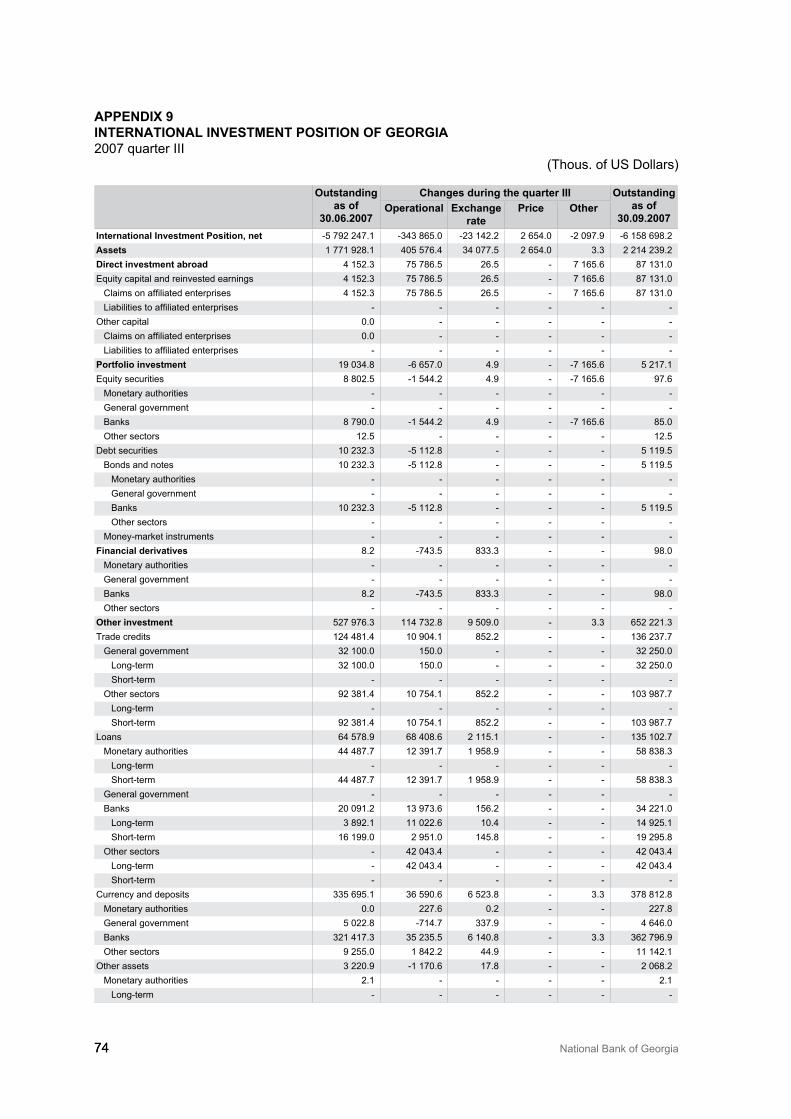
74 National Bank of Georgia74
appeNdix 9iNterNatioNal iNvestmeNt positioN of GeorGia2007 quarter III
(Thous. of US Dollars)
outstanding as of
30.06.2007
changes during the quarter iii outstanding as of
30.09.2007operational exchange
rateprice other
international investment position, net -5 792 247.1 -�4� 865.0 -2� 142.2 2 654.0 -2 097.9 -6 158 698.2assets 1 771 928.1 405 576.4 �4 077.5 2 654.0 �.� 2 214 2�9.2direct investment abroad 4 152.� 75 786.5 26.5 - 7 165.6 87 1�1.0Equity capital and reinvested earnings 4 152.� 75 786.5 26.5 - 7 165.6 87 1�1.0
Claims on affiliated enterprises 4 152.� 75 786.5 26.5 - 7 165.6 87 1�1.0Liabilities to affiliated enterprises - - - - - -
Other capital 0.0 - - - - -Claims on affiliated enterprises 0.0 - - - - -Liabilities to affiliated enterprises - - - - - -
portfolio investment 19 0�4.8 -6 657.0 4.9 - -7 165.6 5 217.1Equity securities 8 802.5 -1 544.2 4.9 - -7 165.6 97.6
Monetary authorities - - - - - -General government - - - - - -Banks 8 790.0 -1 544.2 4.9 - -7 165.6 85.0Other sectors 12.5 - - - - 12.5
Debt securities 10 2�2.� -5 112.8 - - - 5 119.5Bonds and notes 10 2�2.� -5 112.8 - - - 5 119.5
Monetary authorities - - - - - -General government - - - - - -Banks 10 2�2.� -5 112.8 - - - 5 119.5Other sectors - - - - - -
Money-market instruments - - - - - -financial derivatives 8.2 -74�.5 8��.� - - 98.0
Monetary authorities - - - - - -General government - - - - - -Banks 8.2 -74�.5 8��.� - - 98.0Other sectors - - - - - -
other investment 527 976.� 114 7�2.8 9 509.0 - �.� 652 221.�Trade credits 124 481.4 10 904.1 852.2 - - 1�6 2�7.7
General government �2 100.0 150.0 - - - �2 250.0Long-term �2 100.0 150.0 - - - �2 250.0Short-term - - - - - -
Other sectors 92 �81.4 10 754.1 852.2 - - 10� 987.7Long-term - - - - - -Short-term 92 �81.4 10 754.1 852.2 - - 10� 987.7
Loans 64 578.9 68 408.6 2 115.1 - - 1�5 102.7Monetary authorities 44 487.7 12 �91.7 1 958.9 - - 58 8�8.�
Long-term - - - - - -Short-term 44 487.7 12 �91.7 1 958.9 - - 58 8�8.�
General government - - - - - -Banks 20 091.2 1� 97�.6 156.2 - - �4 221.0
Long-term � 892.1 11 022.6 10.4 - - 14 925.1Short-term 16 199.0 2 951.0 145.8 - - 19 295.8
Other sectors - 42 04�.4 - - - 42 04�.4Long-term - 42 04�.4 - - - 42 04�.4Short-term - - - - - -
Currency and deposits ��5 695.1 �6 590.6 6 52�.8 - �.� �78 812.8Monetary authorities 0.0 227.6 0.2 - - 227.8General government 5 022.8 -714.7 ��7.9 - - 4 646.0Banks �21 417.� �5 2�5.5 6 140.8 - �.� �62 796.9Other sectors 9 255.0 1 842.2 44.9 - - 11 142.1
Other assets � 220.9 -1 170.6 17.8 - - 2 068.2Monetary authorities 2.1 - - - - 2.1
Long-term - - - - - -
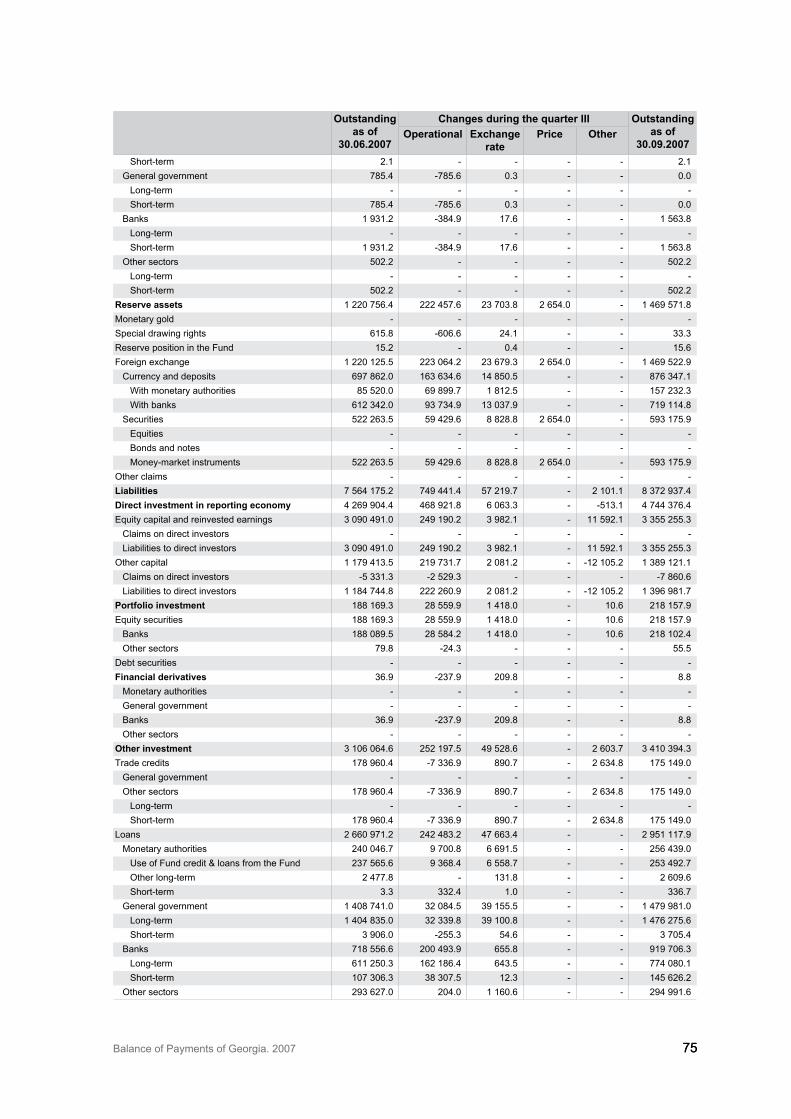
Balance of Payments of Georgia. 2007 7575
outstanding as of
30.06.2007
changes during the quarter iii outstanding as of
30.09.2007operational exchange
rateprice other
Short-term 2.1 - - - - 2.1General government 785.4 -785.6 0.� - - 0.0
Long-term - - - - - -Short-term 785.4 -785.6 0.� - - 0.0
Banks 1 9�1.2 -�84.9 17.6 - - 1 56�.8Long-term - - - - - -Short-term 1 9�1.2 -�84.9 17.6 - - 1 56�.8
Other sectors 502.2 - - - - 502.2Long-term - - - - - -Short-term 502.2 - - - - 502.2
reserve assets 1 220 756.4 222 457.6 2� 70�.8 2 654.0 - 1 469 571.8Monetary gold - - - - - -Special drawing rights 615.8 -606.6 24.1 - - ��.�Reserve position in the Fund 15.2 - 0.4 - - 15.6Foreign exchange 1 220 125.5 22� 064.2 2� 679.� 2 654.0 - 1 469 522.9
Currency and deposits 697 862.0 16� 6�4.6 14 850.5 - - 876 �47.1With monetary authorities 85 520.0 69 899.7 1 812.5 - - 157 2�2.�With banks 612 �42.0 9� 7�4.9 1� 0�7.9 - - 719 114.8
Securities 522 26�.5 59 429.6 8 828.8 2 654.0 - 59� 175.9Equities - - - - - -Bonds and notes - - - - - -Money-market instruments 522 26�.5 59 429.6 8 828.8 2 654.0 - 59� 175.9
Other claims - - - - - -liabilities 7 564 175.2 749 441.4 57 219.7 - 2 101.1 8 �72 9�7.4direct investment in reporting economy 4 269 904.4 468 921.8 6 06�.� - -51�.1 4 744 �76.4Equity capital and reinvested earnings � 090 491.0 249 190.2 � 982.1 - 11 592.1 � �55 255.�
Claims on direct investors - - - - - -Liabilities to direct investors � 090 491.0 249 190.2 � 982.1 - 11 592.1 � �55 255.�
Other capital 1 179 41�.5 219 7�1.7 2 081.2 - -12 105.2 1 �89 121.1Claims on direct investors -5 ��1.� -2 529.� - - - -7 860.6Liabilities to direct investors 1 184 744.8 222 260.9 2 081.2 - -12 105.2 1 �96 981.7
portfolio investment 188 169.� 28 559.9 1 418.0 - 10.6 218 157.9Equity securities 188 169.� 28 559.9 1 418.0 - 10.6 218 157.9
Banks 188 089.5 28 584.2 1 418.0 - 10.6 218 102.4Other sectors 79.8 -24.� - - - 55.5
Debt securities - - - - - -financial derivatives �6.9 -2�7.9 209.8 - - 8.8
Monetary authorities - - - - - -General government - - - - - -Banks �6.9 -2�7.9 209.8 - - 8.8Other sectors - - - - - -
other investment � 106 064.6 252 197.5 49 528.6 - 2 60�.7 � 410 �94.�Trade credits 178 960.4 -7 ��6.9 890.7 - 2 6�4.8 175 149.0
General government - - - - - -Other sectors 178 960.4 -7 ��6.9 890.7 - 2 6�4.8 175 149.0
Long-term - - - - - -Short-term 178 960.4 -7 ��6.9 890.7 - 2 6�4.8 175 149.0
Loans 2 660 971.2 242 48�.2 47 66�.4 - - 2 951 117.9Monetary authorities 240 046.7 9 700.8 6 691.5 - - 256 4�9.0
Use of Fund credit & loans from the Fund 2�7 565.6 9 �68.4 6 558.7 - - 25� 492.7Other long-term 2 477.8 - 1�1.8 - - 2 609.6Short-term �.� ��2.4 1.0 - - ��6.7
General government 1 408 741.0 �2 084.5 �9 155.5 - - 1 479 981.0Long-term 1 404 8�5.0 �2 ��9.8 �9 100.8 - - 1 476 275.6Short-term � 906.0 -255.� 54.6 - - � 705.4
Banks 718 556.6 200 49�.9 655.8 - - 919 706.�Long-term 611 250.� 162 186.4 64�.5 - - 774 080.1Short-term 107 �06.� �8 �07.5 12.� - - 145 626.2
Other sectors 29� 627.0 204.0 1 160.6 - - 294 991.6
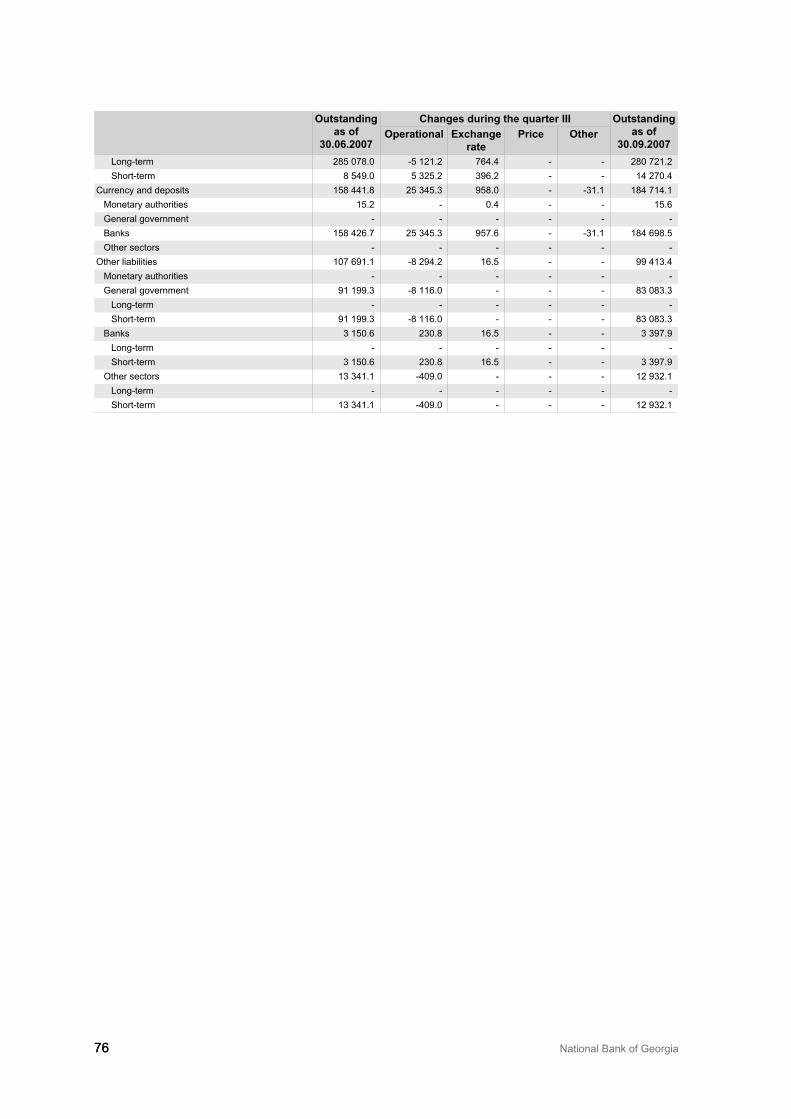
76 National Bank of Georgia76
outstanding as of
30.06.2007
changes during the quarter iii outstanding as of
30.09.2007operational exchange
rateprice other
Long-term 285 078.0 -5 121.2 764.4 - - 280 721.2Short-term 8 549.0 5 �25.2 �96.2 - - 14 270.4
Currency and deposits 158 441.8 25 �45.� 958.0 - -�1.1 184 714.1Monetary authorities 15.2 - 0.4 - - 15.6General government - - - - - -Banks 158 426.7 25 �45.� 957.6 - -�1.1 184 698.5Other sectors - - - - - -
Other liabilities 107 691.1 -8 294.2 16.5 - - 99 41�.4Monetary authorities - - - - - -General government 91 199.� -8 116.0 - - - 8� 08�.�
Long-term - - - - - -Short-term 91 199.� -8 116.0 - - - 8� 08�.�
Banks � 150.6 2�0.8 16.5 - - � �97.9Long-term - - - - - -Short-term � 150.6 2�0.8 16.5 - - � �97.9
Other sectors 1� �41.1 -409.0 - - - 12 9�2.1Long-term - - - - - -Short-term 1� �41.1 -409.0 - - - 12 9�2.1
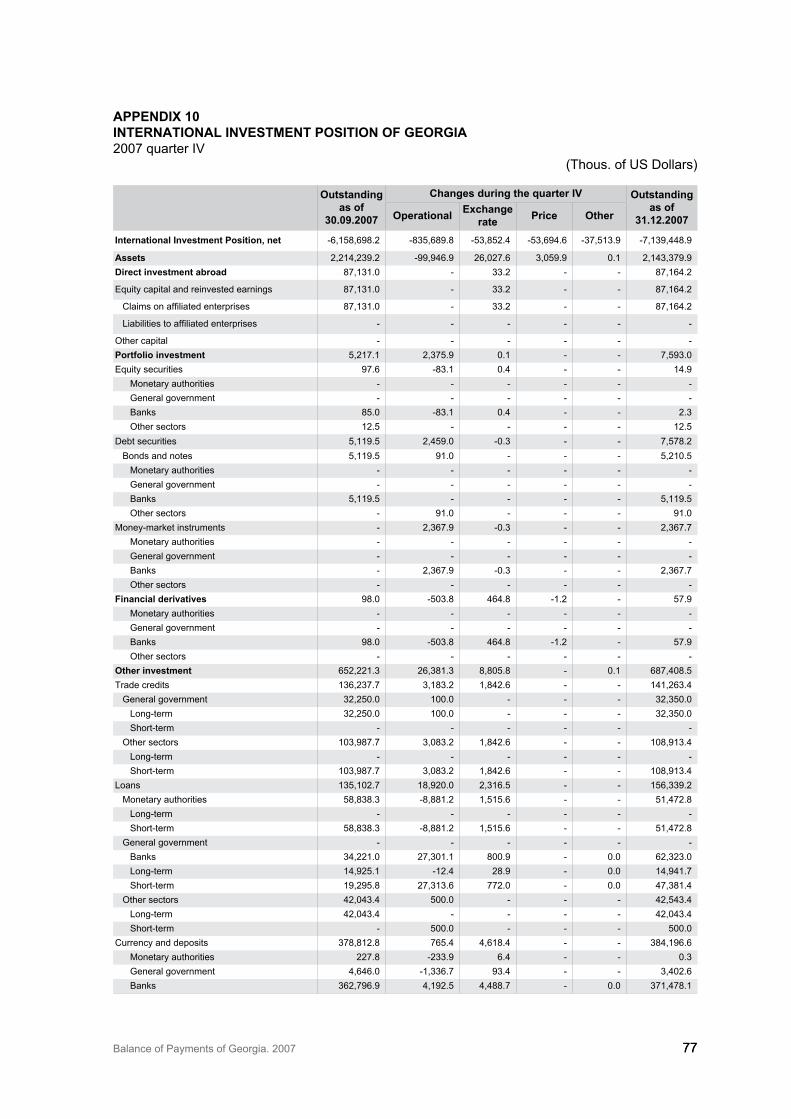
Balance of Payments of Georgia. 2007 7777
appeNdix 10iNterNatioNal iNvestmeNt positioN of GeorGia2007 quarter IV
(Thous. of US Dollars)
outstanding as of
30.09.2007
changes during the quarter iv outstanding as of
31.12.2007operational exchange rate price other
international investment position, net -6,158,698.2 -8�5,689.8 -5�,852.4 -5�,694.6 -�7,51�.9 -7,1�9,448.9
assets 2,214,2�9.2 -99,946.9 26,027.6 �,059.9 0.1 2,14�,�79.9direct investment abroad 87,1�1.0 - ��.2 - - 87,164.2
Equity capital and reinvested earnings 87,1�1.0 - ��.2 - - 87,164.2
Claims on affiliated enterprises 87,1�1.0 - ��.2 - - 87,164.2
Liabilities to affiliated enterprises - - - - - -
Other capital - - - - - -portfolio investment 5,217.1 2,�75.9 0.1 - - 7,59�.0Equity securities 97.6 -8�.1 0.4 - - 14.9
Monetary authorities - - - - - -General government - - - - - -Banks 85.0 -8�.1 0.4 - - 2.�Other sectors 12.5 - - - - 12.5
Debt securities 5,119.5 2,459.0 -0.� - - 7,578.2Bonds and notes 5,119.5 91.0 - - - 5,210.5
Monetary authorities - - - - - -General government - - - - - -Banks 5,119.5 - - - - 5,119.5Other sectors - 91.0 - - - 91.0
Money-market instruments - 2,�67.9 -0.� - - 2,�67.7Monetary authorities - - - - - -General government - - - - - -Banks - 2,�67.9 -0.� - - 2,�67.7Other sectors - - - - - -
financial derivatives 98.0 -50�.8 464.8 -1.2 - 57.9Monetary authorities - - - - - -General government - - - - - -Banks 98.0 -50�.8 464.8 -1.2 - 57.9Other sectors - - - - - -
other investment 652,221.� 26,�81.� 8,805.8 - 0.1 687,408.5Trade credits 1�6,2�7.7 �,18�.2 1,842.6 - - 141,26�.4
General government �2,250.0 100.0 - - - �2,�50.0Long-term �2,250.0 100.0 - - - �2,�50.0Short-term - - - - - -
Other sectors 10�,987.7 �,08�.2 1,842.6 - - 108,91�.4Long-term - - - - - -Short-term 10�,987.7 �,08�.2 1,842.6 - - 108,91�.4
Loans 1�5,102.7 18,920.0 2,�16.5 - - 156,��9.2Monetary authorities 58,8�8.� -8,881.2 1,515.6 - - 51,472.8
Long-term - - - - - -Short-term 58,8�8.� -8,881.2 1,515.6 - - 51,472.8
General government - - - - - -Banks �4,221.0 27,�01.1 800.9 - 0.0 62,�2�.0Long-term 14,925.1 -12.4 28.9 - 0.0 14,941.7Short-term 19,295.8 27,�1�.6 772.0 - 0.0 47,�81.4
Other sectors 42,04�.4 500.0 - - - 42,54�.4Long-term 42,04�.4 - - - - 42,04�.4Short-term - 500.0 - - - 500.0
Currency and deposits �78,812.8 765.4 4,618.4 - - �84,196.6Monetary authorities 227.8 -2��.9 6.4 - - 0.�General government 4,646.0 -1,��6.7 9�.4 - - �,402.6Banks �62,796.9 4,192.5 4,488.7 - 0.0 �71,478.1

78 National Bank of Georgia78
outstanding as of
30.09.2007
changes during the quarter iv outstanding as of
31.12.2007operational exchange rate price other
Other sectors 11,142.1 -1,856.4 �0.0 - - 9,�15.7Other assets 2,068.2 �,512.8 28.4 - - 5,609.4
Monetary authorities 2.1 - - - - 2.1Long-term - - - - - -Short-term 2.1 - - - - 2.1
General government 0.0 789.6 - - - 789.6Long-term - - - - - -Short-term 0.0 789.6 - - - 789.6
Banks 1,56�.8 2,72�.2 28.4 - - 4,�15.4Long-term - - - - - -Short-term 1,56�.8 2,72�.2 28.4 - - 4,�15.4
Other sectors 502.2 - - - - 502.2Long-term - - - - - -Short-term 502.2 - - - - 502.2
reserve assets 1,469,571.8 -128,200.� 16,72�.6 �,061.1 - 1,�61,156.�Monetary gold - - - - - -Special drawing rights ��.� 14,598.� 171.0 - - 14,802.6Reserve position in the Fund 15.6 - 0.2 - - 15.8Foreign exchange 1,469,522.9 -142,798.5 16,552.4 �,061.1 - 1,�46,��7.9
Currency and deposits 876,�47.1 -128,�77.9 9,086.7 - - 757,055.9With monetary authorities 157,2�2.� -70,488.� 496.2 - - 87,240.2With banks 719,114.8 -57,889.6 8,590.5 - - 669,815.7
Securities 59�,175.9 -14,420.6 7,465.8 �,061.1 - 589,282.0Equities - - - - - -Bonds and notes - - - - - -Money-market instruments 59�,175.9 -14,420.6 7,465.8 �,061.1 - 589,282.0
Financial derivatives ,net - - - - - -Other claims - - - - - -liabilities 8,�72,9�7.4 7�5,742.9 79,880.0 56,754.5 �7,51�.9 9,282,828.8direct investment in reporting economy 4,744,�76.4 586,�70.2 �5,728.0 26,719.5 -4,469.6 5,�88,724.5
Equity capital and reinvested earnings �,�55,255.� �04,408.1 27,152.9 26,719.5 -6,811.5 �,706,724.4
Claims on direct investors - - - - - -Liabilities to direct investors �,�55,255.� �04,408.1 27,152.9 26,719.5 -6,811.5 �,706,724.4
Other capital 1,�89,121.1 281,962.0 8,575.1 - 2,�41.9 1,682,000.1Claims on direct investors -7,860.6 4,111.1 - - - -�,749.5Liabilities to direct investors 1,�96,981.7 277,851.0 8,575.1 - 2,�41.9 1,685,749.7
portfolio investment 218,157.9 2,214.9 9,779.7 �0,0��.4 1,800.8 261,986.7Equity securities 218,157.9 2,214.9 9,779.7 �0,0��.4 1,800.8 261,986.7
Banks 218,102.4 2,21�.8 9,779.7 �0,0��.4 1,800.8 261,9�0.1Other sectors 55.5 1.1 - - - 56.6
Debt securities - - - - - -financial derivatives 8.8 62.8 -6�.9 1.6 0.0 9.�
Monetary authorities - - - - - -General government - - - - - -Banks 8.8 62.8 -6�.9 1.6 0.0 9.�Other sectors - - - - - -
other investment �,410,�94.� 147,095.1 �4,4�6.2 - 40,182.7 �,6�2,108.�Trade credits 175,149.0 -58,054.� 6,787.8 - 22,�2�.7 146,206.2
General government - - - - - -Other sectors 175,149.0 -58,054.� 6,787.8 - 22,�2�.7 146,206.2
Long-term - - - - - -Short-term 175,149.0 -58,054.� 6,787.8 - 22,�2�.7 146,206.2
Loans 2,951,117.9 164,887.8 26,56�.7 - 17,858.9 �,160,428.�Monetary authorities 256,4�9.0 -6,088.0 �,854.6 - - 254,205.6
Use of Fund credit & loans from the Fund 25�,492.7 -5,724.5 �,760.� - - 251,528.4
Other long-term 2,609.6 -24.9 89.0 - - 2,67�.6Short-term ��6.7 -��8.5 5.� - - �.6
General government 1,479,981.0 8,6�6.4 20,698.4 - - 1,509,�15.7

Balance of Payments of Georgia. 2007 7979
outstanding as of
30.09.2007
changes during the quarter iv outstanding as of
31.12.2007operational exchange rate price other
Long-term 1,476,275.6 8,741.8 20,687.0 - - 1,505,704.4Short-term �,705.4 -105.4 11.� - - �,611.�
Banks 919,706.� 1�8,591.7 841.4 - - 1,059,1�9.4Long-term 774,080.1 120,162.� 812.8 - - 895,055.2Short-term 145,626.2 18,429.4 28.6 - - 164,084.2
Other sectors 294,991.6 2�,747.6 1,169.4 - 17,858.9 ��7,767.5Long-term 280,721.2 �0,127.1 872.2 - 9,158.9 �20,879.5Short-term 14,270.4 -6,�79.5 297.2 - 8,700.0 16,888.1
Currency and deposits 184,714.1 47,�2�.9 1,07�.9 - - 2��,111.9Monetary authorities 15.6 - 0.2 - - 15.8General government - - - - - -Banks 184,698.5 47,�2�.9 1,07�.6 - - 2��,096.1Other sectors - - - - - -
Other liabilities 99,41�.4 -7,062.� 10.9 - - 92,�61.9Monetary authorities - - - - - 0.0General government 8�,08�.� -9,145.6 - - - 7�,9�7.7
Long-term - - - - - -Short-term 8�,08�.� -9,145.6 - - - 7�,9�7.7
Banks �,�97.9 -615.9 10.9 - - 2,792.9Long-term - - - - - -Short-term �,�97.9 -615.9 10.9 - - 2,792.9
Other sectors 12,9�2.1 2,699.2 - - - 15,6�1.�Long-term - - - - - -Short-term 12,9�2.1 2,699.2 - - - 15,6�1.�
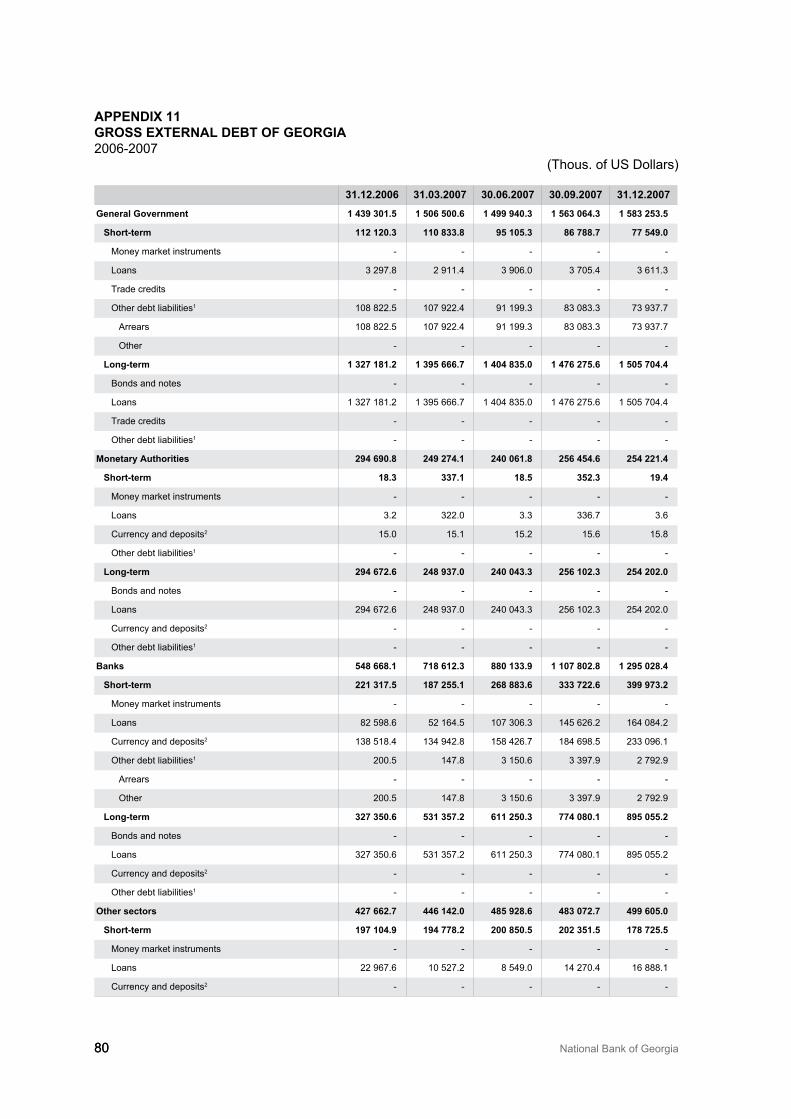
80 National Bank of Georgia80
appeNdix 11Gross exterNal deBt of GeorGia2006-2007
(Thous. of US Dollars)
31.12.2006 31.03.2007 30.06.2007 30.09.2007 31.12.2007
General Government 1 439 301.5 1 506 500.6 1 499 940.3 1 563 064.3 1 583 253.5
shortterm 112 120.3 110 833.8 95 105.3 86 788.7 77 549.0
Money market instruments - - - - -
Loans � 297.8 2 911.4 � 906.0 � 705.4 � 611.�
Trade credits - - - - -
Other debt liabilities1 108 822.5 107 922.4 91 199.� 8� 08�.� 7� 9�7.7
Arrears 108 822.5 107 922.4 91 199.� 8� 08�.� 7� 9�7.7
Other - - - - -
longterm 1 327 181.2 1 395 666.7 1 404 835.0 1 476 275.6 1 505 704.4
Bonds and notes - - - - -
Loans 1 �27 181.2 1 �95 666.7 1 404 8�5.0 1 476 275.6 1 505 704.4
Trade credits - - - - -
Other debt liabilities1 - - - - -
monetary authorities 294 690.8 249 274.1 240 061.8 256 454.6 254 221.4
shortterm 18.3 337.1 18.5 352.3 19.4
Money market instruments - - - - -
Loans �.2 �22.0 �.� ��6.7 �.6
Currency and deposits2 15.0 15.1 15.2 15.6 15.8
Other debt liabilities1 - - - - -
longterm 294 672.6 248 937.0 240 043.3 256 102.3 254 202.0
Bonds and notes - - - - -
Loans 294 672.6 248 9�7.0 240 04�.� 256 102.� 254 202.0
Currency and deposits2 - - - - -
Other debt liabilities1 - - - - -
Banks 548 668.1 718 612.3 880 133.9 1 107 802.8 1 295 028.4
shortterm 221 317.5 187 255.1 268 883.6 333 722.6 399 973.2
Money market instruments - - - - -
Loans 82 598.6 52 164.5 107 �06.� 145 626.2 164 084.2
Currency and deposits2 1�8 518.4 1�4 942.8 158 426.7 184 698.5 2�� 096.1
Other debt liabilities1 200.5 147.8 � 150.6 � �97.9 2 792.9
Arrears - - - - -
Other 200.5 147.8 � 150.6 � �97.9 2 792.9
longterm 327 350.6 531 357.2 611 250.3 774 080.1 895 055.2
Bonds and notes - - - - -
Loans �27 �50.6 5�1 �57.2 611 250.� 774 080.1 895 055.2
Currency and deposits2 - - - - -
Other debt liabilities1 - - - - -
other sectors 427 662.7 446 142.0 485 928.6 483 072.7 499 605.0
shortterm 197 104.9 194 778.2 200 850.5 202 351.5 178 725.5
Money market instruments - - - - -
Loans 22 967.6 10 527.2 8 549.0 14 270.4 16 888.1
Currency and deposits2 - - - - -
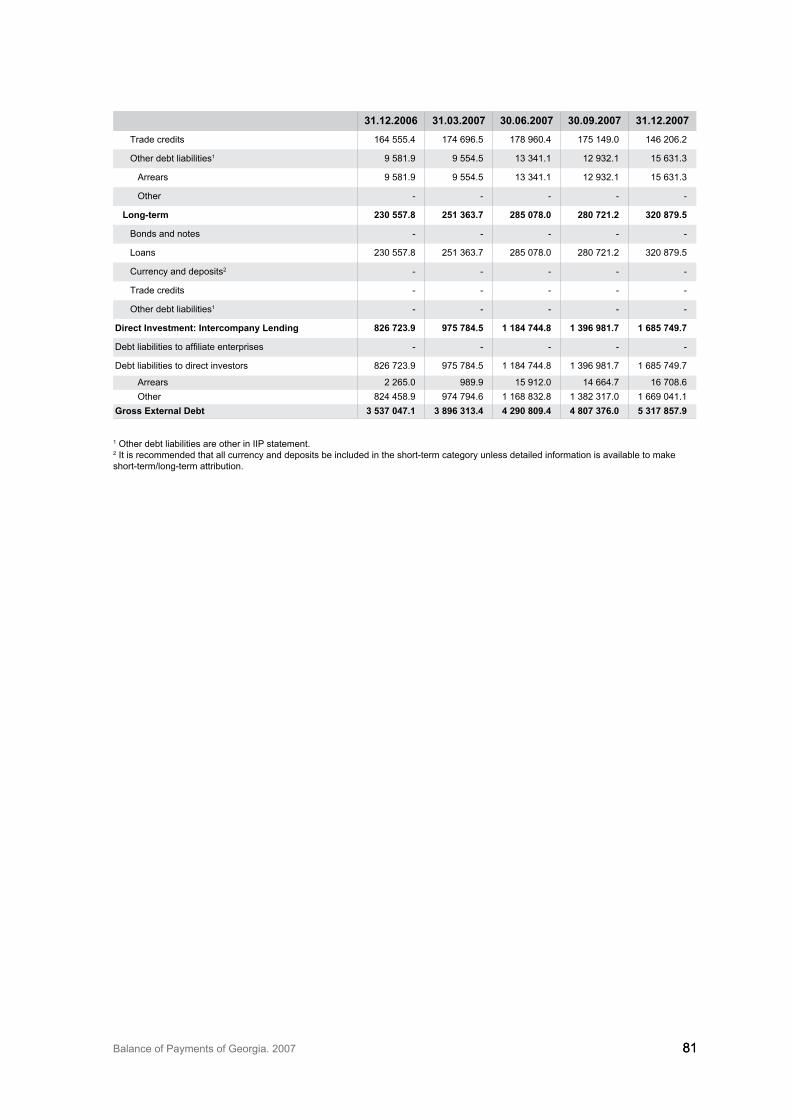
Balance of Payments of Georgia. 2007 8181
31.12.2006 31.03.2007 30.06.2007 30.09.2007 31.12.2007Trade credits 164 555.4 174 696.5 178 960.4 175 149.0 146 206.2
Other debt liabilities1 9 581.9 9 554.5 1� �41.1 12 9�2.1 15 6�1.�
Arrears 9 581.9 9 554.5 1� �41.1 12 9�2.1 15 6�1.�
Other - - - - -
longterm 230 557.8 251 363.7 285 078.0 280 721.2 320 879.5
Bonds and notes - - - - -
Loans 2�0 557.8 251 �6�.7 285 078.0 280 721.2 �20 879.5
Currency and deposits2 - - - - -
Trade credits - - - - -
Other debt liabilities1 - - - - -
direct investment: intercompany lending 826 723.9 975 784.5 1 184 744.8 1 396 981.7 1 685 749.7
Debt liabilities to affiliate enterprises - - - - -
Debt liabilities to direct investors 826 72�.9 975 784.5 1 184 744.8 1 �96 981.7 1 685 749.7
Arrears 2 265.0 989.9 15 912.0 14 664.7 16 708.6Other 824 458.9 974 794.6 1 168 8�2.8 1 �82 �17.0 1 669 041.1
Gross external debt 3 537 047.1 3 896 313.4 4 290 809.4 4 807 376.0 5 317 857.9
1 Other debt liabilities are other in IIP statement.2 It is recommended that all currency and deposits be included in the short-term category unless detailed information is available to make short-term/long-term attribution.
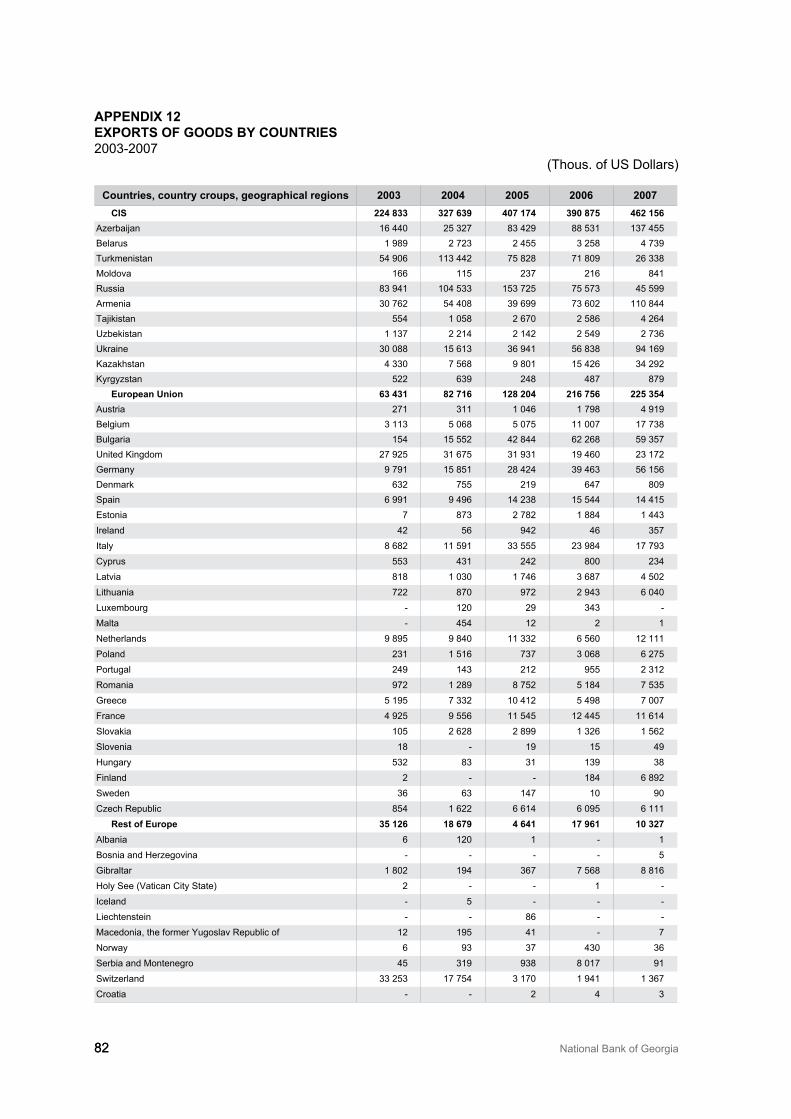
82 National Bank of Georgia82
appeNdix 12exports of Goods By coUNtries200�-2007
(Thous. of US Dollars)
countries, country croups, geographical regions 2003 2004 2005 2006 2007cis 224 833 327 639 407 174 390 875 462 156
Azerbaijan 16 440 25 �27 8� 429 88 5�1 1�7 455 Belarus 1 989 2 72� 2 455 � 258 4 7�9 Turkmenistan 54 906 11� 442 75 828 71 809 26 ��8 Moldova 166 115 2�7 216 841 Russia 8� 941 104 5�� 15� 725 75 57� 45 599 Armenia �0 762 54 408 �9 699 7� 602 110 844 Tajikistan 554 1 058 2 670 2 586 4 264 Uzbekistan 1 1�7 2 214 2 142 2 549 2 7�6 Ukraine �0 088 15 61� �6 941 56 8�8 94 169 Kazakhstan 4 ��0 7 568 9 801 15 426 �4 292 Kyrgyzstan 522 6�9 248 487 879
european Union 63 431 82 716 128 204 216 756 225 354 Austria 271 �11 1 046 1 798 4 919 Belgium � 11� 5 068 5 075 11 007 17 7�8 Bulgaria 154 15 552 42 844 62 268 59 �57 United Kingdom 27 925 �1 675 �1 9�1 19 460 2� 172 Germany 9 791 15 851 28 424 �9 46� 56 156 Denmark 6�2 755 219 647 809 Spain 6 991 9 496 14 2�8 15 544 14 415 Estonia 7 87� 2 782 1 884 1 44� Ireland 42 56 942 46 �57 Italy 8 682 11 591 �� 555 2� 984 17 79� Cyprus 55� 4�1 242 800 2�4 Latvia 818 1 0�0 1 746 � 687 4 502 Lithuania 722 870 972 2 94� 6 040 Luxembourg - 120 29 �4� - Malta - 454 12 2 1 Netherlands 9 895 9 840 11 ��2 6 560 12 111 Poland 2�1 1 516 7�7 � 068 6 275 Portugal 249 14� 212 955 2 �12 Romania 972 1 289 8 752 5 184 7 5�5 Greece 5 195 7 ��2 10 412 5 498 7 007 France 4 925 9 556 11 545 12 445 11 614 Slovakia 105 2 628 2 899 1 �26 1 562 Slovenia 18 - 19 15 49 Hungary 5�2 8� �1 1�9 �8 Finland 2 - - 184 6 892 Sweden �6 6� 147 10 90 Czech Republic 854 1 622 6 614 6 095 6 111
rest of europe 35 126 18 679 4 641 17 961 10 327 Albania 6 120 1 - 1 Bosnia and Herzegovina - - - - 5 Gibraltar 1 802 194 �67 7 568 8 816 Holy See (Vatican City State) 2 - - 1 - Iceland - 5 - - - Liechtenstein - - 86 - - Macedonia, the former Yugoslav Republic of 12 195 41 - 7 Norway 6 9� �7 4�0 �6 Serbia and Montenegro 45 �19 9�8 8 017 91 Switzerland �� 25� 17 754 � 170 1 941 1 �67 Croatia - - 2 4 �
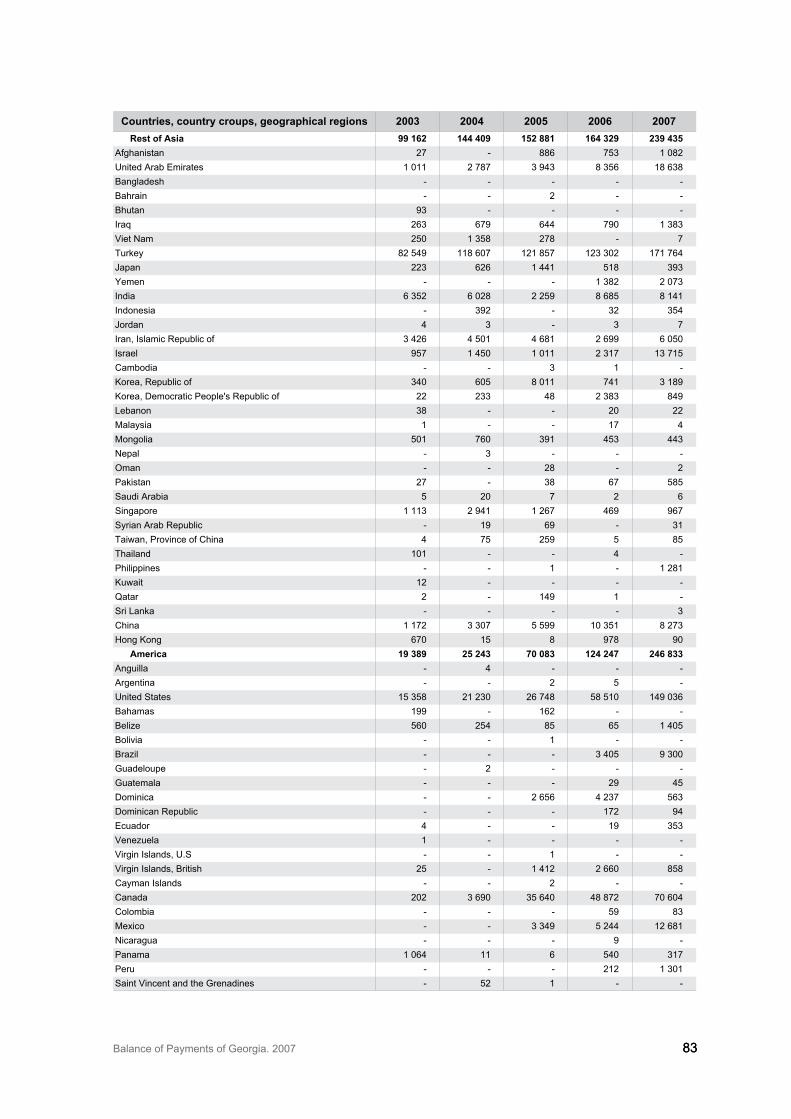
Balance of Payments of Georgia. 2007 8�8�
countries, country croups, geographical regions 2003 2004 2005 2006 2007rest of asia 99 162 144 409 152 881 164 329 239 435
Afghanistan 27 - 886 75� 1 082 United Arab Emirates 1 011 2 787 � 94� 8 �56 18 6�8 Bangladesh - - - - - Bahrain - - 2 - - Bhutan 9� - - - - Iraq 26� 679 644 790 1 �8� Viet Nam 250 1 �58 278 - 7 Turkey 82 549 118 607 121 857 12� �02 171 764 Japan 22� 626 1 441 518 �9� Yemen - - - 1 �82 2 07� India 6 �52 6 028 2 259 8 685 8 141 Indonesia - �92 - �2 �54 Jordan 4 � - � 7 Iran, Islamic Republic of � 426 4 501 4 681 2 699 6 050 Israel 957 1 450 1 011 2 �17 1� 715 Cambodia - - � 1 - Korea, Republic of �40 605 8 011 741 � 189 Korea, Democratic People's Republic of 22 2�� 48 2 �8� 849 Lebanon �8 - - 20 22 Malaysia 1 - - 17 4 Mongolia 501 760 �91 45� 44� Nepal - � - - - Oman - - 28 - 2 Pakistan 27 - �8 67 585 Saudi Arabia 5 20 7 2 6 Singapore 1 11� 2 941 1 267 469 967 Syrian Arab Republic - 19 69 - �1 Taiwan, Province of China 4 75 259 5 85 Thailand 101 - - 4 - Philippines - - 1 - 1 281 Kuwait 12 - - - - Qatar 2 - 149 1 - Sri Lanka - - - - � China 1 172 � �07 5 599 10 �51 8 27� Hong Kong 670 15 8 978 90
america 19 389 25 243 70 083 124 247 246 833 Anguilla - 4 - - - Argentina - - 2 5 - United States 15 �58 21 2�0 26 748 58 510 149 0�6 Bahamas 199 - 162 - - Belize 560 254 85 65 1 405 Bolivia - - 1 - - Brazil - - - � 405 9 �00 Guadeloupe - 2 - - - Guatemala - - - 29 45 Dominica - - 2 656 4 2�7 56� Dominican Republic - - - 172 94 Ecuador 4 - - 19 �5� Venezuela 1 - - - - Virgin Islands, U.S - - 1 - - Virgin Islands, British 25 - 1 412 2 660 858 Cayman Islands - - 2 - - Canada 202 � 690 �5 640 48 872 70 604 Colombia - - - 59 8� Mexico - - � �49 5 244 12 681 Nicaragua - - - 9 - Panama 1 064 11 6 540 �17 Peru - - - 212 1 �01 Saint Vincent and the Grenadines - 52 1 - -
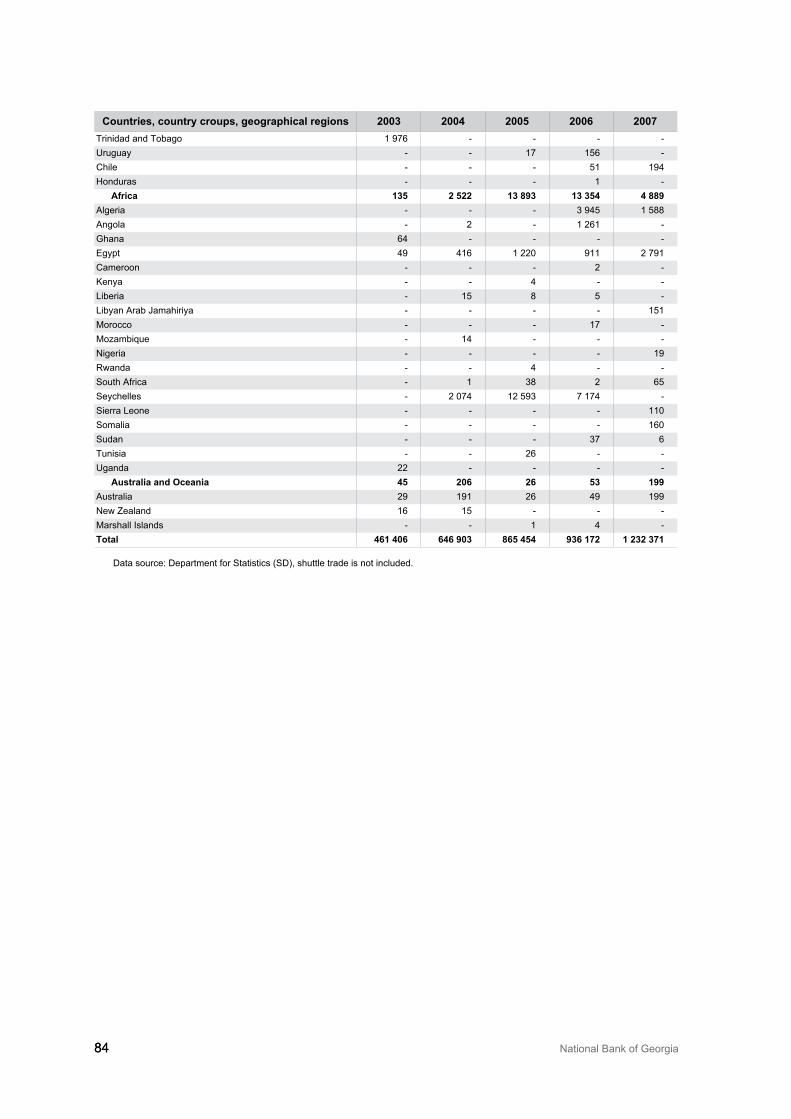
84 National Bank of Georgia84
countries, country croups, geographical regions 2003 2004 2005 2006 2007Trinidad and Tobago 1 976 - - - - Uruguay - - 17 156 - Chile - - - 51 194 Honduras - - - 1 -
africa 135 2 522 13 893 13 354 4 889 Algeria - - - � 945 1 588 Angola - 2 - 1 261 - Ghana 64 - - - - Egypt 49 416 1 220 911 2 791 Cameroon - - - 2 - Kenya - - 4 - - Liberia - 15 8 5 - Libyan Arab Jamahiriya - - - - 151 Morocco - - - 17 - Mozambique - 14 - - - Nigeria - - - - 19 Rwanda - - 4 - - South Africa - 1 �8 2 65 Seychelles - 2 074 12 59� 7 174 - Sierra Leone - - - - 110 Somalia - - - - 160 Sudan - - - �7 6 Tunisia - - 26 - - Uganda 22 - - - -
australia and oceania 45 206 26 53 199 Australia 29 191 26 49 199 New Zealand 16 15 - - - Marshall Islands - - 1 4 -total 461 406 646 903 865 454 936 172 1 232 371
Data source: Department for Statistics (SD), shuttle trade is not included.
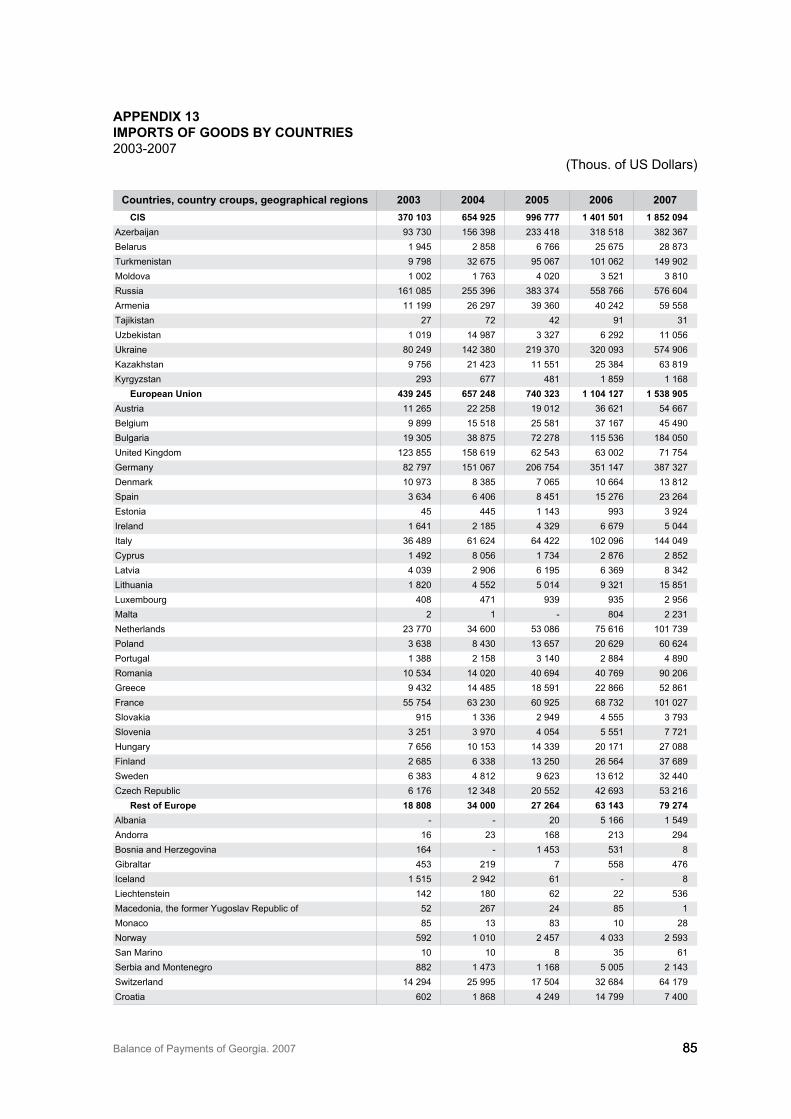
Balance of Payments of Georgia. 2007 8585
appeNdix 13imports of Goods By coUNtries200�-2007
(Thous. of US Dollars)
countries, country croups, geographical regions 2003 2004 2005 2006 2007cis 370 103 654 925 996 777 1 401 501 1 852 094
Azerbaijan 9� 7�0 156 �98 2�� 418 �18 518 �82 �67Belarus 1 945 2 858 6 766 25 675 28 87�Turkmenistan 9 798 �2 675 95 067 101 062 149 902Moldova 1 002 1 76� 4 020 � 521 � 810Russia 161 085 255 �96 �8� �74 558 766 576 604Armenia 11 199 26 297 �9 �60 40 242 59 558Tajikistan 27 72 42 91 �1Uzbekistan 1 019 14 987 � �27 6 292 11 056 Ukraine 80 249 142 �80 219 �70 �20 09� 574 906 Kazakhstan 9 756 21 42� 11 551 25 �84 6� 819 Kyrgyzstan 29� 677 481 1 859 1 168
european Union 439 245 657 248 740 323 1 104 127 1 538 905Austria 11 265 22 258 19 012 �6 621 54 667Belgium 9 899 15 518 25 581 �7 167 45 490Bulgaria 19 �05 �8 875 72 278 115 5�6 184 050United Kingdom 12� 855 158 619 62 54� 6� 002 71 754 Germany 82 797 151 067 206 754 �51 147 �87 �27 Denmark 10 97� 8 �85 7 065 10 664 1� 812 Spain � 6�4 6 406 8 451 15 276 2� 264 Estonia 45 445 1 14� 99� � 924 Ireland 1 641 2 185 4 �29 6 679 5 044 Italy �6 489 61 624 64 422 102 096 144 049 Cyprus 1 492 8 056 1 7�4 2 876 2 852 Latvia 4 0�9 2 906 6 195 6 �69 8 �42 Lithuania 1 820 4 552 5 014 9 �21 15 851 Luxembourg 408 471 9�9 9�5 2 956 Malta 2 1 - 804 2 2�1 Netherlands 2� 770 �4 600 5� 086 75 616 101 7�9 Poland � 6�8 8 4�0 1� 657 20 629 60 624 Portugal 1 �88 2 158 � 140 2 884 4 890 Romania 10 5�4 14 020 40 694 40 769 90 206 Greece 9 4�2 14 485 18 591 22 866 52 861 France 55 754 6� 2�0 60 925 68 7�2 101 027 Slovakia 915 1 ��6 2 949 4 555 � 79� Slovenia � 251 � 970 4 054 5 551 7 721 Hungary 7 656 10 15� 14 ��9 20 171 27 088 Finland 2 685 6 ��8 1� 250 26 564 �7 689 Sweden 6 �8� 4 812 9 62� 1� 612 �2 440 Czech Republic 6 176 12 �48 20 552 42 69� 5� 216
rest of europe 18 808 34 000 27 264 63 143 79 274 Albania - - 20 5 166 1 549 Andorra 16 2� 168 21� 294 Bosnia and Herzegovina 164 - 1 45� 5�1 8 Gibraltar 45� 219 7 558 476 Iceland 1 515 2 942 61 - 8 Liechtenstein 142 180 62 22 5�6 Macedonia, the former Yugoslav Republic of 52 267 24 85 1 Monaco 85 1� 8� 10 28 Norway 592 1 010 2 457 4 0�� 2 59� San Marino 10 10 8 �5 61 Serbia and Montenegro 882 1 47� 1 168 5 005 2 14� Switzerland 14 294 25 995 17 504 �2 684 64 179 Croatia 602 1 868 4 249 14 799 7 400
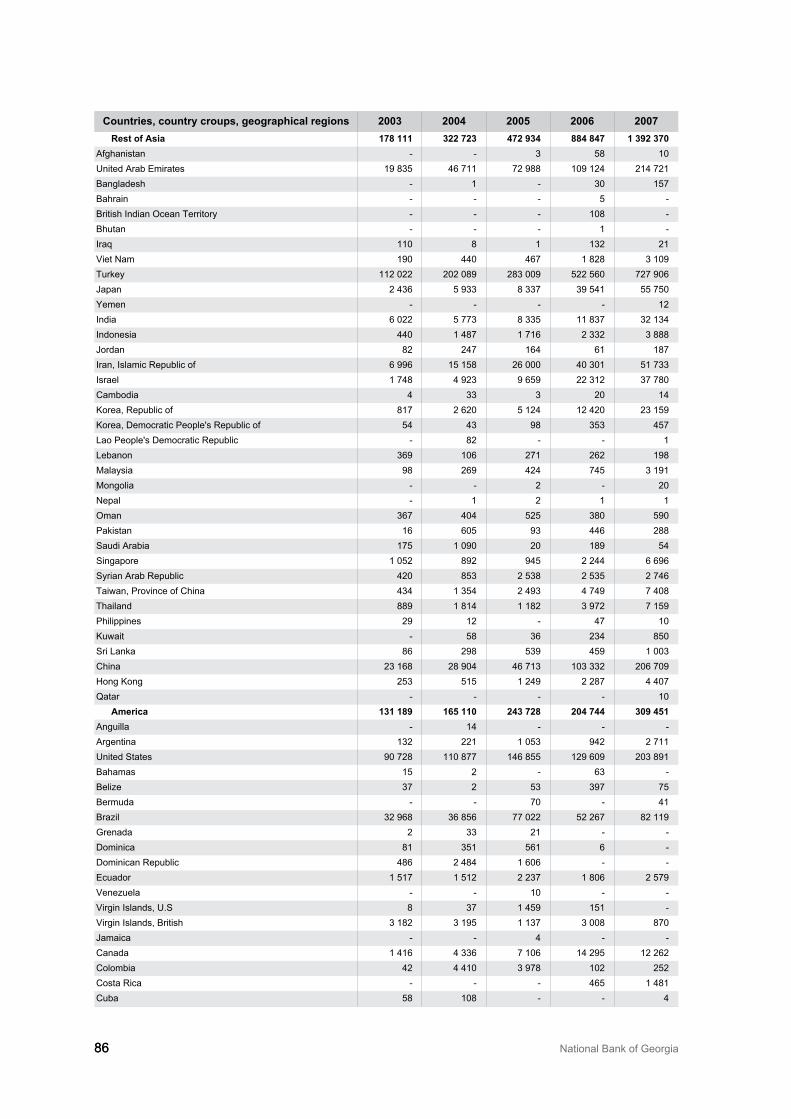
86 National Bank of Georgia86
countries, country croups, geographical regions 2003 2004 2005 2006 2007rest of asia 178 111 322 723 472 934 884 847 1 392 370
Afghanistan - - � 58 10 United Arab Emirates 19 8�5 46 711 72 988 109 124 214 721 Bangladesh - 1 - �0 157 Bahrain - - - 5 - British Indian Ocean Territory - - - 108 - Bhutan - - - 1 - Iraq 110 8 1 1�2 21 Viet Nam 190 440 467 1 828 � 109 Turkey 112 022 202 089 28� 009 522 560 727 906 Japan 2 4�6 5 9�� 8 ��7 �9 541 55 750 Yemen - - - - 12 India 6 022 5 77� 8 ��5 11 8�7 �2 1�4 Indonesia 440 1 487 1 716 2 ��2 � 888 Jordan 82 247 164 61 187 Iran, Islamic Republic of 6 996 15 158 26 000 40 �01 51 7�� Israel 1 748 4 92� 9 659 22 �12 �7 780 Cambodia 4 �� � 20 14 Korea, Republic of 817 2 620 5 124 12 420 2� 159 Korea, Democratic People's Republic of 54 4� 98 �5� 457 Lao People's Democratic Republic - 82 - - 1 Lebanon �69 106 271 262 198 Malaysia 98 269 424 745 � 191 Mongolia - - 2 - 20 Nepal - 1 2 1 1 Oman �67 404 525 �80 590 Pakistan 16 605 9� 446 288 Saudi Arabia 175 1 090 20 189 54 Singapore 1 052 892 945 2 244 6 696 Syrian Arab Republic 420 85� 2 5�8 2 5�5 2 746 Taiwan, Province of China 4�4 1 �54 2 49� 4 749 7 408 Thailand 889 1 814 1 182 � 972 7 159 Philippines 29 12 - 47 10 Kuwait - 58 �6 2�4 850 Sri Lanka 86 298 5�9 459 1 00� China 2� 168 28 904 46 71� 10� ��2 206 709 Hong Kong 25� 515 1 249 2 287 4 407 Qatar - - - - 10
america 131 189 165 110 243 728 204 744 309 451 Anguilla - 14 - - - Argentina 1�2 221 1 05� 942 2 711 United States 90 728 110 877 146 855 129 609 20� 891 Bahamas 15 2 - 6� - Belize �7 2 5� �97 75 Bermuda - - 70 - 41 Brazil �2 968 �6 856 77 022 52 267 82 119 Grenada 2 �� 21 - - Dominica 81 �51 561 6 - Dominican Republic 486 2 484 1 606 - - Ecuador 1 517 1 512 2 2�7 1 806 2 579 Venezuela - - 10 - - Virgin Islands, U.S 8 �7 1 459 151 - Virgin Islands, British � 182 � 195 1 1�7 � 008 870 Jamaica - - 4 - - Canada 1 416 4 ��6 7 106 14 295 12 262 Colombia 42 4 410 � 978 102 252 Costa Rica - - - 465 1 481 Cuba 58 108 - - 4
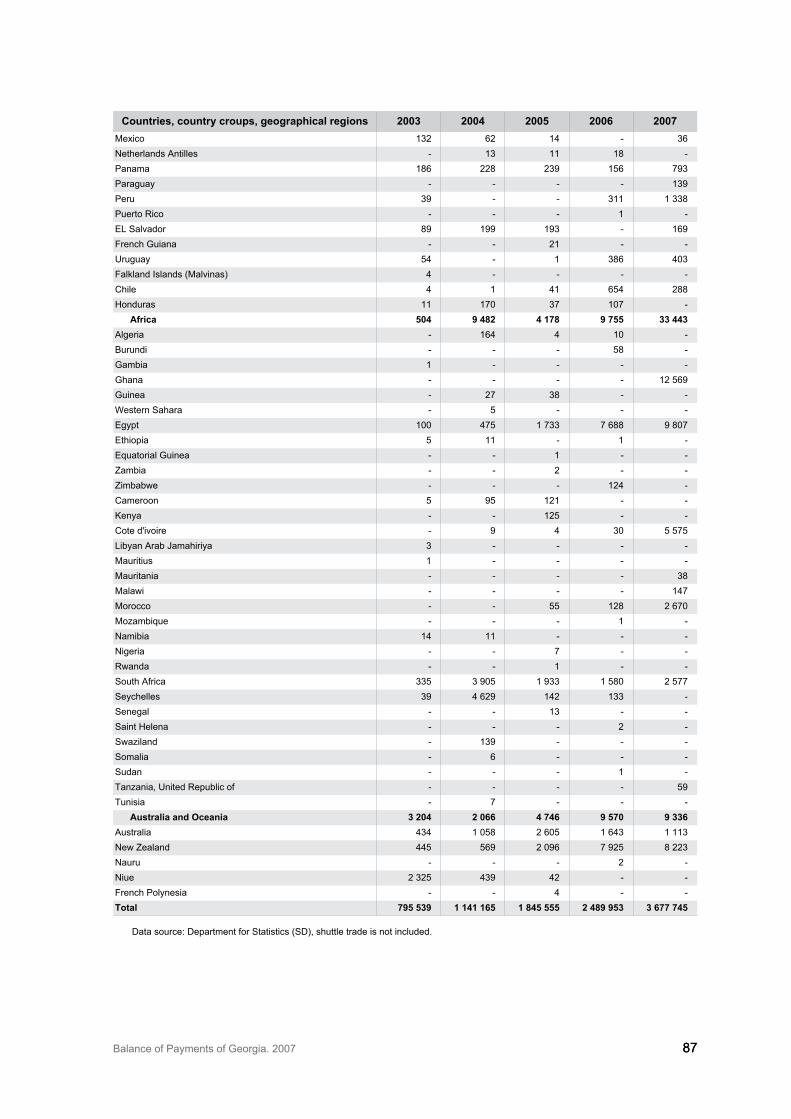
Balance of Payments of Georgia. 2007 8787
countries, country croups, geographical regions 2003 2004 2005 2006 2007Mexico 1�2 62 14 - �6 Netherlands Antilles - 1� 11 18 - Panama 186 228 2�9 156 79� Paraguay - - - - 1�9 Peru �9 - - �11 1 ��8 Puerto Rico - - - 1 - EL Salvador 89 199 19� - 169 French Guiana - - 21 - - Uruguay 54 - 1 �86 40� Falkland Islands (Malvinas) 4 - - - - Chile 4 1 41 654 288 Honduras 11 170 �7 107 -
africa 504 9 482 4 178 9 755 33 443 Algeria - 164 4 10 -Burundi - - - 58 -Gambia 1 - - - -Ghana - - - - 12 569 Guinea - 27 �8 - -Western Sahara - 5 - - -Egypt 100 475 1 7�� 7 688 9 807 Ethiopia 5 11 - 1 -Equatorial Guinea - - 1 - -Zambia - - 2 - -Zimbabwe - - - 124 -Cameroon 5 95 121 - -Kenya - - 125 - -Cote d'ivoire - 9 4 �0 5 575 Libyan Arab Jamahiriya � - - - -Mauritius 1 - - - -Mauritania - - - - �8 Malawi - - - - 147 Morocco - - 55 128 2 670 Mozambique - - - 1 -Namibia 14 11 - - -Nigeria - - 7 - -Rwanda - - 1 - -South Africa ��5 � 905 1 9�� 1 580 2 577 Seychelles �9 4 629 142 1�� -Senegal - - 1� - -Saint Helena - - - 2 -Swaziland - 1�9 - - -Somalia - 6 - - -Sudan - - - 1 -Tanzania, United Republic of - - - - 59 Tunisia - 7 - - -
australia and oceania 3 204 2 066 4 746 9 570 9 336 Australia 4�4 1 058 2 605 1 64� 1 11� New Zealand 445 569 2 096 7 925 8 22� Nauru - - - 2 -Niue 2 �25 4�9 42 - -French Polynesia - - 4 - -total 795 539 1 141 165 1 845 555 2 489 953 3 677 745
Data source: Department for Statistics (SD), shuttle trade is not included.
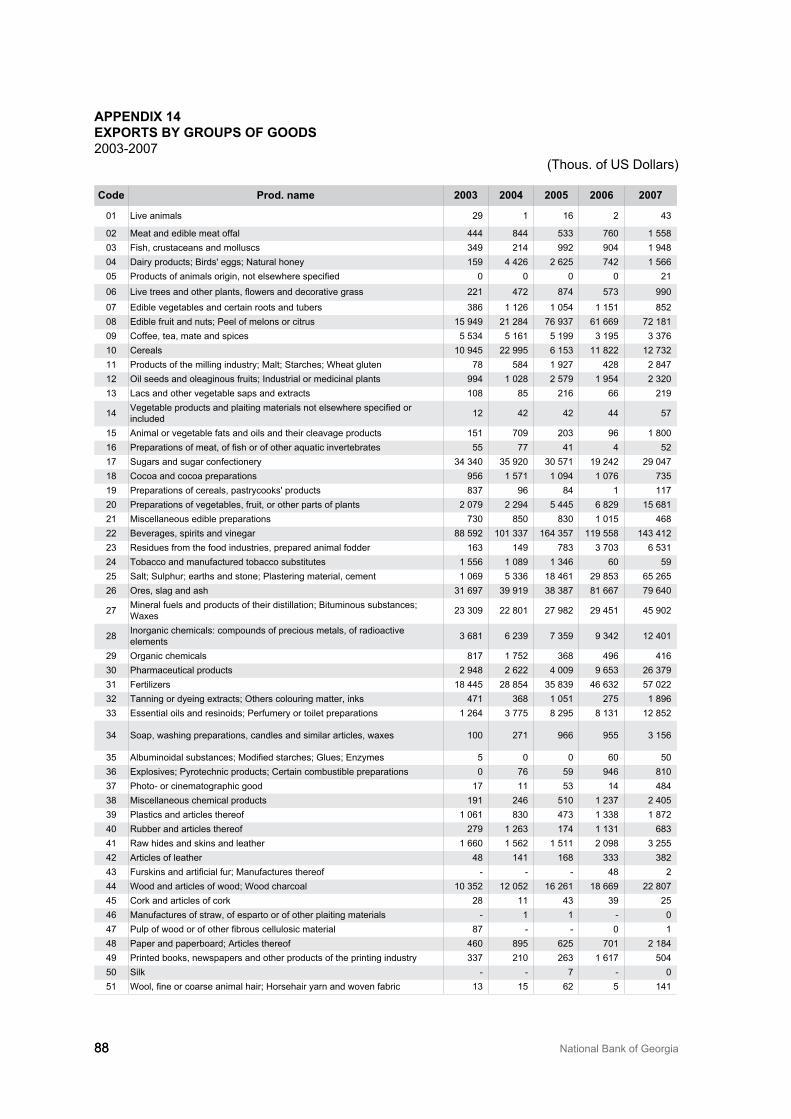
88 National Bank of Georgia88
appeNdix 14exports By GroUps of Goods200�-2007
(Thous. of US Dollars)
code prod. name 2003 2004 2005 2006 2007
01 Live animals 29 1 16 2 4�
02 Meat and edible meat offal 444 844 5�� 760 1 5580� Fish, crustaceans and molluscs �49 214 992 904 1 94804 Dairy products; Birds' eggs; Natural honey 159 4 426 2 625 742 1 56605 Products of animals origin, not elsewhere specified 0 0 0 0 21
06 Live trees and other plants, flowers and decorative grass 221 472 874 57� 990
07 Edible vegetables and certain roots and tubers �86 1 126 1 054 1 151 85208 Edible fruit and nuts; Peel of melons or citrus 15 949 21 284 76 9�7 61 669 72 18109 Coffee, tea, mate and spices 5 5�4 5 161 5 199 � 195 � �7610 Cereals 10 945 22 995 6 15� 11 822 12 7�211 Products of the milling industry; Malt; Starches; Wheat gluten 78 584 1 927 428 2 84712 Oil seeds and oleaginous fruits; Industrial or medicinal plants 994 1 028 2 579 1 954 2 �201� Lacs and other vegetable saps and extracts 108 85 216 66 219
14 Vegetable products and plaiting materials not elsewhere specified or included 12 42 42 44 57
15 Animal or vegetable fats and oils and their cleavage products 151 709 20� 96 1 80016 Preparations of meat, of fish or of other aquatic invertebrates 55 77 41 4 5217 Sugars and sugar confectionery �4 �40 �5 920 �0 571 19 242 29 04718 Cocoa and cocoa preparations 956 1 571 1 094 1 076 7�519 Preparations of cereals, pastrycooks' products 8�7 96 84 1 11720 Preparations of vegetables, fruit, or other parts of plants 2 079 2 294 5 445 6 829 15 68121 Miscellaneous edible preparations 7�0 850 8�0 1 015 46822 Beverages, spirits and vinegar 88 592 101 ��7 164 �57 119 558 14� 4122� Residues from the food industries, prepared animal fodder 16� 149 78� � 70� 6 5�124 Tobacco and manufactured tobacco substitutes 1 556 1 089 1 �46 60 5925 Salt; Sulphur; earths and stone; Plastering material, cement 1 069 5 ��6 18 461 29 85� 65 26526 Ores, slag and ash �1 697 �9 919 �8 �87 81 667 79 640
27 Mineral fuels and products of their distillation; Bituminous substances; Waxes 2� �09 22 801 27 982 29 451 45 902
28 Inorganic chemicals: compounds of precious metals, of radioactive elements � 681 6 2�9 7 �59 9 �42 12 401
29 Organic chemicals 817 1 752 �68 496 416�0 Pharmaceutical products 2 948 2 622 4 009 9 65� 26 �79�1 Fertilizers 18 445 28 854 �5 8�9 46 6�2 57 022�2 Tanning or dyeing extracts; Others colouring matter, inks 471 �68 1 051 275 1 896�� Essential oils and resinoids; Perfumery or toilet preparations 1 264 � 775 8 295 8 1�1 12 852
�4 Soap, washing preparations, candles and similar articles, waxes 100 271 966 955 � 156
�5 Albuminoidal substances; Modified starches; Glues; Enzymes 5 0 0 60 50�6 Explosives; Pyrotechnic products; Certain combustible preparations 0 76 59 946 810�7 Photo- or cinematographic good 17 11 5� 14 484�8 Miscellaneous chemical products 191 246 510 1 2�7 2 405�9 Plastics and articles thereof 1 061 8�0 47� 1 ��8 1 87240 Rubber and articles thereof 279 1 26� 174 1 1�1 68�41 Raw hides and skins and leather 1 660 1 562 1 511 2 098 � 25542 Articles of leather 48 141 168 ��� �824� Furskins and artificial fur; Manufactures thereof - - - 48 244 Wood and articles of wood; Wood charcoal 10 �52 12 052 16 261 18 669 22 80745 Cork and articles of cork 28 11 4� �9 2546 Manufactures of straw, of esparto or of other plaiting materials - 1 1 - 047 Pulp of wood or of other fibrous cellulosic material 87 - - 0 148 Paper and paperboard; Articles thereof 460 895 625 701 2 18449 Printed books, newspapers and other products of the printing industry ��7 210 26� 1 617 50450 Silk - - 7 - 051 Wool, fine or coarse animal hair; Horsehair yarn and woven fabric 1� 15 62 5 141
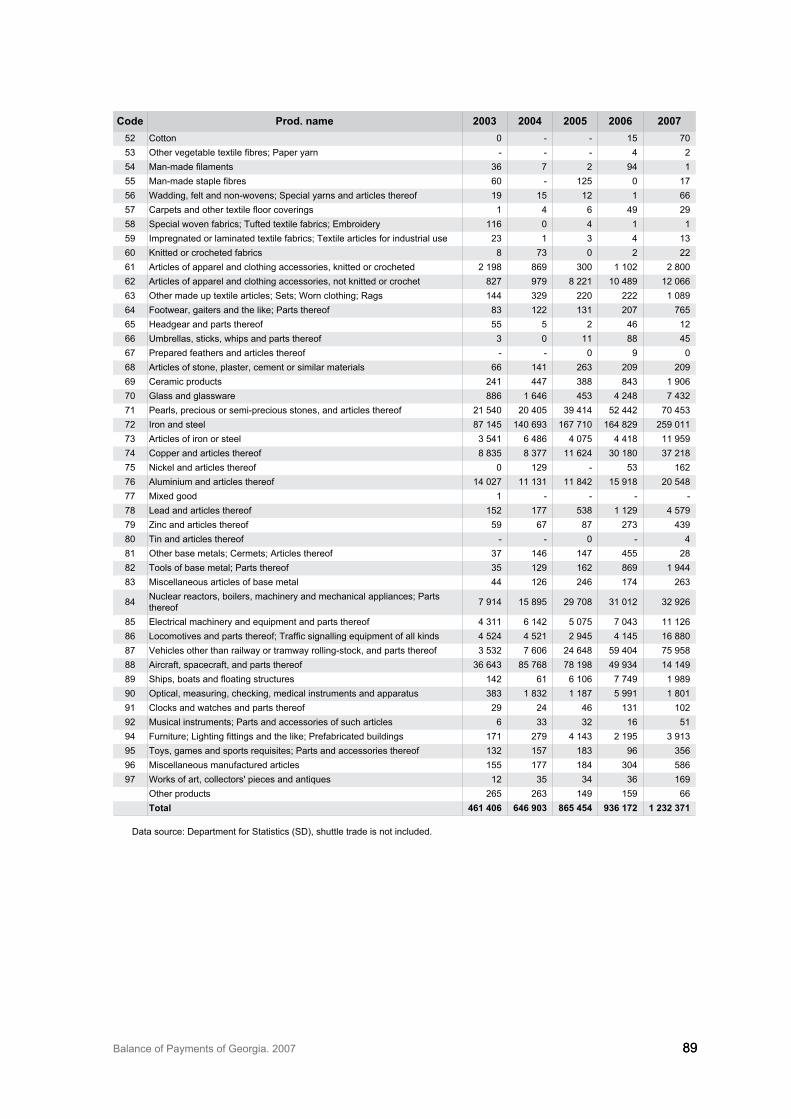
Balance of Payments of Georgia. 2007 8989
code prod. name 2003 2004 2005 2006 200752 Cotton 0 - - 15 705� Other vegetable textile fibres; Paper yarn - - - 4 254 Manmade filaments �6 7 2 94 155 Manmade staple fibres 60 - 125 0 1756 Wadding, felt and non-wovens; Special yarns and articles thereof 19 15 12 1 6657 Carpets and other textile floor coverings 1 4 6 49 2958 Special woven fabrics; Tufted textile fabrics; Embroidery 116 0 4 1 159 Impregnated or laminated textile fabrics; Textile articles for industrial use 2� 1 � 4 1�60 Knitted or crocheted fabrics 8 7� 0 2 2261 Articles of apparel and clothing accessories, knitted or crocheted 2 198 869 �00 1 102 2 80062 Articles of apparel and clothing accessories, not knitted or crochet 827 979 8 221 10 489 12 0666� Other made up textile articles; Sets; Worn clothing; Rags 144 �29 220 222 1 08964 Footwear, gaiters and the like; Parts thereof 8� 122 1�1 207 76565 Headgear and parts thereof 55 5 2 46 1266 Umbrellas, sticks, whips and parts thereof � 0 11 88 4567 Prepared feathers and articles thereof - - 0 9 068 Articles of stone, plaster, cement or similar materials 66 141 26� 209 20969 Ceramic products 241 447 �88 84� 1 90670 Glass and glassware 886 1 646 45� 4 248 7 4�271 Pearls, precious or semi-precious stones, and articles thereof 21 540 20 405 �9 414 52 442 70 45�72 Iron and steel 87 145 140 69� 167 710 164 829 259 0117� Articles of iron or steel � 541 6 486 4 075 4 418 11 95974 Copper and articles thereof 8 8�5 8 �77 11 624 �0 180 �7 21875 Nickel and articles thereof 0 129 - 5� 16276 Aluminium and articles thereof 14 027 11 1�1 11 842 15 918 20 54877 Mixed good 1 - - - -78 Lead and articles thereof 152 177 5�8 1 129 4 57979 Zinc and articles thereof 59 67 87 27� 4�980 Tin and articles thereof - - 0 - 481 Other base metals; Cermets; Articles thereof �7 146 147 455 2882 Tools of base metal; Parts thereof �5 129 162 869 1 9448� Miscellaneous articles of base metal 44 126 246 174 26�
84 Nuclear reactors, boilers, machinery and mechanical appliances; Parts thereof 7 914 15 895 29 708 �1 012 �2 926
85 Electrical machinery and equipment and parts thereof 4 �11 6 142 5 075 7 04� 11 12686 Locomotives and parts thereof; Traffic signalling equipment of all kinds 4 524 4 521 2 945 4 145 16 88087 Vehicles other than railway or tramway rolling-stock, and parts thereof � 5�2 7 606 24 648 59 404 75 95888 Aircraft, spacecraft, and parts thereof �6 64� 85 768 78 198 49 9�4 14 14989 Ships, boats and floating structures 142 61 6 106 7 749 1 98990 Optical, measuring, checking, medical instruments and apparatus �8� 1 8�2 1 187 5 991 1 80191 Clocks and watches and parts thereof 29 24 46 1�1 10292 Musical instruments; Parts and accessories of such articles 6 �� �2 16 5194 Furniture; Lighting fittings and the like; Prefabricated buildings 171 279 4 14� 2 195 � 91�95 Toys, games and sports requisites; Parts and accessories thereof 1�2 157 18� 96 �5696 Miscellaneous manufactured articles 155 177 184 �04 58697 Works of art, collectors' pieces and antiques 12 �5 �4 �6 169
Other products 265 26� 149 159 66total 461 406 646 903 865 454 936 172 1 232 371
Data source: Department for Statistics (SD), shuttle trade is not included.
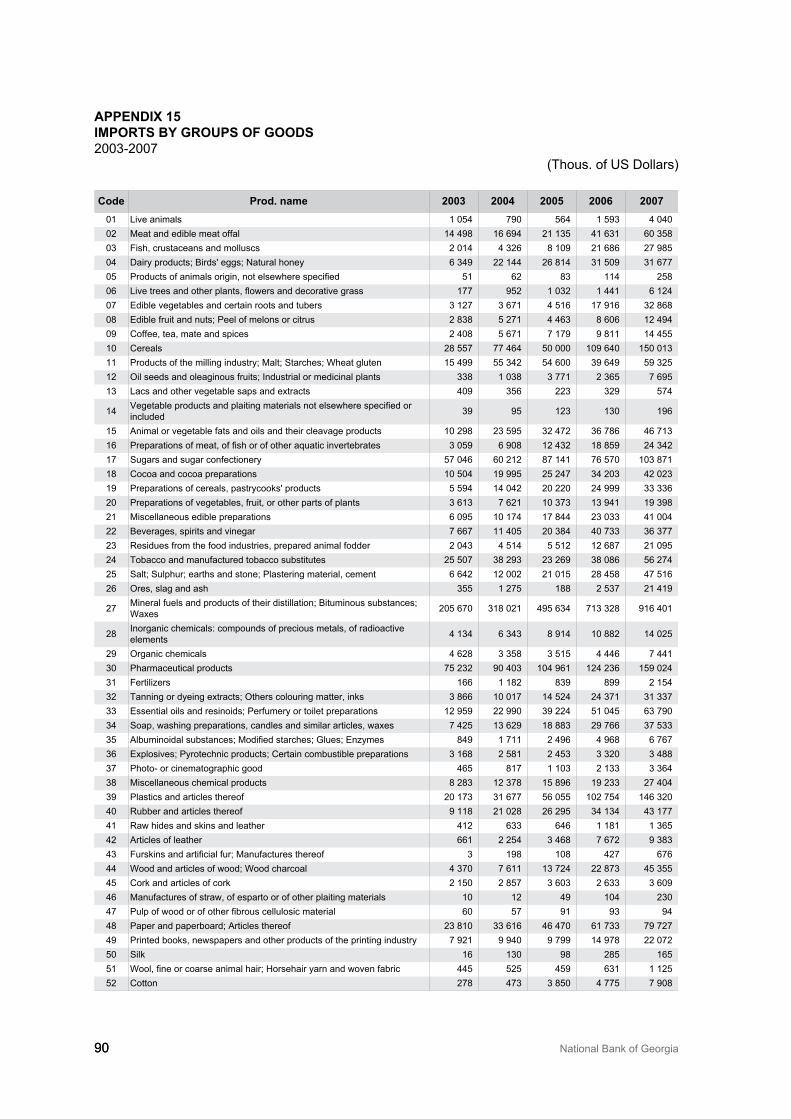
90 National Bank of Georgia90
appeNdix 15imports By GroUps of Goods200�-2007
(Thous. of US Dollars)
code prod. name 2003 2004 2005 2006 200701 Live animals 1 054 790 564 1 59� 4 04002 Meat and edible meat offal 14 498 16 694 21 1�5 41 6�1 60 �580� Fish, crustaceans and molluscs 2 014 4 �26 8 109 21 686 27 98504 Dairy products; Birds' eggs; Natural honey 6 �49 22 144 26 814 �1 509 �1 67705 Products of animals origin, not elsewhere specified 51 62 8� 114 25806 Live trees and other plants, flowers and decorative grass 177 952 1 0�2 1 441 6 12407 Edible vegetables and certain roots and tubers � 127 � 671 4 516 17 916 �2 86808 Edible fruit and nuts; Peel of melons or citrus 2 8�8 5 271 4 46� 8 606 12 49409 Coffee, tea, mate and spices 2 408 5 671 7 179 9 811 14 45510 Cereals 28 557 77 464 50 000 109 640 150 01�11 Products of the milling industry; Malt; Starches; Wheat gluten 15 499 55 �42 54 600 �9 649 59 �2512 Oil seeds and oleaginous fruits; Industrial or medicinal plants ��8 1 0�8 � 771 2 �65 7 6951� Lacs and other vegetable saps and extracts 409 �56 22� �29 574
14 Vegetable products and plaiting materials not elsewhere specified or included �9 95 12� 1�0 196
15 Animal or vegetable fats and oils and their cleavage products 10 298 2� 595 �2 472 �6 786 46 71�16 Preparations of meat, of fish or of other aquatic invertebrates � 059 6 908 12 4�2 18 859 24 �4217 Sugars and sugar confectionery 57 046 60 212 87 141 76 570 10� 87118 Cocoa and cocoa preparations 10 504 19 995 25 247 �4 20� 42 02�19 Preparations of cereals, pastrycooks' products 5 594 14 042 20 220 24 999 �� ��620 Preparations of vegetables, fruit, or other parts of plants � 61� 7 621 10 �7� 1� 941 19 �9821 Miscellaneous edible preparations 6 095 10 174 17 844 2� 0�� 41 00422 Beverages, spirits and vinegar 7 667 11 405 20 �84 40 7�� �6 �772� Residues from the food industries, prepared animal fodder 2 04� 4 514 5 512 12 687 21 09524 Tobacco and manufactured tobacco substitutes 25 507 �8 29� 2� 269 �8 086 56 27425 Salt; Sulphur; earths and stone; Plastering material, cement 6 642 12 002 21 015 28 458 47 51626 Ores, slag and ash �55 1 275 188 2 5�7 21 419
27 Mineral fuels and products of their distillation; Bituminous substances; Waxes 205 670 �18 021 495 6�4 71� �28 916 401
28 Inorganic chemicals: compounds of precious metals, of radioactive elements 4 1�4 6 �4� 8 914 10 882 14 025
29 Organic chemicals 4 628 � �58 � 515 4 446 7 441�0 Pharmaceutical products 75 2�2 90 40� 104 961 124 2�6 159 024�1 Fertilizers 166 1 182 8�9 899 2 154�2 Tanning or dyeing extracts; Others colouring matter, inks � 866 10 017 14 524 24 �71 �1 ��7�� Essential oils and resinoids; Perfumery or toilet preparations 12 959 22 990 �9 224 51 045 6� 790�4 Soap, washing preparations, candles and similar articles, waxes 7 425 1� 629 18 88� 29 766 �7 5���5 Albuminoidal substances; Modified starches; Glues; Enzymes 849 1 711 2 496 4 968 6 767�6 Explosives; Pyrotechnic products; Certain combustible preparations � 168 2 581 2 45� � �20 � 488�7 Photo- or cinematographic good 465 817 1 10� 2 1�� � �64�8 Miscellaneous chemical products 8 28� 12 �78 15 896 19 2�� 27 404�9 Plastics and articles thereof 20 17� �1 677 56 055 102 754 146 �2040 Rubber and articles thereof 9 118 21 028 26 295 �4 1�4 4� 17741 Raw hides and skins and leather 412 6�� 646 1 181 1 �6542 Articles of leather 661 2 254 � 468 7 672 9 �8�4� Furskins and artificial fur; Manufactures thereof � 198 108 427 67644 Wood and articles of wood; Wood charcoal 4 �70 7 611 1� 724 22 87� 45 �5545 Cork and articles of cork 2 150 2 857 � 60� 2 6�� � 60946 Manufactures of straw, of esparto or of other plaiting materials 10 12 49 104 2�047 Pulp of wood or of other fibrous cellulosic material 60 57 91 9� 9448 Paper and paperboard; Articles thereof 2� 810 �� 616 46 470 61 7�� 79 72749 Printed books, newspapers and other products of the printing industry 7 921 9 940 9 799 14 978 22 07250 Silk 16 1�0 98 285 16551 Wool, fine or coarse animal hair; Horsehair yarn and woven fabric 445 525 459 6�1 1 12552 Cotton 278 47� � 850 4 775 7 908
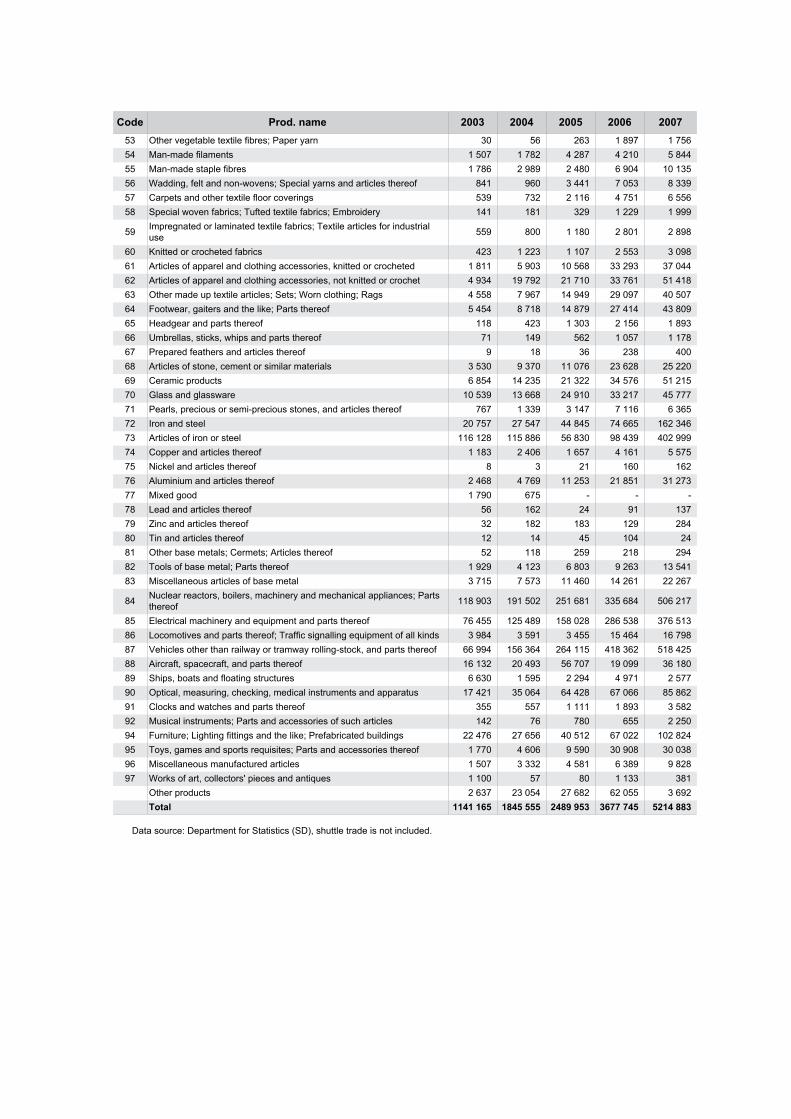
code prod. name 2003 2004 2005 2006 20075� Other vegetable textile fibres; Paper yarn �0 56 26� 1 897 1 75654 Manmade filaments 1 507 1 782 4 287 4 210 5 84455 Manmade staple fibres 1 786 2 989 2 480 6 904 10 1�556 Wadding, felt and non-wovens; Special yarns and articles thereof 841 960 � 441 7 05� 8 ��957 Carpets and other textile floor coverings 5�9 7�2 2 116 4 751 6 55658 Special woven fabrics; Tufted textile fabrics; Embroidery 141 181 �29 1 229 1 999
59 Impregnated or laminated textile fabrics; Textile articles for industrial use 559 800 1 180 2 801 2 898
60 Knitted or crocheted fabrics 42� 1 22� 1 107 2 55� � 09861 Articles of apparel and clothing accessories, knitted or crocheted 1 811 5 90� 10 568 �� 29� �7 04462 Articles of apparel and clothing accessories, not knitted or crochet 4 9�4 19 792 21 710 �� 761 51 4186� Other made up textile articles; Sets; Worn clothing; Rags 4 558 7 967 14 949 29 097 40 50764 Footwear, gaiters and the like; Parts thereof 5 454 8 718 14 879 27 414 4� 80965 Headgear and parts thereof 118 42� 1 �0� 2 156 1 89�66 Umbrellas, sticks, whips and parts thereof 71 149 562 1 057 1 17867 Prepared feathers and articles thereof 9 18 �6 2�8 40068 Articles of stone, cement or similar materials � 5�0 9 �70 11 076 2� 628 25 22069 Ceramic products 6 854 14 2�5 21 �22 �4 576 51 21570 Glass and glassware 10 5�9 1� 668 24 910 �� 217 45 77771 Pearls, precious or semi-precious stones, and articles thereof 767 1 ��9 � 147 7 116 6 �6572 Iron and steel 20 757 27 547 44 845 74 665 162 �467� Articles of iron or steel 116 128 115 886 56 8�0 98 4�9 402 99974 Copper and articles thereof 1 18� 2 406 1 657 4 161 5 57575 Nickel and articles thereof 8 � 21 160 16276 Aluminium and articles thereof 2 468 4 769 11 25� 21 851 �1 27�77 Mixed good 1 790 675 - - - 78 Lead and articles thereof 56 162 24 91 1�779 Zinc and articles thereof �2 182 18� 129 28480 Tin and articles thereof 12 14 45 104 2481 Other base metals; Cermets; Articles thereof 52 118 259 218 29482 Tools of base metal; Parts thereof 1 929 4 12� 6 80� 9 26� 1� 5418� Miscellaneous articles of base metal � 715 7 57� 11 460 14 261 22 267
84 Nuclear reactors, boilers, machinery and mechanical appliances; Parts thereof 118 90� 191 502 251 681 ��5 684 506 217
85 Electrical machinery and equipment and parts thereof 76 455 125 489 158 028 286 5�8 �76 51�86 Locomotives and parts thereof; Traffic signalling equipment of all kinds � 984 � 591 � 455 15 464 16 79887 Vehicles other than railway or tramway rolling-stock, and parts thereof 66 994 156 �64 264 115 418 �62 518 42588 Aircraft, spacecraft, and parts thereof 16 1�2 20 49� 56 707 19 099 �6 18089 Ships, boats and floating structures 6 6�0 1 595 2 294 4 971 2 57790 Optical, measuring, checking, medical instruments and apparatus 17 421 �5 064 64 428 67 066 85 86291 Clocks and watches and parts thereof �55 557 1 111 1 89� � 58292 Musical instruments; Parts and accessories of such articles 142 76 780 655 2 25094 Furniture; Lighting fittings and the like; Prefabricated buildings 22 476 27 656 40 512 67 022 102 82495 Toys, games and sports requisites; Parts and accessories thereof 1 770 4 606 9 590 �0 908 �0 0�896 Miscellaneous manufactured articles 1 507 � ��2 4 581 6 �89 9 82897 Works of art, collectors' pieces and antiques 1 100 57 80 1 1�� �81
Other products 2 6�7 2� 054 27 682 62 055 � 692 total 1141 165 1845 555 2489 953 3677 745 5214 883
Data source: Department for Statistics (SD), shuttle trade is not included.
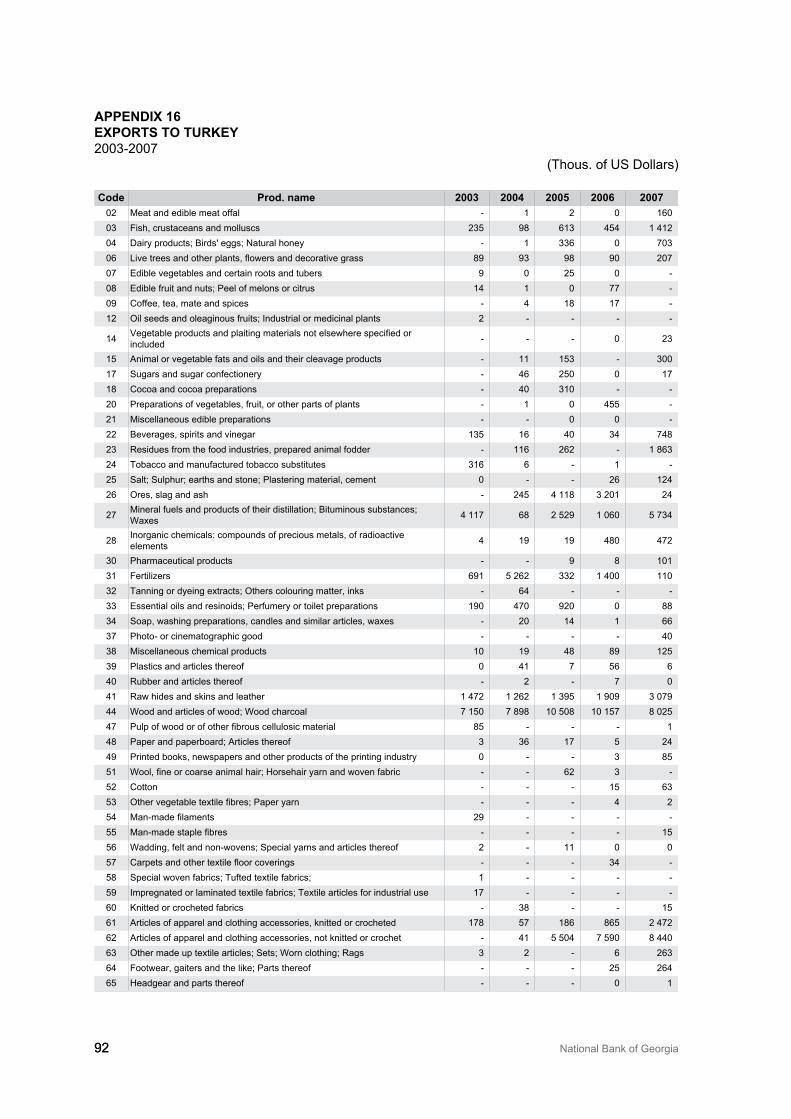
92 National Bank of Georgia92
appeNdix 16exports to tUrkey200�-2007
(Thous. of US Dollars)
code prod. name 2003 2004 2005 2006 200702 Meat and edible meat offal - 1 2 0 1600� Fish, crustaceans and molluscs 2�5 98 61� 454 1 41204 Dairy products; Birds' eggs; Natural honey - 1 ��6 0 70�06 Live trees and other plants, flowers and decorative grass 89 9� 98 90 20707 Edible vegetables and certain roots and tubers 9 0 25 0 -08 Edible fruit and nuts; Peel of melons or citrus 14 1 0 77 -09 Coffee, tea, mate and spices - 4 18 17 -12 Oil seeds and oleaginous fruits; Industrial or medicinal plants 2 - - - -
14 Vegetable products and plaiting materials not elsewhere specified or included - - - 0 2�
15 Animal or vegetable fats and oils and their cleavage products - 11 15� - �0017 Sugars and sugar confectionery - 46 250 0 1718 Cocoa and cocoa preparations - 40 �10 - -20 Preparations of vegetables, fruit, or other parts of plants - 1 0 455 -21 Miscellaneous edible preparations - - 0 0 -22 Beverages, spirits and vinegar 1�5 16 40 �4 7482� Residues from the food industries, prepared animal fodder - 116 262 - 1 86�24 Tobacco and manufactured tobacco substitutes �16 6 - 1 -25 Salt; Sulphur; earths and stone; Plastering material, cement 0 - - 26 12426 Ores, slag and ash - 245 4 118 � 201 24
27 Mineral fuels and products of their distillation; Bituminous substances; Waxes 4 117 68 2 529 1 060 5 7�4
28 Inorganic chemicals: compounds of precious metals, of radioactive elements 4 19 19 480 472
�0 Pharmaceutical products - - 9 8 101�1 Fertilizers 691 5 262 ��2 1 400 110�2 Tanning or dyeing extracts; Others colouring matter, inks - 64 - - -�� Essential oils and resinoids; Perfumery or toilet preparations 190 470 920 0 88�4 Soap, washing preparations, candles and similar articles, waxes - 20 14 1 66�7 Photo- or cinematographic good - - - - 40�8 Miscellaneous chemical products 10 19 48 89 125�9 Plastics and articles thereof 0 41 7 56 640 Rubber and articles thereof - 2 - 7 041 Raw hides and skins and leather 1 472 1 262 1 �95 1 909 � 07944 Wood and articles of wood; Wood charcoal 7 150 7 898 10 508 10 157 8 02547 Pulp of wood or of other fibrous cellulosic material 85 - - - 148 Paper and paperboard; Articles thereof � �6 17 5 2449 Printed books, newspapers and other products of the printing industry 0 - - � 8551 Wool, fine or coarse animal hair; Horsehair yarn and woven fabric - - 62 � -52 Cotton - - - 15 6�5� Other vegetable textile fibres; Paper yarn - - - 4 254 Manmade filaments 29 - - - -55 Manmade staple fibres - - - - 1556 Wadding, felt and non-wovens; Special yarns and articles thereof 2 - 11 0 057 Carpets and other textile floor coverings - - - �4 -58 Special woven fabrics; Tufted textile fabrics; 1 - - - -59 Impregnated or laminated textile fabrics; Textile articles for industrial use 17 - - - -60 Knitted or crocheted fabrics - �8 - - 1561 Articles of apparel and clothing accessories, knitted or crocheted 178 57 186 865 2 47262 Articles of apparel and clothing accessories, not knitted or crochet - 41 5 504 7 590 8 4406� Other made up textile articles; Sets; Worn clothing; Rags � 2 - 6 26�64 Footwear, gaiters and the like; Parts thereof - - - 25 26465 Headgear and parts thereof - - - 0 1
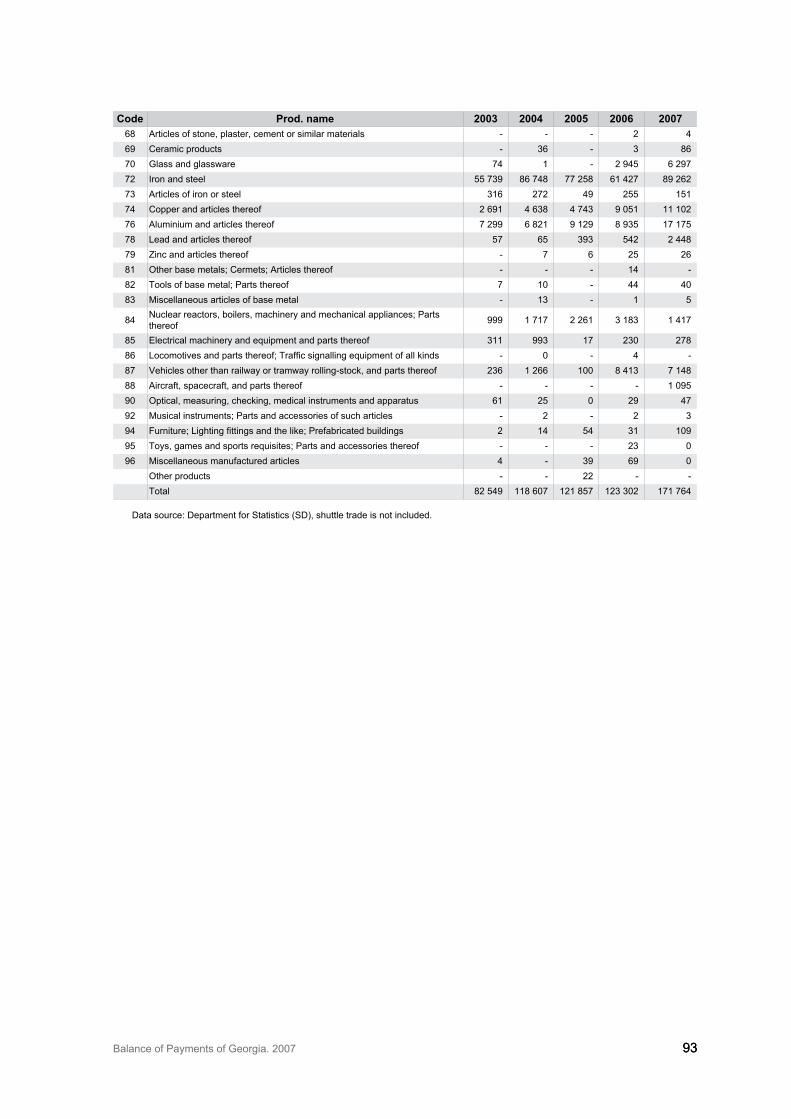
Balance of Payments of Georgia. 2007 9�9�
code prod. name 2003 2004 2005 2006 200768 Articles of stone, plaster, cement or similar materials - - - 2 469 Ceramic products - �6 - � 8670 Glass and glassware 74 1 - 2 945 6 29772 Iron and steel 55 7�9 86 748 77 258 61 427 89 2627� Articles of iron or steel �16 272 49 255 15174 Copper and articles thereof 2 691 4 6�8 4 74� 9 051 11 10276 Aluminium and articles thereof 7 299 6 821 9 129 8 9�5 17 17578 Lead and articles thereof 57 65 �9� 542 2 44879 Zinc and articles thereof - 7 6 25 2681 Other base metals; Cermets; Articles thereof - - - 14 -82 Tools of base metal; Parts thereof 7 10 - 44 408� Miscellaneous articles of base metal - 1� - 1 5
84 Nuclear reactors, boilers, machinery and mechanical appliances; Parts thereof 999 1 717 2 261 � 18� 1 417
85 Electrical machinery and equipment and parts thereof �11 99� 17 2�0 27886 Locomotives and parts thereof; Traffic signalling equipment of all kinds - 0 - 4 -87 Vehicles other than railway or tramway rolling-stock, and parts thereof 2�6 1 266 100 8 41� 7 14888 Aircraft, spacecraft, and parts thereof - - - - 1 09590 Optical, measuring, checking, medical instruments and apparatus 61 25 0 29 4792 Musical instruments; Parts and accessories of such articles - 2 - 2 �94 Furniture; Lighting fittings and the like; Prefabricated buildings 2 14 54 �1 10995 Toys, games and sports requisites; Parts and accessories thereof - - - 2� 096 Miscellaneous manufactured articles 4 - �9 69 0
Other products - - 22 - -Total 82 549 118 607 121 857 12� �02 171 764
Data source: Department for Statistics (SD), shuttle trade is not included.
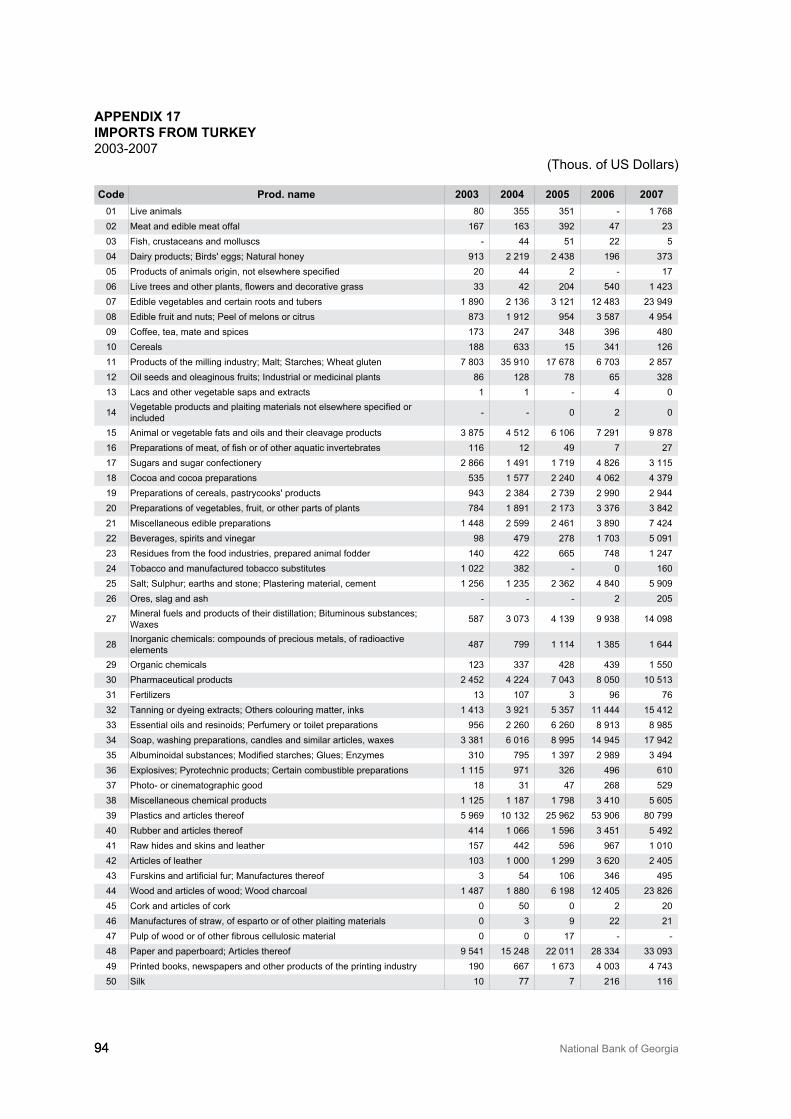
94 National Bank of Georgia94
appeNdix 17imports from tUrkey200�-2007
(Thous. of US Dollars)
code prod. name 2003 2004 2005 2006 200701 Live animals 80 �55 �51 - 1 76802 Meat and edible meat offal 167 16� �92 47 2�0� Fish, crustaceans and molluscs - 44 51 22 504 Dairy products; Birds' eggs; Natural honey 91� 2 219 2 4�8 196 �7�05 Products of animals origin, not elsewhere specified 20 44 2 - 1706 Live trees and other plants, flowers and decorative grass �� 42 204 540 1 42�07 Edible vegetables and certain roots and tubers 1 890 2 1�6 � 121 12 48� 2� 94908 Edible fruit and nuts; Peel of melons or citrus 87� 1 912 954 � 587 4 95409 Coffee, tea, mate and spices 17� 247 �48 �96 48010 Cereals 188 6�� 15 �41 12611 Products of the milling industry; Malt; Starches; Wheat gluten 7 80� �5 910 17 678 6 70� 2 85712 Oil seeds and oleaginous fruits; Industrial or medicinal plants 86 128 78 65 �281� Lacs and other vegetable saps and extracts 1 1 - 4 0
14 Vegetable products and plaiting materials not elsewhere specified or included - - 0 2 0
15 Animal or vegetable fats and oils and their cleavage products � 875 4 512 6 106 7 291 9 87816 Preparations of meat, of fish or of other aquatic invertebrates 116 12 49 7 2717 Sugars and sugar confectionery 2 866 1 491 1 719 4 826 � 11518 Cocoa and cocoa preparations 5�5 1 577 2 240 4 062 4 �7919 Preparations of cereals, pastrycooks' products 94� 2 �84 2 7�9 2 990 2 94420 Preparations of vegetables, fruit, or other parts of plants 784 1 891 2 17� � �76 � 84221 Miscellaneous edible preparations 1 448 2 599 2 461 � 890 7 42422 Beverages, spirits and vinegar 98 479 278 1 70� 5 0912� Residues from the food industries, prepared animal fodder 140 422 665 748 1 24724 Tobacco and manufactured tobacco substitutes 1 022 �82 - 0 16025 Salt; Sulphur; earths and stone; Plastering material, cement 1 256 1 2�5 2 �62 4 840 5 90926 Ores, slag and ash - - - 2 205
27 Mineral fuels and products of their distillation; Bituminous substances; Waxes 587 � 07� 4 1�9 9 9�8 14 098
28 Inorganic chemicals: compounds of precious metals, of radioactive elements 487 799 1 114 1 �85 1 644
29 Organic chemicals 12� ��7 428 4�9 1 550�0 Pharmaceutical products 2 452 4 224 7 04� 8 050 10 51��1 Fertilizers 1� 107 � 96 76�2 Tanning or dyeing extracts; Others colouring matter, inks 1 41� � 921 5 �57 11 444 15 412�� Essential oils and resinoids; Perfumery or toilet preparations 956 2 260 6 260 8 91� 8 985�4 Soap, washing preparations, candles and similar articles, waxes � �81 6 016 8 995 14 945 17 942�5 Albuminoidal substances; Modified starches; Glues; Enzymes �10 795 1 �97 2 989 � 494�6 Explosives; Pyrotechnic products; Certain combustible preparations 1 115 971 �26 496 610�7 Photo- or cinematographic good 18 �1 47 268 529�8 Miscellaneous chemical products 1 125 1 187 1 798 � 410 5 605�9 Plastics and articles thereof 5 969 10 1�2 25 962 5� 906 80 79940 Rubber and articles thereof 414 1 066 1 596 � 451 5 49241 Raw hides and skins and leather 157 442 596 967 1 01042 Articles of leather 10� 1 000 1 299 � 620 2 4054� Furskins and artificial fur; Manufactures thereof � 54 106 �46 49544 Wood and articles of wood; Wood charcoal 1 487 1 880 6 198 12 405 2� 82645 Cork and articles of cork 0 50 0 2 2046 Manufactures of straw, of esparto or of other plaiting materials 0 � 9 22 2147 Pulp of wood or of other fibrous cellulosic material 0 0 17 - -48 Paper and paperboard; Articles thereof 9 541 15 248 22 011 28 ��4 �� 09�49 Printed books, newspapers and other products of the printing industry 190 667 1 67� 4 00� 4 74�50 Silk 10 77 7 216 116
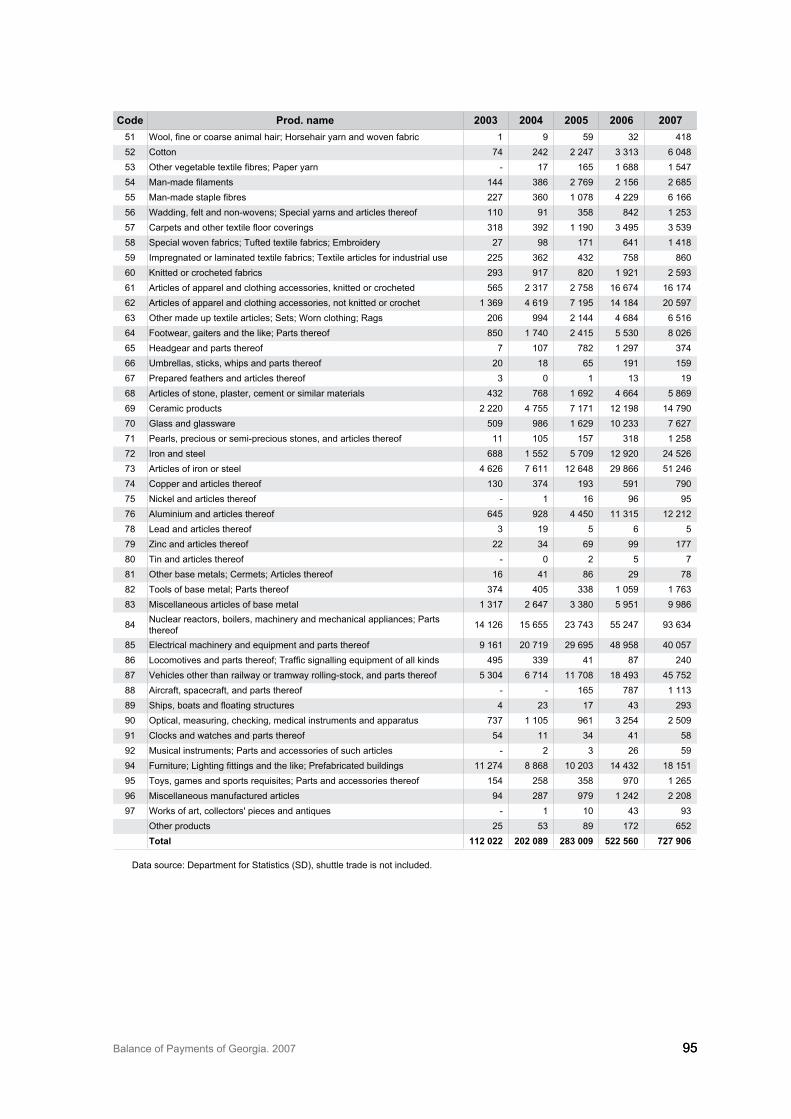
Balance of Payments of Georgia. 2007 9595
code prod. name 2003 2004 2005 2006 200751 Wool, fine or coarse animal hair; Horsehair yarn and woven fabric 1 9 59 �2 41852 Cotton 74 242 2 247 � �1� 6 0485� Other vegetable textile fibres; Paper yarn - 17 165 1 688 1 54754 Manmade filaments 144 �86 2 769 2 156 2 68555 Manmade staple fibres 227 �60 1 078 4 229 6 16656 Wadding, felt and non-wovens; Special yarns and articles thereof 110 91 �58 842 1 25�57 Carpets and other textile floor coverings �18 �92 1 190 � 495 � 5�958 Special woven fabrics; Tufted textile fabrics; Embroidery 27 98 171 641 1 41859 Impregnated or laminated textile fabrics; Textile articles for industrial use 225 �62 4�2 758 86060 Knitted or crocheted fabrics 29� 917 820 1 921 2 59�61 Articles of apparel and clothing accessories, knitted or crocheted 565 2 �17 2 758 16 674 16 17462 Articles of apparel and clothing accessories, not knitted or crochet 1 �69 4 619 7 195 14 184 20 5976� Other made up textile articles; Sets; Worn clothing; Rags 206 994 2 144 4 684 6 51664 Footwear, gaiters and the like; Parts thereof 850 1 740 2 415 5 5�0 8 02665 Headgear and parts thereof 7 107 782 1 297 �7466 Umbrellas, sticks, whips and parts thereof 20 18 65 191 15967 Prepared feathers and articles thereof � 0 1 1� 1968 Articles of stone, plaster, cement or similar materials 4�2 768 1 692 4 664 5 86969 Ceramic products 2 220 4 755 7 171 12 198 14 79070 Glass and glassware 509 986 1 629 10 2�� 7 62771 Pearls, precious or semi-precious stones, and articles thereof 11 105 157 �18 1 25872 Iron and steel 688 1 552 5 709 12 920 24 5267� Articles of iron or steel 4 626 7 611 12 648 29 866 51 24674 Copper and articles thereof 1�0 �74 19� 591 79075 Nickel and articles thereof - 1 16 96 9576 Aluminium and articles thereof 645 928 4 450 11 �15 12 21278 Lead and articles thereof � 19 5 6 579 Zinc and articles thereof 22 �4 69 99 17780 Tin and articles thereof - 0 2 5 781 Other base metals; Cermets; Articles thereof 16 41 86 29 7882 Tools of base metal; Parts thereof �74 405 ��8 1 059 1 76�8� Miscellaneous articles of base metal 1 �17 2 647 � �80 5 951 9 986
84 Nuclear reactors, boilers, machinery and mechanical appliances; Parts thereof 14 126 15 655 2� 74� 55 247 9� 6�4
85 Electrical machinery and equipment and parts thereof 9 161 20 719 29 695 48 958 40 05786 Locomotives and parts thereof; Traffic signalling equipment of all kinds 495 ��9 41 87 24087 Vehicles other than railway or tramway rolling-stock, and parts thereof 5 �04 6 714 11 708 18 49� 45 75288 Aircraft, spacecraft, and parts thereof - - 165 787 1 11�89 Ships, boats and floating structures 4 2� 17 4� 29�90 Optical, measuring, checking, medical instruments and apparatus 7�7 1 105 961 � 254 2 50991 Clocks and watches and parts thereof 54 11 �4 41 5892 Musical instruments; Parts and accessories of such articles - 2 � 26 5994 Furniture; Lighting fittings and the like; Prefabricated buildings 11 274 8 868 10 20� 14 4�2 18 15195 Toys, games and sports requisites; Parts and accessories thereof 154 258 �58 970 1 26596 Miscellaneous manufactured articles 94 287 979 1 242 2 20897 Works of art, collectors' pieces and antiques - 1 10 4� 9�
Other products 25 5� 89 172 652total 112 022 202 089 283 009 522 560 727 906
Data source: Department for Statistics (SD), shuttle trade is not included.
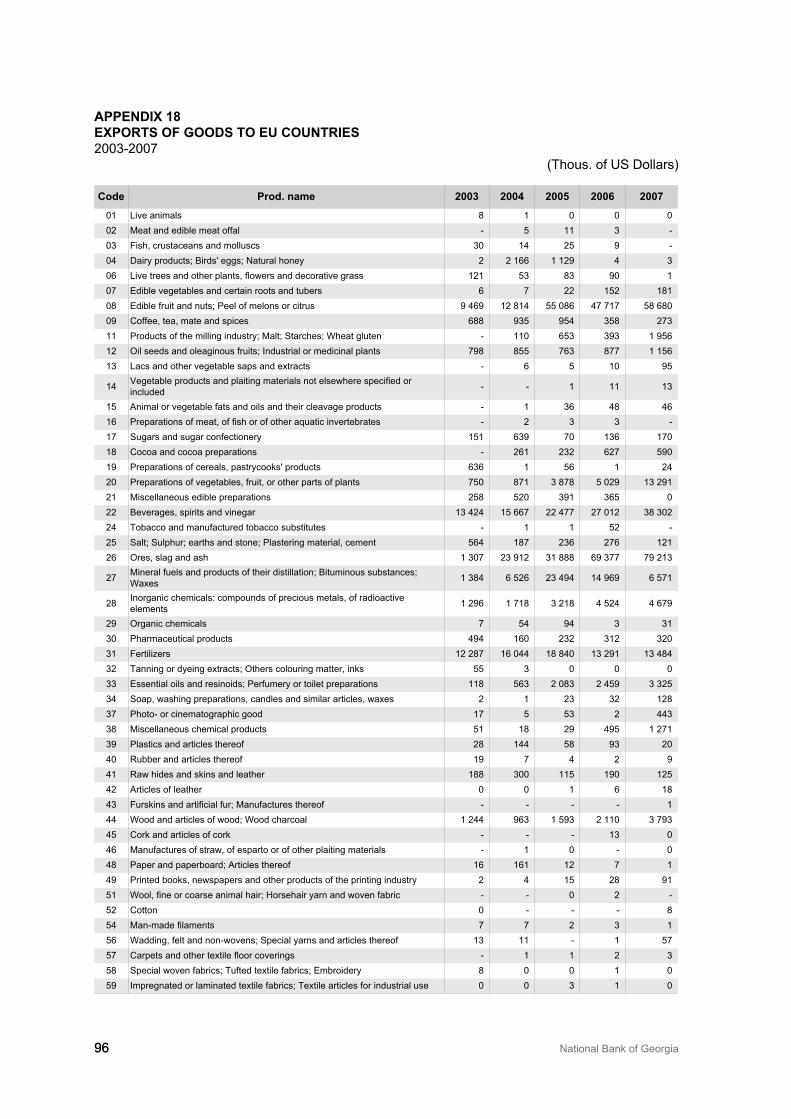
96 National Bank of Georgia96
appeNdix 18exports of Goods to eU coUNtries200�-2007
(Thous. of US Dollars)
code prod. name 2003 2004 2005 2006 2007
01 Live animals 8 1 0 0 002 Meat and edible meat offal - 5 11 � - 0� Fish, crustaceans and molluscs �0 14 25 9 - 04 Dairy products; Birds' eggs; Natural honey 2 2 166 1 129 4 �06 Live trees and other plants, flowers and decorative grass 121 5� 8� 90 107 Edible vegetables and certain roots and tubers 6 7 22 152 18108 Edible fruit and nuts; Peel of melons or citrus 9 469 12 814 55 086 47 717 58 68009 Coffee, tea, mate and spices 688 9�5 954 �58 27�11 Products of the milling industry; Malt; Starches; Wheat gluten - 110 65� �9� 1 95612 Oil seeds and oleaginous fruits; Industrial or medicinal plants 798 855 76� 877 1 1561� Lacs and other vegetable saps and extracts - 6 5 10 95
14 Vegetable products and plaiting materials not elsewhere specified or included - - 1 11 1�
15 Animal or vegetable fats and oils and their cleavage products - 1 �6 48 4616 Preparations of meat, of fish or of other aquatic invertebrates - 2 � � - 17 Sugars and sugar confectionery 151 6�9 70 1�6 17018 Cocoa and cocoa preparations - 261 2�2 627 59019 Preparations of cereals, pastrycooks' products 6�6 1 56 1 2420 Preparations of vegetables, fruit, or other parts of plants 750 871 � 878 5 029 1� 29121 Miscellaneous edible preparations 258 520 �91 �65 022 Beverages, spirits and vinegar 1� 424 15 667 22 477 27 012 �8 �0224 Tobacco and manufactured tobacco substitutes - 1 1 52 - 25 Salt; Sulphur; earths and stone; Plastering material, cement 564 187 2�6 276 12126 Ores, slag and ash 1 �07 2� 912 �1 888 69 �77 79 21�
27 Mineral fuels and products of their distillation; Bituminous substances; Waxes 1 �84 6 526 2� 494 14 969 6 571
28 Inorganic chemicals: compounds of precious metals, of radioactive elements 1 296 1 718 � 218 4 524 4 679
29 Organic chemicals 7 54 94 � �1�0 Pharmaceutical products 494 160 2�2 �12 �20�1 Fertilizers 12 287 16 044 18 840 1� 291 1� 484�2 Tanning or dyeing extracts; Others colouring matter, inks 55 � 0 0 0�� Essential oils and resinoids; Perfumery or toilet preparations 118 56� 2 08� 2 459 � �25�4 Soap, washing preparations, candles and similar articles, waxes 2 1 2� �2 128�7 Photo- or cinematographic good 17 5 5� 2 44��8 Miscellaneous chemical products 51 18 29 495 1 271�9 Plastics and articles thereof 28 144 58 9� 2040 Rubber and articles thereof 19 7 4 2 941 Raw hides and skins and leather 188 �00 115 190 12542 Articles of leather 0 0 1 6 184� Furskins and artificial fur; Manufactures thereof - - - - 144 Wood and articles of wood; Wood charcoal 1 244 96� 1 59� 2 110 � 79�45 Cork and articles of cork - - - 1� 046 Manufactures of straw, of esparto or of other plaiting materials - 1 0 - 048 Paper and paperboard; Articles thereof 16 161 12 7 149 Printed books, newspapers and other products of the printing industry 2 4 15 28 9151 Wool, fine or coarse animal hair; Horsehair yarn and woven fabric - - 0 2 - 52 Cotton 0 - - - 854 Manmade filaments 7 7 2 � 156 Wadding, felt and non-wovens; Special yarns and articles thereof 1� 11 - 1 5757 Carpets and other textile floor coverings - 1 1 2 �58 Special woven fabrics; Tufted textile fabrics; Embroidery 8 0 0 1 059 Impregnated or laminated textile fabrics; Textile articles for industrial use 0 0 � 1 0
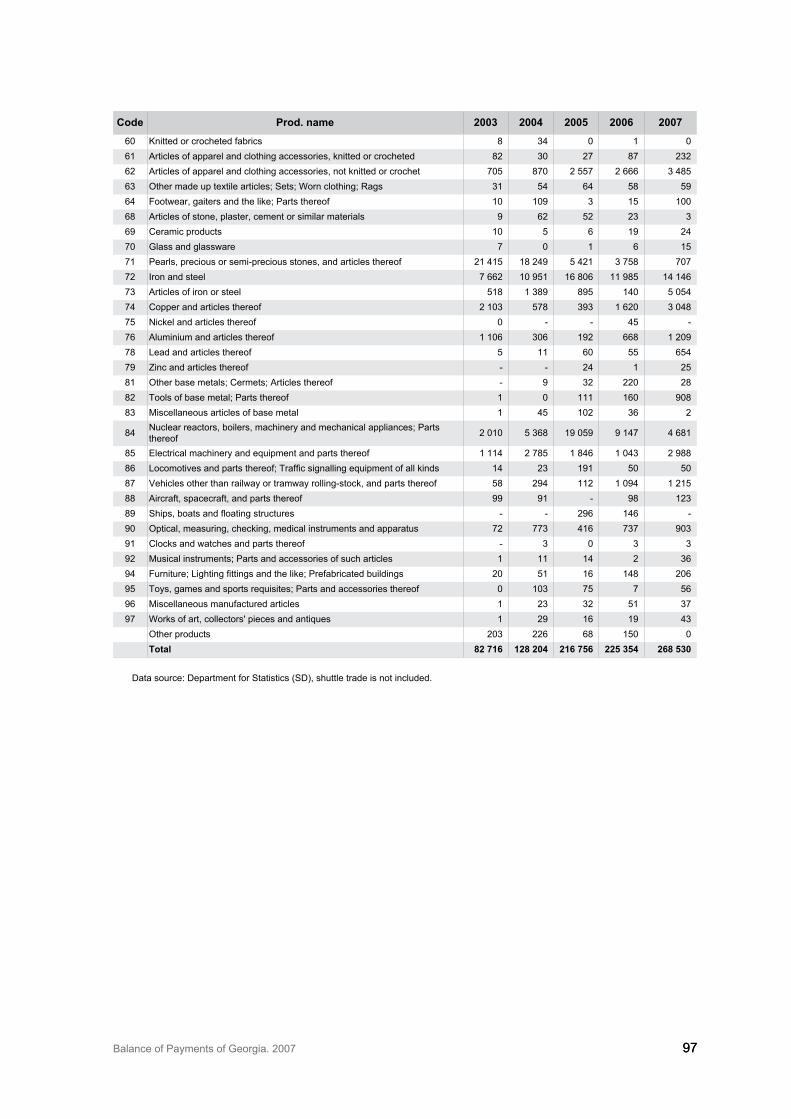
Balance of Payments of Georgia. 2007 9797
code prod. name 2003 2004 2005 2006 200760 Knitted or crocheted fabrics 8 �4 0 1 061 Articles of apparel and clothing accessories, knitted or crocheted 82 �0 27 87 2�262 Articles of apparel and clothing accessories, not knitted or crochet 705 870 2 557 2 666 � 4856� Other made up textile articles; Sets; Worn clothing; Rags �1 54 64 58 5964 Footwear, gaiters and the like; Parts thereof 10 109 � 15 10068 Articles of stone, plaster, cement or similar materials 9 62 52 2� �69 Ceramic products 10 5 6 19 2470 Glass and glassware 7 0 1 6 1571 Pearls, precious or semi-precious stones, and articles thereof 21 415 18 249 5 421 � 758 70772 Iron and steel 7 662 10 951 16 806 11 985 14 1467� Articles of iron or steel 518 1 �89 895 140 5 05474 Copper and articles thereof 2 10� 578 �9� 1 620 � 04875 Nickel and articles thereof 0 - - 45 - 76 Aluminium and articles thereof 1 106 �06 192 668 1 20978 Lead and articles thereof 5 11 60 55 65479 Zinc and articles thereof - - 24 1 2581 Other base metals; Cermets; Articles thereof - 9 �2 220 2882 Tools of base metal; Parts thereof 1 0 111 160 9088� Miscellaneous articles of base metal 1 45 102 �6 2
84 Nuclear reactors, boilers, machinery and mechanical appliances; Parts thereof 2 010 5 �68 19 059 9 147 4 681
85 Electrical machinery and equipment and parts thereof 1 114 2 785 1 846 1 04� 2 98886 Locomotives and parts thereof; Traffic signalling equipment of all kinds 14 2� 191 50 5087 Vehicles other than railway or tramway rolling-stock, and parts thereof 58 294 112 1 094 1 21588 Aircraft, spacecraft, and parts thereof 99 91 - 98 12�89 Ships, boats and floating structures - - 296 146 - 90 Optical, measuring, checking, medical instruments and apparatus 72 77� 416 7�7 90�91 Clocks and watches and parts thereof - � 0 � �92 Musical instruments; Parts and accessories of such articles 1 11 14 2 �694 Furniture; Lighting fittings and the like; Prefabricated buildings 20 51 16 148 20695 Toys, games and sports requisites; Parts and accessories thereof 0 10� 75 7 5696 Miscellaneous manufactured articles 1 2� �2 51 �797 Works of art, collectors' pieces and antiques 1 29 16 19 4�
Other products 20� 226 68 150 0 total 82 716 128 204 216 756 225 354 268 530
Data source: Department for Statistics (SD), shuttle trade is not included.
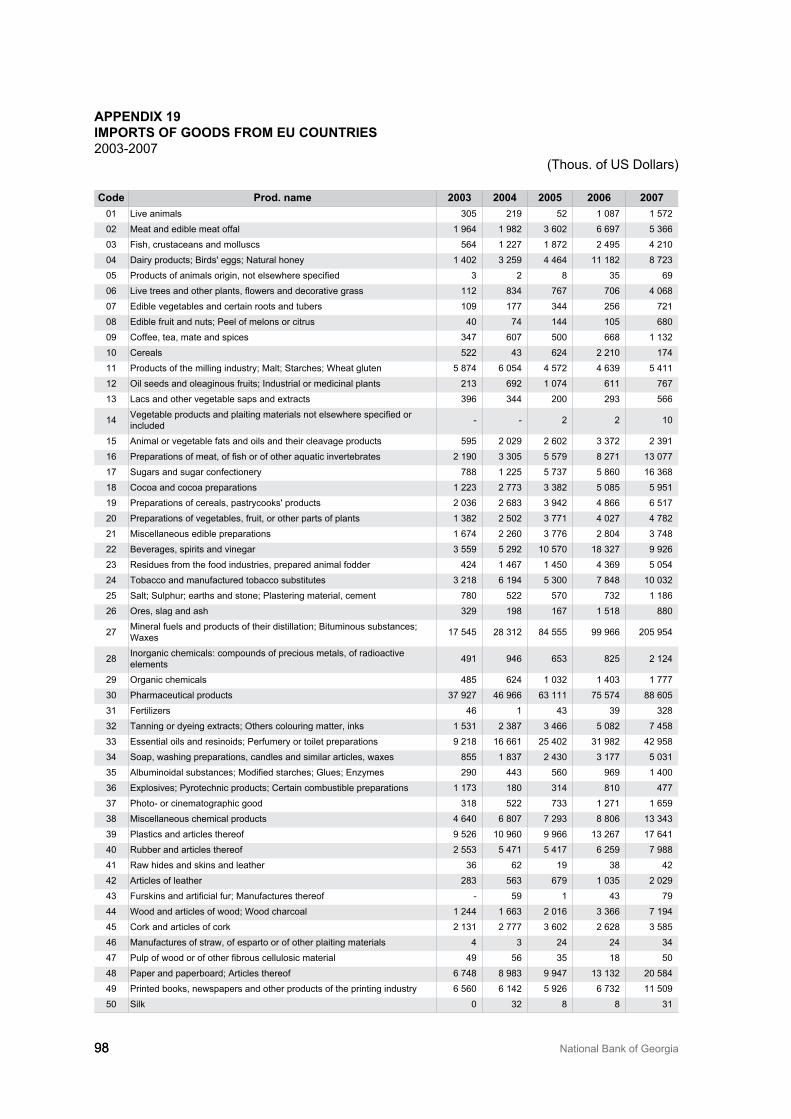
98 National Bank of Georgia98
appeNdix 19imports of Goods from eU coUNtries200�-2007
(Thous. of US Dollars)
code prod. name 2003 2004 2005 2006 200701 Live animals �05 219 52 1 087 1 57202 Meat and edible meat offal 1 964 1 982 � 602 6 697 5 �660� Fish, crustaceans and molluscs 564 1 227 1 872 2 495 4 21004 Dairy products; Birds' eggs; Natural honey 1 402 � 259 4 464 11 182 8 72�05 Products of animals origin, not elsewhere specified � 2 8 �5 6906 Live trees and other plants, flowers and decorative grass 112 8�4 767 706 4 06807 Edible vegetables and certain roots and tubers 109 177 �44 256 72108 Edible fruit and nuts; Peel of melons or citrus 40 74 144 105 68009 Coffee, tea, mate and spices �47 607 500 668 1 1�210 Cereals 522 4� 624 2 210 17411 Products of the milling industry; Malt; Starches; Wheat gluten 5 874 6 054 4 572 4 6�9 5 41112 Oil seeds and oleaginous fruits; Industrial or medicinal plants 21� 692 1 074 611 7671� Lacs and other vegetable saps and extracts �96 �44 200 29� 566
14 Vegetable products and plaiting materials not elsewhere specified or included - - 2 2 10
15 Animal or vegetable fats and oils and their cleavage products 595 2 029 2 602 � �72 2 �9116 Preparations of meat, of fish or of other aquatic invertebrates 2 190 � �05 5 579 8 271 1� 07717 Sugars and sugar confectionery 788 1 225 5 7�7 5 860 16 �6818 Cocoa and cocoa preparations 1 22� 2 77� � �82 5 085 5 95119 Preparations of cereals, pastrycooks' products 2 0�6 2 68� � 942 4 866 6 51720 Preparations of vegetables, fruit, or other parts of plants 1 �82 2 502 � 771 4 027 4 78221 Miscellaneous edible preparations 1 674 2 260 � 776 2 804 � 74822 Beverages, spirits and vinegar � 559 5 292 10 570 18 �27 9 9262� Residues from the food industries, prepared animal fodder 424 1 467 1 450 4 �69 5 05424 Tobacco and manufactured tobacco substitutes � 218 6 194 5 �00 7 848 10 0�225 Salt; Sulphur; earths and stone; Plastering material, cement 780 522 570 7�2 1 18626 Ores, slag and ash �29 198 167 1 518 880
27 Mineral fuels and products of their distillation; Bituminous substances; Waxes 17 545 28 �12 84 555 99 966 205 954
28 Inorganic chemicals: compounds of precious metals, of radioactive elements 491 946 65� 825 2 124
29 Organic chemicals 485 624 1 0�2 1 40� 1 777�0 Pharmaceutical products �7 927 46 966 6� 111 75 574 88 605�1 Fertilizers 46 1 4� �9 �28�2 Tanning or dyeing extracts; Others colouring matter, inks 1 5�1 2 �87 � 466 5 082 7 458�� Essential oils and resinoids; Perfumery or toilet preparations 9 218 16 661 25 402 �1 982 42 958�4 Soap, washing preparations, candles and similar articles, waxes 855 1 8�7 2 4�0 � 177 5 0�1�5 Albuminoidal substances; Modified starches; Glues; Enzymes 290 44� 560 969 1 400�6 Explosives; Pyrotechnic products; Certain combustible preparations 1 17� 180 �14 810 477�7 Photo- or cinematographic good �18 522 7�� 1 271 1 659�8 Miscellaneous chemical products 4 640 6 807 7 29� 8 806 1� �4��9 Plastics and articles thereof 9 526 10 960 9 966 1� 267 17 64140 Rubber and articles thereof 2 55� 5 471 5 417 6 259 7 98841 Raw hides and skins and leather �6 62 19 �8 4242 Articles of leather 28� 56� 679 1 0�5 2 0294� Furskins and artificial fur; Manufactures thereof - 59 1 4� 7944 Wood and articles of wood; Wood charcoal 1 244 1 66� 2 016 � �66 7 19445 Cork and articles of cork 2 1�1 2 777 � 602 2 628 � 58546 Manufactures of straw, of esparto or of other plaiting materials 4 � 24 24 �447 Pulp of wood or of other fibrous cellulosic material 49 56 �5 18 5048 Paper and paperboard; Articles thereof 6 748 8 98� 9 947 1� 1�2 20 58449 Printed books, newspapers and other products of the printing industry 6 560 6 142 5 926 6 7�2 11 50950 Silk 0 �2 8 8 �1
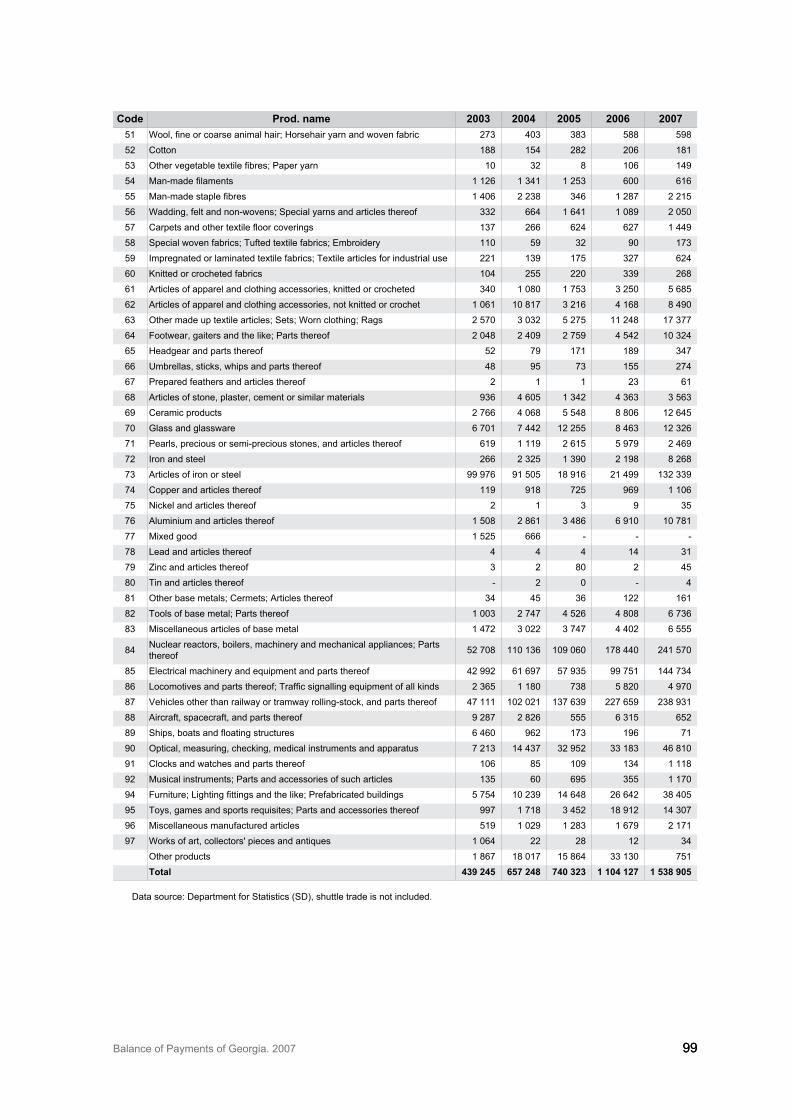
Balance of Payments of Georgia. 2007 9999
code prod. name 2003 2004 2005 2006 200751 Wool, fine or coarse animal hair; Horsehair yarn and woven fabric 27� 40� �8� 588 59852 Cotton 188 154 282 206 1815� Other vegetable textile fibres; Paper yarn 10 �2 8 106 14954 Manmade filaments 1 126 1 �41 1 25� 600 61655 Manmade staple fibres 1 406 2 2�8 �46 1 287 2 21556 Wadding, felt and non-wovens; Special yarns and articles thereof ��2 664 1 641 1 089 2 05057 Carpets and other textile floor coverings 1�7 266 624 627 1 44958 Special woven fabrics; Tufted textile fabrics; Embroidery 110 59 �2 90 17�59 Impregnated or laminated textile fabrics; Textile articles for industrial use 221 1�9 175 �27 62460 Knitted or crocheted fabrics 104 255 220 ��9 26861 Articles of apparel and clothing accessories, knitted or crocheted �40 1 080 1 75� � 250 5 68562 Articles of apparel and clothing accessories, not knitted or crochet 1 061 10 817 � 216 4 168 8 4906� Other made up textile articles; Sets; Worn clothing; Rags 2 570 � 0�2 5 275 11 248 17 �7764 Footwear, gaiters and the like; Parts thereof 2 048 2 409 2 759 4 542 10 �2465 Headgear and parts thereof 52 79 171 189 �4766 Umbrellas, sticks, whips and parts thereof 48 95 7� 155 27467 Prepared feathers and articles thereof 2 1 1 2� 6168 Articles of stone, plaster, cement or similar materials 9�6 4 605 1 �42 4 �6� � 56�69 Ceramic products 2 766 4 068 5 548 8 806 12 64570 Glass and glassware 6 701 7 442 12 255 8 46� 12 �2671 Pearls, precious or semi-precious stones, and articles thereof 619 1 119 2 615 5 979 2 46972 Iron and steel 266 2 �25 1 �90 2 198 8 2687� Articles of iron or steel 99 976 91 505 18 916 21 499 1�2 ��974 Copper and articles thereof 119 918 725 969 1 10675 Nickel and articles thereof 2 1 � 9 �576 Aluminium and articles thereof 1 508 2 861 � 486 6 910 10 78177 Mixed good 1 525 666 - - - 78 Lead and articles thereof 4 4 4 14 �179 Zinc and articles thereof � 2 80 2 4580 Tin and articles thereof - 2 0 - 481 Other base metals; Cermets; Articles thereof �4 45 �6 122 16182 Tools of base metal; Parts thereof 1 00� 2 747 4 526 4 808 6 7�68� Miscellaneous articles of base metal 1 472 � 022 � 747 4 402 6 555
84 Nuclear reactors, boilers, machinery and mechanical appliances; Parts thereof 52 708 110 1�6 109 060 178 440 241 570
85 Electrical machinery and equipment and parts thereof 42 992 61 697 57 9�5 99 751 144 7�486 Locomotives and parts thereof; Traffic signalling equipment of all kinds 2 �65 1 180 7�8 5 820 4 97087 Vehicles other than railway or tramway rolling-stock, and parts thereof 47 111 102 021 1�7 6�9 227 659 2�8 9�188 Aircraft, spacecraft, and parts thereof 9 287 2 826 555 6 �15 65289 Ships, boats and floating structures 6 460 962 17� 196 7190 Optical, measuring, checking, medical instruments and apparatus 7 21� 14 4�7 �2 952 �� 18� 46 81091 Clocks and watches and parts thereof 106 85 109 1�4 1 11892 Musical instruments; Parts and accessories of such articles 1�5 60 695 �55 1 17094 Furniture; Lighting fittings and the like; Prefabricated buildings 5 754 10 2�9 14 648 26 642 �8 40595 Toys, games and sports requisites; Parts and accessories thereof 997 1 718 � 452 18 912 14 �0796 Miscellaneous manufactured articles 519 1 029 1 28� 1 679 2 17197 Works of art, collectors' pieces and antiques 1 064 22 28 12 �4
Other products 1 867 18 017 15 864 �� 1�0 751 total 439 245 657 248 740 323 1 104 127 1 538 905
Data source: Department for Statistics (SD), shuttle trade is not included.
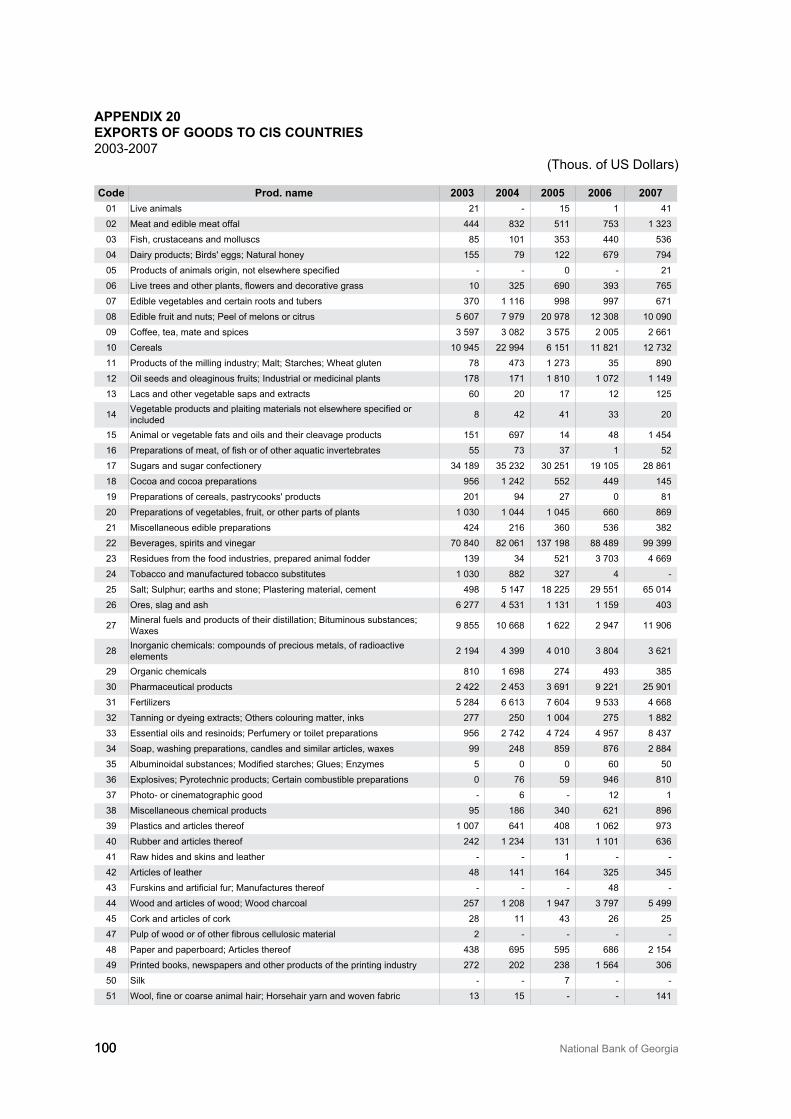
100 National Bank of Georgia100
appeNdix 20exports of Goods to cis coUNtries200�-2007
(Thous. of US Dollars)
code prod. name 2003 2004 2005 2006 200701 Live animals 21 - 15 1 4102 Meat and edible meat offal 444 8�2 511 75� 1 �2�0� Fish, crustaceans and molluscs 85 101 �5� 440 5�604 Dairy products; Birds' eggs; Natural honey 155 79 122 679 79405 Products of animals origin, not elsewhere specified - - 0 - 2106 Live trees and other plants, flowers and decorative grass 10 �25 690 �9� 76507 Edible vegetables and certain roots and tubers �70 1 116 998 997 67108 Edible fruit and nuts; Peel of melons or citrus 5 607 7 979 20 978 12 �08 10 09009 Coffee, tea, mate and spices � 597 � 082 � 575 2 005 2 66110 Cereals 10 945 22 994 6 151 11 821 12 7�211 Products of the milling industry; Malt; Starches; Wheat gluten 78 47� 1 27� �5 89012 Oil seeds and oleaginous fruits; Industrial or medicinal plants 178 171 1 810 1 072 1 1491� Lacs and other vegetable saps and extracts 60 20 17 12 125
14 Vegetable products and plaiting materials not elsewhere specified or included 8 42 41 �� 20
15 Animal or vegetable fats and oils and their cleavage products 151 697 14 48 1 45416 Preparations of meat, of fish or of other aquatic invertebrates 55 7� �7 1 5217 Sugars and sugar confectionery �4 189 �5 2�2 �0 251 19 105 28 86118 Cocoa and cocoa preparations 956 1 242 552 449 14519 Preparations of cereals, pastrycooks' products 201 94 27 0 8120 Preparations of vegetables, fruit, or other parts of plants 1 0�0 1 044 1 045 660 86921 Miscellaneous edible preparations 424 216 �60 5�6 �8222 Beverages, spirits and vinegar 70 840 82 061 1�7 198 88 489 99 �992� Residues from the food industries, prepared animal fodder 1�9 �4 521 � 70� 4 66924 Tobacco and manufactured tobacco substitutes 1 0�0 882 �27 4 -25 Salt; Sulphur; earths and stone; Plastering material, cement 498 5 147 18 225 29 551 65 01426 Ores, slag and ash 6 277 4 5�1 1 1�1 1 159 40�
27 Mineral fuels and products of their distillation; Bituminous substances; Waxes 9 855 10 668 1 622 2 947 11 906
28 Inorganic chemicals: compounds of precious metals, of radioactive elements 2 194 4 �99 4 010 � 804 � 621
29 Organic chemicals 810 1 698 274 49� �85�0 Pharmaceutical products 2 422 2 45� � 691 9 221 25 901�1 Fertilizers 5 284 6 61� 7 604 9 5�� 4 668�2 Tanning or dyeing extracts; Others colouring matter, inks 277 250 1 004 275 1 882�� Essential oils and resinoids; Perfumery or toilet preparations 956 2 742 4 724 4 957 8 4�7�4 Soap, washing preparations, candles and similar articles, waxes 99 248 859 876 2 884�5 Albuminoidal substances; Modified starches; Glues; Enzymes 5 0 0 60 50�6 Explosives; Pyrotechnic products; Certain combustible preparations 0 76 59 946 810�7 Photo- or cinematographic good - 6 - 12 1�8 Miscellaneous chemical products 95 186 �40 621 896�9 Plastics and articles thereof 1 007 641 408 1 062 97�40 Rubber and articles thereof 242 1 2�4 1�1 1 101 6�641 Raw hides and skins and leather - - 1 - -42 Articles of leather 48 141 164 �25 �454� Furskins and artificial fur; Manufactures thereof - - - 48 -44 Wood and articles of wood; Wood charcoal 257 1 208 1 947 � 797 5 49945 Cork and articles of cork 28 11 4� 26 2547 Pulp of wood or of other fibrous cellulosic material 2 - - - -48 Paper and paperboard; Articles thereof 4�8 695 595 686 2 15449 Printed books, newspapers and other products of the printing industry 272 202 2�8 1 564 �0650 Silk - - 7 - -51 Wool, fine or coarse animal hair; Horsehair yarn and woven fabric 1� 15 - - 141
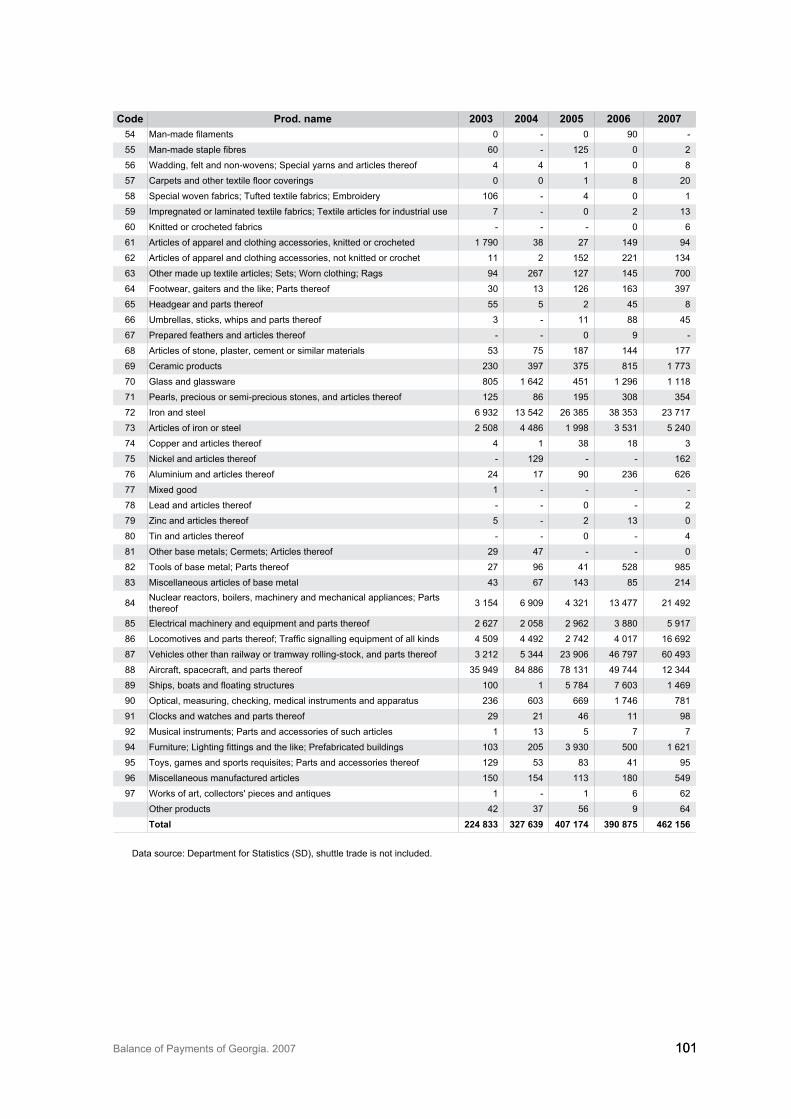
Balance of Payments of Georgia. 2007 101101
code prod. name 2003 2004 2005 2006 200754 Manmade filaments 0 - 0 90 -55 Manmade staple fibres 60 - 125 0 256 Wadding, felt and non-wovens; Special yarns and articles thereof 4 4 1 0 857 Carpets and other textile floor coverings 0 0 1 8 2058 Special woven fabrics; Tufted textile fabrics; Embroidery 106 - 4 0 159 Impregnated or laminated textile fabrics; Textile articles for industrial use 7 - 0 2 1�60 Knitted or crocheted fabrics - - - 0 661 Articles of apparel and clothing accessories, knitted or crocheted 1 790 �8 27 149 9462 Articles of apparel and clothing accessories, not knitted or crochet 11 2 152 221 1�46� Other made up textile articles; Sets; Worn clothing; Rags 94 267 127 145 70064 Footwear, gaiters and the like; Parts thereof �0 1� 126 16� �9765 Headgear and parts thereof 55 5 2 45 866 Umbrellas, sticks, whips and parts thereof � - 11 88 4567 Prepared feathers and articles thereof - - 0 9 -68 Articles of stone, plaster, cement or similar materials 5� 75 187 144 17769 Ceramic products 2�0 �97 �75 815 1 77�70 Glass and glassware 805 1 642 451 1 296 1 11871 Pearls, precious or semi-precious stones, and articles thereof 125 86 195 �08 �5472 Iron and steel 6 9�2 1� 542 26 �85 �8 �5� 2� 7177� Articles of iron or steel 2 508 4 486 1 998 � 5�1 5 24074 Copper and articles thereof 4 1 �8 18 �75 Nickel and articles thereof - 129 - - 16276 Aluminium and articles thereof 24 17 90 2�6 62677 Mixed good 1 - - - -78 Lead and articles thereof - - 0 - 279 Zinc and articles thereof 5 - 2 1� 080 Tin and articles thereof - - 0 - 481 Other base metals; Cermets; Articles thereof 29 47 - - 082 Tools of base metal; Parts thereof 27 96 41 528 9858� Miscellaneous articles of base metal 4� 67 14� 85 214
84 Nuclear reactors, boilers, machinery and mechanical appliances; Parts thereof � 154 6 909 4 �21 1� 477 21 492
85 Electrical machinery and equipment and parts thereof 2 627 2 058 2 962 � 880 5 91786 Locomotives and parts thereof; Traffic signalling equipment of all kinds 4 509 4 492 2 742 4 017 16 69287 Vehicles other than railway or tramway rolling-stock, and parts thereof � 212 5 �44 2� 906 46 797 60 49�88 Aircraft, spacecraft, and parts thereof �5 949 84 886 78 1�1 49 744 12 �4489 Ships, boats and floating structures 100 1 5 784 7 60� 1 46990 Optical, measuring, checking, medical instruments and apparatus 2�6 60� 669 1 746 78191 Clocks and watches and parts thereof 29 21 46 11 9892 Musical instruments; Parts and accessories of such articles 1 1� 5 7 794 Furniture; Lighting fittings and the like; Prefabricated buildings 10� 205 � 9�0 500 1 62195 Toys, games and sports requisites; Parts and accessories thereof 129 5� 8� 41 9596 Miscellaneous manufactured articles 150 154 11� 180 54997 Works of art, collectors' pieces and antiques 1 - 1 6 62
Other products 42 �7 56 9 64total 224 833 327 639 407 174 390 875 462 156
Data source: Department for Statistics (SD), shuttle trade is not included.
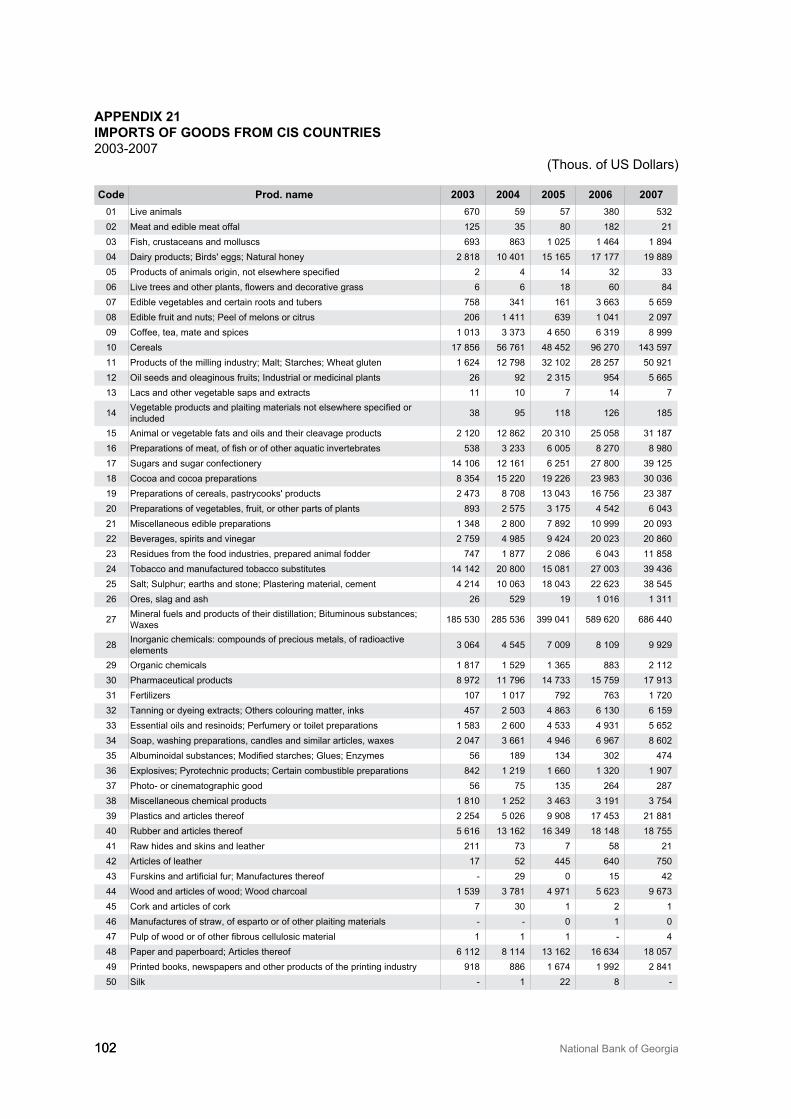
102 National Bank of Georgia102
appeNdix 21imports of Goods from cis coUNtries200�-2007
(Thous. of US Dollars)
code prod. name 2003 2004 2005 2006 200701 Live animals 670 59 57 �80 5�202 Meat and edible meat offal 125 �5 80 182 210� Fish, crustaceans and molluscs 69� 86� 1 025 1 464 1 89404 Dairy products; Birds' eggs; Natural honey 2 818 10 401 15 165 17 177 19 88905 Products of animals origin, not elsewhere specified 2 4 14 �2 ��06 Live trees and other plants, flowers and decorative grass 6 6 18 60 8407 Edible vegetables and certain roots and tubers 758 �41 161 � 66� 5 65908 Edible fruit and nuts; Peel of melons or citrus 206 1 411 6�9 1 041 2 09709 Coffee, tea, mate and spices 1 01� � �7� 4 650 6 �19 8 99910 Cereals 17 856 56 761 48 452 96 270 14� 59711 Products of the milling industry; Malt; Starches; Wheat gluten 1 624 12 798 �2 102 28 257 50 92112 Oil seeds and oleaginous fruits; Industrial or medicinal plants 26 92 2 �15 954 5 6651� Lacs and other vegetable saps and extracts 11 10 7 14 7
14 Vegetable products and plaiting materials not elsewhere specified or included �8 95 118 126 185
15 Animal or vegetable fats and oils and their cleavage products 2 120 12 862 20 �10 25 058 �1 18716 Preparations of meat, of fish or of other aquatic invertebrates 5�8 � 2�� 6 005 8 270 8 98017 Sugars and sugar confectionery 14 106 12 161 6 251 27 800 �9 12518 Cocoa and cocoa preparations 8 �54 15 220 19 226 2� 98� �0 0�619 Preparations of cereals, pastrycooks' products 2 47� 8 708 1� 04� 16 756 2� �8720 Preparations of vegetables, fruit, or other parts of plants 89� 2 575 � 175 4 542 6 04�21 Miscellaneous edible preparations 1 �48 2 800 7 892 10 999 20 09�22 Beverages, spirits and vinegar 2 759 4 985 9 424 20 02� 20 8602� Residues from the food industries, prepared animal fodder 747 1 877 2 086 6 04� 11 85824 Tobacco and manufactured tobacco substitutes 14 142 20 800 15 081 27 00� �9 4�625 Salt; Sulphur; earths and stone; Plastering material, cement 4 214 10 06� 18 04� 22 62� �8 54526 Ores, slag and ash 26 529 19 1 016 1 �11
27 Mineral fuels and products of their distillation; Bituminous substances; Waxes 185 5�0 285 5�6 �99 041 589 620 686 440
28 Inorganic chemicals: compounds of precious metals, of radioactive elements � 064 4 545 7 009 8 109 9 929
29 Organic chemicals 1 817 1 529 1 �65 88� 2 112�0 Pharmaceutical products 8 972 11 796 14 7�� 15 759 17 91��1 Fertilizers 107 1 017 792 76� 1 720�2 Tanning or dyeing extracts; Others colouring matter, inks 457 2 50� 4 86� 6 1�0 6 159�� Essential oils and resinoids; Perfumery or toilet preparations 1 58� 2 600 4 5�� 4 9�1 5 652�4 Soap, washing preparations, candles and similar articles, waxes 2 047 � 661 4 946 6 967 8 602�5 Albuminoidal substances; Modified starches; Glues; Enzymes 56 189 1�4 �02 474�6 Explosives; Pyrotechnic products; Certain combustible preparations 842 1 219 1 660 1 �20 1 907�7 Photo- or cinematographic good 56 75 1�5 264 287�8 Miscellaneous chemical products 1 810 1 252 � 46� � 191 � 754�9 Plastics and articles thereof 2 254 5 026 9 908 17 45� 21 88140 Rubber and articles thereof 5 616 1� 162 16 �49 18 148 18 75541 Raw hides and skins and leather 211 7� 7 58 2142 Articles of leather 17 52 445 640 7504� Furskins and artificial fur; Manufactures thereof - 29 0 15 4244 Wood and articles of wood; Wood charcoal 1 5�9 � 781 4 971 5 62� 9 67�45 Cork and articles of cork 7 �0 1 2 146 Manufactures of straw, of esparto or of other plaiting materials - - 0 1 047 Pulp of wood or of other fibrous cellulosic material 1 1 1 - 448 Paper and paperboard; Articles thereof 6 112 8 114 1� 162 16 6�4 18 05749 Printed books, newspapers and other products of the printing industry 918 886 1 674 1 992 2 84150 Silk - 1 22 8 -
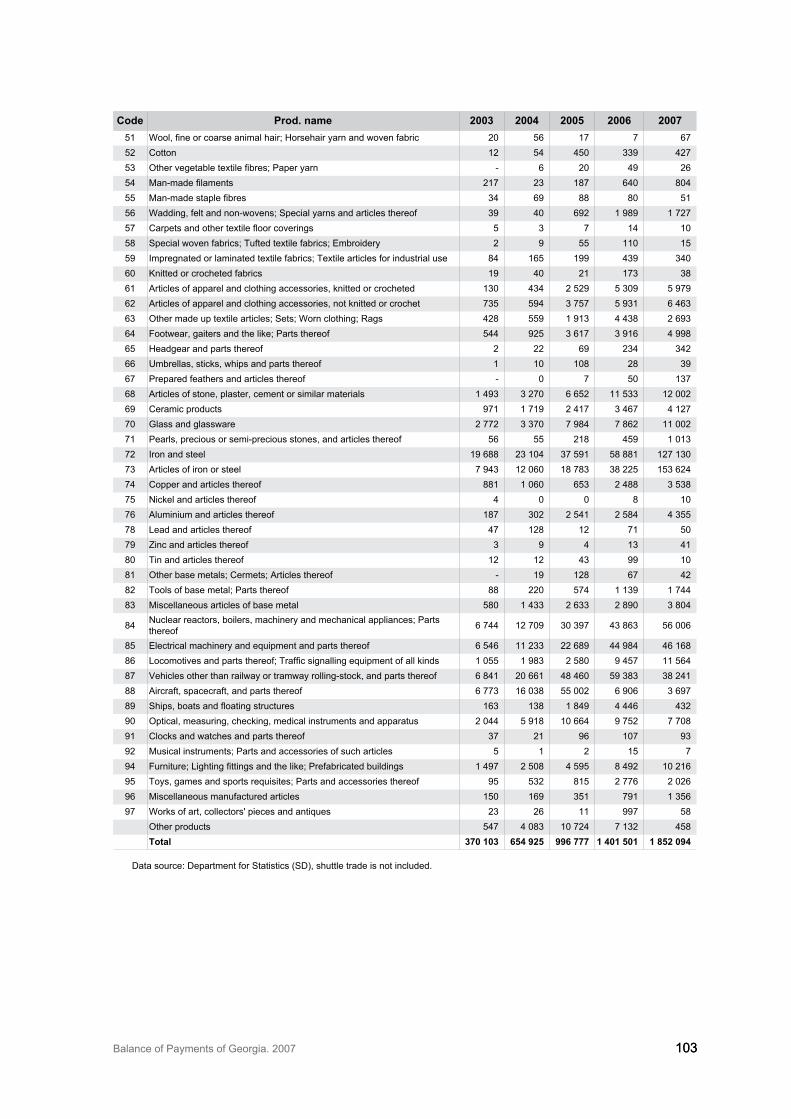
Balance of Payments of Georgia. 2007 10�10�
code prod. name 2003 2004 2005 2006 200751 Wool, fine or coarse animal hair; Horsehair yarn and woven fabric 20 56 17 7 6752 Cotton 12 54 450 ��9 4275� Other vegetable textile fibres; Paper yarn - 6 20 49 2654 Manmade filaments 217 2� 187 640 80455 Manmade staple fibres �4 69 88 80 5156 Wadding, felt and non-wovens; Special yarns and articles thereof �9 40 692 1 989 1 72757 Carpets and other textile floor coverings 5 � 7 14 1058 Special woven fabrics; Tufted textile fabrics; Embroidery 2 9 55 110 1559 Impregnated or laminated textile fabrics; Textile articles for industrial use 84 165 199 4�9 �4060 Knitted or crocheted fabrics 19 40 21 17� �861 Articles of apparel and clothing accessories, knitted or crocheted 1�0 4�4 2 529 5 �09 5 97962 Articles of apparel and clothing accessories, not knitted or crochet 7�5 594 � 757 5 9�1 6 46�6� Other made up textile articles; Sets; Worn clothing; Rags 428 559 1 91� 4 4�8 2 69�64 Footwear, gaiters and the like; Parts thereof 544 925 � 617 � 916 4 99865 Headgear and parts thereof 2 22 69 2�4 �4266 Umbrellas, sticks, whips and parts thereof 1 10 108 28 �967 Prepared feathers and articles thereof - 0 7 50 1�768 Articles of stone, plaster, cement or similar materials 1 49� � 270 6 652 11 5�� 12 00269 Ceramic products 971 1 719 2 417 � 467 4 12770 Glass and glassware 2 772 � �70 7 984 7 862 11 00271 Pearls, precious or semi-precious stones, and articles thereof 56 55 218 459 1 01�72 Iron and steel 19 688 2� 104 �7 591 58 881 127 1�07� Articles of iron or steel 7 94� 12 060 18 78� �8 225 15� 62474 Copper and articles thereof 881 1 060 65� 2 488 � 5�875 Nickel and articles thereof 4 0 0 8 1076 Aluminium and articles thereof 187 �02 2 541 2 584 4 �5578 Lead and articles thereof 47 128 12 71 5079 Zinc and articles thereof � 9 4 1� 4180 Tin and articles thereof 12 12 4� 99 1081 Other base metals; Cermets; Articles thereof - 19 128 67 4282 Tools of base metal; Parts thereof 88 220 574 1 1�9 1 7448� Miscellaneous articles of base metal 580 1 4�� 2 6�� 2 890 � 804
84 Nuclear reactors, boilers, machinery and mechanical appliances; Parts thereof 6 744 12 709 �0 �97 4� 86� 56 006
85 Electrical machinery and equipment and parts thereof 6 546 11 2�� 22 689 44 984 46 16886 Locomotives and parts thereof; Traffic signalling equipment of all kinds 1 055 1 98� 2 580 9 457 11 56487 Vehicles other than railway or tramway rolling-stock, and parts thereof 6 841 20 661 48 460 59 �8� �8 24188 Aircraft, spacecraft, and parts thereof 6 77� 16 0�8 55 002 6 906 � 69789 Ships, boats and floating structures 16� 1�8 1 849 4 446 4�290 Optical, measuring, checking, medical instruments and apparatus 2 044 5 918 10 664 9 752 7 70891 Clocks and watches and parts thereof �7 21 96 107 9�92 Musical instruments; Parts and accessories of such articles 5 1 2 15 794 Furniture; Lighting fittings and the like; Prefabricated buildings 1 497 2 508 4 595 8 492 10 21695 Toys, games and sports requisites; Parts and accessories thereof 95 5�2 815 2 776 2 02696 Miscellaneous manufactured articles 150 169 �51 791 1 �5697 Works of art, collectors' pieces and antiques 2� 26 11 997 58
Other products 547 4 08� 10 724 7 1�2 458 total 370 103 654 925 996 777 1 401 501 1 852 094
Data source: Department for Statistics (SD), shuttle trade is not included.

3/5 Leonidze Str., Tbilisi 0105, GeorgiaTel: 442 544; Fax: +(995 32) 442 577
E-mail: [email protected]; www.nbg.gov.ge