Strategi Report - bankofgeorgiagroup.com of Georgia... · Strategi Report Overview ANNUAL REPORT...
147
Transcript of Strategi Report - bankofgeorgiagroup.com of Georgia... · Strategi Report Overview ANNUAL REPORT...
01Annual Report 2018 Bank of Georgia Group PLC
Strategic ReportStrategy
Strategic ReportPerformance Governance
FinancialStatements
AdditionalInformation
Strategic ReportOverview
AN
NU
AL
REP
OR
T 20
18
About us
Bank of Georgia Group PLC
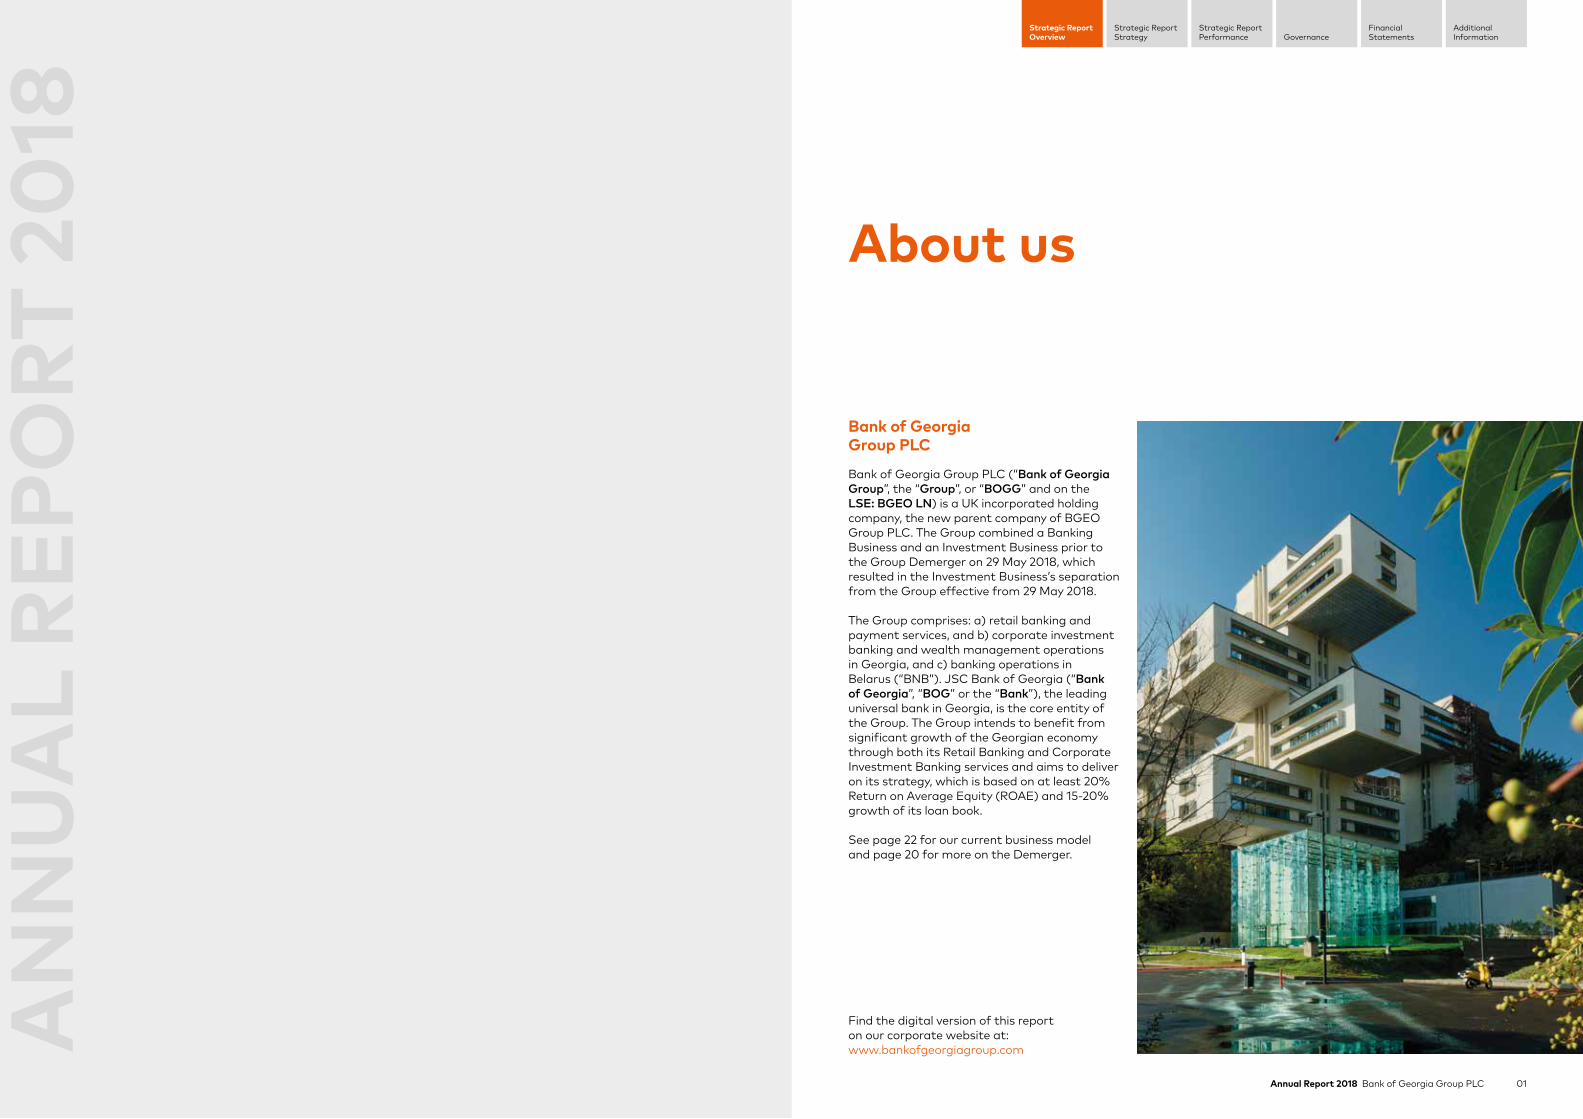
Bank of Georgia Group PLC (“Bank of Georgia Group”, the “Group”, or “BOGG” and on the LSE: BGEO LN) is a UK incorporated holding company, the new parent company of BGEO Group PLC. The Group combined a Banking Business and an Investment Business prior to the Group Demerger on 29 May 2018, which resulted in the Investment Business’s separation from the Group effective from 29 May 2018.
The Group comprises: a) retail banking and payment services, and b) corporate investment banking and wealth management operations in Georgia, and c) banking operations in Belarus (“BNB”). JSC Bank of Georgia (“Bank of Georgia”, “BOG” or the “Bank”), the leading universal bank in Georgia, is the core entity of the Group. The Group intends to benefit from significant growth of the Georgian economy through both its Retail Banking and Corporate Investment Banking services and aims to deliver on its strategy, which is based on at least 20% Return on Average Equity (ROAE) and 15-20% growth of its loan book.
See page 22 for our current business model and page 20 for more on the Demerger.
Find the digital version of this report on our corporate website at: www.bankofgeorgiagroup.com
03Annual Report 2018 Bank of Georgia Group PLCAnnual Report 2018 Bank of Georgia Group PLC02
Strategic ReportStrategy
Strategic ReportPerformance Governance
FinancialStatements
AdditionalInformation
Strategic ReportOverview
ContentsStrategic Report 01-101
OverviewFinancial Highlights 04Operating Highlights 05At a Glance 06Chairman’s Statement 10Chief Executive Officer’s Statement 12
StrategyIndustry and Market Overview 14Group History 20Current Business Model and Strategy 22Delivering on Current Strategy 23Superior Access to Funding 42Key Performance Indicators 44Risk Management 48Principal Risks and Uncertainties 60Going Concern and Viability Statements 68Resources and Responsibilities 70
PerformanceOverview of Financial Results 86
Governance 102-153
Directors’ Governance Overview 103Shareholder and Stakeholder Engagement 110Board of Directors 111Executive Management 115Nomination Committee Report 117Audit Committee Report 121Risk Committee Report 126Directors’ Remuneration Report 129Statement of Directors’ Responsibilities 149Directors’ Report 150
Financial Statements 154-283
Independent Auditor’s Report 155Consolidated Statement of Financial Position 166Consolidated Income Statement 167Consolidated Statement of Comprehensive Income 169Consolidated Statement of Changes in Equity 170Consolidated Statement of Cash Flows 172Separate Statement of Financial Position 174Separate Statement of Changes in Equity 175Separate Statement of Cash Flows 176Notes to Consolidated and Separate Company Financial Statements 177
Additional Information 284-288
Abbreviations 285References 286Glossary 287Shareholder Information 288
04 Annual Report 2018 Bank of Georgia Group PLC 05Annual Report 2018 Bank of Georgia Group PLC
Strategic ReportStrategy
Strategic ReportPerformance Governance
FinancialStatements
AdditionalInformation
Strategic ReportOverview
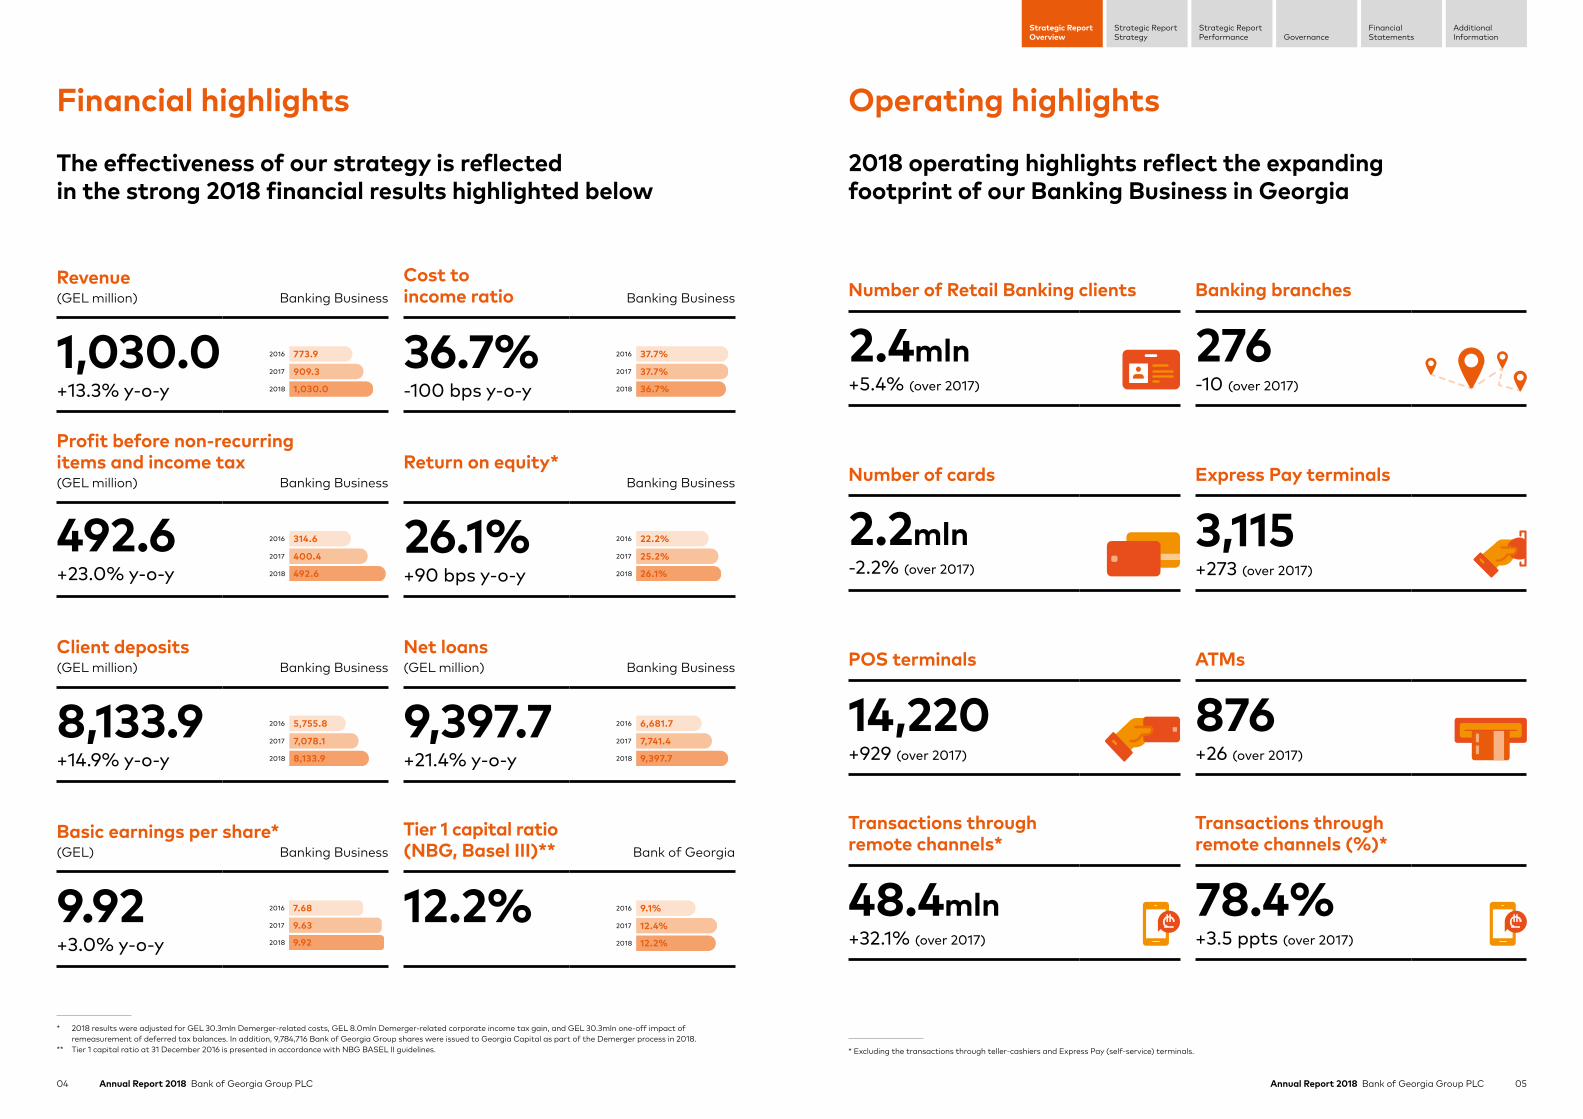
Operating highlights
2018 operating highlights reflect the expanding footprint of our Banking Business in Georgia
Financial highlights
The effectiveness of our strategy is reflected in the strong 2018 financial results highlighted below
* 2018 results were adjusted for GEL 30.3mln Demerger-related costs, GEL 8.0mln Demerger-related corporate income tax gain, and GEL 30.3mln one-off impact of remeasurement of deferred tax balances. In addition, 9,784,716 Bank of Georgia Group shares were issued to Georgia Capital as part of the Demerger process in 2018.
** Tier 1 capital ratio at 31 December 2016 is presented in accordance with NBG BASEL II guidelines. * Excluding the transactions through teller-cashiers and Express Pay (self-service) terminals.
Revenue Cost to income ratio(GEL million) Banking Business Banking Business
1,030.0+13.3% y-o-y
773.9
909.3
1,030.02018
2017
2016 36.7%-100 bps y-o-y
37.7%
37.7%
36.7%2018
2017
2016
Profit before non-recurring items and income tax Return on equity*(GEL million) Banking Business Banking Business
492.6+23.0% y-o-y
314.6
400.4
492.62018
2017
2016 26.1%+90 bps y-o-y
22.2%
25.2%
26.1%2018
2017
2016
Client deposits Net loans(GEL million) Banking Business (GEL million) Banking Business
8,133.9+14.9% y-o-y
5,755.8
7,078.1
8,133.92018
2017
2016 9,397.7+21.4% y-o-y
6,681.7
7,741.4
9,397.72018
2017
2016
Basic earnings per share* Tier 1 capital ratio (NBG, Basel III)**(GEL) Banking Business Bank of Georgia
9.92+3.0% y-o-y
7.68
9.63
9.922018
2017
2016 12.2%
9.1%
12.4%
12.2%2018
2017
2016
Number of Retail Banking clients Banking branches
2.4mln+5.4% (over 2017)
276-10 (over 2017)
Number of cards Express Pay terminals
2.2mln-2.2% (over 2017)
3,115+273 (over 2017)
POS terminals ATMs
14,220+929 (over 2017)
876+26 (over 2017)
Transactions through remote channels*
Transactions through remote channels (%)*
48.4mln+32.1% (over 2017)
78.4% +3.5 ppts (over 2017)

07Annual Report 2018 Bank of Georgia Group PLC
Strategic ReportStrategy
Strategic ReportPerformance Governance
FinancialStatements
AdditionalInformation
Strategic ReportOverview
Annual Report 2018 Bank of Georgia Group PLC06
At a Glance We are the leading retail banking player in Georgia, serving more than 2.4 million customers through the widest network of 271 retail branches, 876 ATMs and 3,115 Express Pay (self-service) terminals, a sales force of more than 3,000 people, along with our diverse products and services. Our Retail Banking business, the prominent component of our business, runs a client-centric, multi-brand strategy, which reaches the entire spectrum of retail customers through three well-established and recognised brands:
Expressdesigned to service emerging retail customers with minimal incremental operational costs through cost-efficient distance channels such as our Express Pay terminals, internet and mobile banking and technology-intensive Express branches.
Bank of Georgiaproviding long-established traditional banking services to our mass retail clients.
SOLOtargeting mass affluent customers and providing a unique blend of banking and lifestyle products and services.
MSMEBank of Georgia serves micro, small and medium-sized enterprises (MSME) through two respectively dedicated segments under the Retail Banking business. By the end of 2018, our MSME client base grew to 195,230 customers.
Retail BankingClient-centric, multi-brand strategy for more than 2.4 million clients
Gross loan book(GEL billion) Market share*
6.4+24.5% y-o-y
37.5%
Client deposits(GEL billion) Market share*
4.3+32.8% y-o-y
36.9%
* Market shares by loans and by deposits to individuals, respectively.
08 Annual Report 2018 Bank of Georgia Group PLC 09Annual Report 2018 Bank of Georgia Group PLC
Strategic ReportStrategy
Strategic ReportPerformance Governance
FinancialStatements
AdditionalInformation
Strategic ReportOverview
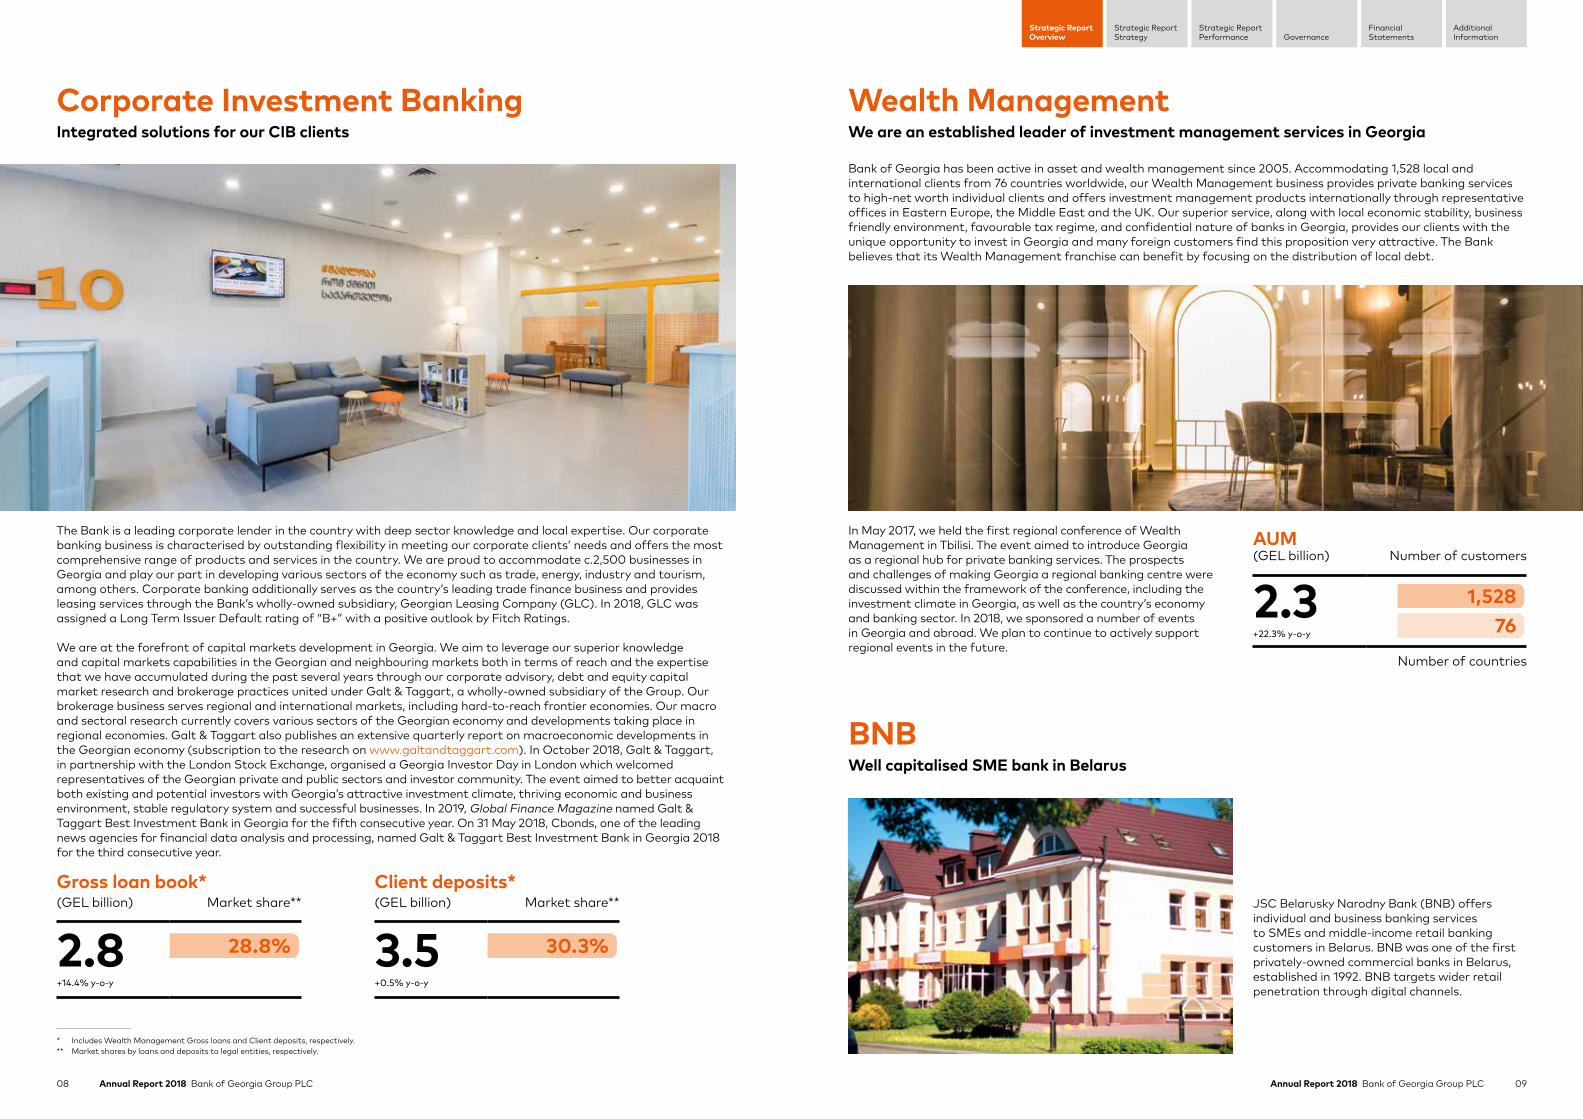
The Bank is a leading corporate lender in the country with deep sector knowledge and local expertise. Our corporate banking business is characterised by outstanding flexibility in meeting our corporate clients’ needs and offers the most comprehensive range of products and services in the country. We are proud to accommodate c.2,500 businesses in Georgia and play our part in developing various sectors of the economy such as trade, energy, industry and tourism, among others. Corporate banking additionally serves as the country’s leading trade finance business and provides leasing services through the Bank’s wholly-owned subsidiary, Georgian Leasing Company (GLC). In 2018, GLC was assigned a Long Term Issuer Default rating of “B+” with a positive outlook by Fitch Ratings.
We are at the forefront of capital markets development in Georgia. We aim to leverage our superior knowledge and capital markets capabilities in the Georgian and neighbouring markets both in terms of reach and the expertise that we have accumulated during the past several years through our corporate advisory, debt and equity capital market research and brokerage practices united under Galt & Taggart, a wholly-owned subsidiary of the Group. Our brokerage business serves regional and international markets, including hard-to-reach frontier economies. Our macro and sectoral research currently covers various sectors of the Georgian economy and developments taking place in regional economies. Galt & Taggart also publishes an extensive quarterly report on macroeconomic developments in the Georgian economy (subscription to the research on www.galtandtaggart.com). In October 2018, Galt & Taggart, in partnership with the London Stock Exchange, organised a Georgia Investor Day in London which welcomed representatives of the Georgian private and public sectors and investor community. The event aimed to better acquaint both existing and potential investors with Georgia’s attractive investment climate, thriving economic and business environment, stable regulatory system and successful businesses. In 2019, Global Finance Magazine named Galt & Taggart Best Investment Bank in Georgia for the fifth consecutive year. On 31 May 2018, Cbonds, one of the leading news agencies for financial data analysis and processing, named Galt & Taggart Best Investment Bank in Georgia 2018 for the third consecutive year.
JSC Belarusky Narodny Bank (BNB) offers individual and business banking services to SMEs and middle-income retail banking customers in Belarus. BNB was one of the first privately-owned commercial banks in Belarus, established in 1992. BNB targets wider retail penetration through digital channels.
Corporate Investment BankingIntegrated solutions for our CIB clients
Wealth ManagementWe are an established leader of investment management services in Georgia
BNBWell capitalised SME bank in Belarus
Bank of Georgia has been active in asset and wealth management since 2005. Accommodating 1,528 local and international clients from 76 countries worldwide, our Wealth Management business provides private banking services to high-net worth individual clients and offers investment management products internationally through representative offices in Eastern Europe, the Middle East and the UK. Our superior service, along with local economic stability, business friendly environment, favourable tax regime, and confidential nature of banks in Georgia, provides our clients with the unique opportunity to invest in Georgia and many foreign customers find this proposition very attractive. The Bank believes that its Wealth Management franchise can benefit by focusing on the distribution of local debt.
In May 2017, we held the first regional conference of Wealth Management in Tbilisi. The event aimed to introduce Georgia as a regional hub for private banking services. The prospects and challenges of making Georgia a regional banking centre were discussed within the framework of the conference, including the investment climate in Georgia, as well as the country’s economy and banking sector. In 2018, we sponsored a number of events in Georgia and abroad. We plan to continue to actively support regional events in the future.
AUM(GEL billion) Number of customers
2.3+22.3% y-o-y
1,52876
Number of countries
* Includes Wealth Management Gross loans and Client deposits, respectively.** Market shares by loans and deposits to legal entities, respectively.
Gross loan book*(GEL billion) Market share**
2.8+14.4% y-o-y
28.8%
Client deposits*(GEL billion) Market share**
3.5+0.5% y-o-y
30.3%

10 Annual Report 2018 Bank of Georgia Group PLC 11Annual Report 2018 Bank of Georgia Group PLC
Strategic ReportStrategy
Strategic ReportPerformance Governance
FinancialStatements
AdditionalInformation
Strategic ReportOverview
Dear Shareholders,
This is my first letter writing as the Chairman of the Board of Directors of Bank of Georgia Group PLC with it being an independent entity. This time last year, the Group was still part of the BGEO Group. In May 2018, the shareholder-approved demerger of BGEO Group was completed, creating two independent entities – Bank of Georgia Group and Georgia Capital. As a result of the demerger, Irakli Gilauri, former CEO of BGEO Group, moved to lead Georgia Capital and Kaha Kiknavelidze became the CEO of the newly-independent Bank of Georgia Group.
We are grateful to Kaha for steering us successfully through the transition period following the demerger. Thanks to his steady leadership, the Group continued to produce solid results for the year and this is presented in more detail further on in the report. We are very thankful that, although stepping down from his role as CEO, Kaha will remain as an adviser to the organisation.
In January 2019, Archil Gachechiladze was appointed as the new CEO of the Group. He is familiar with the institution, having previously led the corporate bank and our investment bank, Galt & Taggart, both successfully. Most recently he served as CEO of Georgian Global Utilities (GGU), the Georgian water utility and renewables business, where he proved to be an excellent business builder, dealmaker and leader. We believe that he will bring these qualities to the Group. We are confident that he has the vision, entrepreneurialism and leadership, both internally and in the marketplace, that will ensure Bank of Georgia continues to be innovative and distinguished from many other institutions.
The Group is currently entering a new era. It is learning to operate as a flexible, technology-enabled information business. It is changing its culture from an execution-based organisation to one where its people are developing and contributing both ideas and services. It is refocusing on the needs of its clients. In summary, it aims to become a more entrepreneurial growth organisation.
Archil and the Board have agreed on the following mandate:
1. Develop a long-term growth strategy, ensuring that Bank of Georgia Group has the leading position in Georgia (not just in terms of financial profitability, but also in innovative developments, digital leadership, and regional wealth management) – whilst maintaining its sound risk management practices;
2. Play a prominent role in the Georgian market and economy – ensuring sustainable development for both our institution and the country; and
3. Work with the Executive Management team to model what an agile and entrepreneurial culture is and spread this culture to the entire organisation. In short, we aim to make talent development a top priority for the Group.
The whole Board and I commit to doing everything we can to ensure Archil succeeds.
With regard to the Board, we invited two new independent members to join us in 2018 – Véronique McCarroll and Andreas Wolf. You can find their biographies on page 114. They are both heavily involved in the digital financial world – a clear priority for us. Véronique is Director of Digital Strategy with the French telecom operator Orange, and Andreas is leading the scale-up of the banking subsidiary of Raisin, a leading European FinTech company. Both also bring significant banking experience, Véronique in risk management and Andreas in lean and digital transformation. Véronique is also our second female Board member – the number that we had promised to reach and which we would like to exceed in the future.
Our Board stands today at eight non-executive members – a good number to conduct vigorous strategic and operational discussions. The Board members have a wide range of experiences and backgrounds that facilitate rich debate, as each member contributes his or her knowledge from their own area of competence and expertise. This diversity supports the ethos of strong corporate governance that is an essential part of the Board’s mandate. We encourage critical opinions, which we feel are an essential part of good governance and too easily overlooked when things are going well. We are able to reach consensus on major decisions after weighing the contributions from all members. My role as a Chairman of the Board is to set an agenda, foster discussions, frame the issues, and encourage a search for optimal solutions.
As I did when I was Chair of BGEO Group, I will say a word on the economy and Georgia’s political environment.
Economically, Georgia has continued its decade-long track record of strong economic performance, with a 4.7% real GDP growth in 2018 with similar expectations for the next few years. This performance evidences that Georgia has a resilient economy capable of weathering conflicts in neighbouring countries, volatility in commodity prices, and general global crises. This resilience is undoubtedly due to the economic reforms that successive governments have put in place in order to create a business-friendly environment. Moreover, the present government has worked hard to promote good and competent governance in the country. Additionally, the National Bank of Georgia strives to enhance corporate governance and reduce systemic risks in the sector. In the case of our Group, these efforts took the form of support and encouragement when we announced our decision to clearly separate the Banking and Investment Businesses of the BGEO Group – a move that made sense for us and for Georgia.
On the foreign policy front, the Deep and Comprehensive Free Trade Agreement (DCFTA) signed with the European Union and the Free Trade Agreement with China are already contributing to economic growth. Georgia is working year after year to stand out in the region with political stability and economic performance and become a regional hub in terms of trade, transport, logistics and tourism. The IMF, the EBRD and other development finance institutions have positively spoken about Georgia and consider the country to be a bright star in this part of the world.
Of course, challenges remain. Although poverty is receding, the gap between rich and poor increases. Growing inequality often has political implications in democracies and needs to be addressed by both the Government and the banking sector.
On the political front, 2018 saw the election of a new President – Salome Zurabishvili – the first female President of Georgia. Although the presidency is a largely symbolic role, the election was hotly contested and Zurabishvili won in the end, but only after a vigorous campaign. On the positive side, one notes that Georgia enjoys a free press and lively democratic debates. On the negative side, indications of dissatisfaction from a large part of the electorate bodes for highly contested parliamentary elections in 2020. We must not forget that Georgia has already seen a peaceful change of government in 2012 and has already demonstrated an ability to change governing parties without a break-up in the political process. Fortunately for economic growth, the pro-business policies of both parties and their view of foreign policy, remain remarkably similar. It is that consistency and stability that have underpinned the growth of the economy over the last decade.
Georgia continues to aspire to join the European Union and NATO. In both cases, the process is more important than the destination. However, an overwhelming percentage of the population supports the move towards integration with Europe and this is also supported by the European Union and the United States. It is a delicate balance that Georgia has played well thus far. Russian tourists can come to Georgia visa-free and their numbers continue to increase every year (up 23.8% in 2018). Moreover, Russian businesses can operate in Georgia as freely as any other. Georgia enjoys low corruption levels, free press, economic growth and democracy and often ranks as high in all aspects as major Europeans countries. Georgia’s continued progress on the path of democracy and economic growth represents a very attractive risk to reward opportunity for investors. Moreover, Bank of Georgia, with the strength of its balance sheet, focus on RAOE, commitment to Georgia and long track record of strong governance, is an ideal investment vehicle.
Neil JaninChairman27 March 2019
Chairman’s StatementNeil JaninChairman
12 Annual Report 2018 Bank of Georgia Group PLC 13Annual Report 2018 Bank of Georgia Group PLC
Strategic ReportStrategy
Strategic ReportPerformance Governance
FinancialStatements
AdditionalInformation
Strategic ReportOverview
I have recently joined Bank of Georgia Group as CEO, having previously served in Georgia Capital, which itself was part of the same group until not long ago. In my first letter to you I would like to say a few words about last year’s performance, the environment in which we operate and the organisation which I am honoured to be serving.
During 2018, the Group delivered another period of strong balance sheet and fee income growth, combined with superior profitability, achieved as a result of excellent franchise growth and good cost management in both the Retail and Corporate Investment Banking businesses. For the full year, the Group’s revenues totalled GEL 1,030.4 million, an increase of 14.5%, and profit before non-recurring items and income tax increased by 25.1% to GEL 494.7 million. The Group’s capability to deliver strong Return on Average Equity continues, and ROAE exceeded 25% for the full year, compared to a medium-term target of more than 20%.
From a macroeconomic perspective, Georgia continues to produce strong real GDP growth – 4.7% in 2018 – primarily driven by private sector investments, with inflation remaining well contained at 1.5% in December 2018, which is comfortably below the National Bank of Georgia’s (NBG) medium-term target of 3.0%. The Government’s prudent macroeconomic policies continue to serve the country well, and the economy has remained extremely resilient to pressures in neighbouring countries and to some volatility in regional financial markets.
Hard currency income has been strong for the country. Especially strong has been revenue from tourism, totalling US$3.2 billion during the year and reaching almost 20% of GDP. Solid external inflows have enabled the NBG to continue to buy US Dollars and accumulate foreign
currency reserves to a record US$3.3 billion in December 2018. Since the year-end, the NBG has continued to accumulate reserves, which now total US$3.5 billion. Perhaps most significantly, the country recorded its first ever current account surplus in the third quarter of 2018 – an extremely positive macroeconomic development for Georgia. It was also a positive development recently when Fitch Ratings upgraded Georgia’s credit rating – an upgrade that we hope will soon filter through to Bank of Georgia’s credit rating.
Strong franchise growth in Retail Banking led to more than 24.2% customer lending growth and 32.8% client deposit growth year-on-year. On a constant currency basis, customer lending growth was still strong at 22.3% year-on-year. The Retail Banking’s clear focus over the last few quarters has been on growing the mortgage and SME portfolios more rapidly than the unsecured consumer lending portfolios, and loan originations in these portfolios have been extremely strong. Over the last 12 months, the mortgage portfolio increased by 48.8%, while SME portfolio growth totalled 25.1%.
Our customers are increasingly becoming more demanding, as convenience becomes ever more important. It was therefore pleasing to see the Retail Banking client base continue to expand, reflecting the success of the Bank’s digital penetration growth and the increased use of more cost-efficient remote channels. As a result, the Retail Bank now has more than 2.4 million customers – an increase of more than 125,000 customers over the last 12 months. Our fully transformed, user-friendly, multi-feature mobile banking application, mBank, has had nearly 600,000 downloads during the last two years. In addition, we comfortably exceeded our targeted 40,000 SOLO clients by the end of 2018, with over
44,000 clients now benefiting from SOLO’s lifestyle banking proposition. We moved from a product-focused to a client-centric approach and, going forward, we will strengthen this focus on client centricity. We are increasingly incorporating customer feedback into our products and services in the shortest timeframe possible, thus building our focus on driving customer satisfaction as a key core competency.
We also continued to deliver strong progress in the Corporate Investment Banking (CIB) business, and lending growth is now more balanced between Retail and Corporate Investment Banking. Customer lending in CIB grew by 15.9% year-on-year. In addition, we have made further progress in reducing concentration risk in CIB by decreasing the concentration of our top ten corporate borrowers to only 9.8% of our lending portfolio. This stronger lending growth in CIB has also supported much improved net fee and commission income, which, during 2018, increased by 17.4% and has contributed to almost 30% growth in profit before non-recurring items and income tax.
Our increasing focus on lending in the mortgage segment and to finer margin corporate and SME clients has however led to a negative mix effect on overall loan yields and on the net interest margin, which was reduced by 80 basis points year-on-year to 6.5%. This shift in product mix, which we expect to continue during 2019, improves our asset quality metrics and, particularly in the case of the mortgage portfolio, reduces the risk-asset and capital intensity of our lending growth. This enables us to support the Group’s return on equity and superior profitability profile. Individual product loan yields have continued to remain broadly stable, and we expect this trend to continue into 2019. Costs remain well controlled, and the Banking Business delivered positive operating leverage of 2.9 percentage points in 2018. In 2018, the Bank introduced project “Lean”, which has already started to improve back office procedures, and contribute to end-to-end process optimisation in the mortgage business. Over the last 12 months, the cost to income ratio has improved from 37.7% in 2017, to 36.7% in 2018. This focus on delivering positive operating leverage will continue, leading to further expected improvements in our cost to income ratio.
Asset quality continues to improve, reflecting our good lending discipline and the ongoing strength of the economy. The full year cost of credit risk ratio was 1.6%, a significant improvement from 2.2% in 2017. The NPLs to gross loans ratio was 3.3% at the end of December 2018 – 50 basis points lower than a year ago. The coverage ratios remain robust and we expect asset quality and credit metrics to remain strong over the medium term, particularly as our product portfolio mix shifts more towards higher quality lending portfolios, such as the mortgage portfolio.
The Group’s capital and funding position remains strong. The NBG (Basel III) total capital adequacy ratio increased by 70 basis points during the fourth quarter 2018 to 16.6%, and the NBG (Basel III) Tier 1 capital adequacy ratio was 12.2%. Our capital ratios are comfortably ahead of our regulatory minimum requirement. We continue to generate significant levels of internal capital as a result of both the Bank’s high return on average equity and the improved risk asset intensity of our lending growth.
Over the medium term, we will focus on managing our capital ratios c.200 basis points over the minimum regulatory requirements. I was also very pleased, in March 2019, to successfully price a US$100 million offering of Additional Tier 1 Capital notes to further improve our capital base.
During the last 12 months, the banking sector in Georgia has been working with the NBG to implement a number of regulatory changes, which we agree with, relating to retail lending. Namely, caps on payment-to-income and loan-to-value ratios have been updated and the GEL 100,000 limit, below which the loans must be issued in Georgian Lari, increased to GEL 200,000. In addition, Basel III capital adequacy requirements have been put in place. All of these changes have now been introduced with the expectation that Georgian banks will shift towards local currency lending to corporates, the SME sector and the mortgage sector, and further de-dollarise their balance sheets.
As a result of the recent policy changes, we anticipate growth rates in the unsecured consumer sector to moderate, although we continue to expect to deliver solid growth in mortgages, particularly Lari mortgages and SME lending. Overall, with the strong rates of growth already delivered in 2018, we now expect customer lending growth for the medium to long term to be within our 15-20% expected growth range, with lending growth expectations over the next 12 months to be closer to 15%. This is expected to be supported by further strong levels of economic growth in the country and underpinned by the Government accelerating capital expenditure, which we expect to have a high private sector investment multiplier.
At the 2019 Annual General Meeting, the Board intends to recommend a final dividend for 2018 of GEL 2.55 per share payable in British Pounds Sterling at the prevailing rate. This represents a payout ratio of 30% – well in the range of our dividend payout ratio target of 25-40% and a 4.5% increase over the dividend paid after the Demerger.
Overall, the Group has delivered another year of strong franchise and earnings growth. The returns continue to be high and the Group remains very well positioned to continue to deliver good momentum and high returns. In particular, I expect to deliver this progress at the same time as we have a clear focus on the common values that unite all key stakeholder groups in Bank of Georgia: our customers, employees, management and shareholders.
Sincerely yours,
Archil Gachechiladze Chief Executive Officer27 March 2019
Chief Executive Officer’s StatementArchil GachechiladzeChief Executive Officer
This Strategic Report as set out on pages 01 to 101 was approved by the Board of Directors on 27 March 2019 and signed on its behalf by
Archil Gachechiladze Chief Executive Officer27 March 2019

15Annual Report 2018 Bank of Georgia Group PLC
Strategic ReportStrategy
Strategic ReportPerformance Governance
FinancialStatements
AdditionalInformation
Strategic ReportOverview
Annual Report 2018 Bank of Georgia Group PLC14
Industry andMarket Overview
Global top-reformerGeorgia is an open and resilient emerging market. The country maintains its global top-reformer status in pro-business measures from the World Bank. Currently, efforts are directed towards fully integrating the Georgian economy into the global economy in order to fully reap the benefits from the comprehensive reforms that the country undergoes.
Ease of Doing Business index ranks Georgia in 2019
In starting a business In protecting minority investors
In registering property Overall ranking*
2nd 2nd 4th 6th* Up from 9th in 2018, ahead of Norway, the US and the UK Source: World Bank Doing Business
Economic Freedom Index ranked Georgia in 2019
Corruption Perceptions Index in 2018
16th 41st Unchanged from 2018, ahead of Luxembourg, Chile and Sweden
Source: Heritage Foundation
Ahead of the Italy, Slovakia and Croatia and leads the Eastern Europe and Central Asia region
Source: Transparency International 2018
16 Annual Report 2018 Bank of Georgia Group PLC 17Annual Report 2018 Bank of Georgia Group PLC
Strategic ReportStrategy
Strategic ReportPerformance Governance
FinancialStatements
AdditionalInformation
Strategic ReportOverview
Regional economic hubGeorgia is well positioned to become a regional economic hub with its business-friendly environment, developed infrastructure, stable energy supply, flexible labour legislation, sound banking sector, strategic geography and a Government committed to making structural improvements in the economy.
Georgia is a natural transport and logistics hub, connecting important regions and a market of 2.8 billion customers without customs duties. Georgia is located between land-locked energy-rich countries in the East and European markets in the West. The Anaklia deep sea project is seen as a major scheme to enhance the regional transit hub potential. The Port of Anaklia sits on the shortest route from China to Europe, the route that has become a major focal point for Chinese investments in infrastructure. Once completed, it will be the first Georgian port capable of accommodating Panamax size cargo vessels. The Government’s ongoing infrastructure investments and increased spending on roads, energy, tourism and municipal infrastructure will also reinforce the potential. Georgia is a regional energy corridor that accounts for approximately 1.6% of the world’s oil and gas supply transit volumes. Georgia’s existing free trade deals (with the EU, CIS, EFTA, Turkey, China, Hong Kong, and ongoing negotiations with India), enable it to access a market of 2.8 billion customers. These are expected to further strengthen Georgia’s positioning as a platform to trade with, produce for and service regional markets.
Georgia is already an established popular tourism destination. Travel inflows are a significant source of foreign currency for Georgia. The number of international visitors to Georgia is growing robustly, with tourist numbers already exceeding the local population of 3.7 million. In 2018, tourist arrivals reached 4.8 million, generating US$ 3.2 billion or 19.9% of GDP. The Government enhances Georgia’s positioning as a four- season tourism location through improved connectivity of different regions with an aim to tap into their potential.
Stable energy supply and electricity transit hub potential. Georgia has a developed, stable and competitively priced energy sector. The country has overcome the chronic energy shortages of electricity and gas supply interruptions of a decade ago by renovating and building new hydropower plants (HPPs), improving transmission infrastructure and diversifying its natural gas import partners. Energy needs of the country grew on average by 5.4% for electricity and by 3.5% for natural gas during 2004-2018. The needs are being addressed by constructing HPPs, renovating and rehabilitating internal and external electricity grid and natural gas pipelines. Currently, only an estimated 20-25% of Georgia’s hydro potential is utilised. Government policy over the last decade has encouraged the investment in the hydropower sector, resulting in 28 new HPPs, with a total capacity of 509.9MW, being added to the system over 2012-2017. The pipeline of investment projects in the energy sector is estimated at about US$ 4.4 billion in the next five to seven years, including US$ 2.5 billion for three large HPP projects:
Nenskra, Khudoni and Tskhenistskali cascade. Currently, 43 power plants (1.5GW) are in various stages of construction or development, with 102 more (3.7GW) in feasibility study stage. Georgia’s transmission capacity is poised to increase and accommodate an additional installed capacity of 3.5GW by 2027 to meet the growth in export and domestic demand. Georgia is foreseen to be an electricity transit hub for neighbouring economies. In 2016-2017, already 1,104GWh was transited through Georgia to neighbouring countries.
Attractive place for foreign investors. Foreign Direct Investment (FDI) is an important source of financing growth in Georgia, as well as a reliable source of Georgia’s persistently high current account deficit funding. Georgia’s business-friendly environment coupled with its sustainable growth prospects attracted substantial FDI, averaging 8.8% of GDP over the last decade. Major beneficiaries are transport, tourism, construction, financial and energy sectors. The EU remains a top-investor.
Georgia has not yet tapped into international markets. Despite growing free trade deals, Georgia’s exports are still dominated by used car re-exports and resource-based metals and minerals. Meanwhile, export is well diversified by destination markets with top export market (Azerbaijan) having only 15% share in total. One of the biggest changes in destination markets has been a reorientation from the Russian market after the 2005 embargo, as it forced Georgian producers to redirect exports to other Commonwealth of Independent States (CIS), the EU and the Middle East. Access to new large markets (the EU and China) could increase market penetration and there is also scope for diversifying agricultural exports, once the quality and standards improve under EU DCFTA.
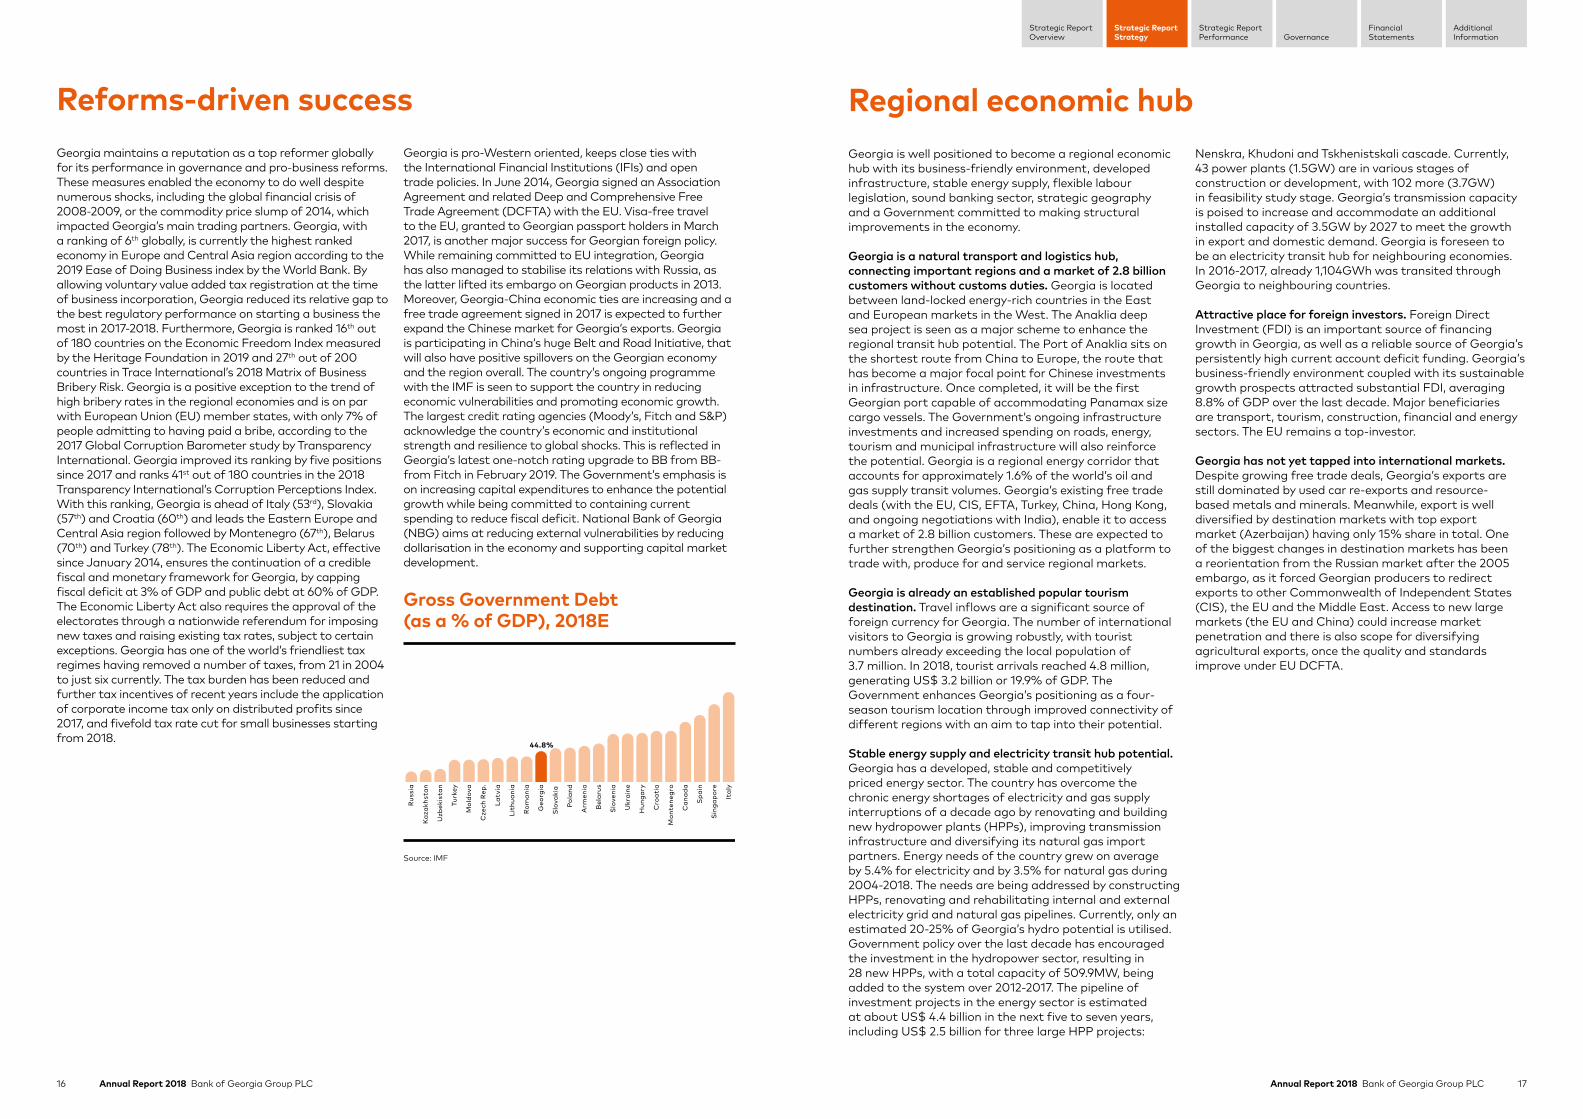
Reforms-driven successGeorgia maintains a reputation as a top reformer globally for its performance in governance and pro-business reforms. These measures enabled the economy to do well despite numerous shocks, including the global financial crisis of 2008-2009, or the commodity price slump of 2014, which impacted Georgia’s main trading partners. Georgia, with a ranking of 6th globally, is currently the highest ranked economy in Europe and Central Asia region according to the 2019 Ease of Doing Business index by the World Bank. By allowing voluntary value added tax registration at the time of business incorporation, Georgia reduced its relative gap to the best regulatory performance on starting a business the most in 2017-2018. Furthermore, Georgia is ranked 16th out of 180 countries on the Economic Freedom Index measured by the Heritage Foundation in 2019 and 27th out of 200 countries in Trace International’s 2018 Matrix of Business Bribery Risk. Georgia is a positive exception to the trend of high bribery rates in the regional economies and is on par with European Union (EU) member states, with only 7% of people admitting to having paid a bribe, according to the 2017 Global Corruption Barometer study by Transparency International. Georgia improved its ranking by five positions since 2017 and ranks 41st out of 180 countries in the 2018 Transparency International’s Corruption Perceptions Index. With this ranking, Georgia is ahead of Italy (53rd), Slovakia (57th) and Croatia (60th) and leads the Eastern Europe and Central Asia region followed by Montenegro (67th), Belarus (70th) and Turkey (78th). The Economic Liberty Act, effective since January 2014, ensures the continuation of a credible fiscal and monetary framework for Georgia, by capping fiscal deficit at 3% of GDP and public debt at 60% of GDP. The Economic Liberty Act also requires the approval of the electorates through a nationwide referendum for imposing new taxes and raising existing tax rates, subject to certain exceptions. Georgia has one of the world’s friendliest tax regimes having removed a number of taxes, from 21 in 2004 to just six currently. The tax burden has been reduced and further tax incentives of recent years include the application of corporate income tax only on distributed profits since 2017, and fivefold tax rate cut for small businesses starting from 2018.
Georgia is pro-Western oriented, keeps close ties with the International Financial Institutions (IFIs) and open trade policies. In June 2014, Georgia signed an Association Agreement and related Deep and Comprehensive Free Trade Agreement (DCFTA) with the EU. Visa-free travel to the EU, granted to Georgian passport holders in March 2017, is another major success for Georgian foreign policy. While remaining committed to EU integration, Georgia has also managed to stabilise its relations with Russia, as the latter lifted its embargo on Georgian products in 2013. Moreover, Georgia-China economic ties are increasing and a free trade agreement signed in 2017 is expected to further expand the Chinese market for Georgia’s exports. Georgia is participating in China’s huge Belt and Road Initiative, that will also have positive spillovers on the Georgian economy and the region overall. The country’s ongoing programme with the IMF is seen to support the country in reducing economic vulnerabilities and promoting economic growth. The largest credit rating agencies (Moody’s, Fitch and S&P) acknowledge the country’s economic and institutional strength and resilience to global shocks. This is reflected in Georgia’s latest one-notch rating upgrade to BB from BB- from Fitch in February 2019. The Government’s emphasis is on increasing capital expenditures to enhance the potential growth while being committed to containing current spending to reduce fiscal deficit. National Bank of Georgia (NBG) aims at reducing external vulnerabilities by reducing dollarisation in the economy and supporting capital market development.
Gross Government Debt (as a % of GDP), 2018E
Rus
sia
Kaz
akhs
tan
Uzb
ekis
tan
Turk
ey
Mol
dova
Cze
ch R
ep.
Latv
ia
Lith
uani
a
Rom
ania
Geo
rgia
Slo
vaki
a
Pol
and
Arm
enia
Bel
arus
Slo
veni
a
Ukr
aine
Hun
gary
Cro
atia
Mon
tene
gro
Can
ada
Spa
in
Sin
gapo
re
Ital
y
44.8%
Source: IMF

18 Annual Report 2018 Bank of Georgia Group PLC 19Annual Report 2018 Bank of Georgia Group PLC
Strategic ReportStrategy
Strategic ReportPerformance Governance
FinancialStatements
AdditionalInformation
Strategic ReportOverview
Non-performing loans, Latest – 2018
Cze
ch R
ep.
Lith
uani
a
Geo
rgia
Hun
gary
Turk
ey
Pol
and
Bel
arus
Rom
ania
Latv
ia
Arm
enia
Bul
gari
a
Kaz
akhs
tan
Bos
nia
& H
erz.
Rus
sia
Cro
atia
Por
tuga
l
11.7%11.1%
10.7%9.4%
8.7%
6.3%6.0%
4.1%4.0%3.0%2.7%
1.9%
5.6%
2.7%
8.8%
2.9%
Source: IMF
Real GDP growth: Georgia, CIS, Eastern Europe
-2
-1
0
1
2
3
4
5
6
7
8
2010 2015 2020F2011 2012 2013 2014 2016 2018E2017 2019F
Georgia CIS Eastern Europe E=Estimate F=Forecast
Source: IMF, Geostat
Currency weakening versus US Dollar
Eur
o
Arm
enia
Mol
dova
Geo
rgia
Rus
sia
Bel
arus
Kaz
akhs
tan
Aze
rbai
jan
Ukr
aine
Turk
ey
16.3%14.5%
55.5%53.9%52.1%52.0%45.3%
34.7%
18.7%
59.2%
Source: BloombergNote: US$ per unit of national currency, period 1-Aug-2014 – 30-Jan-2019
The Georgian economy in 2018 and beyondThe Georgian economy delivered a solid 4.7% growth in 2018 and was resilient to negative developments in Turkey. Exports surged 22.6% y-o-y, tourism revenues increased by 19.1% y-o-y. Similarly, remittances posted 13.9% y-o-y with a positive impact on private consumption. Improved consumer and business sentiments as well as solid banking sector credit portfolio growth supported economic activity.
Increased diversification of economic linkages insulates the country from negative economic shocks from any particular partner country. Russia and Turkey continue to remain the largest trading partners of Georgia and most of the tourists in Georgia arrive from these two countries. However, rising tourist revenues and remittances mostly from the EU, and growing exports to other countries enhance the economy’s resilience. External imbalances continue easing with current account (CA) deficit estimated at 8.0% of GDP in 2018, down from 8.8% of GDP in 2017. The fiscal deficit also improved to 2.5% of GDP in 2018, down from 2.9% of GDP in 2017. Notably, Georgia recorded its first ever CA surplus in 3Q18, coming in at 0.3% of GDP. This improvement was achieved without a fall in overall consumption level as imports posted growth, fully compensated by solid tourism revenues and goods exports.
Georgia’s flexible exchange rate continue to serve the country well. The currency remained relatively stable throughout 2018 despite the negative expectations coming from the collapse of the Turkish Lira. Despite this challenge, the NBG continued to build reserves with a purchase of nearly US$ 200 million in FX market, boosting international reserves to US$ 3.3 billion at the end of 2018.
The relative strength of the Georgian Lari, along with weak fiscal spending, slowed annual average inflation to 2.6% in 2018 from 6.0% in 2017. With inflation below 3.0% target, NBG responded to subdued inflationary pressures and cut the refinancing rate by 0.25bps to 7.0% in July 2018.
Economic growth proved resilient in 2018 and is projected at 4.6% in 2019 by IMF. Downside risks to the outlook stemming from weaker external demand and fresh regulations on banking sector can be mitigated by prudent macroeconomic policies, continued exchange rate flexibility, and reserve accumulation. Substantial increase in public capital expenditures is expected to support growth with positive spillovers on private investments. Ongoing reforms in various directions – pension reform, capital market development and business enhancing measures – are expected to further support investments, thus reinforcing the country’s economic potential. The IMF expects growth to average 5.2% annually in 2020-2023, making Georgia the fastest growing economy in the region.
Well capitalised banking sector with low non-performing loans (NPLs)The Georgian banking sector has been one of the faster growing sectors of the Georgian economy. The banking sector’s assets growth rate of 19.0% (ten-year CAGR) has far outperformed the nominal GDP growth rate for the same period. The banking sector is entirely privately-owned and quite concentrated, with the two largest banks accounting for 72.8% of the total assets as at the end of 2018. Prudent regulation and conservative oversight by the central bank resulted in stability and resilience of the financial sector during different shocks to the economy. The Georgian banking sector has remained profitable and maintained its credit ratings with a stable outlook even during multiple downgrades of other banks in the region in 2015-2016.
In 2018, the average capital adequacy ratio remained above 18%, the share of NPLs stood at 2.7% and the overall liquidity ratio remained high at close to 40%. Strong growth along with improved confidence supported the solid credit portfolio growth at 19.3% y-o-y in 2018. NBG’s measures helped the rapid de-dollarisation process in the banking sector with the deposit dollarisation reaching 63.1% and loan dollarisation – 56.9% in 2018, both down over 8 ppts since reform started in 2017. The penetration rates still remain low compared to advanced economies with the retail loans estimated at 35.6% of GDP and the total loans at 64.7% of GDP as of 2018 (and 55.7% of GDP for the deposits).
Due to NBG’s conservative regulations, liquidity and capitalisation rates in the banking sector have been historically high. Nevertheless, the sector’s profitability has remained robust at 23.0% return of equity over the past three years.
21Annual Report 2018 Bank of Georgia Group PLC
Strategic ReportStrategy
Strategic ReportPerformance Governance
FinancialStatements
AdditionalInformation
Strategic ReportOverview
Annual Report 2018 Bank of Georgia Group PLC20
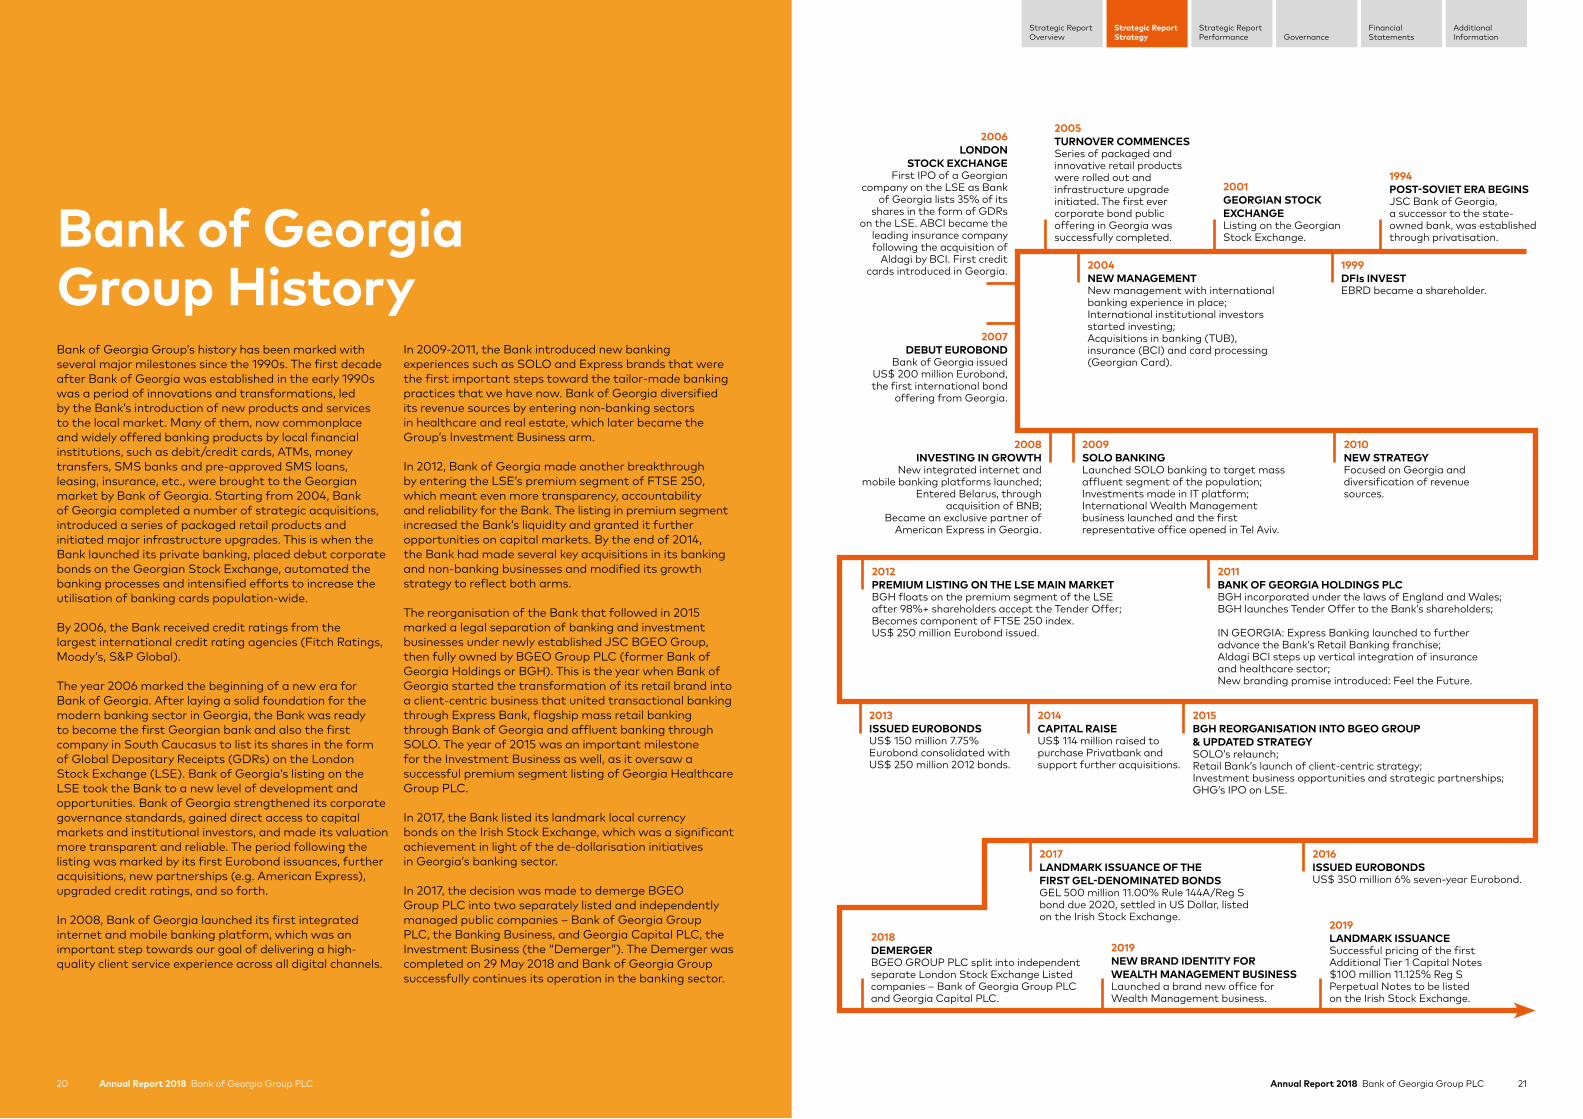
Bank of Georgia Group HistoryBank of Georgia Group’s history has been marked with several major milestones since the 1990s. The first decade after Bank of Georgia was established in the early 1990s was a period of innovations and transformations, led by the Bank’s introduction of new products and services to the local market. Many of them, now commonplace and widely offered banking products by local financial institutions, such as debit/credit cards, ATMs, money transfers, SMS banks and pre-approved SMS loans, leasing, insurance, etc., were brought to the Georgian market by Bank of Georgia. Starting from 2004, Bank of Georgia completed a number of strategic acquisitions, introduced a series of packaged retail products and initiated major infrastructure upgrades. This is when the Bank launched its private banking, placed debut corporate bonds on the Georgian Stock Exchange, automated the banking processes and intensified efforts to increase the utilisation of banking cards population-wide.
By 2006, the Bank received credit ratings from the largest international credit rating agencies (Fitch Ratings, Moody’s, S&P Global).
The year 2006 marked the beginning of a new era for Bank of Georgia. After laying a solid foundation for the modern banking sector in Georgia, the Bank was ready to become the first Georgian bank and also the first company in South Caucasus to list its shares in the form of Global Depositary Receipts (GDRs) on the London Stock Exchange (LSE). Bank of Georgia’s listing on the LSE took the Bank to a new level of development and opportunities. Bank of Georgia strengthened its corporate governance standards, gained direct access to capital markets and institutional investors, and made its valuation more transparent and reliable. The period following the listing was marked by its first Eurobond issuances, further acquisitions, new partnerships (e.g. American Express), upgraded credit ratings, and so forth.
In 2008, Bank of Georgia launched its first integrated internet and mobile banking platform, which was an important step towards our goal of delivering a high- quality client service experience across all digital channels.
In 2009-2011, the Bank introduced new banking experiences such as SOLO and Express brands that were the first important steps toward the tailor-made banking practices that we have now. Bank of Georgia diversified its revenue sources by entering non-banking sectors in healthcare and real estate, which later became the Group’s Investment Business arm.
In 2012, Bank of Georgia made another breakthrough by entering the LSE’s premium segment of FTSE 250, which meant even more transparency, accountability and reliability for the Bank. The listing in premium segment increased the Bank’s liquidity and granted it further opportunities on capital markets. By the end of 2014, the Bank had made several key acquisitions in its banking and non-banking businesses and modified its growth strategy to reflect both arms.
The reorganisation of the Bank that followed in 2015 marked a legal separation of banking and investment businesses under newly established JSC BGEO Group, then fully owned by BGEO Group PLC (former Bank of Georgia Holdings or BGH). This is the year when Bank of Georgia started the transformation of its retail brand into a client-centric business that united transactional banking through Express Bank, flagship mass retail banking through Bank of Georgia and affluent banking through SOLO. The year of 2015 was an important milestone for the Investment Business as well, as it oversaw a successful premium segment listing of Georgia Healthcare Group PLC.
In 2017, the Bank listed its landmark local currency bonds on the Irish Stock Exchange, which was a significant achievement in light of the de-dollarisation initiatives in Georgia’s banking sector.
In 2017, the decision was made to demerge BGEO Group PLC into two separately listed and independently managed public companies – Bank of Georgia Group PLC, the Banking Business, and Georgia Capital PLC, the Investment Business (the “Demerger”). The Demerger was completed on 29 May 2018 and Bank of Georgia Group successfully continues its operation in the banking sector.
1994POST-SOVIET ERA BEGINS JSC Bank of Georgia, a successor to the state-owned bank, was established through privatisation.
2013ISSUED EUROBONDSUS$ 150 million 7.75% Eurobond consolidated with US$ 250 million 2012 bonds.
2017LANDMARK ISSUANCE OF THE FIRST GEL-DENOMINATED BONDS GEL 500 million 11.00% Rule 144A/Reg S bond due 2020, settled in US Dollar, listed on the Irish Stock Exchange.
2016ISSUED EUROBONDS US$ 350 million 6% seven-year Eurobond.
2014CAPITAL RAISE US$ 114 million raised to purchase Privatbank and support further acquisitions.
2015BGH REORGANISATION INTO BGEO GROUP & UPDATED STRATEGY SOLO’s relaunch;Retail Bank’s launch of client-centric strategy;Investment business opportunities and strategic partnerships;GHG’s IPO on LSE.
2009SOLO BANKING Launched SOLO banking to target mass affluent segment of the population; Investments made in IT platform; International Wealth Management business launched and the first representative office opened in Tel Aviv.
2012PREMIUM LISTING ON THE LSE MAIN MARKET BGH floats on the premium segment of the LSE after 98%+ shareholders accept the Tender Offer; Becomes component of FTSE 250 index. US$ 250 million Eurobond issued.
2011BANK OF GEORGIA HOLDINGS PLC BGH incorporated under the laws of England and Wales; BGH launches Tender Offer to the Bank’s shareholders;
IN GEORGIA: Express Banking launched to further advance the Bank’s Retail Banking franchise; Aldagi BCI steps up vertical integration of insurance and healthcare sector; New branding promise introduced: Feel the Future.
2010NEW STRATEGY Focused on Georgia and diversification of revenue sources.
1999DFIs INVEST EBRD became a shareholder.
2004NEW MANAGEMENT New management with international banking experience in place; International institutional investors started investing; Acquisitions in banking (TUB), insurance (BCI) and card processing (Georgian Card).
2001GEORGIAN STOCK EXCHANGE Listing on the Georgian Stock Exchange.
2005TURNOVER COMMENCES Series of packaged and innovative retail products were rolled out and infrastructure upgrade initiated. The first ever corporate bond public offering in Georgia was successfully completed.
2018DEMERGER BGEO GROUP PLC split into independent separate London Stock Exchange Listed companies – Bank of Georgia Group PLC and Georgia Capital PLC.
2019NEW BRAND IDENTITY FOR WEALTH MANAGEMENT BUSINESSLaunched a brand new office for Wealth Management business.
2019LANDMARK ISSUANCESuccessful pricing of the first Additional Tier 1 Capital Notes $100 million 11.125% Reg S Perpetual Notes to be listed on the Irish Stock Exchange.
2006LONDON
STOCK EXCHANGE First IPO of a Georgian
company on the LSE as Bank of Georgia lists 35% of its
shares in the form of GDRs on the LSE. ABCI became the
leading insurance company following the acquisition of
Aldagi by BCI. First credit cards introduced in Georgia.
2007DEBUT EUROBOND
Bank of Georgia issued US$ 200 million Eurobond, the first international bond
offering from Georgia.
2008INVESTING IN GROWTH
New integrated internet and mobile banking platforms launched;
Entered Belarus, through acquisition of BNB;
Became an exclusive partner of American Express in Georgia.

22 Annual Report 2018 Bank of Georgia Group PLC 23Annual Report 2018 Bank of Georgia Group PLC
Strategic ReportStrategy
Strategic ReportPerformance Governance
FinancialStatements
AdditionalInformation
Strategic ReportOverview
2015 2016 2017 2018*
21.9% 22.2%25.2% 26.1%
2013 2015 2016 2018 2019
3.1% 2.7%
2014 2017
51 80 98 12412272 102
3.1% 3.2% 2.4%4.0% 4.4%
30% 36% 33% 34% 32% 30%30%Payoutratio:
GE
L m
illio
ns
2015 20172016 2018
20.8%24.5%
21.4%
15.9%
Total dividend paid during the year Dividend yield**
Current business model and strategyBank of Georgia Group is a Georgia-focused banking business with an impressive track record of delivering superior returns and maximising shareholder value. Bank of Georgia Group is a financially robust, innovative and truly public financial institution with exemplary corporate governance standards and remarkable competitive advantage in the local market in terms of attracting financial and human capital. By harnessing its strong customer relationships and continuous digital innovation, the Group aims to continue to deliver on its strategy, which is based on at least 20% ROAE and 15-20% growth of its loan book in the medium to long term.
JSC Bank of Georgia, the systemically important and leading universal Georgian bank, is the core entity of the Group that offers Retail Banking, Corporate Investment Banking and Wealth Management services. Among the ancillary business lines are leasing, payment services and banking operations in Belarus through BNB.
ROAE of 20%+ 2018 – 26.1%
The Group’s Banking Business consistently delivers compelling returns in excess of 20%. Moreover, recent years have proved the Group’s impressive ability to deliver returns of around 25%.
In 2018, the Banking Business delivered revenue of GEL 1,030.0 million, up 13.3% y-o-y, profit from continuing operations of GEL 378.6 million, up 2.5% y-o-y, and profit before non-recurring items and income tax of GEL 492.6 million, up 23.0% y-o-y. Individual product loan yields have continued to remain broadly stable. Our increasing focus on lending in the mortgage segment and to finer margin corporate and SME clients has however led to a negative mix effect on overall loan yields and on the net interest margin, which was reduced by 80 basis points in 2018. This shift in product mix improves our asset quality metrics and, particularly in the case of the mortgage portfolio, reduces the risk-asset and capital intensity of our lending growth, which has enabled us, and we expect will continue to enable us, to maintain the Group’s return on equity and superior profitability profile. In 2018, as part of our objective to increase operating efficiency, the Bank introduced a project “Lean”, which has already delivered strong results in process optimisation. Cost to income ratio improved from 37.7% in 2017 to 36.7% in 2018. With project “Lean” optimising and streamlining the procedures throughout the Bank, we expect the positive trend to continue in the coming years.
Loan book growth 15-20% 2018 – 21.4%
Up until the end of 2017, loan book growth was focused on Retail Banking, while in Corporate Investment Banking our target was to decrease our exposure to our top ten clients to 10% of the total loan portfolio. After successful de-concentration of risk in the Corporate Investment Banking portfolio, lending growth is now more balanced between Retail and Corporate Investment Banking and we expect this trend to continue.
In 2018, customer lending in Retail and Corporate Investment Banking grew by 24.2% and 15.9%, respectively. On a constant currency basis, Retail and Corporate Investment Banking loan books grew by 22.3% and 12.9% respectively, while the total loan book increased by 21.4% on the annual basis. As a result of the recent policy changes, we anticipate growth rates in the unsecured consumer sector to moderate, although we continue to expect to deliver solid growth in mortgages and SME lending. Overall, with the strong rates of growth already delivered in 2018, we now expect customer lending growth for the medium to long term to be comfortably within our 15-20% expected growth range, with lending growth expectations over the next 12 months to be closer to 15%.
Dividend payout 2018 – 30%At the 2019 Annual General Meeting, the Board intends to recommend an annual dividend for 2018 of GEL 2.55 per share payable in British Pounds Sterling at the prevailing rate. This represents a payout ratio of 30%, in the range of our dividend payout ratio target of 25-40%, and a 4.5% increase over last year’s dividend.
Retail Banking
Corporate Investment
Banking
Wealth Management
BNB (Bank in Belarus)
20%+ ROAE
c. 35%Market share in loans and
deposits
c. 78% of dailytransactions via remote channels
Strong brand name
recognition and Retail Banking
franchise
High standards of transparency
and governance
GROWTH15-20%
DIVIDEND PAYOUT25-40%
PROFITABILITY20%+
Delivering on current strategySuccessful track record of delivering strong results
Banking Business key targets
* 2018 results adjusted for GEL 30.3mln Demerger-related costs, GEL 8.0mln Demerger-related corporate income tax gain, and GEL 30.3mln one-off impact of remeasurement of deferred tax balances.
** Dividend yield for 2013-2018 years is calculated based on the closing price of the shares immediately prior to ex-dividend date. Dividend yield for 2019 is calculated based on the closing price of the shares on 18 February 2019.
1
3 Regular dividends
2
ROAE of 20%+
Robust capital management track record
Loan book growth 15-20%
• Capital position: We aim to maintain a +200bps buffer over minimum regulatory requirements
• Maintain regular dividend payouts: Aiming 25-40% dividend payout ratio
• GEL 500mln+ cash dividend paid since 2013, with payout ratio above 30% over past six years
• Management trust buybacks: GEL 52.0mln share buy-backs in 2018
25Annual Report 2018 Bank of Georgia Group PLC
Strategic ReportStrategy
Strategic ReportPerformance Governance
FinancialStatements
AdditionalInformation
Strategic ReportOverview
Annual Report 2018 Bank of Georgia Group PLC24
2008
0.7
2009 2010 2011 2012 2013 2014 2015 2016 2017 2018
0.8 0.8 0.9 1.1 1.2 1.52.0 2.1 2.3 2.4
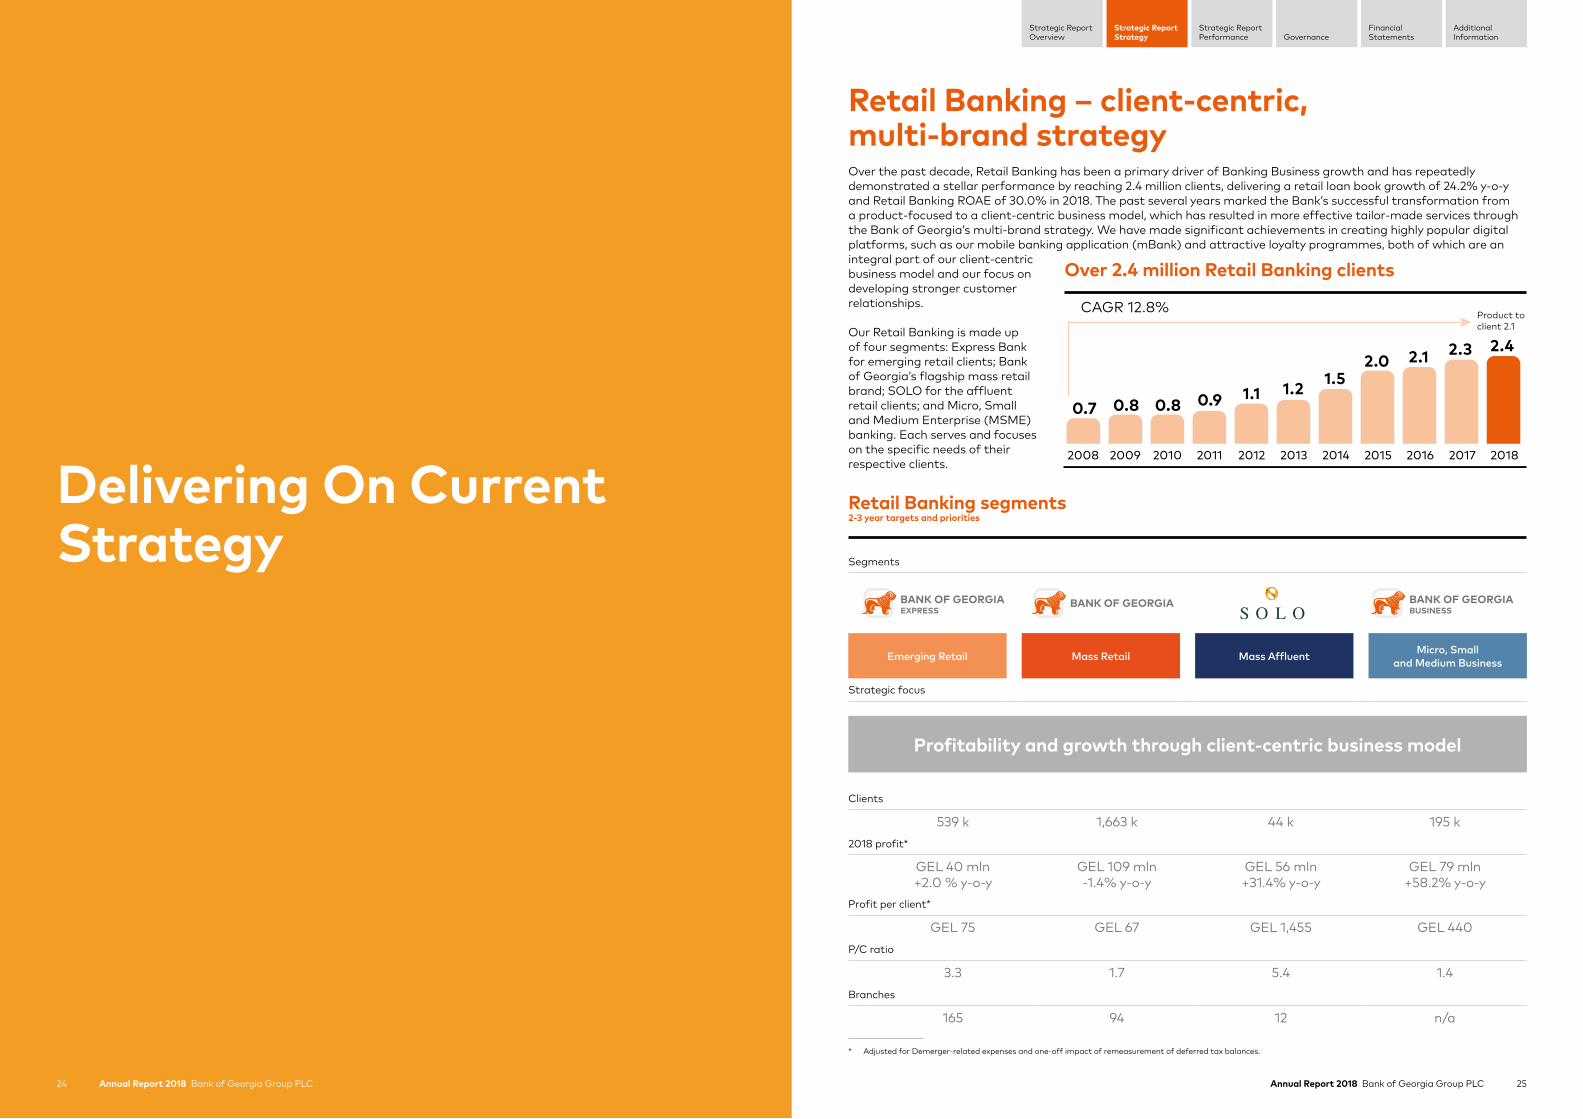
CAGR 12.8% Product to client 2.1
Over 2.4 million Retail Banking clients
Retail Banking – client-centric, multi-brand strategyOver the past decade, Retail Banking has been a primary driver of Banking Business growth and has repeatedly demonstrated a stellar performance by reaching 2.4 million clients, delivering a retail loan book growth of 24.2% y-o-y and Retail Banking ROAE of 30.0% in 2018. The past several years marked the Bank’s successful transformation from a product-focused to a client-centric business model, which has resulted in more effective tailor-made services through the Bank of Georgia’s multi-brand strategy. We have made significant achievements in creating highly popular digital platforms, such as our mobile banking application (mBank) and attractive loyalty programmes, both of which are an integral part of our client-centric business model and our focus on developing stronger customer relationships.
Our Retail Banking is made up of four segments: Express Bank for emerging retail clients; Bank of Georgia’s flagship mass retail brand; SOLO for the affluent retail clients; and Micro, Small and Medium Enterprise (MSME) banking. Each serves and focuses on the specific needs of their respective clients. Delivering On Current
Strategy
* Adjusted for Demerger-related expenses and one-off impact of remeasurement of deferred tax balances.
Retail Banking segments2-3 year targets and priorities
Segments
Emerging Retail Mass Retail Mass Affluent Micro, Smalland Medium Business
Strategic focus
Profitability and growth through client-centric business model
Clients
539 k 1,663 k 44 k 195 k2018 profit*
GEL 40 mln+2.0 % y-o-y
GEL 109 mln-1.4% y-o-y
GEL 56 mln+31.4% y-o-y
GEL 79 mln+58.2% y-o-y
Profit per client*
GEL 75 GEL 67 GEL 1,455 GEL 440P/C ratio
3.3 1.7 5.4 1.4Branches
165 94 12 n/a
26 Annual Report 2018 Bank of Georgia Group PLC 27Annual Report 2018 Bank of Georgia Group PLC
Strategic ReportStrategy
Strategic ReportPerformance Governance
FinancialStatements
AdditionalInformation
Strategic ReportOverview
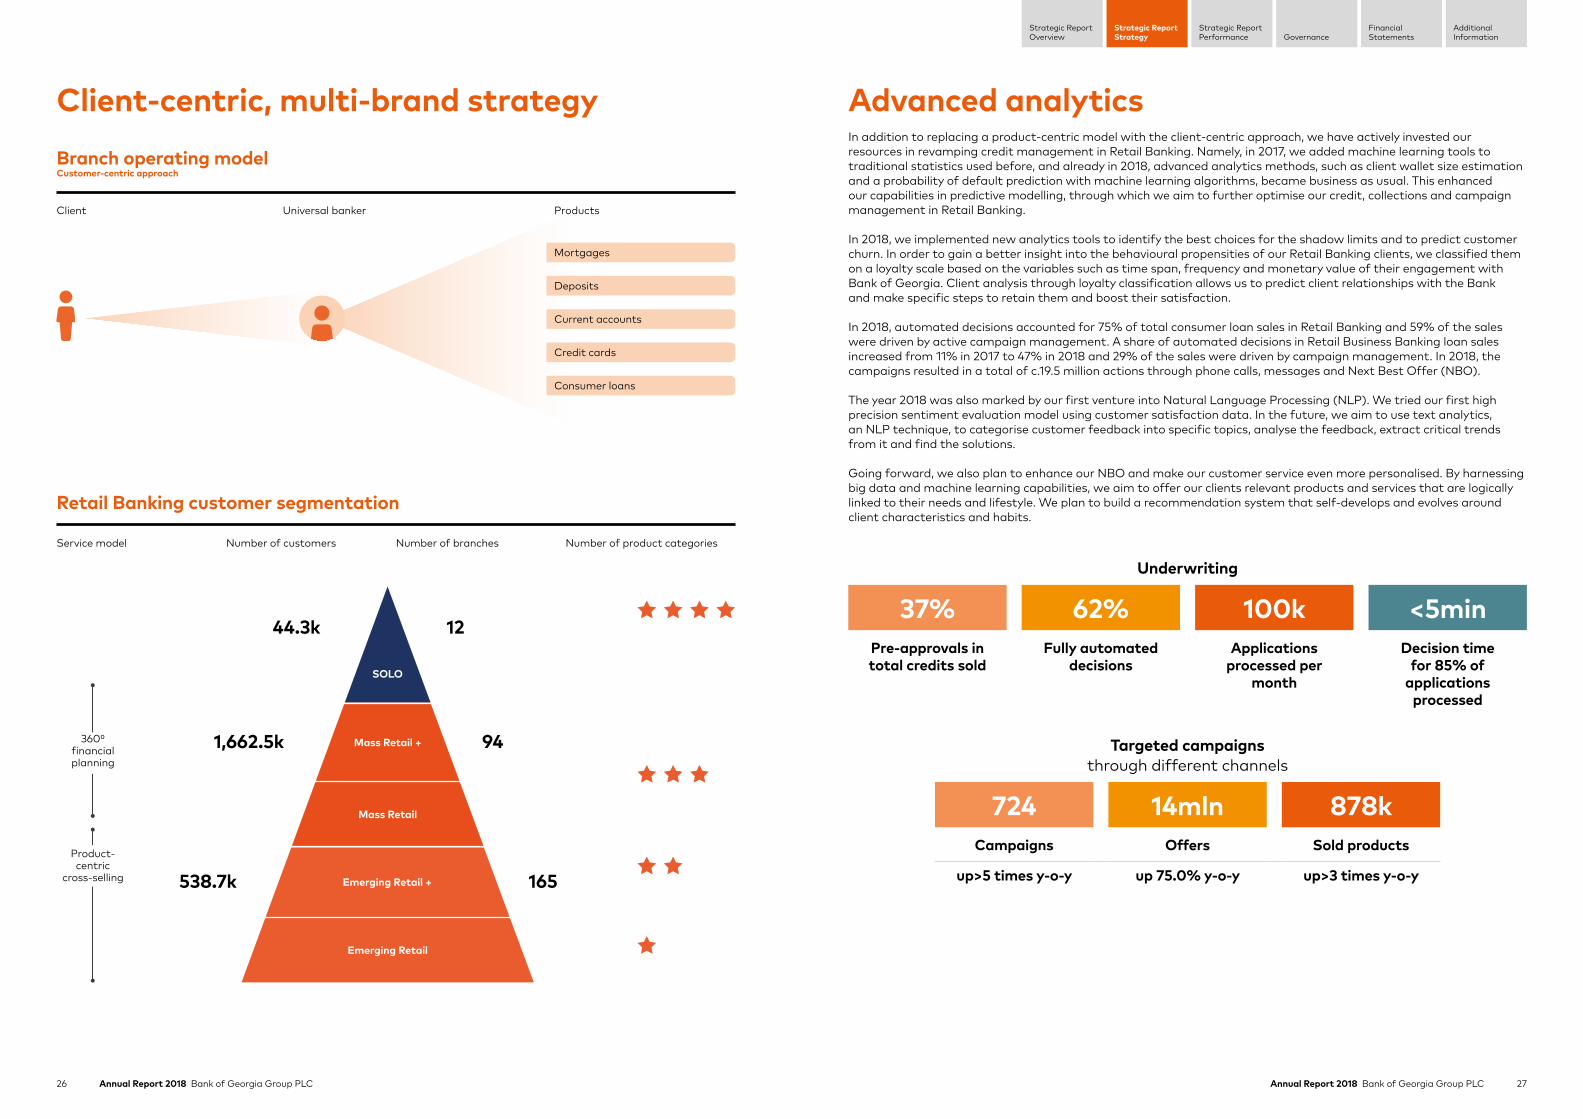
Mortgages
Current accounts
Credit cards
Consumer loans
Deposits
3600 financialplanning
Product-centric
cross-selling
44.3k
1,662.5k
538.7k
12
94
165
SOLO
Mass Retail +
Emerging Retail +
Mass Retail
Emerging Retail
Advanced analyticsIn addition to replacing a product-centric model with the client-centric approach, we have actively invested our resources in revamping credit management in Retail Banking. Namely, in 2017, we added machine learning tools to traditional statistics used before, and already in 2018, advanced analytics methods, such as client wallet size estimation and a probability of default prediction with machine learning algorithms, became business as usual. This enhanced our capabilities in predictive modelling, through which we aim to further optimise our credit, collections and campaign management in Retail Banking.
In 2018, we implemented new analytics tools to identify the best choices for the shadow limits and to predict customer churn. In order to gain a better insight into the behavioural propensities of our Retail Banking clients, we classified them on a loyalty scale based on the variables such as time span, frequency and monetary value of their engagement with Bank of Georgia. Client analysis through loyalty classification allows us to predict client relationships with the Bank and make specific steps to retain them and boost their satisfaction.
In 2018, automated decisions accounted for 75% of total consumer loan sales in Retail Banking and 59% of the sales were driven by active campaign management. A share of automated decisions in Retail Business Banking loan sales increased from 11% in 2017 to 47% in 2018 and 29% of the sales were driven by campaign management. In 2018, the campaigns resulted in a total of c.19.5 million actions through phone calls, messages and Next Best Offer (NBO).
The year 2018 was also marked by our first venture into Natural Language Processing (NLP). We tried our first high precision sentiment evaluation model using customer satisfaction data. In the future, we aim to use text analytics, an NLP technique, to categorise customer feedback into specific topics, analyse the feedback, extract critical trends from it and find the solutions.
Going forward, we also plan to enhance our NBO and make our customer service even more personalised. By harnessing big data and machine learning capabilities, we aim to offer our clients relevant products and services that are logically linked to their needs and lifestyle. We plan to build a recommendation system that self-develops and evolves around client characteristics and habits.
Client-centric, multi-brand strategyBranch operating modelCustomer-centric approach
Client Universal banker Products
Retail Banking customer segmentation
Service model Number of customers Number of branches Number of product categories
Underwriting
37% 62% 100k <5minPre-approvals in total credits sold
Fully automated decisions
Applications processed per
month
Decision time for 85% of
applications processed
Targeted campaigns through different channels
724 14mln 878kCampaigns Offers Sold products
up>5 times y-o-y up 75.0% y-o-y up>3 times y-o-y
28 Annual Report 2018 Bank of Georgia Group PLC 29Annual Report 2018 Bank of Georgia Group PLC
Strategic ReportStrategy
Strategic ReportPerformance Governance
FinancialStatements
AdditionalInformation
Strategic ReportOverview
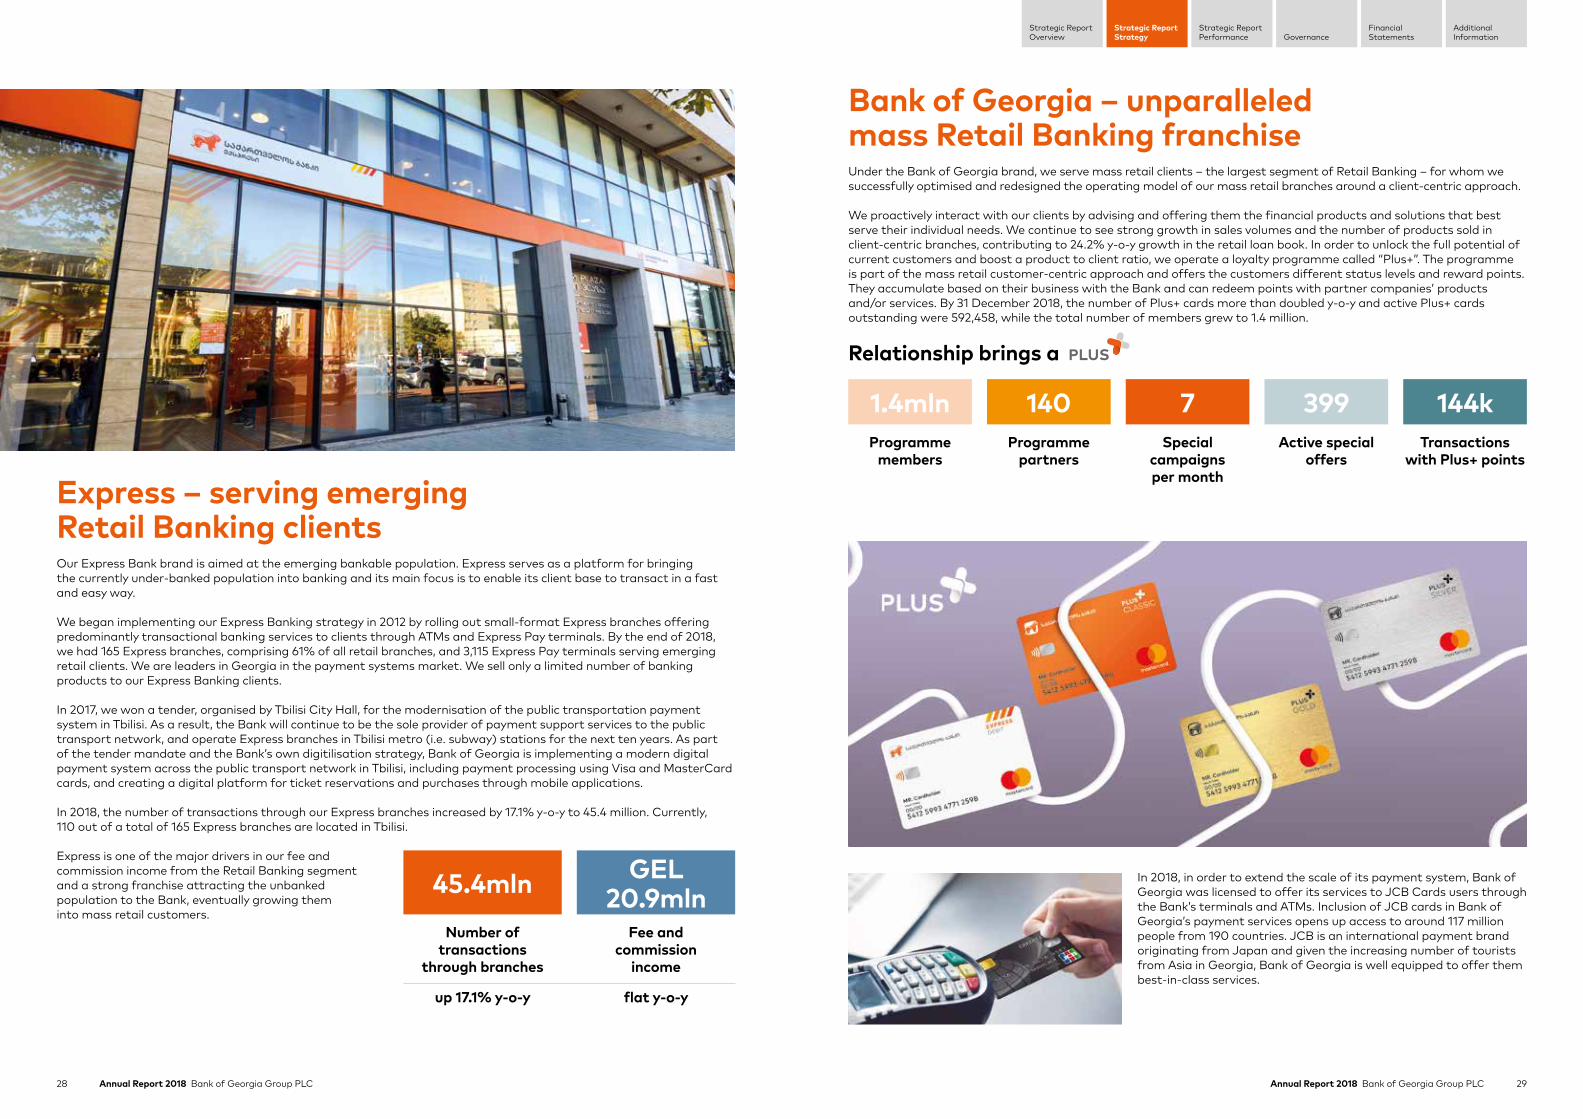
Express – serving emerging Retail Banking clientsOur Express Bank brand is aimed at the emerging bankable population. Express serves as a platform for bringing the currently under-banked population into banking and its main focus is to enable its client base to transact in a fast and easy way.
We began implementing our Express Banking strategy in 2012 by rolling out small-format Express branches offering predominantly transactional banking services to clients through ATMs and Express Pay terminals. By the end of 2018, we had 165 Express branches, comprising 61% of all retail branches, and 3,115 Express Pay terminals serving emerging retail clients. We are leaders in Georgia in the payment systems market. We sell only a limited number of banking products to our Express Banking clients.
In 2017, we won a tender, organised by Tbilisi City Hall, for the modernisation of the public transportation payment system in Tbilisi. As a result, the Bank will continue to be the sole provider of payment support services to the public transport network, and operate Express branches in Tbilisi metro (i.e. subway) stations for the next ten years. As part of the tender mandate and the Bank’s own digitilisation strategy, Bank of Georgia is implementing a modern digital payment system across the public transport network in Tbilisi, including payment processing using Visa and MasterCard cards, and creating a digital platform for ticket reservations and purchases through mobile applications.
In 2018, the number of transactions through our Express branches increased by 17.1% y-o-y to 45.4 million. Currently, 110 out of a total of 165 Express branches are located in Tbilisi.
Express is one of the major drivers in our fee and commission income from the Retail Banking segment and a strong franchise attracting the unbanked population to the Bank, eventually growing them into mass retail customers.
Bank of Georgia – unparalleled mass Retail Banking franchiseUnder the Bank of Georgia brand, we serve mass retail clients – the largest segment of Retail Banking – for whom we successfully optimised and redesigned the operating model of our mass retail branches around a client-centric approach.
We proactively interact with our clients by advising and offering them the financial products and solutions that best serve their individual needs. We continue to see strong growth in sales volumes and the number of products sold in client-centric branches, contributing to 24.2% y-o-y growth in the retail loan book. In order to unlock the full potential of current customers and boost a product to client ratio, we operate a loyalty programme called “Plus+”. The programme is part of the mass retail customer-centric approach and offers the customers different status levels and reward points. They accumulate based on their business with the Bank and can redeem points with partner companies’ products and/or services. By 31 December 2018, the number of Plus+ cards more than doubled y-o-y and active Plus+ cards outstanding were 592,458, while the total number of members grew to 1.4 million.
Relationship brings a
1.4mln 140 7 399 144kProgramme
membersProgramme
partnersSpecial
campaignsper month
Active specialoffers
Transactions with Plus+ points
45.4mln GEL 20.9mln
Number of transactions
through branches
Fee and commission
income
up 17.1% y-o-y flat y-o-y
In 2018, in order to extend the scale of its payment system, Bank of Georgia was licensed to offer its services to JCB Cards users through the Bank’s terminals and ATMs. Inclusion of JCB cards in Bank of Georgia’s payment services opens up access to around 117 million people from 190 countries. JCB is an international payment brand originating from Japan and given the increasing number of tourists from Asia in Georgia, Bank of Georgia is well equipped to offer them best-in-class services.

30 Annual Report 2018 Bank of Georgia Group PLC 31Annual Report 2018 Bank of Georgia Group PLC
Strategic ReportStrategy
Strategic ReportPerformance Governance
FinancialStatements
AdditionalInformation
Strategic ReportOverview
SOLO – a fundamentally different approach to premium bankingThe SOLO brand is used to serve the emerging mass affluent segment. Our new SOLO model was introduced in 2015. It is a fundamentally different approach to premium banking. As part of the new strategy, the Bank’s SOLO clients are given access to exclusive products and the finest concierge-style environment at our specially designed SOLO lounges, and are provided with new lifestyle opportunities, such as exclusive events and handpicked lifestyle products.
To qualify for SOLO services one needs to have an income of GEL 3,000 per month. At SOLO lounges, clients are attended by personal bankers and, in addition to the banking products, are offered luxury goods at cost and other lifestyle offers including a travel magazine and entertainment. In 2018, SOLO organised concerts with world famous artists. Such events are limited to SOLO clients and create additional interest in the SOLO franchise.
Profit per SOLO client reached GEL 1,455* in 2018, over 21 times more than what we have in the mass retail segment under the Bank of Georgia brand. SOLO’s gross loan book and deposit portfolio demonstrated impressive growth of 45.9% and 38.4% y-o-y, respectively.
We successfully achieved our target of 40,000 SOLO clients by the end of 2018 ahead of time in the third quarter of 2018, reaching 44,292 customers as at 31 December 2018, up from 8,282 in 2015. The share of new customers acquired in 2018 accounted for 37.0% of the total of SOLO clients at the end of the year, which clearly demonstrates the popularity of the franchise in our domestic market.
SOLO Club, a membership group within SOLO launched in 2017, offers exclusive access to SOLO’s products and offers ahead of other SOLO clients at a higher fee. This includes American Express Platinum cards which are available to SOLO Club members only. At 31 December 2018, SOLO Club had 3,825 members.
Given the exclusive character of SOLO, going forward we will mainly target growth through existing clients by increasing customer loyalty and engagement and focus on maximising the profit per client and product per client measures.
In 2019, we are planning to offer our SOLO clients an enhanced mBank equipped with personal finance management tools that will make the application even more comfortable and user-friendly.
The target of 40,000 SOLO clients has already been achieved. We target growth through increasing
engagement of existing clients and maximising the profit per client and product per client measures.
Conversion of mass Retail Banking clients to SOLO clients
Mass retail client (before converting to SOLO)
SOLO client (after converting to SOLO)
Product to client ratio 4.7 7.4Profit per client GEL 355 GEL 772* The results for mass retail clients were calculated on the six-month period before moving to the SOLO segment, while the results shown for SOLO were achieved in a year after
becoming a SOLO client.
Education Travel Health Entertainment
SOLO is actively diversifying the range of its lifestyle offerings in travel, entertainment, education and well-being to make the franchise even more distinguishable and enjoyable. In 2019, we introduced a range of new lifestyle offers in travel and healthcare. Our packaged tours in various countries were very well received among SOLO clients. In healthcare, we designed widely popular insurance products against terminal diseases, whereby we offer direct reimbursement of expenses in predetermined amounts.
* Adjusted for Demerger-related expenses and one-off impact of remeasurement of deferred tax balances.

32 Annual Report 2018 Bank of Georgia Group PLC 33Annual Report 2018 Bank of Georgia Group PLC
Strategic ReportStrategy
Strategic ReportPerformance Governance
FinancialStatements
AdditionalInformation
Strategic ReportOverview
Micro, small and medium enterprise lendingBank of Georgia actively supports MSME businesses in Georgia by offering them local currency resources, along with foreign currency loans, and by designing the products and services that help them thrive. Over the last couple of years, we have focused on developing a relationship banking model for our Small and Medium Enterprise (SME) clients, improving their banking experience, enhancing their exposure to our digital channels and boosting innovative product offerings. In 2019, we plan to open a Bank of Georgia’s Business branch, where well trained relationship bankers will offer one-stop-shop banking and advisory services to our business clients. We are dedicated to helping them develop successful enterprises, which is why we plan to also include educational and advisory components in our services. The Business branch will be designed around a similar concept as the affluent segment in Retail Banking – SOLO – and will focus on creating outstanding banking experience for our clients, both in terms of innovative products and business-specific consulting services from a relationship banker. We aim to increase cross-selling opportunities between SOLO and SME segments and already have a dedicated unit in place in order to tap into the existing potential in the SME market.
In March 2019, Bank of Georgia offered its business clients a fully updated business internet bank (Business iBank). Moreover, we are in the process of developing a business finance management tool that will integrate accounting software into the Business iBank account of our clients. The aim is to make any interaction of SMEs with the Bank even more comfortable and effortless, with speedier and more automated information and process management.
In 2018, the Bank introduced a new payment method “QR PAY” to the local small business market. QR PAY has been designed by the Bank as an alternative payment mechanism to the traditional point of sale terminal for small Georgian businesses that previously relied on cash transactions as a means for their customers to settle payments. In order to connect to QR PAY and enjoy the benefits of cashless payments, small businesses need to have an account with Bank of Georgia. Once connected, they start receiving QR PAY services free of charge for the first year. Thereafter, a service commission is based on the turnover of the enterprise. This is a significant advantage for small businesses with low turnover. For customers who use Bank of Georgia’s mobile bank and a debit or credit card, settling payments with QR PAY is simple and user-friendly. There are already up to 800 small businesses connected to QR PAY.
By the end of 2018, we had 195,230 MSME clients, up from 165,781 in 2017, and a loan book increase to GEL 2,176 million in 2018, up from GEL 1,739 million in 2017.
Strategic focus
Focus on loyalty and
best customer experience
Innovative product
offerings
Simple onboarding and digital channel
capabilities
One-stop-shop within the Bank
of Georgia business branch
Education and advisory services
Leading service provider for MSMEs
195,230 GEL 79mln* GEL 2.2bln GEL 664mln
Number of clients
Net income
Loan book
Clientdeposits
up 17.8% y-o-y up 58.2% y-o-y up 25.1% y-o-y up 52.3% y-o-y
Case studies: supporting Georgian businessesUrban Greens
Urban Greens is a Georgian greenhouse and a micro greens specialist. Micro greens are grown for everyday household consumption and for fine dining restaurants that use micro greens as ingredients or as visual component. The young founders of the greenhouse associate Urban Greens with a healthy and sustainable lifestyle, and are committed to using the best quality seeds and a clean environment to grow their greens.
The greenhouse was founded in 2015, initially as an experiment and was so well received that by the end of 2018, Urban Greens already delivered its products not only in Tbilisi, but also in several other Georgian cities, including Batumi. Urban Greens was built on just 15 hectares of land but a rapidly increasing demand for its greens from professional chefs and households enabled the company to quickly expand to 150 hectares nearby Tbilisi. The mission of Urban Greens is a swift delivery of its fresh and high-quality products.
Bank of Georgia supported Urban Greens with GEL 20,000 to finance its working capital at the time of the farm’s expansion. Financing young entrepreneurs with brilliant business ideas is what Bank of Georgia is passionate about and the Bank continues to be a helping hand to prospective small businesses.
Schuchmann Wines Georgia
Schuchmann Wines Georgia (SWG) was founded in 2008 in the very centre of the Georgian wine growing region, Kisiskhevi, Kakheti, Georgia’s Eastern region. SWG produces wines out of three distinct vineyard sites: Napareuli, Tsinandali, Kindzmarauli. Their flagship wines – Saperavi, Rkatsiteli, Kisi, Kindzmarauli, Mtsvane and the Cabernet Sauvignon – are produced from indigenous grape varieties cultivated in specific micro zones of Kakheti at the winery location. Most of SWG’s wines are exported and have won numerous awards for their quality and uniqueness. The company owns the vineyards and runs a state-of-the-art production line.
Bank of Georgia’s first support to SWG totalled GEL 725,000 and was aimed at wine production. SWG also operates a spa-hotel in the village of Kisiskhevi. Recently, Bank of Georgia financed SWG’s new enterprise Schuchmann Real Estate with GEL 2 million. The purpose of the loan was to fund the construction of cottages around the spa-hotel’s territory.
Winemaking is Georgia’s identity card and an important cultural heritage, as well as a touristic gem. Bank of Georgia takes pride in financing such an important sector in the Georgian economy.
* Adjusted for Demerger-related expenses and one-off impact of remeasurement of deferred tax balances.

34 Annual Report 2018 Bank of Georgia Group PLC 35Annual Report 2018 Bank of Georgia Group PLC
Strategic ReportStrategy
Strategic ReportPerformance Governance
FinancialStatements
AdditionalInformation
Strategic ReportOverview
Corporate Investment BankingWith c.2,500 clients by the end of 2018, Bank of Georgia’s Corporate Investment Banking (CIB) is a leading provider of corporate banking solutions in Georgia. Our CIB franchise leverages its best-in-class expertise in product design and 360 degree view of every client to execute profitable transactions for the Bank and offer excellent services to clients.
In 2018, the Bank’s CIB loan portfolio resumed growth after our strategic goal to de-concentrate and reposition the CIB loan portfolio was successfully achieved by the end of 2017. CIB’s net loan book reached GEL 2.6 billion at 31 December 2018, up 15.9% y-o-y, while the growth on a constant-currency basis was 12.9% y-o-y. The top ten CIB client concentration was 9.8% of total loan book at the end of 2018, compared to 10.7% at 31 December 2017. While aiming for a healthy growth of the Corporate Investment Banking loan book, Bank of Georgia will continue to prudently manage the concentration risk so that the exposure to its top ten clients is maintained around 10% of the total loan book. CIB’s loan portfolio is targeted to grow by c.15% and we aim for profitability in terms of a ROAE to be at 20%.
We are planning to boost our fee and commission income through corporate advisory and brokerage services from our subsidiary Galt & Taggart – a leading investment bank and a brokerage house in Georgia. Galt & Taggart is actively involved in developing local capital markets and for years has provided services to a number of corporate clients and DFIs and assisted them with placing their bonds on the local stock exchange. In 2018, Galt & Taggart facilitated a public placement of GEL 160 million local bonds issued by Nederlandse Financierings-Maatschappij Voor Ontwikkelingslanden N.V. (FMO) and was also a lead manager for Black Sea Trade and Development Bank when the latter issued GEL 75 million in the local market. In 2018, Galt & Taggart co-managed an international bond issuance totaling US$ 200 million by Georgia Capital.
In order to provide its clients with access to global capital markets and enable them to invest on a multi-asset basis, Galt & Taggart has partnered with Saxo Bank since 2015. The partnership with Saxo Bank enhances the trading experience of our clients by offering them the latest trading technology and an opportunity to directly access financial markets.
Strategic focus
Loan portfolio growth of c.15%
Maintain profitability of
ROAE 20%
Focus on automation
and fee business
Manage concentration risk, with top 10 clients
<10% of total loan book
Acquire and retain top
talent
Leading Corporate Investment Bank in Georgia**
GEL 2.6bln GEL 3.5bln GEL 119.1mln
GEL 26.7mln
Net loans Client deposits Net income Net F&C income
up 15.9% y-o-y up 0.5% y-o-y up 12.5% y-o-y up 17.4% y-o-y
22.6% c. 2,500ROAE* Clients
up 500bps y-o-y down 5.0% y-o-y
Wealth ManagementBank of Georgia’s Wealth Management is a private banking arm of our Corporate Investment Banking which serves high-net worth individuals and offers investment management products internationally through representative offices in London, Budapest, Istanbul, Tel Aviv and Limassol. Since its launch in 2005, our customer base in Wealth Management increased to 1,528 clients from 76 countries compared to 1,434 clients from 75 countries in 2017. Assets under management (AUM) increased to GEL 2,271.5 million, up 22.3% y-o-y.
In January 2019, Bank of Georgia opened an office in the centre of Tbilisi, which is dedicated to serve our Wealth Management clients. This coincides with the creation of a new brand identity for the Bank’s Wealth Management, which is based on the virtues of both Georgia and the Bank itself. The country offers a number of advantages such as stability, a liberal tax system, innovative financial services, a growing economy and security to international investors. Bank of Georgia is a leading bank that delivers strong returns, constantly innovates and is known for reliability. Our strategic focus in Wealth Management is to turn it into a regional hub for private banking and extend its client base to nearby countries. A stable business environment in Georgia and Bank of Georgia’s reputation and expertise make it a perfect bank for affluent individuals to do business with. Bank of Georgia is a digitally strong bank, but we always apply a tailor- made approach when the needs of our clients are concerned.
* Adjusted for Demerger-related expenses and one-off impact of re-measurement of deferred tax balances.** Includes Wealth Management.

36 Annual Report 2018 Bank of Georgia Group PLC 37Annual Report 2018 Bank of Georgia Group PLC
Strategic ReportStrategy
Strategic ReportPerformance Governance
FinancialStatements
AdditionalInformation
Strategic ReportOverview
Wealth Management Niko Pirosmani at Albertina Museum
One of the cornerstones of the new brand identity of our Wealth Management business is popularising Georgian heritage. In 2018, Bank of Georgia financed an exhibition by a famous Georgian painter, Niko Pirosmanashvili (Pirosmani) at the world-famous Albertina Museum in Vienna, Austria. The exhibition was dedicated to Pirosmani’s 100-year anniversary and was aimed at acquainting visitors with a unique perspective and the talent of this Georgian autodidact painter. The exhibition was on view from 26 October 2018 until 27 January 2019.

38 Annual Report 2018 Bank of Georgia Group PLC 39Annual Report 2018 Bank of Georgia Group PLC
Strategic ReportStrategy
Strategic ReportPerformance Governance
FinancialStatements
AdditionalInformation
Strategic ReportOverview
Digital banking experienceBank of Georgia regards digital experience in modern banking as inherent to its own identity and strategy. We have actively invested in information technology solutions to offer our retail and corporate clients best-in-breed digital banking channels that help to make their everyday lives and businesses easier and successful. In order to remain relevant and up-to-date with today’s ever increasing preferences in digital solutions, we observe the latest trends and practices, analyse potential novelties and quickly turn knowledge into the services our clients need.
Internet bankingIn the first quarter of 2019, we released a brand new business internet banking platform (Business iBank) for our MSME and corporate clients, which comes with plenty of handy features designed to make its use an intuitive and smooth experience. Many of the existing features were redesigned, while a number of new ones were added. We focused our efforts on making the Business iBank even more useful for business transactions, accounting, payments, money transfers and administration.
Mobile bankingSince the Bank launched its mobile banking application (mBank) platform in 2017, we consistently boosted its capabilities and usefulness. In 2018, we introduced a new payment method “QR PAY” to the local small business market. QR PAY was designed by the Bank as an alternative payment mechanism to the traditional point of sale terminal for small Georgian businesses. For customers who use Bank of Georgia’s mobile bank and a debit or credit card, settling payments with QR PAY is simple and user-friendly. Currently, about 800 small businesses are already connected to QR PAY.
In 2018, we enriched our mBank with flexible tools that enable our clients to manage their accounts, loans and
Omni-channel experienceCurrently, we are developing an omni-channel digital experience within Bank of Georgia’s primary website www.bankofgeorgia.ge, which will be completely redesigned and revamped in order to make it comprehensive and useful. The updated website, which we will introduce in 2019, will be a one-stop-shop space for all products and services that Bank of Georgia offers. Importantly, the website will come with fully integrated internet banking platforms for both our retail and corporate clients. With a single login, a client will be able to navigate to any of the digital platforms he or she desires. Once logged in, a client will be able to easily apply for any product from the menu and since the client’s data automatically flows from other digital channels, filling the application will be as easy and enjoyable as never before. To make the experience even more worthwhile, the website will offer product comparison pages, calculators, currency conversion widgets, GPS location, and more.
Digital vs. non-digital transactionsNumber of transactions in millions
10.3 10.5 11.5 12.214.2
3.0 2.7 3.6 3.4 3.7
4Q17 1Q18 2Q18 3Q18 4Q18
Through digital channels Through tellers
78.4%Off-load rate*
up from 74.9% y-o-y
mBank – Consumer Digital Bank of Distinction
In 2018, Bank of Georgia was awarded with a Consumer Digital Bank of Distinction Award from Global Finance in Central and Eastern Europe, for the second consecutive year.
Internet bank (iBank)
Volume of transactions +44.7% y-o-y
2.0blnNumber of transactions -8.2% y-o-y
5.9mlnNumber of users +34.5% y-o-y
295,226
* Percentage of transactions executed through remote channels.
Mobile bank (mBank)
Volume of transactions +186.1% y-o-y
2.0blnNumber of transactions +146.9% y-o-y
15.7mlnNumber of users +88.3% y-o-y
333.698
deposits. In addition, starting from 2018, our customers are also able to apply for a loan or prepay it via mBank. 26,098 loans were issued with a total value of GEL 39.4 million using the mobile banking application during 2018. Moreover, a new feature was added to mBank and our customers can now open or terminate a deposit via our mobile platform. Currently, we are in the process of building a personal finance manager (PFM) tool for mBank. We partnered with Strands to integrate their award-winning solution for PFM into our mBank.
Open Banking strategyIn 2018, we introduced BOG Fintech – a new strategic direction established under the Open Banking Strategy developed by the Bank. Open Banking offers new opportunities to innovators to create new technology-based financial services for customers. It opens up information technology infrastructure and new resources to fintechs so that they can introduce innovative services in partnership with the Bank.
In 2018, we transformed the delivery process of in-house information technology solutions. We aim to increase the efficiency and effectiveness of project delivery, better meet the requirements of the Banking Business and improve the quality of end-products.

40 Annual Report 2018 Bank of Georgia Group PLC 41Annual Report 2018 Bank of Georgia Group PLC
Strategic ReportStrategy
Strategic ReportPerformance Governance
FinancialStatements
AdditionalInformation
Strategic ReportOverview
Digital platform – real estate listing platform
Within the Bank of Georgia Group, we created a unique Real Estate Listing Platform that is aimed at addressing the demands of all stakeholders in the local market. The platform helps real estate owners, potential buyers, sellers, renters, real estate agents and other stakeholders share all essential information on properties, their values, rent rates and mortgages. The customers can access banking products, apply for mortgages and check credit limits live while browsing for the desired real estate. The universal and highly flexible online platform will transform the way these stakeholders interact and make real-estate-related decisions in Georgia.
The platform offers a rich, most comprehensive and reliable real estate database, including the properties that are exclusively on this platform and cannot be found elsewhere. In addition to the plentiful options, the stakeholders also enjoy bestimate real estate
values, rent bestimates, tailored recommendations and suggestions based on customer demands, a sophisticated mortgage calculator and advanced premium services among many other advantages. Moreover, we integrated artificial intelligence systems to assist our operation team in managing the listings – keeping them accurate, well crafted and genuine.
In cooperation with the Group’s Real Estate Listing Platform, the Bank aims to boost its mortgage portfolio by gaining access to and serving a new clientèle, and simultaneously offering value-added services to real estate developers and agencies. Eventually, it is envisaged that the Group’s Real Estate Listing Platform will take us to a completely new stage on the local real estate market and will enable the Bank to become much more than just a financial partner to our clients.
Efficiency gains – optimisation project Lean
In 2018, Bank of Georgia launched project “Lean”, which aims to transform and optimise the operations in three areas of the Bank: service centres, processes and functions.
Transformation of the service centres has been carried out with the purpose of increasing the number of customers served and products sold to them. Currently, all of the flagship branches of the Bank have been transformed to become more productive and efficient in their services. We set up a queue management system to improve customer experience, increase client satisfaction and retention rates by offering speedier and higher quality services. As a result, 98% of the clients entering a transformed service centre are served, while the figure before the optimisation used to be 83%. We introduced frequently revised shorter-term key performance indicators for our bankers, which are aimed at boosting sales by increasing the number of clients served and products sold per banker ratios. As a result, the sales in transformed service centres increased by 20%. Client satisfaction also saw a positive trend having reached 90%, in line with our future target of 95%.
We have optimised the way we process mortgage applications in Retail Banking and loan applications in Corporate Investment Banking, and plan to transform the processes in other segments as well. In order to efficiently utilise the time and human resources needed to process mortgage applications and reduce the number of errors to a minimum, we introduced standard operating procedures and checklists. As a result, we decreased the number of errors by 50%.
In addition to applying new procedures, we also updated the flow of application processing, which now includes a Time to Yes concept and allows us to inform clients of the outcome of their application within an hour from its submission. Overall, our goal was to decrease the amount of time needed to process a mortgage application from 7.5 days to only 3 days. Currently, this number stands at four days.
In Corporate Investment Banking, we aim to halve the time needed to issue a corporate loan to 15 days. We have introduced an evaluation system, whereby by the end of each loan processing cycle the involved parties are encouraged to voice their feedback to each other. We have rearranged the roles and responsibilities within the teams, aiming to ultimately eliminate duplicated and scattered tasks. The launch of the new scheme in a trial mode revealed that the process cycle time can potentially be reduced by 50%, and the number of errors by 30%. CIB will start applying the new process in 2019.
In addition to transforming the processes in order to achieve a more efficient utilisation of resources, we have also optimised the functions in several departments and plan to work with others in the nearest future. We have improved the efficiency of task flows in the operations support unit and streamlined the processes in the cash and securities settlements unit. We have also reshuffled the functions in corporate lending, so that the corporate bankers focus increasingly more on sales and relationships with clients. Moreover, we freed SOLO branches from back office functions, which we instead centralised in the headquarters of the Bank. We are in the process of implementing the same changes in SME banking and in Wealth Management. In 2019, we plan to identify all the back office operations throughout Bank of Georgia that can be transferred to and centralised in the headquarters.
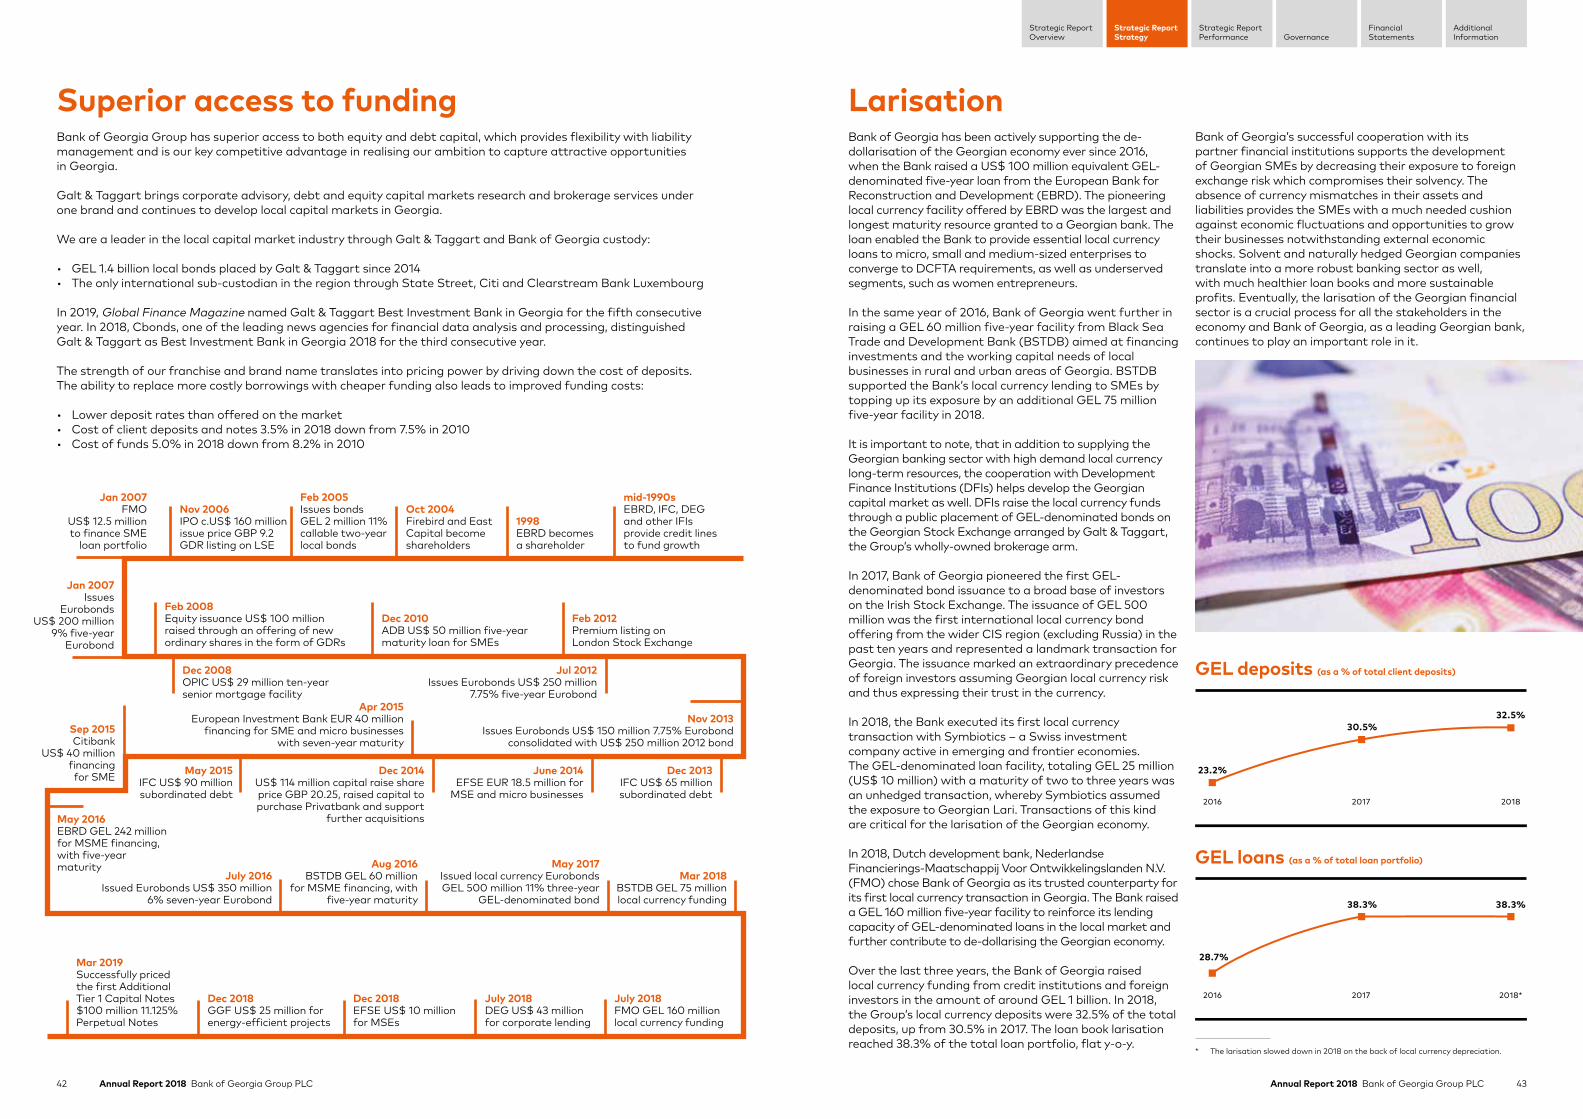
42 Annual Report 2018 Bank of Georgia Group PLC 43Annual Report 2018 Bank of Georgia Group PLC
Strategic ReportStrategy
Strategic ReportPerformance Governance
FinancialStatements
AdditionalInformation
Strategic ReportOverview
GEL deposits (as a % of total client deposits)
23.2%
30.5%32.5%
2016 2017 2018
GEL loans (as a % of total loan portfolio)
2016 2017 2018*
28.7%
38.3% 38.3%
Superior access to fundingBank of Georgia Group has superior access to both equity and debt capital, which provides flexibility with liability management and is our key competitive advantage in realising our ambition to capture attractive opportunities in Georgia.
Galt & Taggart brings corporate advisory, debt and equity capital markets research and brokerage services under one brand and continues to develop local capital markets in Georgia.
We are a leader in the local capital market industry through Galt & Taggart and Bank of Georgia custody:
• GEL 1.4 billion local bonds placed by Galt & Taggart since 2014• The only international sub-custodian in the region through State Street, Citi and Clearstream Bank Luxembourg
In 2019, Global Finance Magazine named Galt & Taggart Best Investment Bank in Georgia for the fifth consecutive year. In 2018, Cbonds, one of the leading news agencies for financial data analysis and processing, distinguished Galt & Taggart as Best Investment Bank in Georgia 2018 for the third consecutive year.
The strength of our franchise and brand name translates into pricing power by driving down the cost of deposits. The ability to replace more costly borrowings with cheaper funding also leads to improved funding costs:
• Lower deposit rates than offered on the market • Cost of client deposits and notes 3.5% in 2018 down from 7.5% in 2010 • Cost of funds 5.0% in 2018 down from 8.2% in 2010
LarisationBank of Georgia has been actively supporting the de-dollarisation of the Georgian economy ever since 2016, when the Bank raised a US$ 100 million equivalent GEL-denominated five-year loan from the European Bank for Reconstruction and Development (EBRD). The pioneering local currency facility offered by EBRD was the largest and longest maturity resource granted to a Georgian bank. The loan enabled the Bank to provide essential local currency loans to micro, small and medium-sized enterprises to converge to DCFTA requirements, as well as underserved segments, such as women entrepreneurs.
In the same year of 2016, Bank of Georgia went further in raising a GEL 60 million five-year facility from Black Sea Trade and Development Bank (BSTDB) aimed at financing investments and the working capital needs of local businesses in rural and urban areas of Georgia. BSTDB supported the Bank’s local currency lending to SMEs by topping up its exposure by an additional GEL 75 million five-year facility in 2018.
It is important to note, that in addition to supplying the Georgian banking sector with high demand local currency long-term resources, the cooperation with Development Finance Institutions (DFIs) helps develop the Georgian capital market as well. DFIs raise the local currency funds through a public placement of GEL-denominated bonds on the Georgian Stock Exchange arranged by Galt & Taggart, the Group’s wholly-owned brokerage arm.
In 2017, Bank of Georgia pioneered the first GEL-denominated bond issuance to a broad base of investors on the Irish Stock Exchange. The issuance of GEL 500 million was the first international local currency bond offering from the wider CIS region (excluding Russia) in the past ten years and represented a landmark transaction for Georgia. The issuance marked an extraordinary precedence of foreign investors assuming Georgian local currency risk and thus expressing their trust in the currency.
In 2018, the Bank executed its first local currency transaction with Symbiotics – a Swiss investment company active in emerging and frontier economies. The GEL-denominated loan facility, totaling GEL 25 million (US$ 10 million) with a maturity of two to three years was an unhedged transaction, whereby Symbiotics assumed the exposure to Georgian Lari. Transactions of this kind are critical for the larisation of the Georgian economy.
In 2018, Dutch development bank, Nederlandse Financierings-Maatschappij Voor Ontwikkelingslanden N.V. (FMO) chose Bank of Georgia as its trusted counterparty for its first local currency transaction in Georgia. The Bank raised a GEL 160 million five-year facility to reinforce its lending capacity of GEL-denominated loans in the local market and further contribute to de-dollarising the Georgian economy.
Over the last three years, the Bank of Georgia raised local currency funding from credit institutions and foreign investors in the amount of around GEL 1 billion. In 2018, the Group’s local currency deposits were 32.5% of the total deposits, up from 30.5% in 2017. The loan book larisation reached 38.3% of the total loan portfolio, flat y-o-y.
Bank of Georgia’s successful cooperation with its partner financial institutions supports the development of Georgian SMEs by decreasing their exposure to foreign exchange risk which compromises their solvency. The absence of currency mismatches in their assets and liabilities provides the SMEs with a much needed cushion against economic fluctuations and opportunities to grow their businesses notwithstanding external economic shocks. Solvent and naturally hedged Georgian companies translate into a more robust banking sector as well, with much healthier loan books and more sustainable profits. Eventually, the larisation of the Georgian financial sector is a crucial process for all the stakeholders in the economy and Bank of Georgia, as a leading Georgian bank, continues to play an important role in it.
Dec 2008OPIC US$ 29 million ten-year senior mortgage facility
May 2016EBRD GEL 242 million for MSME financing, with five-year maturity
Nov 2006IPO c.US$ 160 million issue price GBP 9.2 GDR listing on LSE
Feb 2008Equity issuance US$ 100 million raised through an offering of new ordinary shares in the form of GDRs
Dec 2018GGF US$ 25 million for energy-efficient projects
Mar 2019Successfully priced the first Additional Tier 1 Capital Notes$100 million 11.125% Perpetual Notes
Dec 2018EFSE US$ 10 million for MSEs
July 2018DEG US$ 43 million for corporate lending
Dec 2010ADB US$ 50 million five-year maturity loan for SMEs
Feb 2012Premium listing on London Stock Exchange
Feb 2005Issues bonds GEL 2 million 11% callable two-year local bonds
Oct 2004Firebird and East Capital become shareholders
1998EBRD becomes a shareholder
mid-1990sEBRD, IFC, DEG and other IFIs provide credit lines to fund growth
Jan 2007Issues
Eurobonds US$ 200 million
9% five-year Eurobond
Sep 2015Citibank
US$ 40 million financing for SME
Apr 2015European Investment Bank EUR 40 million
financing for SME and micro businesses with seven-year maturity
July 2016Issued Eurobonds US$ 350 million
6% seven-year Eurobond
Aug 2016BSTDB GEL 60 million
for MSME financing, with five-year maturity
May 2017Issued local currency Eurobonds GEL 500 million 11% three-year
GEL-denominated bond
Mar 2018BSTDB GEL 75 million local currency funding
Nov 2013Issues Eurobonds US$ 150 million 7.75% Eurobond
consolidated with US$ 250 million 2012 bond
Jul 2012Issues Eurobonds US$ 250 million
7.75% five-year Eurobond
May 2015IFC US$ 90 million subordinated debt
Dec 2013IFC US$ 65 million subordinated debt
Dec 2014US$ 114 million capital raise share price GBP 20.25, raised capital to purchase Privatbank and support
further acquisitions
June 2014EFSE EUR 18.5 million for
MSE and micro businesses
Jan 2007FMO
US$ 12.5 million to finance SME
loan portfolio
* The larisation slowed down in 2018 on the back of local currency depreciation.
July 2018FMO GEL 160 million local currency funding
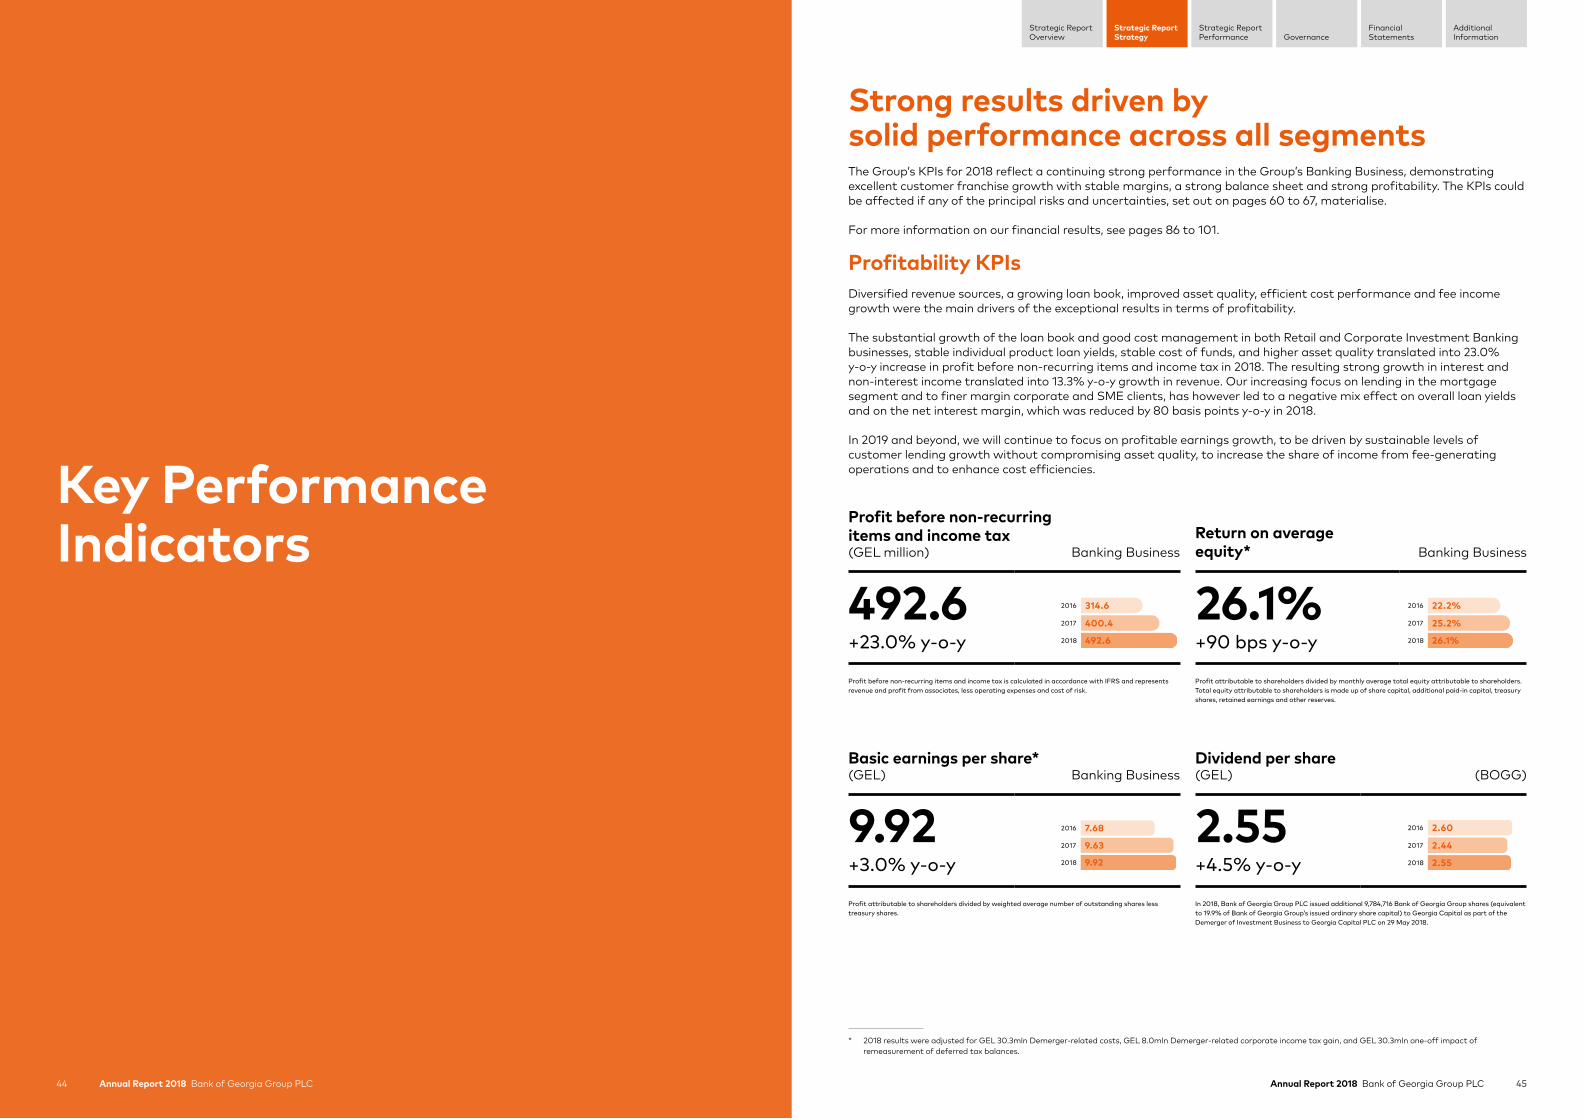
45Annual Report 2018 Bank of Georgia Group PLC
Strategic ReportStrategy
Strategic ReportPerformance Governance
FinancialStatements
AdditionalInformation
Strategic ReportOverview
Annual Report 2018 Bank of Georgia Group PLC44
Key PerformanceIndicators
Strong results driven by solid performance across all segmentsThe Group’s KPIs for 2018 reflect a continuing strong performance in the Group’s Banking Business, demonstrating excellent customer franchise growth with stable margins, a strong balance sheet and strong profitability. The KPIs could be affected if any of the principal risks and uncertainties, set out on pages 60 to 67, materialise.
For more information on our financial results, see pages 86 to 101.
Profitability KPIsDiversified revenue sources, a growing loan book, improved asset quality, efficient cost performance and fee income growth were the main drivers of the exceptional results in terms of profitability.
The substantial growth of the loan book and good cost management in both Retail and Corporate Investment Banking businesses, stable individual product loan yields, stable cost of funds, and higher asset quality translated into 23.0% y-o-y increase in profit before non-recurring items and income tax in 2018. The resulting strong growth in interest and non-interest income translated into 13.3% y-o-y growth in revenue. Our increasing focus on lending in the mortgage segment and to finer margin corporate and SME clients, has however led to a negative mix effect on overall loan yields and on the net interest margin, which was reduced by 80 basis points y-o-y in 2018.
In 2019 and beyond, we will continue to focus on profitable earnings growth, to be driven by sustainable levels of customer lending growth without compromising asset quality, to increase the share of income from fee-generating operations and to enhance cost efficiencies.
Profit before non-recurring items and income tax(GEL million) Banking Business
492.6+23.0% y-o-y
314.6
400.4
492.62018
2017
2016
Profit before non-recurring items and income tax is calculated in accordance with IFRS and represents revenue and profit from associates, less operating expenses and cost of risk.
Basic earnings per share*(GEL) Banking Business
9.92+3.0% y-o-y
7.68
9.63
9.922018
2017
2016
Profit attributable to shareholders divided by weighted average number of outstanding shares less treasury shares.
Return on average equity* Banking Business
26.1%+90 bps y-o-y
22.2%
25.2%
26.1%2018
2017
2016
Profit attributable to shareholders divided by monthly average total equity attributable to shareholders. Total equity attributable to shareholders is made up of share capital, additional paid-in capital, treasury shares, retained earnings and other reserves.
* 2018 results were adjusted for GEL 30.3mln Demerger-related costs, GEL 8.0mln Demerger-related corporate income tax gain, and GEL 30.3mln one-off impact of remeasurement of deferred tax balances.
Dividend per share (GEL) (BOGG)
2.55+4.5% y-o-y
2.60
2.44
2.552018
2017
2016
In 2018, Bank of Georgia Group PLC issued additional 9,784,716 Bank of Georgia Group shares (equivalent to 19.9% of Bank of Georgia Group’s issued ordinary share capital) to Georgia Capital as part of the Demerger of Investment Business to Georgia Capital PLC on 29 May 2018.

46 Annual Report 2018 Bank of Georgia Group PLC 47Annual Report 2018 Bank of Georgia Group PLC
Strategic ReportStrategy
Strategic ReportPerformance Governance
FinancialStatements
AdditionalInformation
Strategic ReportOverview
Cost to income ratio Banking Business
36.7%-100 bps y-o-y
37.7%
37.7%
36.7%2018
2017
2016
Operating expenses divided by revenue.
Net promotion scale (NPS)
38.8%
27.4%
38.8%2018
2017
NPS asks: on a scale of 0-10, how likely is it that you would recommend our Bank to a friend or a colleague? The responses are: 9 and 10 – are promoters; 7 and 8 – are neutral; 1 to 6 – are detractors. The final result, thus an NPS, equals to the percentage of the promoters minus the percentage of the detractors.
Operating leverage Banking Business
2.9%
-6.4%
-0.1%
2.9%2018
2017
2016
Operating leverage is measured as the percentage change in revenue less the percentage change in operating expenses.
Customer satisfaction (CSAT)
25.3%
25.0%
25.3%2018
2017
CSAT asks: on a scale of 1-5, how satisfied are you with a particular channel or a parameter? The final result is the percentage of the respondents that reply with 5 from the total number of the respondents.
Efficiency KPIsIn 2018, operating expenses broadly kept pace with revenue growth, reflecting organic growth of our Retail Banking business and increase in administrative expenses. Express Banking, a technology-intensive remote banking channel, and our remote channels, such as mBank and iBank, are the main drivers of efficiency for our Banking Business. In 2018, we implemented “Agile Delivery” in our information technology arm, which aims at optimising the workflow and coordination processes and increasing end-product quality and usefulness. In 2018, the Bank introduced a “Lean” project, which has already started to improve back office procedures, and introduce end-to-end process optimisation in the mortgage business. Over the last 12 months, the cost to income ratio has improved from 37.7% in 2017, to 36.7% in 2018.
Growth KPIsThe 21.4% loan book growth was driven by our Retail Banking business, which posted a 24.2% growth in the loan book in 2018. The Corporate Investment Banking loan book increased by 15.9% in 2018, after delivering on the targets of loan portfolio risk de-concentration initiatives in 2017. We expect customer lending growth for the medium to long term to be comfortably within our 15-20% expected growth range, with lending growth expectations over the next 12 months to be closer to 15%.
Asset quality KPIsOur asset quality improved in 2018, as a result of our prudent application of the Group’s risk management policies, good lending discipline and the ongoing strength of the Georgian economy. Cost of credit risk ratio decreased from 2.2% in 2017 to 1.6% in 2018. NPLs to gross loans improved from 3.8% as at 31 December 2017 to 3.3% at the end of 2018. NPL coverage ratio went down in 2018 to 90.5%.
Capital KPIsIn 2018, our Tier I Capital Adequacy ratio (NBG, Basel III) stood at 12.2%. The risk weighted assets increased by 23.4%, reflecting the increase in interest earning assets during the year. We continue to generate high levels of internal capital as a result of both the Bank’s high return on average equity, and the improved risk asset intensity of our lending growth. Over the medium term, we will focus on managing our capital ratios c.200 basis points over our minimum regulatory requirements.
Non-financial KPIsThe Bank tracks customer satisfaction with multiple survey channels and several key performance indicators on an ongoing basis, followed by an effective “close-the-loop” process. The Bank is responsive to the customer feedback which it collects on a daily basis and has been consistently working on integrating the customer experience in its processes. Going forward, we aim at improving these non-financial KPIs.
Cost of credit risk Banking Business
1.6%-60 bps y-o-y
2.7%
2.2%
1.6%2018
2017
2016
Cost of credit risk ratio equals expected credit loss/impairment charge for loans to customers and finance lease receivables for the period divided by monthly average gross loans to customers and finance lease receivables over the same period.
Tier 1 capital adequacy ratio, (NBG, Basel III)** Bank of Georgia
12.2%
9.1%
12.4%
12.2%2018
2017
2016
NBG (Basel III) Tier I capital adequacy ratio equals Tier I capital divided by total risk weighted assets, both calculated in accordance with the requirements of the National Bank of Georgia instructions.
NPL coverage ratio adjusted for discounted value of collateral Banking Business
129.9%-70 bps y-o-y
132.1%
130.6%
129.9%2018
2017
2016
NPL coverage ratio adjusted for discounted value of collateral equals allowance for expected credit loss/impairment loss of loans and finance lease receivables divided by NPLs (discounted value of collateral is added back to allowance for expected credit loss/impairment loss).
Leverage (times) Banking Business
7.2
7.2
7.3
7.22018
2017
2016
Leverage (times) equals total liabilities divided by total equity.
** Tier 1 capital adequacy ratio at 31 December 2016 is presented in accordance with NBG Basel II guidelines.
Net loan book growth Banking Business
21.4%
24.5%
15.9%
21.4%2018
2017
2016
Net loans to customers and finance lease receivables at the end of the year compared to the previous year.
Key performance indicators continued

49Annual Report 2018 Bank of Georgia Group PLC
Strategic ReportStrategy
Strategic ReportPerformance Governance
FinancialStatements
AdditionalInformation
Strategic ReportOverview
Annual Report 2018 Bank of Georgia Group PLC48
We identify, evaluate, manage and monitor the risks that we face through an integrated control framework supported by formal policies and procedures, clearly delegated authority levels and comprehensive reporting. The Board confirms that our framework has been in place throughout the year under review and to the date of approval of this Annual Report and that it is integrated into both our business planning and viability assessment processes.
Overview Our Board, supported by its Audit and Risk Committees and the Management Board, is ultimately responsible for the Group’s risk management and internal controls. We believe that in order to have an effective risk management framework there needs to be a strong risk management culture within the Group. In this section we demonstrate how we ensure that managing risk is ingrained in our everyday business activities. We seek to create an environment where there is openness and transparency in how we make decisions and manage risks and where business managers are accountable for the risk management and internal control processes associated with their activities. Our culture also seeks to ensure that risk management is responsive, forward-looking and consistent.
Our framework The Board’s mandate includes determining the Group’s risk appetite and risk tolerance as well as monitoring risk exposures to ensure that the nature and extent of the main risks we face are consistent with our overall goals and strategic objectives. The Board is accountable for reviewing the effectiveness of the systems and processes of risk management and internal control, with the Audit and Risk Committees assisting in the discharge of this responsibility. At the Board, Committee and Management Board levels, we develop formal policies and procedures which explain the way in which risks need to be systematically identified, assessed, quantified, managed and monitored.
Each business participates in the risk management process by identifying the key risks applicable to its business. The principal risks and uncertainties faced by the Group are identified through this bottom-up process.
On a day-to-day basis, the Management Board is responsible for the implementation of the Group’s risk management and other internal control policies and procedures. Based on our risk culture, managers “own” the risks relevant to their respective function. For each risk identified at any level of the business, the risk is measured, mitigated (if possible) in accordance with our policies and procedures and monitored. Managers are required to report on identified risks and responses to such risks on a consistent and frequent basis. The Management Board regularly reviews the output from the bottom-up process by providing independent challenge and assessing the implementation of the risk management and internal
control policies and procedures. Our reporting process enables key risks to be escalated to the appropriate level of authority and provides assurance to the Committees and the Board. Key developments affecting our principal risks and associated mitigating actions are reviewed quarterly (or more often if necessary on an ad hoc basis, outside of the regular reporting process) by the Audit and Risk Committees, as appropriate, and the Board. The principal risks and uncertainties faced by the Group are identified through the above processes.
A description of these principal risks and uncertainties, including recent trends and outlook, as well as mitigation efforts, can be found on pages 60 to 67 of the Strategic Report.
Internal control Our Board is responsible for reviewing and approving the Group’s system of internal control and its adequacy and effectiveness. Controls are reviewed to ensure effective management of risks we face. Certain matters – such as the approval of major capital expenditure, significant acquisitions or disposals and major contracts – are reserved exclusively for the Board. The full schedule of matters specifically reserved for the Board can be found on our website, at https://bankofgeorgiagroup.com/governance/documents. For other matters, the Board is often assisted by both the Audit and Risk Committees.
With respect to internal control over financial reporting, including over the Group’s consolidation process, our financial procedures include a range of system, transactional and management oversight controls. The Group prepares detailed monthly management reports that include analyses of results along with comparisons, relevant strategic plans, budgets, forecasts and prior results. These are presented to and reviewed by the Management Board. Each quarter, the Bank’s CFO and other members of the finance team discuss financial reporting and associated internal controls with the Audit Committee, which reports significant findings to the Board. The Audit Committee also reviews the quarterly, half-year and full year financial statements and corresponding results announcements and advises the Board. The external and internal auditors attend each Audit Committee meeting and the Audit Committee meets them regularly both with and without the Management Board present.
Our Audit and Risk Committees monitor internal control over operating and compliance risk through discussions with the Bank’s Deputy CEO, Chief Risk Officer, the Bank’s Head of AML and Compliance, Head of Internal Audit and other Management Board members on a quarterly basis. Any key issues identified are escalated to the Board. The Board also receives regular presentations directly from the head of each risk unit of the Bank. Principal risk and internal control issues are addressed in such presentations. The Bank’s Internal Audit function reviews a number of areas of risk pursuant to an annual programme approved by the Audit Committee. Any significant issues or risks
Creating a culture of integrity and accountability
Bank of Georgia Group Risk Management

50 Annual Report 2018 Bank of Georgia Group PLC 51Annual Report 2018 Bank of Georgia Group PLC
Strategic ReportStrategy
Strategic ReportPerformance Governance
FinancialStatements
AdditionalInformation
Strategic ReportOverview
Risk management continued
arising from an internal audit are reported to the Audit Committee which monitors that appropriate actions are undertaken to ensure satisfactory resolution. The Bank’s Head of Internal Audit has a direct reporting line to the Chairman of the Audit Committee.
Our systems of internal control are also supported by our Whistleblowing Policy, which allows employees to report concerns on an anonymous basis. Responsibility for the Whistleblowing Policy resides with the Board, and both the Board and Audit Committee receive annual and ad hoc reports on the operation of the policy from the Head of AML and Compliance of the Bank on any significant issues raised.
Effectiveness review Each year, we review the effectiveness of our risk management processes and internal control systems, with the assistance of the Audit and Risk Committees. This review covers all material systems, including financial, operational and compliance controls. The latest review covered the financial year to 31 December 2018 and obtained assurance from the Management Board and Internal Audit of the Bank. The Board is able to conclude with reasonable assurance that the appropriate internal controls and risk management systems were maintained and operated effectively throughout 2018 and that these systems continued to operate effectively up to the date of approval of this Annual Report. The review did not identify any significant weaknesses or failings in the systems. We are satisfied that our risk management processes and internal control systems processes comply with the UK Corporate Governance Code 2016 (the Code) and the Financial Reporting Council (FRC)’s guidance on Risk Management, Internal Control and Related Financial and Business Reporting. Although we did not identify any significant weaknesses or failings, we continuously strive to improve our framework and focus on further mitigating our key risks, especially as they evolve. As part of this, we provide mandatory online training to staff on the importance of risk management and internal controls.
Committee reports As noted throughout this discussion, both the Audit and Risk Committees play an essential role in implementing effective risk management and internal control. Each Committee has described this work in its Committee Report.
The Audit Committee Report and Risk Committee Report can be found on pages 121 to 125 and pages 126 to 128, respectively.
Viability statementThe Board has undertaken the assessment of the Group’s prospects to meet its liabilities by taking into account its current position and principal risks.
The Group’s going concern statement and viability statement are on pages 68 to 69.
AML andCompliance
Portfolio riskmanagement
Quantitative riskmanagement and
risk analytics
Credit Committee
Credit riskmanagement LegalTreasury
Management Board
Supervisory Boardof Bank of Georgia
Asset and LiabilityManagement Board
Audit Committee
Internal Audit
Risk Committee
Operational riskmanagement
Risk management bodies of Bank of Georgia
Management Board. The Management Board has overall responsibility for the Bank’s asset, liability and risk management activities, policies and procedures. In order to effectively implement the risk management system, the Management Board delegates individual risk management functions to each of the various decision-making and execution bodies within the Bank.
Internal Audit department. The Bank’s Internal Audit department is responsible for the regular review/audit of the Bank’s operations, activities, systems and processes, in order to evaluate and provide reasonable, independent and objective assurance and consulting services designed to add value and improve the Bank’s operations.
The Internal Audit department is independent of the Bank’s Management Board. The Head of the Internal Audit department is appointed by the Bank’s Supervisory Board and reports directly to the Bank’s Audit Committee. The Bank’s Internal Audit department discusses the outcomes of all assessments with the Bank’s Management Board and reports its findings and recommendations to the Bank’s Audit Committee.
Bank risk managementThe Bank is the principal driver of the Group’s revenue and operates in the financial services sector, therefore, its risk management and internal control framework are fundamental to that of the Group. The work undertaken by the Bank’s risk management bodies feeds back directly to the Group.
Given the significance of the Bank, the risk management and internal control framework in place at the Bank are described below.
The role of the Bank in the overall risk management structureManagement of risk is fundamental to the Banking Business and is an essential element of the Group’s operations. The main risks inherent in the Bank’s operations are credit risk, liquidity risk, market risk (including currency and foreign exchange rate risks), operational risk and legal risk. The following is a description of the Bank’s risk management policies and procedures in respect of those risks. Business risks such as changes in the environment, technology and industry are monitored through the Group’s strategic planning process.
The Bank’s risk management system is based on the principle of continually assessing risk throughout the life of any operation and includes such stages as:• risk identification; • qualitative and quantitative assessment
of a particular risk; • determination of an acceptable risk level; • risk monitoring and mitigation; • ongoing monitoring and control allowing efficient
adjustments in case of any changes in the conditions on which the preliminary risk assessment was made; and
• analysis of the effectiveness of the risk management system.
Bank risk management bodiesThe principal risk management bodies of the Bank are the: Supervisory Board, Audit Committee*, Risk Committee, Management Board, Internal Audit, Treasury, Credit Committee, Asset and Liability Management Committee (the “ALCO”), AML and Compliance and Legal department. The Supervisory Board, Audit Committee and Risk Committee perform similar roles as the Group Board, the Group Audit Committee and the Group Risk Committee, only at Bank level.
* In January 2019, Audit Committee of the Bank was transformed into the Audit and Corporate Governance Committee in accordance with NBG Corporate Governance Code.
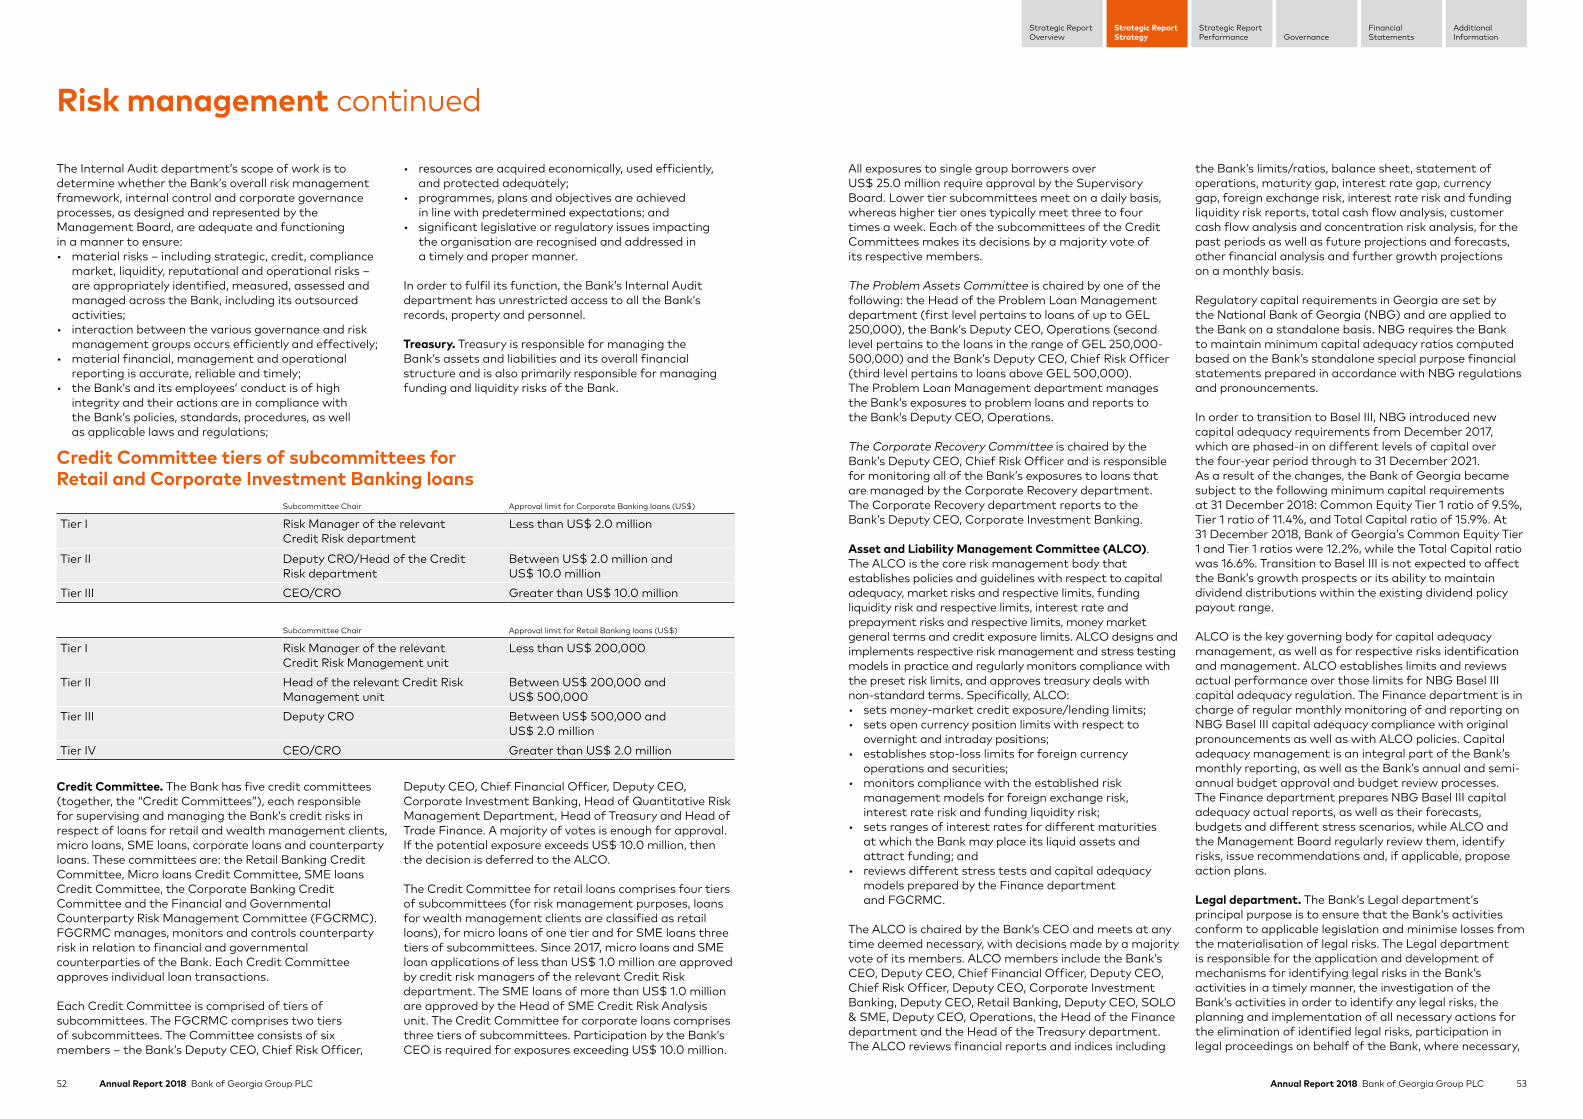
52 Annual Report 2018 Bank of Georgia Group PLC 53Annual Report 2018 Bank of Georgia Group PLC
Strategic ReportStrategy
Strategic ReportPerformance Governance
FinancialStatements
AdditionalInformation
Strategic ReportOverview
The Internal Audit department’s scope of work is to determine whether the Bank’s overall risk management framework, internal control and corporate governance processes, as designed and represented by the Management Board, are adequate and functioning in a manner to ensure: • material risks – including strategic, credit, compliance
market, liquidity, reputational and operational risks – are appropriately identified, measured, assessed and managed across the Bank, including its outsourced activities;
• interaction between the various governance and risk management groups occurs efficiently and effectively;
• material financial, management and operational reporting is accurate, reliable and timely;
• the Bank’s and its employees’ conduct is of high integrity and their actions are in compliance with the Bank’s policies, standards, procedures, as well as applicable laws and regulations;
• resources are acquired economically, used efficiently, and protected adequately;
• programmes, plans and objectives are achieved in line with predetermined expectations; and
• significant legislative or regulatory issues impacting the organisation are recognised and addressed in a timely and proper manner.
In order to fulfil its function, the Bank’s Internal Audit department has unrestricted access to all the Bank’s records, property and personnel.
Treasury. Treasury is responsible for managing the Bank’s assets and liabilities and its overall financial structure and is also primarily responsible for managing funding and liquidity risks of the Bank.
Risk management continued
Credit Committee tiers of subcommittees for Retail and Corporate Investment Banking loans
Subcommittee Chair Approval limit for Corporate Banking loans (US$)
Tier I Risk Manager of the relevant Credit Risk department
Less than US$ 2.0 million
Tier II Deputy CRO/Head of the Credit Risk department
Between US$ 2.0 million and US$ 10.0 million
Tier III CEO/CRO Greater than US$ 10.0 million
Subcommittee Chair Approval limit for Retail Banking loans (US$)
Tier I Risk Manager of the relevant Credit Risk Management unit
Less than US$ 200,000
Tier II Head of the relevant Credit Risk Management unit
Between US$ 200,000 and US$ 500,000
Tier III Deputy CRO Between US$ 500,000 and US$ 2.0 million
Tier IV CEO/CRO Greater than US$ 2.0 million
All exposures to single group borrowers over US$ 25.0 million require approval by the Supervisory Board. Lower tier subcommittees meet on a daily basis, whereas higher tier ones typically meet three to four times a week. Each of the subcommittees of the Credit Committees makes its decisions by a majority vote of its respective members.
The Problem Assets Committee is chaired by one of the following: the Head of the Problem Loan Management department (first level pertains to loans of up to GEL 250,000), the Bank’s Deputy CEO, Operations (second level pertains to the loans in the range of GEL 250,000-500,000) and the Bank’s Deputy CEO, Chief Risk Officer (third level pertains to loans above GEL 500,000). The Problem Loan Management department manages the Bank’s exposures to problem loans and reports to the Bank’s Deputy CEO, Operations.
The Corporate Recovery Committee is chaired by the Bank’s Deputy CEO, Chief Risk Officer and is responsible for monitoring all of the Bank’s exposures to loans that are managed by the Corporate Recovery department. The Corporate Recovery department reports to the Bank’s Deputy CEO, Corporate Investment Banking.
Asset and Liability Management Committee (ALCO). The ALCO is the core risk management body that establishes policies and guidelines with respect to capital adequacy, market risks and respective limits, funding liquidity risk and respective limits, interest rate and prepayment risks and respective limits, money market general terms and credit exposure limits. ALCO designs and implements respective risk management and stress testing models in practice and regularly monitors compliance with the preset risk limits, and approves treasury deals with non-standard terms. Specifically, ALCO:• sets money-market credit exposure/lending limits; • sets open currency position limits with respect to
overnight and intraday positions; • establishes stop-loss limits for foreign currency
operations and securities; • monitors compliance with the established risk
management models for foreign exchange risk, interest rate risk and funding liquidity risk;
• sets ranges of interest rates for different maturities at which the Bank may place its liquid assets and attract funding; and
• reviews different stress tests and capital adequacy models prepared by the Finance department and FGCRMC.
The ALCO is chaired by the Bank’s CEO and meets at any time deemed necessary, with decisions made by a majority vote of its members. ALCO members include the Bank’s CEO, Deputy CEO, Chief Financial Officer, Deputy CEO, Chief Risk Officer, Deputy CEO, Corporate Investment Banking, Deputy CEO, Retail Banking, Deputy CEO, SOLO & SME, Deputy CEO, Operations, the Head of the Finance department and the Head of the Treasury department. The ALCO reviews financial reports and indices including
the Bank’s limits/ratios, balance sheet, statement of operations, maturity gap, interest rate gap, currency gap, foreign exchange risk, interest rate risk and funding liquidity risk reports, total cash flow analysis, customer cash flow analysis and concentration risk analysis, for the past periods as well as future projections and forecasts, other financial analysis and further growth projections on a monthly basis.
Regulatory capital requirements in Georgia are set by the National Bank of Georgia (NBG) and are applied to the Bank on a standalone basis. NBG requires the Bank to maintain minimum capital adequacy ratios computed based on the Bank’s standalone special purpose financial statements prepared in accordance with NBG regulations and pronouncements.
In order to transition to Basel III, NBG introduced new capital adequacy requirements from December 2017, which are phased-in on different levels of capital over the four-year period through to 31 December 2021. As a result of the changes, the Bank of Georgia became subject to the following minimum capital requirements at 31 December 2018: Common Equity Tier 1 ratio of 9.5%, Tier 1 ratio of 11.4%, and Total Capital ratio of 15.9%. At 31 December 2018, Bank of Georgia’s Common Equity Tier 1 and Tier 1 ratios were 12.2%, while the Total Capital ratio was 16.6%. Transition to Basel III is not expected to affect the Bank’s growth prospects or its ability to maintain dividend distributions within the existing dividend policy payout range.
ALCO is the key governing body for capital adequacy management, as well as for respective risks identification and management. ALCO establishes limits and reviews actual performance over those limits for NBG Basel III capital adequacy regulation. The Finance department is in charge of regular monthly monitoring of and reporting on NBG Basel III capital adequacy compliance with original pronouncements as well as with ALCO policies. Capital adequacy management is an integral part of the Bank’s monthly reporting, as well as the Bank’s annual and semi-annual budget approval and budget review processes. The Finance department prepares NBG Basel III capital adequacy actual reports, as well as their forecasts, budgets and different stress scenarios, while ALCO and the Management Board regularly review them, identify risks, issue recommendations and, if applicable, propose action plans.
Legal department. The Bank’s Legal department’s principal purpose is to ensure that the Bank’s activities conform to applicable legislation and minimise losses from the materialisation of legal risks. The Legal department is responsible for the application and development of mechanisms for identifying legal risks in the Bank’s activities in a timely manner, the investigation of the Bank’s activities in order to identify any legal risks, the planning and implementation of all necessary actions for the elimination of identified legal risks, participation in legal proceedings on behalf of the Bank, where necessary,
Credit Committee. The Bank has five credit committees (together, the “Credit Committees”), each responsible for supervising and managing the Bank’s credit risks in respect of loans for retail and wealth management clients, micro loans, SME loans, corporate loans and counterparty loans. These committees are: the Retail Banking Credit Committee, Micro loans Credit Committee, SME loans Credit Committee, the Corporate Banking Credit Committee and the Financial and Governmental Counterparty Risk Management Committee (FGCRMC). FGCRMC manages, monitors and controls counterparty risk in relation to financial and governmental counterparties of the Bank. Each Credit Committee approves individual loan transactions.
Each Credit Committee is comprised of tiers of subcommittees. The FGCRMC comprises two tiers of subcommittees. The Committee consists of six members – the Bank’s Deputy CEO, Chief Risk Officer,
Deputy CEO, Chief Financial Officer, Deputy CEO, Corporate Investment Banking, Head of Quantitative Risk Management Department, Head of Treasury and Head of Trade Finance. A majority of votes is enough for approval. If the potential exposure exceeds US$ 10.0 million, then the decision is deferred to the ALCO.
The Credit Committee for retail loans comprises four tiers of subcommittees (for risk management purposes, loans for wealth management clients are classified as retail loans), for micro loans of one tier and for SME loans three tiers of subcommittees. Since 2017, micro loans and SME loan applications of less than US$ 1.0 million are approved by credit risk managers of the relevant Credit Risk department. The SME loans of more than US$ 1.0 million are approved by the Head of SME Credit Risk Analysis unit. The Credit Committee for corporate loans comprises three tiers of subcommittees. Participation by the Bank’s CEO is required for exposures exceeding US$ 10.0 million.
54 Annual Report 2018 Bank of Georgia Group PLC 55Annual Report 2018 Bank of Georgia Group PLC
Strategic ReportStrategy
Strategic ReportPerformance Governance
FinancialStatements
AdditionalInformation
Strategic ReportOverview
and the investigation of possibilities for increasing the effectiveness of the Bank’s legal documentation and its implementation in the Bank’s daily activities. The Legal department is also responsible for providing legal support to structural units of the Bank and/or its subsidiaries.
Anti-Money Laundering (AML) and Compliance. The Bank’s AML and Compliance department is responsible for the implementation of the Bank’s AML programme (including the development of AML policies and procedures, transaction monitoring and reporting, and employee training) throughout the Bank and its subsidiaries. The AML programme is based on recommendations, directives and requirements of international organisations, including FATF/Basel, the European Parliament, and the US Department of the Treasury on sanctions programmes, as well as local regulations. The Bank’s Internal Audit department makes annual assessments of the Bank’s AML systems and controls, and provides independent assurance of internal controls.
The Bank has adopted a risk-based approach towards ML/FT risks, including a general anti-money laundering policy, customer acceptance policy and financial sanctions compliance policy. The Bank’s risk-based approach means that it applies enhanced due diligence towards ML/FT risks, it determines high-risk categories of products, customers, services and jurisdictions.
The Bank is obliged to notify the Financial Monitoring Service of Georgia of all transactions that are subject to monitoring in accordance with Georgian legislation. These reports are currently filed in electronic form in an offline mode by the AML and Compliance department. The reporting process is fully automated and is supported by a special software application. Furthermore, the Bank operates special AML software, which meets industry requirements. The programme allows fully-automated monitoring of all transactions against every sanctions list, as well as debarred and banned individuals and organisations, as identified by OFAC, the EU, the UN and other similar bodies. In pursuance of identifying suspicious transactions the Bank’s AML and Compliance department has implemented a centralised solution that links transactions, accounts and customers so that the Bank can see the enterprise-wide risk associated with each customer.
Bodies implementing the risk management systemThe Bank’s risk management system is implemented by the Bank’s Credit Risk department, Quantitative Risk Management and Risk Analytics department, Treasury, Operational Risk Management, Legal, AML and Compliance and Security departments, Finance department and other departments. The Credit Risk, Quantitative Risk Management and Risk Analytics, Portfolio Risk Management and Operational Risk Management departments report to the Bank’s Deputy CEO, Chief Risk Officer and the Legal department is
under supervision of the Bank’s General Counsel, who directly reports to the Bank’s CEO. The Finance department and the Treasury department report to the Bank’s Deputy CEO, Chief Financial Officer. The AML and Compliance department reports to the Bank’s Deputy CEO, Operations.
The Quantitative Risk Management and Risk Analytics department, in coordination with the Treasury, implements the Bank’s market risk policies by ensuring compliance with established open currency position limits, counterparty limits, VAR limits on possible losses and the interest rate policy set by the ALCO.
The Treasury department manages foreign currency exchange, money market, securities portfolio and derivatives operations and monitors compliance with the limits set by the ALCO for these operations. The Treasury department is also responsible for management of short-term liquidity and treasury cash flow and monitors the volumes of cash in the Bank’s ATMs and at its service centres.
The Credit Risk department manages credit risks with respect to particular borrowers and assesses overall loan portfolio risks. It is responsible for ensuring compliance with the Bank’s Credit Policies and management of the quality of the Bank’s loan portfolio.
The Portfolio Risk Management department manages and assesses credit risk with respect to the overall loan portfolio and is responsible for providing recommendations on the improvement of loan portfolio quality to minimise credit losses. It develops the Bank’s portfolio quality control models/methods and ensures compliance with the Bank’s Credit Policies and established limits.
The Operational Risk Management department identifies and assesses operational risk within the Bank’s processes and operations. It also detects critical risk areas or groups of operations with an increased risk level and develops internal control procedures to address these risks, through (among other things) business-process redesign schemes, including document circulation, information streams, distribution of functions, permissions and responsibility.
The Legal department monitors all changes in relevant laws and regulations, and ensures that those changes are properly reflected in the Bank’s procedures, instructions, manuals, templates and other relevant documentation. It also disseminates information on legislative changes to all relevant departments within the Bank. The Legal department participates in drafting laws and regulatory documents upon request of legislators and regulators, certain associations and other professional bodies.
The Tax Reporting and Tax Risks Management unit focuses on the Bank’s relationship with the tax authorities, provides practical advice and monitors tax compliance across the Group.
Each of these departments is provided with policies and/or manuals that are approved by the Bank’s Management Board and/or the Supervisory Board (as required). The manuals and policies include comprehensive guidance for each stage of a transaction, including, but not limited to, manuals outlining asset and liability management policies, foreign exchange operations procedures, fixed income investment guidelines, Retail Banking operations procedures, the deposit policy and Credit Policies.
Risk measurement and reporting. The Bank measures risk using a method which reflects both the expected loss likely to arise in normal circumstances and unexpected losses, which are an estimate of the ultimate actual loss based on different forecasting models. These models use probabilities derived from historical experience, adjusted from time to time to reflect the economic environment. The Bank also models scenarios simulating the impact of extreme events.
Monitoring and controlling of risks is primarily performed based on limits established by the Bank. These limits reflect the business strategy and market environment of the Bank, as well as the level of risk that it is willing to accept, with additional emphasis on selected industries. The Bank also conducts ongoing monitoring and control, allowing efficient adjustments in case of any unexpected changes in the conditions on which the preliminary risk assessment was made. In addition, the Bank monitors and measures overall risk-bearing capacity in relation to aggregate risk exposure across all risk types and activities.
The Bank maintains a management reporting system which requires the Credit Risk, Quantitative Risk Management and Risk Analytics, Portfolio Risk Management, Finance and Treasury departments to prepare certain reports on a daily and monthly basis. On a daily basis, a statement of operations, balance sheet and treasury report (which includes the Bank’s open foreign exchange positions, cash flows, limits and balances on correspondent accounts with other banks) and confirmation that there has been compliance with mandatory financial ratios must be provided by each department. On a monthly basis, a report on the structural liquidity gap, a report on interest rate risk, and financial statements are produced, and these are summarised in a quarterly report to the Bank’s Supervisory Board and to the Risk Committee containing analysis of the Bank’s performance against its budget. Information compiled from all the businesses is examined and processed in order to analyse, control and identify emerging risks. This information is presented and explained to the Management Board and the head of each business division. The report includes aggregate credit exposure, liquidity ratios and risk profile changes. The Bank’s Management Board assesses the appropriateness of the allowance for credit losses on a monthly basis. The Management Board and the Supervisory Board receive a comprehensive risk report once a quarter which is designed to provide all the necessary information to assess and draw conclusions on the Bank’s risk exposure.
Specifically tailored risk reports are prepared and distributed to all levels throughout the Bank in order to ensure that all business divisions have access to extensive, relevant and up-to-date information. A daily briefing is given to the Bank’s Management Board and all other relevant employees of the Bank on the utilisation of market limits, proprietary investments and liquidity, as well as any other risk developments.
Risk mitigation and excessive risk concentrationAs part of its overall risk management, the Bank uses derivatives and other instruments to manage exposures resulting from changes in interest rates, foreign currencies, credit risks, and exposures arising from forward transactions. While these derivatives are intended for hedging, they do not qualify for hedge accounting.
The Bank actively uses collateral to reduce its credit risks.
In order to avoid excessive concentrations of risks, the Bank focuses on maintaining a diversified portfolio. Identified concentrations of credit risks are controlled and managed accordingly. Concentrations arise when a number of counterparties, or related shareholders, are engaged in similar business activities, or activities in the same geographic region, or have similar economic features that would cause their ability to meet contractual obligations to be similarly affected by changes in economic, political or other conditions. Concentrations also involve combined, aggregate exposures of large and significant credits compared to the total outstanding balance of the respective financial instrument(s).
Concentrations indicate the relative sensitivity of the Bank’s performance to developments affecting a particular industry or geographical location. Identified concentrations of credit risks are controlled and managed accordingly.
Credit riskDefinition: Credit risk is the risk that a borrower or counterparty will be unable to pay amounts in full or in part when due. Credit risk arises mainly in the context of the Bank’s lending activities.
Mitigation: The general principles of the Bank’s credit policy are outlined in the Credit Policies. The Credit Policies also outline credit risk control and monitoring procedures and the Bank’s credit risk management systems. The Credit Policies are reviewed annually or more frequently, if necessary. As a result of these reviews, new loan restructuring tools are introduced. The Bank also uses the NBG’s provisioning methodology in order to comply with NBG requirements.
The Bank manages its credit risk by placing limits on the amount of risk accepted with respect to individual corporate borrowers or groups of related borrowers, liability of insurance companies, types of banking
Risk management continued

56 Annual Report 2018 Bank of Georgia Group PLC 57Annual Report 2018 Bank of Georgia Group PLC
Strategic ReportStrategy
Strategic ReportPerformance Governance
FinancialStatements
AdditionalInformation
Strategic ReportOverview
operations and by complying with the exposure limits established by the NBG. The Bank also mitigates its credit risk by obtaining collateral and using other security arrangements. The Bank monitors the market value of collateral, requests additional collateral in accordance with the underlying agreement and monitors the market value of collateral obtained during its review of the adequacy of the allowance for ELC/impairment losses. The exposure to financial institutions is managed by limits covering on and off-balance sheet exposures and by settlement limits with respect to trading transactions such as foreign exchange contracts.
The Credit Committees approve individual transactions and the Credit Risk department establishes credit risk categories and the provisioning rates, which are set as per the provisioning methodology. The Bank’s Deputy CEO, Chief Risk Officer, the Credit Risk department and the Portfolio Risk Management department review the credit quality of the portfolio and set provisioning rates, in consultation with the Bank’s CEO and Deputy CEO, Chief Financial Officer, on a monthly basis.
The Bank’s credit quality review process provides early identification of possible changes in the creditworthiness of counterparties, including regular collateral revaluations. Counterparty limits are established by the use of a credit risk classification system, which assigns a risk rating to each counterparty. Risk ratings are subject to regular revision. The credit quality review process allows the Bank to assess the potential loss as a result of the risks to which it is exposed and to take corrective action. The Bank makes available to its customers guarantees/letters of credit, which may require that the Bank makes payments on their behalf. Such payments are collected from customers based on the terms of the guarantee/letter of credit. They expose the Bank to similar risks to loans and these are mitigated by the same control processes and policies.
Loan approval proceduresThe procedures for approving loans, monitoring loan quality and for extending, refinancing and/or restructuring existing loans are set out in the Bank’s Credit Policies that are approved by the Supervisory Board and/or the Management Board of the Bank. The Credit Committees approve individual transactions.
The Bank evaluates Corporate Investment Banking clients on the basis of their financial condition, credit history, business operations, market position, management, level of shareholder support, proposed business and financing plan and on the quality of the collateral offered. The appropriate level of the relevant Credit Committee is responsible for making the decision for loan approval based on credit memorandum and, where appropriate, the Credit Risk Manager’s report.
The loan approval procedures for Retail Banking loans depend on the type of retail lending products. Applications for consumer loans, including credit cards and auto loans up to GEL 50,000 are approved by the scoring system.
Applications for mortgage loans of Retail Banking clients are completed by the Mortgage Loan Officer and submitted to the Credit Risk Manager, who evaluate the credit risks and determine the amount, terms and conditions of the loan, which must be approved at the appropriate level of the Credit Committee. In the case of micro financing loans and SME loans of less than US$ 1.0 million, loan officers evaluate loan applications, prepare a project analysis and submit proposals to the relevant Credit Risk Manager, who makes the final decision. Loans of more than US$ 1.0 million to SMEs are approved by the Head of SME Credit Risk Analysis unit.
CollateralThe Bank typically requires credit support or collateral as security for the loans and credit facilities that it grants. The main forms of credit support are guarantees and rights to claim amounts on the borrower’s current account with the Bank or other assets. The main forms of collateral for corporate lending are charges over real estate properties, equipment, inventory and trade receivables and the main form of collateral for retail lending is a mortgage over residential property. In the case of corporate loans, the Bank usually requires a personal guarantee (surety) from the borrower’s shareholders. Under the Bank’s internal guidelines, collateral should be provided (where it is required) to cover outstanding liabilities during the entire duration of a transaction. As of 31 December 2018, 85.7% of the loan portfolio was collateralised. An evaluation report of the proposed collateral is prepared by the Asset Evaluation department or by the third party asset appraisal company and submitted to the appropriate Credit Committee, together with the loan application and Credit Risk Manager’s report. When evaluating collateral, the Bank discounts the market value of the assets to reflect the liquidation value of the collateral.
MeasurementExposure and limits are subject to annual or more frequent review. The Bank’s compliance with credit risk exposure limits is monitored by the Credit Risk department on a continuous basis. The allowance is based on the Expected Credit Loss (ECL) associated with the probability of default in the next 12 months, unless there has been a significant increase in credit risk since the loan origination, in which case the allowance is based on the ECL over the life of the asset. The allowance for credit losses is based on forward- looking information, which takes into consideration past events, current conditions and forecasts of future economic conditions. The Bank establishes the ECL of financial assets on a collective basis and on an individual basis when a financial asset or group of financial assets is impaired. The Bank creates the ECL by reference to the particular borrower’s financial condition, the number of days the relevant loan is overdue, changes in credit risk since loan origination, any forecasts for adverse changes in commercial, financial or economic conditions affecting the creditworthiness of the borrower and other qualitative indicators, such as external market or general economic conditions. If in a subsequent period
the amount of the ECL decreases the previously recognised loss is reversed by an adjusted ECL account. The determination of ECL is based on an analysis of the assets at risk and reflects the amount which, in the judgement of the Bank’s Management Board, is adequate to provide for expected losses considering forward- looking information.
Provisions are made against gross loan amounts and accrued interest. Under the Bank’s internal loan loss allowance methodology, which is based upon IFRS requirements, the Bank categorises its loan portfolio into significant and non-significant loans. Significant loans are defined as loans in excess of US$ 1.0 million and non-significant loans are defined as loans below US$ 1.0 million. The Credit Risk department makes an individual assessment of all defaulted significant loans. Non-defaulted significant loans are given a collective assessment rate. For the purposes of provisioning, all loans are divided into different groups (such as mortgage, consumer, micro loans).
In 2004, the Bank, jointly with certain other Georgian banks and with the CreditInfo hf, an international holding of credit information bureaus and a provider of credit information solutions, established Credit Information Group (CIG) to serve as a centralised credit bureau in Georgia. Most Georgian banks have shared negative customer information since July 2006. Since 2009, they also share and contribute positive and negative customer credit information to CIG.
Effective 1 January 2018, loans up to US$ 1.0 million secured by real estate are subject to a write-off once overdue for more than 1,460 days. Unsecured loans and loans secured by collateral other than real estate are subject to a write-off once overdue for more than 150 days. Corporate loans and loans above US$ 1.0 million, secured by real estate, may be written off following an assessment by the Bank’s Deputy CEO, Chief Risk Officer and the Credit Risk department.
The Group has completed its IFRS 9 implementation programme and adopted IFRS 9. Financial Instruments from 1 January 2018. There were no material changes in credit risk management practice at the Group as a consequence of IFRS 9 application. For further information see the Consolidated Financial Statements of this Annual Report.
Liquidity riskDefinition: Liquidity risk is the risk that the Bank will be unable to meet its payment obligations when they fall due under normal and stress circumstances.
Monitoring: Liquidity risk is managed through the ALCO-approved liquidity framework. Treasury manages liquidity on a daily basis. In order to manage liquidity risk, it performs daily monitoring of future expected cash flows on customers’ and banking operations, which is a part of the assets/liabilities management process. The Finance
department prepares and submits monthly reports to the ALCO. The ALCO monitors the proportion of maturing funds available to meet deposit withdrawals and the amounts of interbank and other borrowing facilities that should be in place to cover withdrawals at unexpected levels of demand.
The liquidity risk management framework models the ability of the Bank to meet its payment obligations under both normal conditions and extreme circumstances. The Bank has developed a model based on the Basel III liquidity guidelines. This approach is designed to ensure that the funding framework is sufficiently flexible to secure liquidity under a wide range of market conditions. The liquidity management framework is reviewed from time to time to ensure it is appropriate to the Bank’s current and planned activities. Such review encompasses the funding scenarios, wholesale funding capacity, limit determination and minimum holdings of liquid assets. The liquidity framework is reviewed by the ALCO prior to approval by the Bank’s Management Board.
The Treasury and Funding departments also undertake an annual funding review that outlines the current funding strategy for the coming year. This review encompasses trends in global debt markets, funding alternatives, peer analysis, estimation of the Bank’s upcoming funding requirements, estimated market funding capacity and a funding risk analysis. The annual funding plan is reviewed by the Bank’s Management Board and approved by the Bank’s Supervisory Board as part of the annual budget. The Funding and Treasury departments also review, from time to time, different funding options and assess the refinancing risks of such options.
Mitigation: The Bank’s capability to discharge its liabilities is dependent on its ability to realise an equivalent amount of assets within the same period of time. The Bank maintains a portfolio of highly marketable and diverse assets that it believes can be easily liquidated in the event of an unforeseen interruption of cash flow. It also has committed lines of credit that it can access to meet its liquidity needs. Such lines of credit are available through the NBG’s refinancing facility. In addition, the Bank maintains a cash deposit (obligatory reserve) with the NBG, the amount of which depends on the level of customer funds attracted. As of 31 December 2018, in line with the NBG’s requirements, 25% of customer deposits in foreign currencies were set aside as minimum reserves. In addition, the Bank maintains a minimum average balance of 5% of its customers’ deposits in Georgian Lari on its correspondent account at the NBG. For wholesale funding and Certificates of Deposits, the NBG requires the Bank to set aside 25% of its unsubordinated foreign currency wholesale funding for borrowings with a remaining maturity of less than one year (which will be gradually increased to 30% by the end of May 2019, as announced by the NBG on 13 March 2019), 10% for borrowings with a remaining maturity of one to two years (which will be gradually increased to 15% by the end of May 2019, as announced by the NBG on 13 March 2019) and 5%
Risk management continued
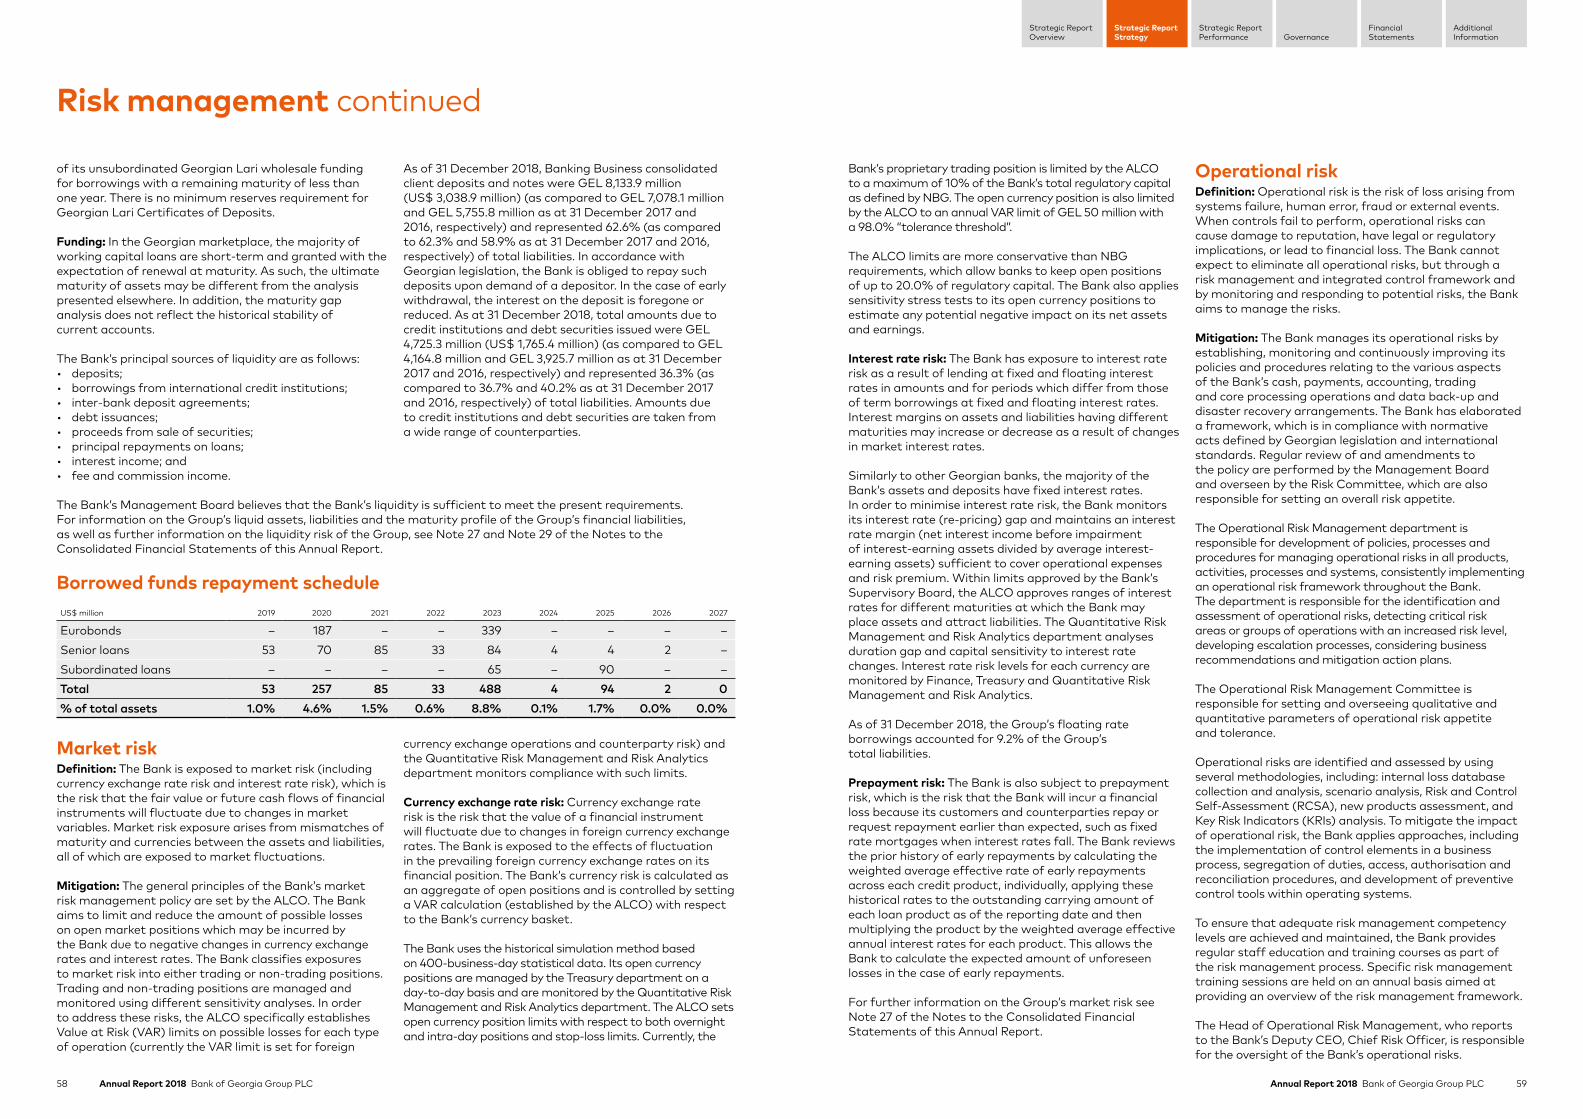
58 Annual Report 2018 Bank of Georgia Group PLC 59Annual Report 2018 Bank of Georgia Group PLC
Strategic ReportStrategy
Strategic ReportPerformance Governance
FinancialStatements
AdditionalInformation
Strategic ReportOverview
of its unsubordinated Georgian Lari wholesale funding for borrowings with a remaining maturity of less than one year. There is no minimum reserves requirement for Georgian Lari Certificates of Deposits.
Funding: In the Georgian marketplace, the majority of working capital loans are short-term and granted with the expectation of renewal at maturity. As such, the ultimate maturity of assets may be different from the analysis presented elsewhere. In addition, the maturity gap analysis does not reflect the historical stability of current accounts.
The Bank’s principal sources of liquidity are as follows:• deposits;• borrowings from international credit institutions;• inter-bank deposit agreements;• debt issuances;• proceeds from sale of securities;• principal repayments on loans;• interest income; and• fee and commission income.
As of 31 December 2018, Banking Business consolidated client deposits and notes were GEL 8,133.9 million (US$ 3,038.9 million) (as compared to GEL 7,078.1 million and GEL 5,755.8 million as at 31 December 2017 and 2016, respectively) and represented 62.6% (as compared to 62.3% and 58.9% as at 31 December 2017 and 2016, respectively) of total liabilities. In accordance with Georgian legislation, the Bank is obliged to repay such deposits upon demand of a depositor. In the case of early withdrawal, the interest on the deposit is foregone or reduced. As at 31 December 2018, total amounts due to credit institutions and debt securities issued were GEL 4,725.3 million (US$ 1,765.4 million) (as compared to GEL 4,164.8 million and GEL 3,925.7 million as at 31 December 2017 and 2016, respectively) and represented 36.3% (as compared to 36.7% and 40.2% as at 31 December 2017 and 2016, respectively) of total liabilities. Amounts due to credit institutions and debt securities are taken from a wide range of counterparties.
The Bank’s Management Board believes that the Bank’s liquidity is sufficient to meet the present requirements. For information on the Group’s liquid assets, liabilities and the maturity profile of the Group’s financial liabilities, as well as further information on the liquidity risk of the Group, see Note 27 and Note 29 of the Notes to the Consolidated Financial Statements of this Annual Report.
Borrowed funds repayment scheduleUS$ million 2019 2020 2021 2022 2023 2024 2025 2026 2027
Eurobonds – 187 – – 339 – – – –Senior loans 53 70 85 33 84 4 4 2 –Subordinated loans – – – – 65 – 90 – –Total 53 257 85 33 488 4 94 2 0% of total assets 1.0% 4.6% 1.5% 0.6% 8.8% 0.1% 1.7% 0.0% 0.0%
Market riskDefinition: The Bank is exposed to market risk (including currency exchange rate risk and interest rate risk), which is the risk that the fair value or future cash flows of financial instruments will fluctuate due to changes in market variables. Market risk exposure arises from mismatches of maturity and currencies between the assets and liabilities, all of which are exposed to market fluctuations.
Mitigation: The general principles of the Bank’s market risk management policy are set by the ALCO. The Bank aims to limit and reduce the amount of possible losses on open market positions which may be incurred by the Bank due to negative changes in currency exchange rates and interest rates. The Bank classifies exposures to market risk into either trading or non-trading positions. Trading and non-trading positions are managed and monitored using different sensitivity analyses. In order to address these risks, the ALCO specifically establishes Value at Risk (VAR) limits on possible losses for each type of operation (currently the VAR limit is set for foreign
currency exchange operations and counterparty risk) and the Quantitative Risk Management and Risk Analytics department monitors compliance with such limits.
Currency exchange rate risk: Currency exchange rate risk is the risk that the value of a financial instrument will fluctuate due to changes in foreign currency exchange rates. The Bank is exposed to the effects of fluctuation in the prevailing foreign currency exchange rates on its financial position. The Bank’s currency risk is calculated as an aggregate of open positions and is controlled by setting a VAR calculation (established by the ALCO) with respect to the Bank’s currency basket.
The Bank uses the historical simulation method based on 400-business-day statistical data. Its open currency positions are managed by the Treasury department on a day-to-day basis and are monitored by the Quantitative Risk Management and Risk Analytics department. The ALCO sets open currency position limits with respect to both overnight and intra-day positions and stop-loss limits. Currently, the
Bank’s proprietary trading position is limited by the ALCO to a maximum of 10% of the Bank’s total regulatory capital as defined by NBG. The open currency position is also limited by the ALCO to an annual VAR limit of GEL 50 million with a 98.0% “tolerance threshold”.
The ALCO limits are more conservative than NBG requirements, which allow banks to keep open positions of up to 20.0% of regulatory capital. The Bank also applies sensitivity stress tests to its open currency positions to estimate any potential negative impact on its net assets and earnings.
Interest rate risk: The Bank has exposure to interest rate risk as a result of lending at fixed and floating interest rates in amounts and for periods which differ from those of term borrowings at fixed and floating interest rates. Interest margins on assets and liabilities having different maturities may increase or decrease as a result of changes in market interest rates.
Similarly to other Georgian banks, the majority of the Bank’s assets and deposits have fixed interest rates. In order to minimise interest rate risk, the Bank monitors its interest rate (re-pricing) gap and maintains an interest rate margin (net interest income before impairment of interest-earning assets divided by average interest-earning assets) sufficient to cover operational expenses and risk premium. Within limits approved by the Bank’s Supervisory Board, the ALCO approves ranges of interest rates for different maturities at which the Bank may place assets and attract liabilities. The Quantitative Risk Management and Risk Analytics department analyses duration gap and capital sensitivity to interest rate changes. Interest rate risk levels for each currency are monitored by Finance, Treasury and Quantitative Risk Management and Risk Analytics.
As of 31 December 2018, the Group’s floating rate borrowings accounted for 9.2% of the Group’s total liabilities.
Prepayment risk: The Bank is also subject to prepayment risk, which is the risk that the Bank will incur a financial loss because its customers and counterparties repay or request repayment earlier than expected, such as fixed rate mortgages when interest rates fall. The Bank reviews the prior history of early repayments by calculating the weighted average effective rate of early repayments across each credit product, individually, applying these historical rates to the outstanding carrying amount of each loan product as of the reporting date and then multiplying the product by the weighted average effective annual interest rates for each product. This allows the Bank to calculate the expected amount of unforeseen losses in the case of early repayments.
For further information on the Group’s market risk see Note 27 of the Notes to the Consolidated Financial Statements of this Annual Report.
Operational riskDefinition: Operational risk is the risk of loss arising from systems failure, human error, fraud or external events. When controls fail to perform, operational risks can cause damage to reputation, have legal or regulatory implications, or lead to financial loss. The Bank cannot expect to eliminate all operational risks, but through a risk management and integrated control framework and by monitoring and responding to potential risks, the Bank aims to manage the risks.
Mitigation: The Bank manages its operational risks by establishing, monitoring and continuously improving its policies and procedures relating to the various aspects of the Bank’s cash, payments, accounting, trading and core processing operations and data back-up and disaster recovery arrangements. The Bank has elaborated a framework, which is in compliance with normative acts defined by Georgian legislation and international standards. Regular review of and amendments to the policy are performed by the Management Board and overseen by the Risk Committee, which are also responsible for setting an overall risk appetite.
The Operational Risk Management department is responsible for development of policies, processes and procedures for managing operational risks in all products, activities, processes and systems, consistently implementing an operational risk framework throughout the Bank. The department is responsible for the identification and assessment of operational risks, detecting critical risk areas or groups of operations with an increased risk level, developing escalation processes, considering business recommendations and mitigation action plans.
The Operational Risk Management Committee is responsible for setting and overseeing qualitative and quantitative parameters of operational risk appetite and tolerance.
Operational risks are identified and assessed by using several methodologies, including: internal loss database collection and analysis, scenario analysis, Risk and Control Self-Assessment (RCSA), new products assessment, and Key Risk Indicators (KRIs) analysis. To mitigate the impact of operational risk, the Bank applies approaches, including the implementation of control elements in a business process, segregation of duties, access, authorisation and reconciliation procedures, and development of preventive control tools within operating systems.
To ensure that adequate risk management competency levels are achieved and maintained, the Bank provides regular staff education and training courses as part of the risk management process. Specific risk management training sessions are held on an annual basis aimed at providing an overview of the risk management framework.
The Head of Operational Risk Management, who reports to the Bank’s Deputy CEO, Chief Risk Officer, is responsible for the oversight of the Bank’s operational risks.
Risk management continued
61Annual Report 2018 Bank of Georgia Group PLC
Strategic ReportStrategy
Strategic ReportPerformance Governance
FinancialStatements
AdditionalInformation
Strategic ReportOverview
Annual Report 2018 Bank of Georgia Group PLC60
Identifying, prioritising and managing our risks to support our goals and strategic objectivesWe outline the principal risks and uncertainties that are most likely to have an impact on our strategic objectives, business model, operations, future performance, solvency and liquidity. These principal risks are described in the table that follows, together with the relevant strategic business objectives, key drivers/trends, material controls which have been put in place to mitigate the risks and the mitigation actions we have taken. It is recognised that the Group is exposed to risks wider than those listed. We disclose those which we believe are likely to have had the greatest impact on our business and which have been discussed in depth at the Group’s recent Board, Audit or Risk Committee meetings.
The order in which the principal risks and uncertainties appear does not denote their order of priority. It is not possible to fully mitigate all of our risks. Any system of risk management and internal control is designed to manage rather than eliminate the risk of failure to achieve business objectives and can only provide reasonable and not absolute assurance against material misstatement or loss.
Currency and macroeconomic environmentPRINCIPAL RISK/UNCERTAINTY
Macroeconomic factors relating to Georgia, including depreciation of the Lari against the US Dollar, may have a material impact on our loan book.
KEY DRIVERS/TRENDS
The Group’s operations are primarily located in, and most of its revenue is sourced from, Georgia. Macroeconomic factors relating to Georgia, such as changes in GDP, inflation and interest rates, may have a material impact on the quality of our loan portfolio, loan losses, our margins, and customer demand for our products and services. The Georgian economy delivered a solid 4.8% estimated real GDP growth in 2018, compared to real GDP growth of 4.8% in 2017 and 2.8% in 2016, according to Geostat. Uncertain and volatile global economic conditions could have substantial political and macroeconomic ramifications globally which in turn could impact the Georgian economy.
In 2018, the Lari depreciated against the US Dollar by 3.3%, after appreciating by 2.1% in 2017. The volatility of Lari against Dollar has affected, and may continue to adversely affect, the quality of our loan portfolio, as well as increase the cost of credit risk and expected credit loss/impairment provisions. This is because our corporate, MSME and mortgage loan books are largely US Dollar-denominated and the majority of our customers’ income is Lari-denominated. The creditworthiness of our customers may be adversely affected by the depreciation of Lari against US Dollar, which could result in them having difficulty repaying their loans. The depreciation of Lari may also adversely affect the value of our customers’ collateral.
As at 31 December 2018, approximately 82.3% and 50.3% of our Corporate Investment Banking and Retail Banking loans, respectively, were denominated in foreign currency (predominantly US Dollar), while US Dollar income revenue loans covered 6.2% of Retail Banking gross loans and 38.3% of Corporate Investment Banking gross loans. Our cost of credit risk was 1.6% in 2018 compared to 2.2% in 2017.
Principal Risks and Uncertainties
62 Annual Report 2018 Bank of Georgia Group PLC 63Annual Report 2018 Bank of Georgia Group PLC
Strategic ReportStrategy
Strategic ReportPerformance Governance
FinancialStatements
AdditionalInformation
Strategic ReportOverview
Currency and macroeconomic environment (continued)MITIGATION The Group continuously monitors market conditions and reviews market changes, and also
performs stress and scenario testing to test its position under adverse economic conditions, including adverse currency movements.
The Bank’s Asset and Liability Management Committee sets our open currency position limits and the Bank’s proprietary trading position limits, which are currently more conservative than those imposed by the National Bank of Georgia (NBG), our regulator. The Treasury department manages our open currency position on a day-to-day basis. The open currency position is also monitored by the Bank’s Quantitative Risk Management and Risk Analytics department.
In order to assess the creditworthiness of our customers, we take into account currency volatility when there is a currency mismatch between the customer’s loan and the revenue. We allocate 75% additional capital to the foreign currency loans of clients, whose source of income is denominated in Lari.
The Bank’s Credit Committees and Credit Risk department set counterparty limits by using a credit risk classification and scoring system for approving individual transactions. The credit quality review process is continuous and provides early identification of possible changes in the creditworthiness of customers, including regular collateral revaluations, potential losses and corrective actions needed to reduce risk, which may include obtaining additional collateral in accordance with underlying loan agreements.
Since the beginning of 2016, we have focused on increasing local currency lending. We actively work with IFIs to raise long-term Lari funding to increase our Lari-denominated loans to customers. Furthermore, in June 2017, we completed the inaugural local currency- denominated international bond issuance in the amount of GEL 500 million to support local currency lending.
Applicable from the beginning of 2017, the NBG expanded the list of assets that banks are permitted to use as collateral for REPO transactions, which provides an additional funding source for our Lari-denominated loan book.
As a result, as of 31 December 2018, our Lari-denominated loan book increased by 21.2% y-o-y, while our foreign currency-denominated loan book increased by 17.7% in constant currency terms.
Principal risks and uncertainties continued
Regional instabilityPRINCIPAL RISK/UNCERTAINTY
The Georgian economy and our business may be adversely affected by regional tensions and instability.
The Group’s operations are primarily located in, and most of its revenue is sourced from, Georgia. The Georgian economy is dependent on economies of the region, in particular Russia, Turkey, Azerbaijan and Armenia who are key trading partners.
There has been ongoing geopolitical tension, political and economic instability and military conflict in the region, which may have an adverse effect on our business and financial position.
KEY DRIVERS/TRENDS
Russian troops continue to occupy the Abkhazia and the Tskhinvali/South Ossetia regions and tensions between Russia and Georgia persist. Russia is potentially opposed to the eastward enlargement of NATO, including former Soviet republics such as Georgia. The introduction of a free trade regime between Georgia and the EU in September 2014 and the visa-free travel in the EU granted to Georgian citizens in March 2017 may intensify tensions between the countries. The Government has taken certain steps towards improving relations with Russia, but, as of the date of this Annual Report these have not resulted in any formal or legal changes in the relationship between the two countries.
In June 2018, as a result of early parliamentary and presidential elections, amendments to the Turkish constitution became effective. The amendments which grant the president wider powers are expected to transform Turkey’s system of government away from a parliamentary system which could have a negative impact on political stability in Turkey.
There is an ongoing conflict between Azerbaijan and Armenia which impacts the region.
MITIGATION The Group actively monitors regional and local market conditions and risks related to political instability, and performs stress and scenario tests in order to assess our financial position. Responsive strategies and action plans are also developed.
Despite tensions in the breakaway territories Russia has continued to open its export market to Georgian exports since 2013. While lower global commodity prices and macroeconomic factors have affected Georgia’s regional trading partners, leading to lower exports within the region, Georgia has benefited from increased exports earnings from non-traditional markets such as Switzerland, China, Egypt, Saudi Arabia, South Korea and Singapore.
In April 2017, the IMF approved a new three-year US$ 285 million economic programme, aimed at preserving macroeconomic and financial stability and addressing structural weaknesses in the Georgian economy to support higher and inclusive growth. Implementation of the IMF programme is on track, with the authorities achieving all structural benchmarks set for specific periods. On 20-26 February 2019, the IMF staff visited Georgia to discuss the recent economic and financial developments and progress with structural reforms. In their end-of-mission statement, the IMF thanked the authorities for the open and constructive discussions and stated that they are looking forward to continuing the dialogue during the visit for the fourth review of Georgia’s IMF-supported programme in April and May 2019.
During 2018, Georgia delivered estimated real GDP growth of 4.8%, whilst inflation was well contained at 1.5% in December 2018, comfortably below the NBG’s target of 3.0% for the year. Tourist arrivals and remittances, a significant driver of Dollar inflows for the country, continued to increase. The country recorded its first ever current account surplus in the third quarter of 2018, an extremely positive macroeconomic development for Georgia.
64 Annual Report 2018 Bank of Georgia Group PLC 65Annual Report 2018 Bank of Georgia Group PLC
Strategic ReportStrategy
Strategic ReportPerformance Governance
FinancialStatements
AdditionalInformation
Strategic ReportOverview
Loan portfolio qualityPRINCIPAL RISK/ UNCERTAINTY
The Group may not be able to maintain the quality of its loan portfolio.
The quality of the Group’s loan portfolio may deteriorate due to external factors beyond the Group’s control such as negative developments in Georgia’s economy or in the economies of its neighbouring countries, the unavailability or limited availability of credit information on certain of its customers, any failure of its risk management procedures or rapid expansion of its loan portfolio (see other currency risk above).
The Group’s Corporate Investment Banking loan portfolio is concentrated and to the extent that such borrowers enter into further loan arrangements with the Group, this will increase the credit and general counterparty risk of the Group with respect to those counterparties and could result in deterioration of the Group’s loan portfolio quality.
Furthermore, the collateral values that the Group holds against the loans may decline, which may have an adverse effect on the business and financial position of the Group.
KEY DRIVERS/ TRENDS
During 2018, the Group’s cost of credit risk ratio was 1.6%, as compared to 2.2% in 2017. Expected credit loss/impairment charges and, in turn, the Group’s cost of risk could increase if a single large borrower defaults or a material concentration of smaller borrowers default. As of 31 December 2018, 2017 and 2016, the Group’s non-performing loans accounted for 3.3%, 3.8%, and 4.2% of gross loans, respectively.
The Corporate Investment Banking loan portfolio is concentrated, with the Group’s top ten Corporate Investment Banking borrowers accounting for 9.8% of the loan portfolio (gross of allowances for impairment) as of 31 December 2018, as compared to 10.7% at 31 December 2017 and 11.8% at 31 December 2016. The top ten Corporate Investment Banking borrowers accounted for 34.5% of the Corporate Investment Banking gross loan portfolio as of 31 December 2018, as compared to 35.5% at 31 December 2017 and 32.1% at 31 December 2016.
As of 31 December 2018, the Group held collateral against gross loans covering 85.7% of the total gross loans. The main forms of collateral taken in respect of Corporate Investment Banking loans are liens over real estate, property plant and equipment, corporate guarantees, inventory, deposits and securities, transportation equipment and gold. The most common form of collateral accepted in Retail Banking loans is a lien over residential property.
Downturns in the residential and commercial real estate markets or a general deterioration of economic conditions in the industries in which the Group’s customers operate may result in illiquidity and a decline in the value of the collateral securing loans, including a decline to levels below the outstanding principal balance of those loans. In addition, declining or unstable prices of collateral in Georgia may make it difficult for the Group to accurately value collateral it holds. If the fair value of the collateral that the Group holds declines significantly in the future, it could be required to record additional provisions and could experience lower than expected recovery levels on collateralised loans past due more than 90 days. Further changes to laws or regulations may impair the value of such collateral.
Principal risks and uncertainties continued
Loan portfolio qualityMITIGATION The Group continuously monitors market conditions and reviews market changes, and also
performs stress and scenario testing to test its position under adverse economic conditions.
Our Credit Committees and Credit Risk department set counterparty limits by using a credit risk classification and scoring system for approving individual transactions. The credit quality review process is continuous and provides early identification of possible changes in the creditworthiness of customers, including regular collateral revaluations, potential losses and corrective actions needed to reduce risk, which may include obtaining additional collateral in accordance with underlying loan agreements.
The Group continuously monitors the market value of the collateral it holds against the loans. When evaluating collateral, the Group discounts the market value of the assets to reflect the liquidation value of the collateral.
In terms of Corporate Investment Banking loan portfolio concentration, the Group aims to adhere strictly to the limits set by the NBG for client exposures, monitors the level of concentration in its loan portfolio and the financial performance of its largest borrowers and uses collateral to minimise loss given default on its largest exposures, reduces guarantee exposures in the riskier sector and maintains a well diversified loan book sector concentration.
Regulatory riskPRINCIPAL RISK/ UNCERTAINTY
Bank of Georgia operates in an evolving regulatory environment and is subject to regulatory oversight of the National Bank of Georgia, supervising the banking sector and the securities market in Georgia.
The financial sector in Georgia is highly regulated. The regulatory environment continues to evolve. We, however, cannot predict what additional regulatory changes will be introduced in the future or the impact they may have on our operations.
KEY DRIVERS/ TRENDS
Our banking operations must comply with capital adequacy and other regulatory ratios set by our regulator, the NBG, including reserve requirements and mandatory financial ratios. Our ability to comply with existing or amended NBG requirements may be affected by a number of factors, including those outside of our control, such as an increase in the Bank’s risk-weighted assets, our ability to raise capital, losses resulting from deterioration in our asset quality and/or a reduction in income levels and/or an increase in expenses, decline in the value of the Bank’s securities portfolio, as well as a weakening of global and Georgian economies.
MITIGATION Continued investment in our people and processes is enabling us to meet our current regulatory requirements and means that we are well placed to respond to any future changes in regulation.
In line with our integrated control framework, we carefully evaluate the impact of legislative and regulatory changes as part of our formal risk identification and assessment processes and, to the extent possible, proactively participate in the drafting of relevant legislation. As part of this process, we engage in constructive dialogue with regulatory bodies, where possible, and seek external advice on potential changes to legislation. We then develop appropriate policies, procedures and controls, as required, to fulfil our compliance obligations.
Our compliance framework, at all levels, is subject to regular review by Internal Audit and external assurance services providers.

66 Annual Report 2018 Bank of Georgia Group PLC 67Annual Report 2018 Bank of Georgia Group PLC
Strategic ReportStrategy
Strategic ReportPerformance Governance
FinancialStatements
AdditionalInformation
Strategic ReportOverview
Liquidity riskPRINCIPAL RISK/ UNCERTAINTY
The Group is exposed to liquidity risk when the maturities of its assets and liabilities do not coincide.
Although the Group expects to have sufficient funding over the next 18 months and beyond to execute its strategy and to have sufficient liquidity over the next 18 months and beyond, liquidity risk is nevertheless inherent in banking operations and may be heightened by a number of factors, including an over-reliance on, or an inability to access, a particular source of funding, changes in credit ratings or market-wide phenomena, such as financial market instability.
Credit markets worldwide have in recent years experienced, and may continue to experience, a reduction in liquidity and long-term funding as a result of global economic and financial factors. The availability of credit in emerging markets, in particular, is significantly influenced by the level of investor confidence and, as such, any factors that affect investor confidence (for example, a downgrade in credit ratings of the Bank, Georgia, or state interventions or debt restructurings in a relevant industry) could affect the price or availability of funding for the Group companies, operating in any of these markets.
KEY DRIVERS/ TRENDS
The Group’s current liquidity may be affected by unfavourable financial market conditions. If assets held by the Group in order to provide liquidity become illiquid or their value drops substantially, the Group may be required, or may choose, to rely on other sources of funding to finance its operations and future growth. Only a limited amount of funding, however, is available on the Georgian inter-bank market, and recourse to other funding sources may pose additional risks, including the possibility that other funding sources may be more expensive and less flexible. In addition, the Group’s ability to access such external funding sources depends on the level of credit lines available to it, and this, in turn, is dependent on the Group’s financial and credit condition, as well as general market liquidity.
In terms of current and short-term liquidity, the Group is exposed to the risk of unexpected, rapid withdrawal of deposits by its customers in large volumes. Circumstances in which customers are more likely to withdraw deposits in large volumes rapidly include, among others, a severe economic downturn, a loss in consumer confidence, an erosion of trust in financial institutions or a period of social, economic or political instability. If a substantial portion of customers rapidly or unexpectedly withdraw their demand or term deposits or do not roll over their term deposits upon maturity, this could have a material adverse effect on the Group’s business, financial condition and results of operations.
MITIGATION The Group manages its liquidity risk through the liquidity risk management framework, which models the ability of the Group to meet its payment obligations under both normal conditions and crisis. The Group has developed a model based on the Basel III liquidity guidelines. This approach is designed to ensure that the funding framework is sufficiently flexible to secure liquidity under a wide range of market conditions.
Among other things, the Group maintains a diverse funding base comprising of short-term sources of funding (including Retail Banking and Corporate Investment Banking customer deposits, inter-bank borrowings and borrowings from the NBG) and longer-term sources of funding (including term Retail Banking and Corporate Investment Banking deposits, borrowing from international credit institutions, sales and purchases of securities and long-term debt securities).
Client deposits and notes are one of the most important sources of funding for the Group. As of 31 December 2018, 2017 and 2016, 90.8%, 91.4%, and 91.5%, respectively, of client deposits and notes had contractual maturities of one year or less, of which 55.1%, 56.5%, and 53.9%, respectively, were payable on demand. However, as of the same dates, the ratio of net loans to client deposits and notes was 115.5%, 109.4%, and 116.1%, respectively, and the NBG liquidity coverage ratios were 120.9% and 112.4% as of 31 December 2018 and 2017, respectively.
Operational risk, cyber-security, information systems and financial crimePRINCIPAL RISK/ UNCERTAINTY
We are at risk of experiencing cyber-security breaches, unauthorised access to our systems and financial crime, or failures in our banking activity processes or systems or human error, which could disrupt our customer services, result in financial loss, have legal or regulatory implications and/or affect our reputation.
We are highly dependent on the proper functioning of our risk management, internal controls and systems, and internal processes including those related to data protection, IT and information security in order to manage these threats.
KEY DRIVERS/ TRENDS
Cyber-security threats have continued to increase y-o-y and during 2018, we saw a number of major international organisations subject to cyber-attacks, although fortunately, our operations were not materially affected. The external threat profile is continuously changing and we expect threats to continue to increase.
Over the past few years, as our operations have expanded, we have seen an increase in electronic crimes, including fraud, although losses have not been significant. Money laundering, which the Bank has measures in place to guard against, has also increased globally in recent years.
MITIGATION We have an integrated control framework encompassing operational risk management, IT systems, corporate and other data security, each of which is managed by a separate department. We also have an Anti-Money Laundering (AML) officer and controls in place.
We identify and assess operational risk categories within our risk management framework, identify critical risk areas or groups of operations with an increased risk level and develop policies and security procedures to mitigate these risks.
We have security controls in place including policies, procedures and security technologies. We also regularly carry out IT and information security checks internally and with the assistance of external consultants. We have sophisticated anti-virus protection and firewalls to help protect against potentially malicious software. We have increased our internal and external penetration testing and have back-up disaster recovery and business continuity plans in place across the Group. We improved access control and password protections through the implementation of “Privileged Access Monitoring” for employees with the highest privileged access to confidential and customer data. We continue to invest in technology to enhance our ability to prevent, detect and respond to increasing and evolving threats.
Our Internal Audit function provides assurance on the adequacy and effectiveness of our risk management, internal controls and systems in place. These types of operational risk are on the Audit Committee’s regular agenda and are also frequently discussed at Board level.
Principal risks and uncertainties continued

Going Concern and Viability Statements
69Annual Report 2018 Bank of Georgia Group PLC
Strategic ReportStrategy
Strategic ReportPerformance Governance
FinancialStatements
AdditionalInformation
Strategic ReportOverview
Annual Report 2018 Bank of Georgia Group PLC68
Going concern statementThe Group’s business activities, objectives and strategy, principal risks and uncertainties in achieving its objectives and performance are set out on pages 22 to 101. After making inquiries, the Directors confirm that they have a reasonable expectation that Bank of Georgia Group and the Group, as a whole, have adequate resources to continue in operational existence for the 12 months from the date the financial statements are authorised for issue. Therefore, the Directors consider it appropriate to adopt the going concern basis of accounting in preparing the accompanying consolidated financial statements.
Viability statementIn accordance with the Corporate Governance Code, the Directors are required to assess the prospects of the Group to meet its liabilities by taking into account its current position and principal risks. The Board performed this review over a three-year period beginning 1 January 2019, being the first day after the end of the financial year to which this report relates. In determining the appropriate period over which to make their assessment, the Directors considered the duration of strategic plans and financial forecasts, which are usually set and prepared for a three-year period, the nature of the Group’s activities, as well as the evolving nature of the regulatory and macroeconomic environment in which the Group operates. A period of three years beyond the balance sheet date was therefore considered the most appropriate viability period for the Group.
In order to consider the Group’s viability, the Board considered a number of key factors, including:
• the Group’s financial and operational position, including capital allocation and other key financial ratios;
• the Board’s risk appetite; • the Group’s business model and strategy as set out
on pages 22 to 43; • the Group’s principal risks and uncertainties as set out
on pages 60 to 67; • the effectiveness of our risk management framework
and internal control processes; and • stress testing, as described below.
The key factors above have been reviewed in the context of our current position and strategic plan, financial budgets and forecasts assessed annually and on a three-year basis.
The viability assessment involved a risk identification process which included recognition of the principal risks to viability (risks that could impair the Group’s business model, future performance, solvency or liquidity), excluding risks not sufficiently severe over the period of assessment. The principal risks and uncertainties are set out on pages 60 to 67 in this annual report. We also identified other risks which, while not necessarily severe in themselves, could escalate when combined with others. For each risk, we considered our risk appetite and tolerance, as well as risk proximity and momentum.
For those risks considered sufficiently severe to affect our viability, we performed stress testing for the assessment period, which involved modelling the impact of a combination of severe and plausible adverse scenarios. The Group has examined amont other, the following stress scenarios over the assessment period: Georgian Lari depreciation against US Dollar, competition or market driven reduction in net interest margin, increase in operating expenses resulting in higher cost-to-income ratio, impairment of loan portfolio quality. Each of these scenarios are referred to in our principal risks and uncertainties. The stress test scenarios were then reviewed against the Group’s current and projected liquidity position, considering current committed funding, capital adequacy and solvency. The stress testing also took into account the availability and likely effectiveness of mitigating actions that could be taken to avoid or reduce the impact or occurrence of the identified underlying risks to which the Group is exposed, such as a decline in lending activity and reduction of operating expenses. It also took into account the assumption that the Group will be able to prolong or refinance existing borrowings, or increase the financing from DFIs, on terms similar to existing ones.
The Directors have also satisfied themselves that they have the evidence necessary to support the statement in terms of the effectiveness of the Group’s risk management framework and internal control processes in place to mitigate risk.
Based on the analysis described above, the Directors confirm that they have a reasonable expectation that the Group will be able to continue operation and meet its liabilities as they fall due over the three-year period from 1 January 2019 to 31 December 2021.

71Annual Report 2018 Bank of Georgia Group PLC
Strategic ReportStrategy
Strategic ReportPerformance Governance
FinancialStatements
AdditionalInformation
Strategic ReportOverview
Annual Report 2018 Bank of Georgia Group PLC70
The concept of sustainability lies at the heart of our business and reflects our contribution to sustainable developmentAs a Group, we recognise that we owe a duty not only to our shareholders but to the wider society in which we operate. As a large employer in Georgia, it is incumbent upon us to play a leading role in minimising our impact upon the environment, to be an employer of choice and to drive positive change in society. We consider sustainability to be integral to the growth of our business. Our sustainability agenda allows us to be profitable as well as environmentally and socially responsible. By implementing a sustainability approach in our activities, we foster long-term relationships with our main stakeholders, providing high return on investment for shareholders, satisfying the financial needs of customers, developing employees and contributing to the economic and social welfare of the local communities, while taking into account our environmental footprint. In 2018, the Board of Directors adopted an Environmental and Social Policy for the Group (BGEO Group, the predecessor of the Group, had the policy in place since 2012) in order to effectively manage the Group’s direct and indirect impact on society and the environment. This policy describes the Group’s strategy to develop solid management controls to conserve natural resources, minimise health and safety risks, and provide employees with equal development opportunities, fair compensation and benefits. We are pioneering sustainability practices in our operations and are constantly seeking new ways to improve our performance.
The Group continues to be included in the global responsible investment index FTSE4Good. The index is designed to demonstrate strong Environmental, Social and Governance (ESG) practices measured against international standards.
This report sets out the policies we have in place to meet these responsibilities and the ways in which these policies have been implemented, and our achievements against these over the course of 2018.
This section of the strategic report constitutes the Group’s Non-Financial Information Statement, in accordance with sections 414CA and 414CB of the Companies Act. The information to be disclosed under section 414CB has been included in the section below, with the exception of a description of the Group’s business model, and principal risks and uncertainties which can be found on pages 22 and 60, respectively.
Environmental mattersThe Group recognises that its operations have both an indirect and direct impact on the environment, and therefore seeks to establish management approaches which will help it become a more environmentally-friendly institution. As a leading financial institution in Georgia, the Bank, through the projects it finances, produces significant indirect impacts on the environment. As for the direct environmental impact, we believe that the impact of the Banking Business is not significant.
Indirect environmental impact through business operationsThe Group considers the interests of its main stakeholders (customers, shareholders, employees, lenders and wider society) when developing the strategy and the processes to improve its operations. We continually strive to positively contribute to society through the entire scope of our business activities by developing socially-oriented products and services, implementing responsible approaches to our business operations, carrying out sponsorship and charitable activities.
In order to efficiently manage its indirect environmental and social impact, the Bank has prioritised the integration of sustainable finance principles into its credit risk management procedures since 2012. The Bank ensures it has a consistent approach to evaluating and managing the environmental, human health and safety risks of its financed projects. In all that the Bank does, it strives to find sustainable solutions that make business sense to clients and minimise negative impacts on the social and natural environments.
Environmental and Social Risk Management (ESRM) procedures were further updated in 2017. The purpose of the review was to ensure that the policy remains fit for purpose and reflects experience and changes in the relevant legislation. In 2017, the Bank updated the assessment procedures of low, medium and high risk projects and refined the monitoring procedures of the projects.
Resources and Responsibilities
72 Annual Report 2018 Bank of Georgia Group PLC 73Annual Report 2018 Bank of Georgia Group PLC
Strategic ReportStrategy
Strategic ReportPerformance Governance
FinancialStatements
AdditionalInformation
Strategic ReportOverview
The main objective of the E&S Policy is to increase environmental and social benefits for our clients. Through ESRM procedures, the Bank enhances clients’ opportunities to be in compliance with national environmental and social regulations and adopt international best practices in this area. ESRM procedures are periodically updated and approved by the Board of Directors to ensure that the Policy remains fit for purpose and reflects experience and changes in the relevant legislation. ESRM procedures, along with other tools necessary for their implementation, comprise the core components of the Bank’s Environmental and Social Risk Management System (ESMS). Under this mechanism, the Bank endeavours to become an environmentally friendly financial institution.
Furthermore, to ensure a more effective operation and maintenance of the ESRM Policy, the Social and Environmental Risk Unit was created in September 2016. Until then, the Environmental and Social Risk Coordinator was responsible for the implementation of the Policy. In 2018, we appointed a Social and Environmental Risk Manager in the Social and Environmental Risk Unit, who will oversee the practical, day-to-day implementation of the Bank’s ESMS.
We implement the following procedures to ensure the operation and maintenance of the ESMS:• We refrain from financing environmentally or socially
sensitive business activities mentioned in the exclusion lists of Development Finance Institutions such as EBRD, IFC, DEG, FMO and ADB, among others.
• We aim to assess the relative level of environmental and social risk associated with clients’ businesses. We require certain customers to implement specific environmental or social action plans to avoid or mitigate their environmental and social impact and adhere to specific monitoring and reporting requirements that we set in order to minimise environmental and social risk. These requirements are included as covenants in agreements between certain of our customers and the Bank.
• We aim to regularly monitor environmental and social risks associated with the Bank’s activities, and assess clients’ compliance with the terms of respective agreements.
Through ensuring comprehensive environmental and social assessment and action plans, as a part of stable due diligence, the Bank encourages its customers to fulfil their environmental and social obligations and establishes a framework for them to achieve good environmental and social standards. In many cases, the Bank’s proper and timely management of customers’ environmental and social risks has helped them to avoid financial and legal sanctions during inspections conducted by state enforcement agencies.
Environmental and social issues are tracked at project sites in cooperation with the facility staff, providing ongoing advice and guidance on good practice and standards and monitoring compliance with the requirements. For environmental and social due diligence of certain high risk projects, the Bank contracts independent external experts. As part of monitoring, the Bank requires each high risk client to provide the Bank with an annual report on their environmental and social performance and the implementation of applicable Environmental and Social Action Plans. Alternatively, the Bank’s staff visits high risk clients on a regular basis.
Throughout 2018, the Bank held extensive Environmental and Social Due Diligence (ESDD), where the Bank monitored clients and developed action plans for non-compliant clients. Thanks to the Bank’s efforts, some clients conducted an environmental audit and obtained the necessary environmental impact permits to continue their business operations. Those clients started to identify, avoid, mitigate and manage environmental and social risks and their impact on the natural and social environment. In addition, as a result of ESDD some clients took out loans to enhance their companies’ power and ability to reduce negative impacts on the environment and positively benefit their communities. Others implemented environmental and social management systems in accordance with international standards.
Procedures for addressing external queries and concerns, developed within the framework of ESMS, provide a means for the public to submit queries or concerns related to the Bank’s E&S Policy, and have these inquiries responded to by the Bank in a timely manner. In the Association Agreement between the European Union and Georgia, Georgia has committed to progressively approximate its legislation in the relevant sectors with that of the EU and to implement it effectively. Through this approximation process, Georgia is actively developing and amending its national legislation in the relevant sectors. As a result, the Bank regularly checks legal developments and updates with regard to environmental, health and safety, and labour issues and places great emphasis on the improvement of ESDD opportunities. The Bank’s staff are very focused on introducing clients to information about relevant (existing and new) regulations and laws during ESDD with the aim of strengthening public knowledge and capacity in the area of environmental and social protection.
Resources and responsibilities continued
Training activities play an important role in enhancing the implementation of the Policy. In 2018, the Bank provided training opportunities for the Head of Social and Environmental Risk and the staff involved in environmental and social risk management processes. The Head of Unit participated in the 12th Annual Performance Standards Community of Learning organised by the IFC. The Community of Learning is a knowledge sharing forum aimed at strengthening the implementation of environmental and social standards by financial institutions in emerging markets. The event provided a chance to exchange experience, learn from investment case studies, and engage in dialogue among environmental and social risk management specialists from all over the globe. A Social and Environmental Risk Management Training was held to help risk managers appropriately categorise the projects according to their environmental risk characteristics. More generally, the Bank has delivered several training sessions in this area and consequently more than 100 employees were trained during the last five years. Leading experts and state inspectors were invited as trainers. We intend to continue the trainings in the future.
In 2018, the Bank launched an Enhancement of Environmental and Social System, supported by the Green for Growth Fund within the framework of the Green for Growth Fund Technical Assistance Facility (GGF TAF). The project focuses on strengthening the Bank’s environmental and social framework for it to become a best-practice environmental and social management system in the Georgian market. The project aims (i) to assess current environmental and social processes of the Bank versus relevant recommendations of international financial institutions and best international practice, in particular ISO 14001:2015 international standard, (ii) to address gaps identified during the assessment through revision and amendment of documentation and processes, providing consultancy, recommendations and implementation support for the necessary improvements, and (iii) to conduct a final assessment of upgraded environmental and social procedures and systems to confirm our compliance with requirements and best-practice as defined in the initial phase of the project. Staff trainings are one of the deliverables of the project. The project should be completed in 2019.
The Bank is committed to respecting the principles of sustainable development, protecting the environment, and is willing to improve the level of public health safety as an essential element for sustainable development and economic growth. The Bank will continue to conduct business with due consideration to environmental and social protection and contribute to the creation of a sustainable society. The Bank will further help its clients benefit from a proper and diligent implementation of the E&S Policy.
Direct environmental impactWe believe that the direct impact of the Banking Business on the environment is not significant. Nevertheless, we undertake a number of measures to reduce paper, electricity, and fuel consumption. “Green Boxes“ are placed on every floor of the Bank’s headquarters and are designated to collect paper for recycling purposes. Some of the Bank’s paper-intensive departments switched to the principle of two monitors, which considerably reduces paper waste. The lighting system in all of the Bank’s service centres was replaced with energy efficient LED lamps, which consume far less electricity than traditional economical ones. In 2018, the Bank outsourced 45% of its car fleet in order to reduce its fuel consumption.
Greenhouse gas emissions and calculating methodologyWe have reported on all of the emission sources required under the Companies Act 2006 (Strategic Report and Directors’ Report) Regulations 2013 (Scopes 1 and 2) and additionally have reported on those emissions under Scope 3 that are applicable to our business. All reported sources fall within our Consolidated Financial Statements, which can be found on pages 154 to 283. We do not have responsibility for any emission sources that are not included in our Consolidated Financial Statements.
In preparing our emissions data, we have used the World Resources Institute/World Business Council for Sustainable Development (WRI/WBCSD) Greenhouse Gas Protocol: A Corporate Accounting and Reporting Standard (revised edition) and emissions factors from the UK Government’s Greenhouse Gas Conversion Factors for Company Reporting 2016. For wastewater treatment and discharge operations we used conversion factors from 2006 IPCC Guidelines for National Greenhouse Gas Inventories.
Our reported data is collected and reported on in respect of the Bank, which includes all of its offices and retail branches, where the Bank has operational control. The data is provided by on-site delegates, invoices and metre readings.
We have adjusted the 2017 and 2016 comparative greenhouse gas emissions in the table below to present the data only in respect of the Bank. The full greenhouse gas emissions data for BGEO Group PLC for 2017 and 2016 can be found in BGEO Group PLC 2017 Annual Report on the Group’s website at www.bankofgeorgiagroup.com.
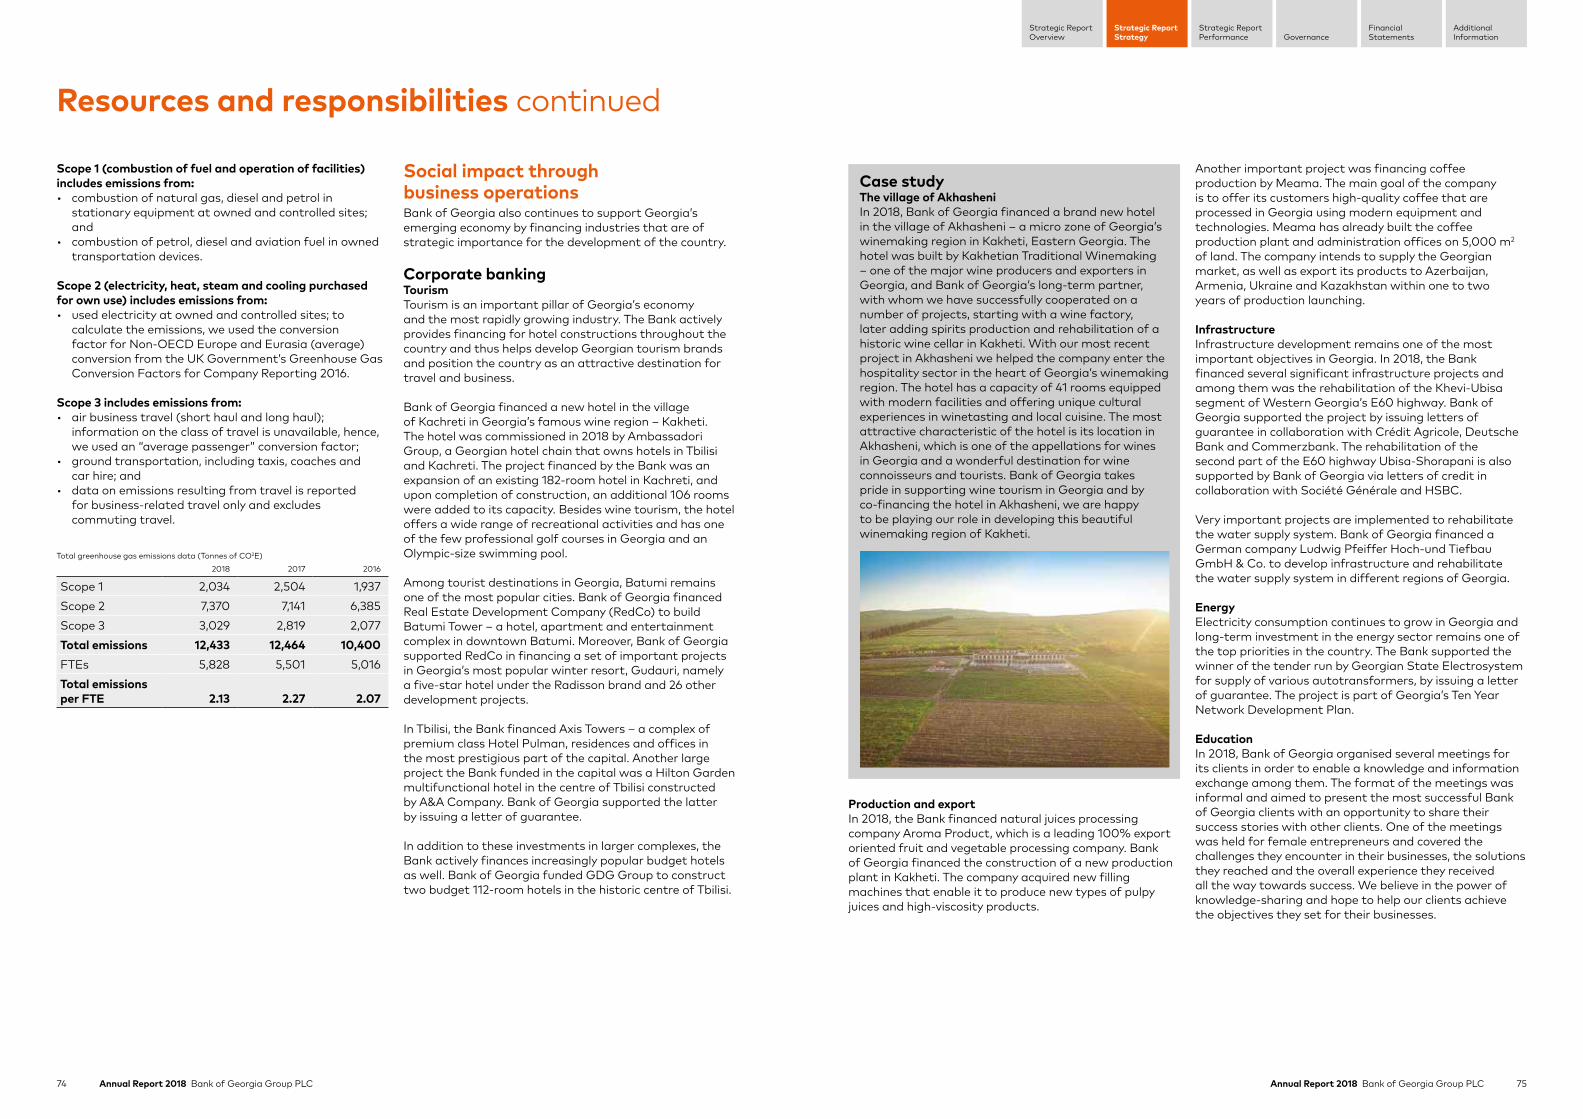
74 Annual Report 2018 Bank of Georgia Group PLC 75Annual Report 2018 Bank of Georgia Group PLC
Strategic ReportStrategy
Strategic ReportPerformance Governance
FinancialStatements
AdditionalInformation
Strategic ReportOverview
Resources and responsibilities continued
Scope 1 (combustion of fuel and operation of facilities) includes emissions from:• combustion of natural gas, diesel and petrol in
stationary equipment at owned and controlled sites; and
• combustion of petrol, diesel and aviation fuel in owned transportation devices.
Scope 2 (electricity, heat, steam and cooling purchased for own use) includes emissions from:• used electricity at owned and controlled sites; to
calculate the emissions, we used the conversion factor for Non-OECD Europe and Eurasia (average) conversion from the UK Government’s Greenhouse Gas Conversion Factors for Company Reporting 2016.
Scope 3 includes emissions from:• air business travel (short haul and long haul);
information on the class of travel is unavailable, hence, we used an “average passenger” conversion factor;
• ground transportation, including taxis, coaches and car hire; and
• data on emissions resulting from travel is reported for business-related travel only and excludes commuting travel.
Total greenhouse gas emissions data (Tonnes of CO2E)2018 2017 2016
Scope 1 2,034 2,504 1,937Scope 2 7,370 7,141 6,385Scope 3 3,029 2,819 2,077Total emissions 12,433 12,464 10,400FTEs 5,828 5,501 5,016Total emissions per FTE 2.13 2.27 2.07
Social impact through business operationsBank of Georgia also continues to support Georgia’s emerging economy by financing industries that are of strategic importance for the development of the country.
Corporate bankingTourismTourism is an important pillar of Georgia’s economy and the most rapidly growing industry. The Bank actively provides financing for hotel constructions throughout the country and thus helps develop Georgian tourism brands and position the country as an attractive destination for travel and business.
Bank of Georgia financed a new hotel in the village of Kachreti in Georgia’s famous wine region – Kakheti. The hotel was commissioned in 2018 by Ambassadori Group, a Georgian hotel chain that owns hotels in Tbilisi and Kachreti. The project financed by the Bank was an expansion of an existing 182-room hotel in Kachreti, and upon completion of construction, an additional 106 rooms were added to its capacity. Besides wine tourism, the hotel offers a wide range of recreational activities and has one of the few professional golf courses in Georgia and an Olympic-size swimming pool.
Among tourist destinations in Georgia, Batumi remains one of the most popular cities. Bank of Georgia financed Real Estate Development Company (RedCo) to build Batumi Tower – a hotel, apartment and entertainment complex in downtown Batumi. Moreover, Bank of Georgia supported RedCo in financing a set of important projects in Georgia’s most popular winter resort, Gudauri, namely a five-star hotel under the Radisson brand and 26 other development projects.
In Tbilisi, the Bank financed Axis Towers – a complex of premium class Hotel Pulman, residences and offices in the most prestigious part of the capital. Another large project the Bank funded in the capital was a Hilton Garden multifunctional hotel in the centre of Tbilisi constructed by A&A Company. Bank of Georgia supported the latter by issuing a letter of guarantee.
In addition to these investments in larger complexes, the Bank actively finances increasingly popular budget hotels as well. Bank of Georgia funded GDG Group to construct two budget 112-room hotels in the historic centre of Tbilisi.
Case studyThe village of Akhasheni In 2018, Bank of Georgia financed a brand new hotel in the village of Akhasheni – a micro zone of Georgia’s winemaking region in Kakheti, Eastern Georgia. The hotel was built by Kakhetian Traditional Winemaking – one of the major wine producers and exporters in Georgia, and Bank of Georgia’s long-term partner, with whom we have successfully cooperated on a number of projects, starting with a wine factory, later adding spirits production and rehabilitation of a historic wine cellar in Kakheti. With our most recent project in Akhasheni we helped the company enter the hospitality sector in the heart of Georgia’s winemaking region. The hotel has a capacity of 41 rooms equipped with modern facilities and offering unique cultural experiences in winetasting and local cuisine. The most attractive characteristic of the hotel is its location in Akhasheni, which is one of the appellations for wines in Georgia and a wonderful destination for wine connoisseurs and tourists. Bank of Georgia takes pride in supporting wine tourism in Georgia and by co-financing the hotel in Akhasheni, we are happy to be playing our role in developing this beautiful winemaking region of Kakheti.
Production and exportIn 2018, the Bank financed natural juices processing company Aroma Product, which is a leading 100% export oriented fruit and vegetable processing company. Bank of Georgia financed the construction of a new production plant in Kakheti. The company acquired new filling machines that enable it to produce new types of pulpy juices and high-viscosity products.
Another important project was financing coffee production by Meama. The main goal of the company is to offer its customers high-quality coffee that are processed in Georgia using modern equipment and technologies. Meama has already built the coffee production plant and administration offices on 5,000 m2
of land. The company intends to supply the Georgian market, as well as export its products to Azerbaijan, Armenia, Ukraine and Kazakhstan within one to two years of production launching.
InfrastructureInfrastructure development remains one of the most important objectives in Georgia. In 2018, the Bank financed several significant infrastructure projects and among them was the rehabilitation of the Khevi-Ubisa segment of Western Georgia’s E60 highway. Bank of Georgia supported the project by issuing letters of guarantee in collaboration with Crédit Agricole, Deutsche Bank and Commerzbank. The rehabilitation of the second part of the E60 highway Ubisa-Shorapani is also supported by Bank of Georgia via letters of credit in collaboration with Société Générale and HSBC.
Very important projects are implemented to rehabilitate the water supply system. Bank of Georgia financed a German company Ludwig Pfeiffer Hoch-und Tiefbau GmbH & Co. to develop infrastructure and rehabilitate the water supply system in different regions of Georgia.
EnergyElectricity consumption continues to grow in Georgia and long-term investment in the energy sector remains one of the top priorities in the country. The Bank supported the winner of the tender run by Georgian State Electrosystem for supply of various autotransformers, by issuing a letter of guarantee. The project is part of Georgia’s Ten Year Network Development Plan.
EducationIn 2018, Bank of Georgia organised several meetings for its clients in order to enable a knowledge and information exchange among them. The format of the meetings was informal and aimed to present the most successful Bank of Georgia clients with an opportunity to share their success stories with other clients. One of the meetings was held for female entrepreneurs and covered the challenges they encounter in their businesses, the solutions they reached and the overall experience they received all the way towards success. We believe in the power of knowledge-sharing and hope to help our clients achieve the objectives they set for their businesses.
76 Annual Report 2018 Bank of Georgia Group PLC 77Annual Report 2018 Bank of Georgia Group PLC
Strategic ReportStrategy
Strategic ReportPerformance Governance
FinancialStatements
AdditionalInformation
Strategic ReportOverview
Resources and responsibilities continued
Retail BankingBank of Georgia continues to innovate and generate a wide range of socially-oriented financial products and services that provide additional value to individuals and micro, small and medium-sized enterprises (SMEs) and meet their respective needs.
Express BankingThe Georgian banking sector still experiences difficulties in overcoming economic and geographical barriers in expanding its financial services in remote regions and among low-income segments of the population.
Our Express Banking service plays an important role in addressing this issue.• As at 31 December 2018, a network of 165 Express
branches and 3,115 Express Pay terminals are located all over the country, including in remote mountain regions.
• Express financial products, such as Express Card, Express Deposit and Express Loan are uncomplicated, easily accessible and affordable to a segment of the population that would not have access to banking products and services otherwise. By 31 December 2018, the Bank had attracted 538,729 clients, of which 48,701 became clients of the Bank in 2018.
As a part of the Express Banking service, we prioritise the development of self-service skills. We plan to expand the services offered by Express Pay terminals. All of these changes will provide a more accessible banking service to our clients. In 2017, the Bank developed web-based application processing tools that enable the completion of a full lending cycle remotely.
Express Student Card offers special discounts on public transport and free distance banking services, among other benefits. Moreover, students can get special #StudentBreak discounts in various stores, cafés and entertainment centres. Students are automatically involved in the Plus+ loyalty scheme – the Bank’s initiative that offers different status levels to customers and reward points that accumulate based on the client’s business with the Bank and can be redeemed into partner companies’ products and/or services, at the client’s request. Plus+ points can also be converted into mobile phone top-ups and used to pay public transport, utility bills and other products. The programme encourages the student population to use financial services and supports them financially during their studies.
Youth supportWe developed a wide range of financial products to support young people in Georgia. For example, via special conditions of the Child Deposit we provide parents with the opportunity to secure their children’s future. Starting from a minimal amount of GEL 10, a deposit can be opened for at least two years at any time from a child’s birth until the age of 18. The annual interest rate (10.2% for Georgian Lari and 1.0%-3.5% for foreign currency) is added to the initial deposit. In 2018, we opened approximately 10,000 Child Deposit accounts.
The Bank also offers special products that allow young people to get a higher education. Examples of such products are student loans with favourable terms that do not require any financial guarantees and collateral. Total portfolio of student loans amounted to c.GEL 672 thousand by the end of 2018, while loans with a total value of c.GEL 253 thousand were issued in 2018.
In 2016, the Bank partnered with the International Educational Centre (IEC) and created a new opportunity for students to study abroad. Students can apply for loans to finance tuition, living and insurance expenses abroad. The loans have a grace period of maximum 27 months. With a recommendation letter from IEC, the Bank finances the students without requesting a confirmation of income. In 2018, the Bank extended the contract with IEC and will continue to support students’ education.
Another example of the Bank’s products aimed at supporting young people is a social-educational project “sCool Card” – a multifunctional card for school children. The main objective of the project is to teach children about financial culture and build their knowledge around financial services at an early stage. sCool Card is available at no cost and all of the transactions and services are also free of charge. sCool Card provides special benefits for children in Georgian public and private schools. The benefits include free public transport in Tbilisi (metro, buses) and Batumi (buses), discounts for entertaining centres popular among children, bookstores, toyshops, children cafés, as well as the accumulation of points (sCoola) with each transaction.
In a further effort to help children better understand banking products, the Bank opened a sCool Card Business School, where experienced staff provide free training about topics such as: “The importance of money”, “Bank and me”, “Family budget”, “I am a manager”, etc. Bank of Georgia and the sCool Card are the finalists of the Child Friendly Banking Award 2017, The Global Inclusion Awards 2017 (Berlin, Germany).
Micro, small and medium enterprises (MSME)We continue to provide financing to MSMEs, a backbone of the Georgian economy that helps to ensure the sustainable development of Georgia. In addition to our own microfinance and SME loan programmes, we also participate in various projects that support entrepreneurs. Since 2015, the Bank has partnered with the non-profit Agriculture Projects Management Agency (APMA), which supports MSMEs in the agriculture sector. Together, we have co-financed agriculture loans at fixed annual interest rates that are partially subsidised by APMA. As of 31 December 2018, the total amount of gross loans that the Bank issued to MSMEs amounted to GEL 2.2 billion, of which c.GEL 177 million was issued through the Preferential Agriculture Lending Program.
In 2018, the Bank continued to reinforce the financing of micro business owners and considers this segment as one of the main areas of its portfolio growth.
The Bank has dedicated staff and established processes for its Micro-Express loans that target micro businesses and offer them loans under GEL 40,000. Increasing the automation and digitalisation is one of the cornerstones of the Bank’s micro lending strategy to make their banking experience fast, smooth and enjoyable.
Bank of Georgia is committed to further extending financing to MSMEs. Furthermore, the Bank is keen to develop financial products and lending practices to specifically service women-led MSMEs, which will ultimately increase their involvement in developing Georgia’s private sector.
In addition to assisting the MSMEs financially, the Bank runs an MSME portal www.businesshub.ge. The portal provides financial and business-related advice to entrepreneurs in order to upgrade their financial literacy and management skills and ensure the sustainable development of their businesses. The portal provides entrepreneurs with information on trainings and equips them with knowledge and skills in accounting, legal documents, business development, sales and marketing. The Bank assists its clients in marketing products through videos we create about them and publish on our pages in social media. #Icreate corners, located in Bank of Georgia’s branches, are also a great opportunity for clients to exhibit and promote their products free of charge.
Environmental and social risk management processes of MSME clients are embedded throughout the Bank’s activities. By ensuring that comprehensive environmental and social risk assessments and the necessary action plans are undertaken, we encourage our MSME clients to be in compliance with national environmental and social legislation. During site visits, we provide our clients with advice and guidance on good practice and standards in these areas. We update them on environmental, health and safety, as well as labour issues and monitor their compliance with environmental and social legislation.
In many cases of non-compliance, our proper and timely management of the environmental and social risks of our MSME clients has helped them to address issues that would otherwise have resulted in financial and legal sanctions from the state enforcement agency.
Sponsorship and charityAs part of our sponsorship and charitable activities, the Group continues to focus on promoting and enhancing access to education, conserving nature, supporting people with disabilities and special needs, developing social enterprises and facilitating innovative projects that focus on social goods. The Group’s Sponsorship and Charity Policy encourages partnerships with various foundations and Non-Governmental Organisations (NGOs) to deliver sustainable results and bring positive change. Sponsorship and charity funds are channelled through the Bank’s Tree of Life Foundation that, in its turn, distributes funding by means of grant competitions in order to ensure transparent and fair methods of financing. The Group also implements its own social projects.
In 2018, Tree of Life has allocated around GEL 1.7 million to support education, nature conservation, people with disabilities and special needs, social platforms, and the development of social entrepreneurship. Bank of Georgia together with the Tree of Life Foundation established a charity platform www.donate.ge, which connects the people in need with those who are willing to donate items, clothes, books, etc. The platform offers collection, sorting and delivery of items. In 2017-2018, 41,815 items were collected with help from 428 donors and www.donate.ge has already supported 1,360 beneficiaries.
Bank of Georgia recognises the impact it can have on the country’s social-economic development. Therefore, the Bank launched a grant programme to support socially driven enterprises in Georgia. In 2016-2018, Bank of Georgia supported ten social enterprises with up to GEL 387 thousand and GEL 50 thousand per project. At the same time, the Bank provided pro-bono services by helping the businesses in areas such as marketing, public relations, information technology, etc. The Bank partners with various NGOs to maximise its role in the social cause.
Promoting and enhancing access to educationBank of Georgia University has offered a top quality master’s degree programme since its foundation in 2014. The university welcomed its fifth intake of MBA students in 2018 and simultaneously launched a bachelor’s degree programme in 2017. The cost of studies in 2017-2018 were again largely subsidised by the Bank with GEL 767

78 Annual Report 2018 Bank of Georgia Group PLC 79Annual Report 2018 Bank of Georgia Group PLC
Strategic ReportStrategy
Strategic ReportPerformance Governance
FinancialStatements
AdditionalInformation
Strategic ReportOverview
Resources and responsibilities continued
thousand. Up to 20 students study at no cost, while 40 students benefit from a 0% loan with grace period until graduation. Bank of Georgia University provides its students with hands-on experience by offering them the possibility to observe various business processes at the Group’s companies.
In 2013, the Bank became the first Georgian company to cooperate with one of the most prestigious scholarship programmes in the world – the Chevening scholarship. This cooperation provides Georgian students with an opportunity to pursue education in the UK. In 2018, the Group provided up to GBP 100 thousand to finance a master’s degree programme for three students. The partnership with Chevening will continue next year and the Group is looking forward to selecting students who will continue their studies in the UK.
In 2014, the Bank signed a partnership agreement with the prestigious US Fulbright scholarship scheme. Thanks to the Bank of Georgia’s contribution, a selected number of students from Georgia are able to enrol in a two-year master’s degree programme at a US university. In 2018, the funding provided to the students for their two-year degrees amounted to US$ 50 thousand. Since 2014, the Bank has granted US$ 300 thousand to the US Fulbright scholarship programme.
Starting from 2018, Bank of Georgia supports San Diego State University (SDSU) Georgia. For 2018-2019 academic year the Bank will finance the scholarships for ten students in the amount of up to US$ 80 thousand.
Over the last four years, the Bank has been supporting a public speaking competition organised by the English Speaking Union Georgia. The competition allows high school senior year or first year university students to prepare a speech on a pre-selected topic and present it in front of a competent jury. The winner is granted a fully paid trip to London to attend a global public speaking competition. We aim to support this competition in 2019 as well.
The Bank has been supporting every single TEDx Tbilisi conference since they were first organised in 2012. A TEDx conference is a locally organised TED format event, where communities, organisations and individuals join to initiate a conversation and connect with each other on different topics, which are important to society.
In 2018, Bank of Georgia became a general sponsor of the Georgian National Olympic Committee, which the Bank will support in all of its planned sports activities up until 2020. In 2018, the Bank granted monetary awards to the best young Georgian sportsman of 2018, selected by the Georgian National Olympic Committee, and to the winner of the boys’ Greco-Roman 60kg competition at the 2018 Youth Olympic Games in Buenos Aires, Argentina. The Bank’s partnership with the Georgian National Olympic Committee aims to support and popularise sport in Georgia, to raise awareness of Georgian athletes and to provide information on Olympic Games.
Case studyIn 2018, Bank of Georgia’s Corporate Investment Banking team organised a charity auction-exhibition of modern Georgian paintings and invited its top clients to participate in the cause. As a result, US$ 75,000 collected from the auction was rounded to US$ 100,000 by the Bank and the amount is directed at financing extremely talented children from Georgia’s highlands. The first batch of five children will study English in summer school in the UK. These children gained huge popularity on social media for popularising Georgian regions.
In our effort to spread internet access to financially disadvantaged families in Georgia, we support a social enterprise www.charte.ge. We believe that this project is crucial for access to education. In 2018, we granted laptops and access to internet to 19 families near the conflict zone in the village of Dvani.
Supporting people with disabilities Since 2014, the Bank has focused its efforts on supporting people with disabilities – one of the most vulnerable social groups in Georgia. In 2018, the Bank donated up to GEL 75 thousand to the Tree of Life Foundation for this cause. The Tree of Life Foundation distributed the funds through grant competitions – one intended for the relevant NGOs that work with people with disabilities and another with the specific aim of promoting social entrepreneurship. In order to qualify for the competition, the proposals had to focus on the creation of a small enterprise with a social component aimed at improving the livelihood of people with disabilities.
Case studyA social enterprise TsnuliBank of Georgia financed a social enterprise, Tsnuli, founded by the People with Disabilities Union in Kaspi – a town 65 km from Tbilisi. The enterprise makes handmade wood-woven products of various shapes and sizes, namely, baskets, lamps, furniture, etc. Tsnuli employs seven beneficiaries with disabilities, who were taught the craft in just three months. Employment in Tsnuli gave the beneficiaries a unique opportunity to learn new skills and materialise their newly gained know-how in a supportive atmosphere. The enterprise aims to improve the quality of life of its employees and plans to expand in the future and benefit even more people on its way.
The Bank continues to focus on the adaptation of its own infrastructure. In 2018, an additional ten service centres became available for people with disabilities.
Conserving nature Another priority of the Group’s charitable activities is the preservation of wildlife diversity. The Bank cooperates with the Caucasus Nature Fund (CNF) and each year donates US$ 100,000 for the maintenance of ten protected areas: Borjomi-Kharagauli, Lagodekhi, Tusheti, Vashlovani Mtirala, Javakheti, Kazbegi, Algeti, Kintrishi and Pshav-Khevsureti.
In order to promote eco-tourism in Georgia, the Bank’s Tree of Life Foundation financed an eco-camp in Lagodekhi Protected Area in Kakheti, Eastern Georgia. The eco-camp can host 50 visitors at a time and is equipped with water closets, kitchens, a wooden cafeteria, and communication infrastructure. Moreover, the visitors can hold conferences, training, sport competitions, screen films and organise events in open air. The camp has a space for tents, including large ones designed for people with disabilities. The eco-camp received its first visitors in the summer of 2018 and had hosted c.800 people by the end of 2018. The camp employs five people, including people with disabilities.
In order to raise awareness about conserving nature and the importance of ecology, Bank of Georgia is actively involved in a number of activities such as World Cleanup Day. Over the last two years, the Bank has recycled around eight tonnes of used paper in its headquarters and saved 136 trees as a result.
In 2018, Bank of Georgia’s employees continued using a car pooling application called “Gzad”. The application enables them to share a ride to and from the Bank, which in turn helps reduce air pollution and ease the traffic in Tbilisi.
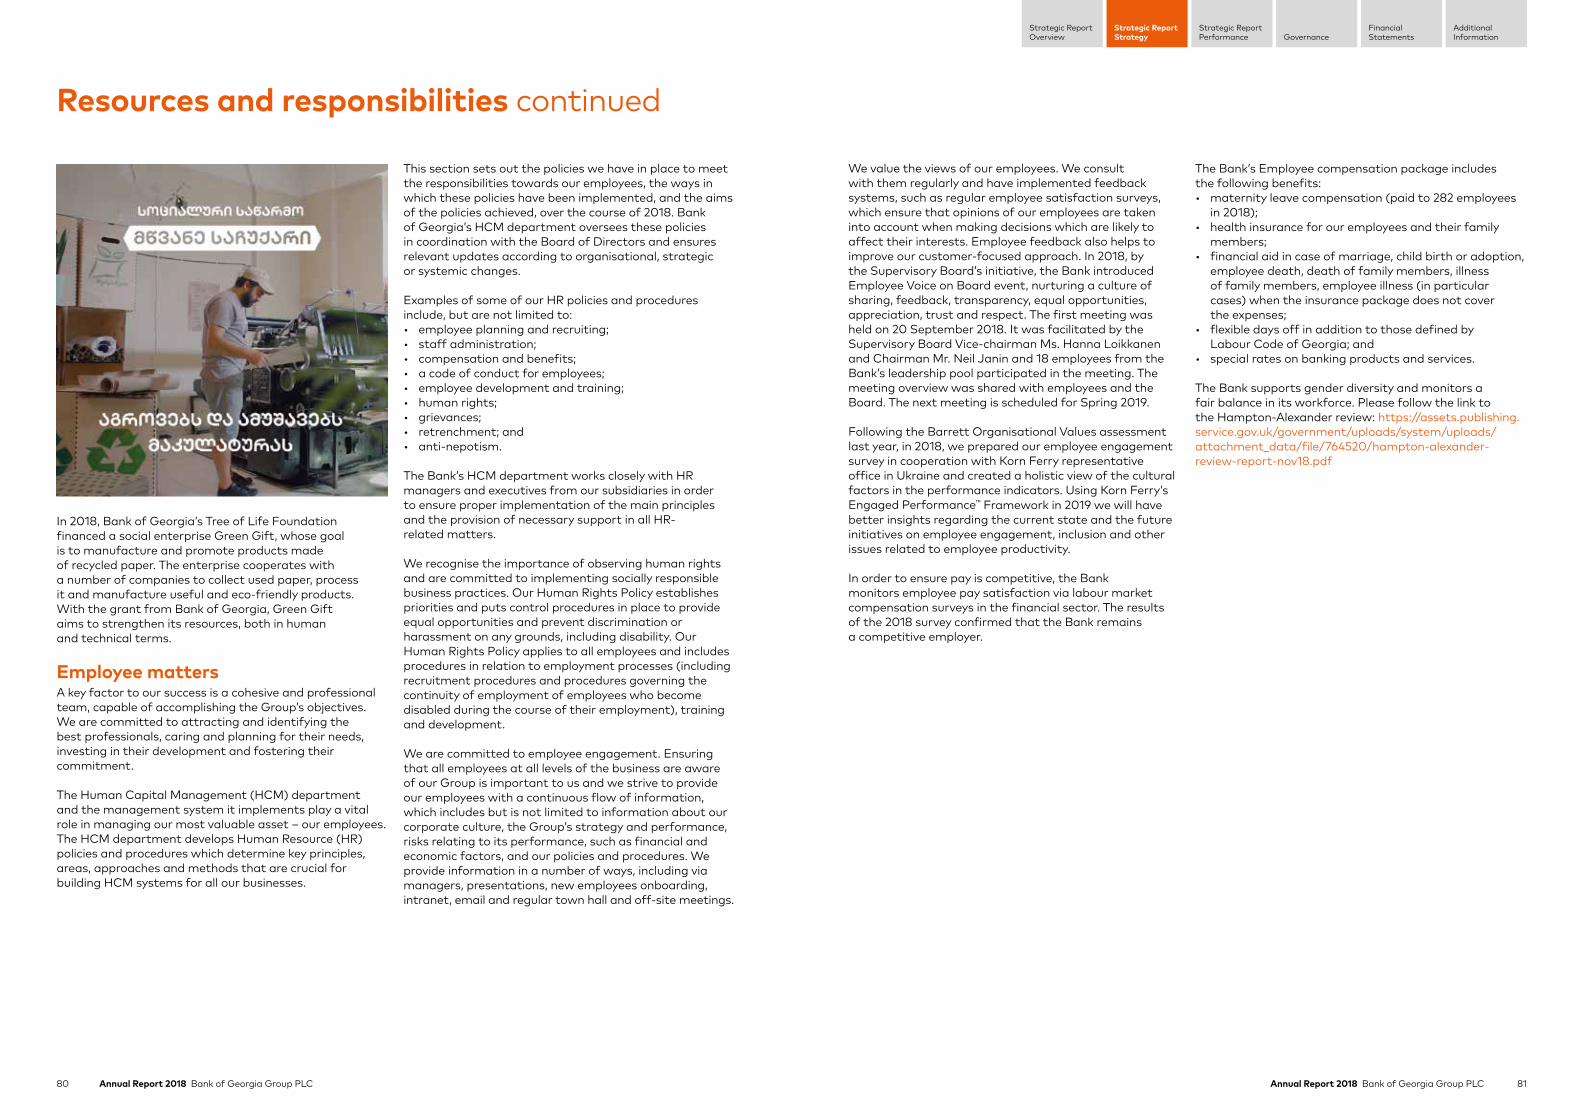
80 Annual Report 2018 Bank of Georgia Group PLC 81Annual Report 2018 Bank of Georgia Group PLC
Strategic ReportStrategy
Strategic ReportPerformance Governance
FinancialStatements
AdditionalInformation
Strategic ReportOverview
Resources and responsibilities continued
In 2018, Bank of Georgia’s Tree of Life Foundation financed a social enterprise Green Gift, whose goal is to manufacture and promote products made of recycled paper. The enterprise cooperates with a number of companies to collect used paper, process it and manufacture useful and eco-friendly products. With the grant from Bank of Georgia, Green Gift aims to strengthen its resources, both in human and technical terms.
Employee mattersA key factor to our success is a cohesive and professional team, capable of accomplishing the Group’s objectives. We are committed to attracting and identifying the best professionals, caring and planning for their needs, investing in their development and fostering their commitment.
The Human Capital Management (HCM) department and the management system it implements play a vital role in managing our most valuable asset – our employees. The HCM department develops Human Resource (HR) policies and procedures which determine key principles, areas, approaches and methods that are crucial for building HCM systems for all our businesses.
This section sets out the policies we have in place to meet the responsibilities towards our employees, the ways in which these policies have been implemented, and the aims of the policies achieved, over the course of 2018. Bank of Georgia’s HCM department oversees these policies in coordination with the Board of Directors and ensures relevant updates according to organisational, strategic or systemic changes.
Examples of some of our HR policies and procedures include, but are not limited to:• employee planning and recruiting;• staff administration;• compensation and benefits;• a code of conduct for employees;• employee development and training;• human rights;• grievances;• retrenchment; and• anti-nepotism.
The Bank’s HCM department works closely with HR managers and executives from our subsidiaries in order to ensure proper implementation of the main principles and the provision of necessary support in all HR- related matters.
We recognise the importance of observing human rights and are committed to implementing socially responsible business practices. Our Human Rights Policy establishes priorities and puts control procedures in place to provide equal opportunities and prevent discrimination or harassment on any grounds, including disability. Our Human Rights Policy applies to all employees and includes procedures in relation to employment processes (including recruitment procedures and procedures governing the continuity of employment of employees who become disabled during the course of their employment), training and development.
We are committed to employee engagement. Ensuring that all employees at all levels of the business are aware of our Group is important to us and we strive to provide our employees with a continuous flow of information, which includes but is not limited to information about our corporate culture, the Group’s strategy and performance, risks relating to its performance, such as financial and economic factors, and our policies and procedures. We provide information in a number of ways, including via managers, presentations, new employees onboarding, intranet, email and regular town hall and off-site meetings.
We value the views of our employees. We consult with them regularly and have implemented feedback systems, such as regular employee satisfaction surveys, which ensure that opinions of our employees are taken into account when making decisions which are likely to affect their interests. Employee feedback also helps to improve our customer-focused approach. In 2018, by the Supervisory Board’s initiative, the Bank introduced Employee Voice on Board event, nurturing a culture of sharing, feedback, transparency, equal opportunities, appreciation, trust and respect. The first meeting was held on 20 September 2018. It was facilitated by the Supervisory Board Vice-chairman Ms. Hanna Loikkanen and Chairman Mr. Neil Janin and 18 employees from the Bank’s leadership pool participated in the meeting. The meeting overview was shared with employees and the Board. The next meeting is scheduled for Spring 2019.
Following the Barrett Organisational Values assessment last year, in 2018, we prepared our employee engagement survey in cooperation with Korn Ferry representative office in Ukraine and created a holistic view of the cultural factors in the performance indicators. Using Korn Ferry’s Engaged Performance™ Framework in 2019 we will have better insights regarding the current state and the future initiatives on employee engagement, inclusion and other issues related to employee productivity.
In order to ensure pay is competitive, the Bank monitors employee pay satisfaction via labour market compensation surveys in the financial sector. The results of the 2018 survey confirmed that the Bank remains a competitive employer.
The Bank’s Employee compensation package includes the following benefits:• maternity leave compensation (paid to 282 employees
in 2018);• health insurance for our employees and their family
members;• financial aid in case of marriage, child birth or adoption,
employee death, death of family members, illness of family members, employee illness (in particular cases) when the insurance package does not cover the expenses;
• flexible days off in addition to those defined by Labour Code of Georgia; and
• special rates on banking products and services.
The Bank supports gender diversity and monitors a fair balance in its workforce. Please follow the link to the Hampton-Alexander review: https://assets.publishing.service.gov.uk/government/uploads/system/uploads/attachment_data/file/764520/hampton-alexander-review-report-nov18.pdf
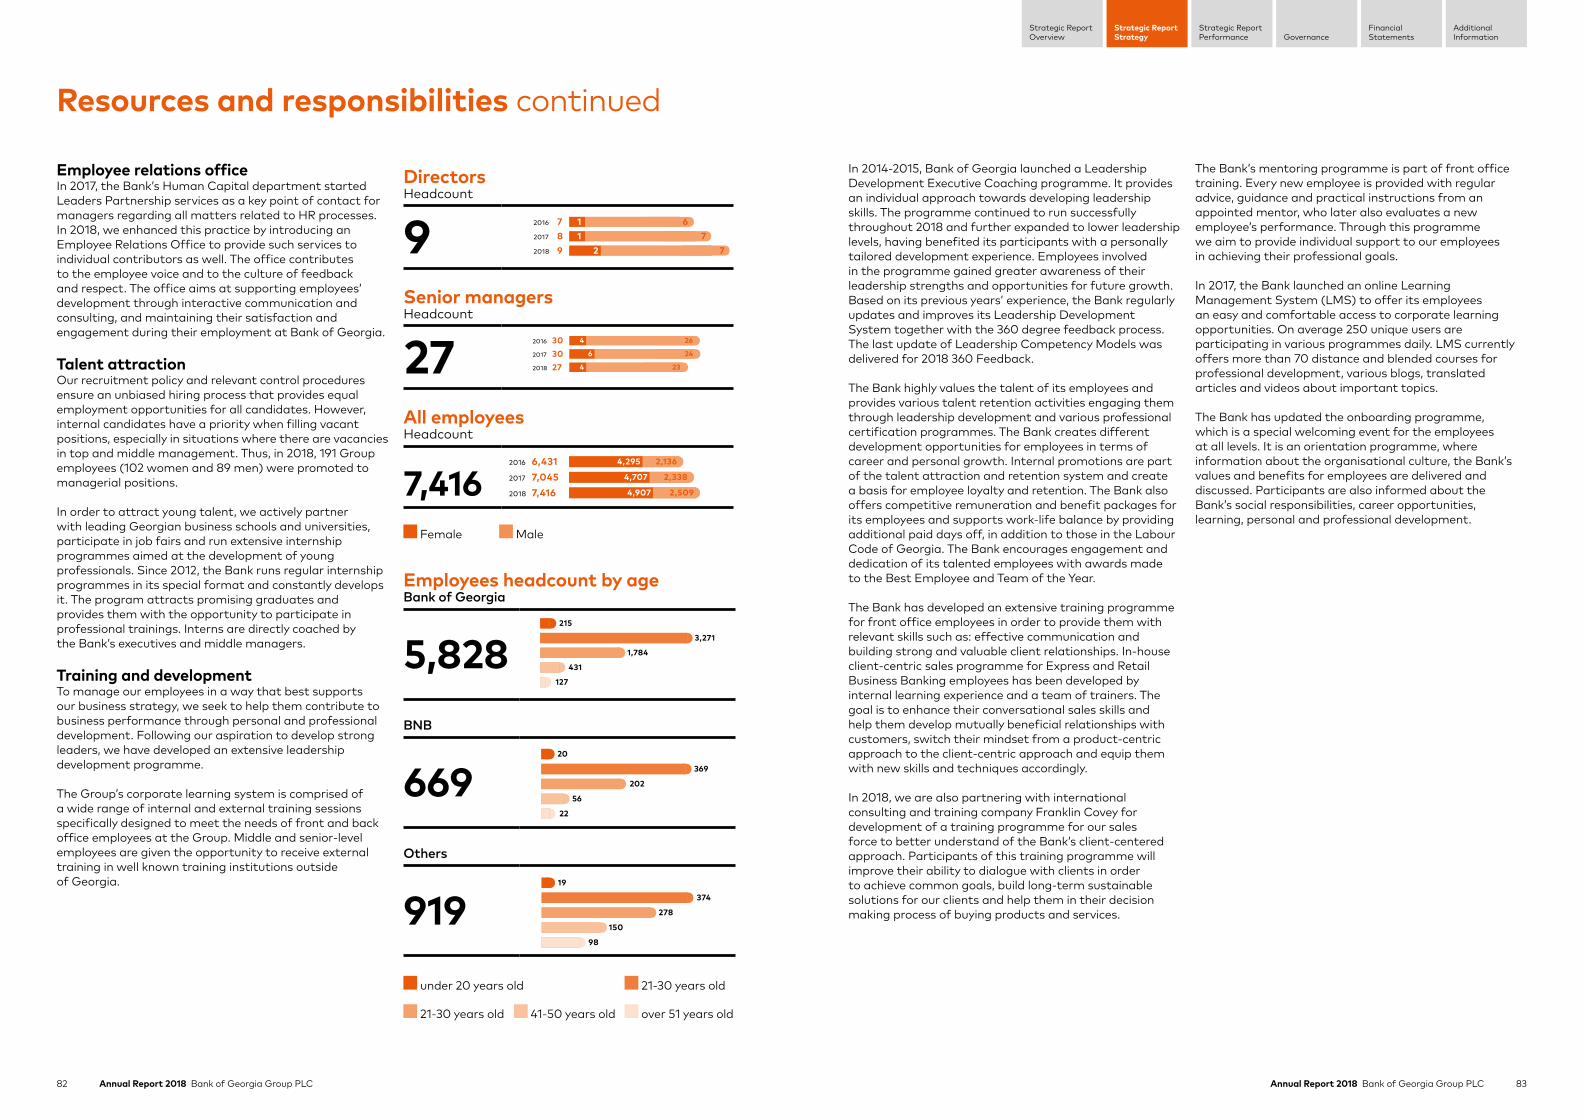
82 Annual Report 2018 Bank of Georgia Group PLC 83Annual Report 2018 Bank of Georgia Group PLC
Strategic ReportStrategy
Strategic ReportPerformance Governance
FinancialStatements
AdditionalInformation
Strategic ReportOverview
Resources and responsibilities continued
Employee relations office In 2017, the Bank’s Human Capital department started Leaders Partnership services as a key point of contact for managers regarding all matters related to HR processes. In 2018, we enhanced this practice by introducing an Employee Relations Office to provide such services to individual contributors as well. The office contributes to the employee voice and to the culture of feedback and respect. The office aims at supporting employees’ development through interactive communication and consulting, and maintaining their satisfaction and engagement during their employment at Bank of Georgia.
Talent attractionOur recruitment policy and relevant control procedures ensure an unbiased hiring process that provides equal employment opportunities for all candidates. However, internal candidates have a priority when filling vacant positions, especially in situations where there are vacancies in top and middle management. Thus, in 2018, 191 Group employees (102 women and 89 men) were promoted to managerial positions.
In order to attract young talent, we actively partner with leading Georgian business schools and universities, participate in job fairs and run extensive internship programmes aimed at the development of young professionals. Since 2012, the Bank runs regular internship programmes in its special format and constantly develops it. The program attracts promising graduates and provides them with the opportunity to participate in professional trainings. Interns are directly coached by the Bank’s executives and middle managers.
Training and developmentTo manage our employees in a way that best supports our business strategy, we seek to help them contribute to business performance through personal and professional development. Following our aspiration to develop strong leaders, we have developed an extensive leadership development programme.
The Group’s corporate learning system is comprised of a wide range of internal and external training sessions specifically designed to meet the needs of front and back office employees at the Group. Middle and senior-level employees are given the opportunity to receive external training in well known training institutions outside of Georgia.
DirectorsHeadcount
9 7892018
2017
2016 1 61 7
2 7
Senior managersHeadcount
27 26
24
23
4
6
4
3030272018
2017
2016
All employeesHeadcount
7,4162,136
2,338
2,509
4,295
4,707
4,907
6,4317,0457,4162018
2017
2016
Female Male
Employees headcount by ageBank of Georgia
5,828215
3,271
1,784
431
127
BNB
66920
369
202
56
22
Others
91919
374
278
150
98
under 20 years old 21-30 years old
21-30 years old 41-50 years old over 51 years old
In 2014-2015, Bank of Georgia launched a Leadership Development Executive Coaching programme. It provides an individual approach towards developing leadership skills. The programme continued to run successfully throughout 2018 and further expanded to lower leadership levels, having benefited its participants with a personally tailored development experience. Employees involved in the programme gained greater awareness of their leadership strengths and opportunities for future growth. Based on its previous years’ experience, the Bank regularly updates and improves its Leadership Development System together with the 360 degree feedback process. The last update of Leadership Competency Models was delivered for 2018 360 Feedback.
The Bank highly values the talent of its employees and provides various talent retention activities engaging them through leadership development and various professional certification programmes. The Bank creates different development opportunities for employees in terms of career and personal growth. Internal promotions are part of the talent attraction and retention system and create a basis for employee loyalty and retention. The Bank also offers competitive remuneration and benefit packages for its employees and supports work-life balance by providing additional paid days off, in addition to those in the Labour Code of Georgia. The Bank encourages engagement and dedication of its talented employees with awards made to the Best Employee and Team of the Year.
The Bank has developed an extensive training programme for front office employees in order to provide them with relevant skills such as: effective communication and building strong and valuable client relationships. In-house client-centric sales programme for Express and Retail Business Banking employees has been developed by internal learning experience and a team of trainers. The goal is to enhance their conversational sales skills and help them develop mutually beneficial relationships with customers, switch their mindset from a product-centric approach to the client-centric approach and equip them with new skills and techniques accordingly.
In 2018, we are also partnering with international consulting and training company Franklin Covey for development of a training programme for our sales force to better understand of the Bank’s client-centered approach. Participants of this training programme will improve their ability to dialogue with clients in order to achieve common goals, build long-term sustainable solutions for our clients and help them in their decision making process of buying products and services.
The Bank’s mentoring programme is part of front office training. Every new employee is provided with regular advice, guidance and practical instructions from an appointed mentor, who later also evaluates a new employee’s performance. Through this programme we aim to provide individual support to our employees in achieving their professional goals.
In 2017, the Bank launched an online Learning Management System (LMS) to offer its employees an easy and comfortable access to corporate learning opportunities. On average 250 unique users are participating in various programmes daily. LMS currently offers more than 70 distance and blended courses for professional development, various blogs, translated articles and videos about important topics.
The Bank has updated the onboarding programme, which is a special welcoming event for the employees at all levels. It is an orientation programme, where information about the organisational culture, the Bank’s values and benefits for employees are delivered and discussed. Participants are also informed about the Bank’s social responsibilities, career opportunities, learning, personal and professional development.
84 Annual Report 2018 Bank of Georgia Group PLC 85Annual Report 2018 Bank of Georgia Group PLC
Strategic ReportStrategy
Strategic ReportPerformance Governance
FinancialStatements
AdditionalInformation
Strategic ReportOverview
Resources and responsibilities continued
Human Rights PolicyThe Human Resources and Human Rights Policies are an integral part of the employee on-boarding package. It is available for employees on the intranet and the updates are communicated electronically.
The Human Rights Policy covers:• equal opportunities and anti-discrimination;• work environment free of harassment; and• grievance policy.
Code of ethics, anti-bribery and anti-corruption policiesThe Group has a Code of Ethics, as well as an Anti-Bribery Policy, which are also applicable to the Group companies. In the Bank, the Corporate Security Unit within the AML and Compliance department is in charge of implementing and monitoring controls related to anti-bribery issues. The department has the procedures in place, which define the process of establishing relationships with vendors and other third parties, undertaking public tenders, etc. The Corporate Security Unit provides annual online training for employees on anti-bribery issues, which are also included in induction trainings.
As an organisation that is fully committed to the prevention of bribery and corruption, the Bank ensures that appropriate internal controls are in place and operating effectively.
Anti-bribery and anti-corruption policy enforcement processes include:• operating an internal whistleblowing hotline system;• disclosure of gifts or other benefits, including
hospitality, offered to, or received by Bank’s personnel; • voluntary disclosure of corrupt conduct;• third party screening to identify the level of risk
third parties might pose;• all charitable and political donations must be
authorised by the relevant responsible position;• informing the stakeholders about anti-corruption
and anti-bribery principles before commencement of business relations;
• ensuring that anti-bribery and anti-corruption clauses are incorporated in the agreements with customers and third parties;
• ensuring that anti-bribery and anti-corruption matters are included in contractual agreements with partners/counterparties; and
• online training programmes aiming to raise awareness in corruption and bribery issues among employees.
As part of the Group’s third party screening to identify the level of risk the third parties might pose, the Group carries out the following due diligence processes: indirect investigations which includes general research of the activities undertaken by the proposed business partners such as agents, joint venture partners, contractors, suppliers and other third parties, their reputation and information whether the company is a related party.
Client experienceBank of Georgia has identified customer experience as one of its strategic priorities and incorporates its principles in all relationships/touch-points with customers, new product and channel development, and optimisation of business processes in the back office.
The Bank tracks customer satisfaction with multiple survey channels and several key performance indicators on an ongoing basis, followed by an effective “close-the-loop” process. The Bank is responsive to the customer feedback which it collects on a daily basis and has been consistently working on integrating the customer experience in its processes. The Bank’s Net Promoter Score (NPS) increased from 27.4% to 38.8% in the past year based on a research conducted by an independent company across Georgia.
We made significant progress in several areas:• the transformation towards our client-centric model
in Retail Banking started in 2016 and has gradually increased client satisfaction with the service they receive from universal bankers in re-designed branches. Our employees in front offices have proved to be the key drivers of this increase thanks to the Bank’s investment in training in customer service trainings based on international best practices;
• the Bank is gradually increasing the utilisation of its digital channels among its customers through ongoing loyalty and bonus programmes. Now, bankers in front offices have more time to provide consulting services to clients and spend less time on transactional services that customers already prefer to carry out on digital channels;
• the owners of the channels we use to research and report customer experience have a transparent view of the customer feedback on those channels and work consistently on enhancing the experience in their channel to improve the overall journey of the customer; and
• the majority of back office transformation processes that have a direct or indirect impact on a customer are tested. In some cases customer feedback is obtained before the transformation is implemented (where relevant).
Educating on banking mattersThe Group recognises the importance of having the best interest of society both in the short and long term. With the aim to positively impact the community where it operates, the Bank is motivated to provide its clients with comprehensive information on their rights and financial transactions.
Aiming to increase financial knowledge throughout the country, the Bank of Georgia together with the National Bank of Georgia (NBG) and with the support of the German Foundation of Savings Banks for International Cooperation, launched a website www.grovia.com.ge which contains information on World Savings Day, banking products and services, and customer rights. The idea behind the project is to restore the public trust in the financial sector and to overcome the hurdle between people and commercial banks.
Grovia, which is a symbol of World Savings Day in Georgia, was created within Savings Accumulation and Financial Opportunities – the project supported by the Savings Banks Foundation for International Cooperation (SBFIC) together with the Ministry of Economic Cooperation and Development of Germany. Public savings are important for the country’s economy and financial institutions. The culture of saving is directly related to people’s knowledge of financial and economic matters. Financial education is considered as one of the components of financial services and consumer protection. Due to its importance, many countries, including Georgia, have taken steps to increase opportunities to educate the population on financial services. Grovia is a step towards spreading financial education in Georgia and empowering the people to make sound and informed decisions about their personal finances.
In addition to Grovia, Bank of Georgia compiled a dictionary of banking terminology to help clients better understand the banking products offered to them, read and comment on the contracts they are about to sign, and as a result make informed decisions in their best interest. The dictionary includes more than 1,000 banking, financial, legal, accounting, insurance, marketing terms and phrases and is available in the Bank’s service centres, as well as online under www.terminebi.ge. Printed copies are also available in public libraries and universities. Similar projects are successfully implemented in various developed countries, including Germany and Poland.
Security mattersBank of Georgia takes a number of measures to guarantee employee safety. The Bank regularly carries out fire and other emergency drills and relevant trainings. Selected employees in every major branch of the Bank are periodically trained in providing first aid. In 2018, Bank of Georgia launched a new project which aims to provide security to employees in case they are blackmailed, abused, stalked, etc. In 2018, the Bank launched “My Lawyer” – a project created to protect the rights of the employees and their family members in case a crime was committed against them or if they themselves are accused of wrong-doing. Every service centre of the Bank is equipped with a security system and is protected by the Police force when the alarm is activated. The Bank also employs its own security which patrols the service centres around the clock.
Group policiesThe Group has in place a Code of Ethics, as well as policies which relate to environmental matters, employees, social matters, our respect for human rights and anti-corruption and bribery.
Copies of these polices can be found on the Group’s website:https://bankofgeorgiagroup.com/governance/documents
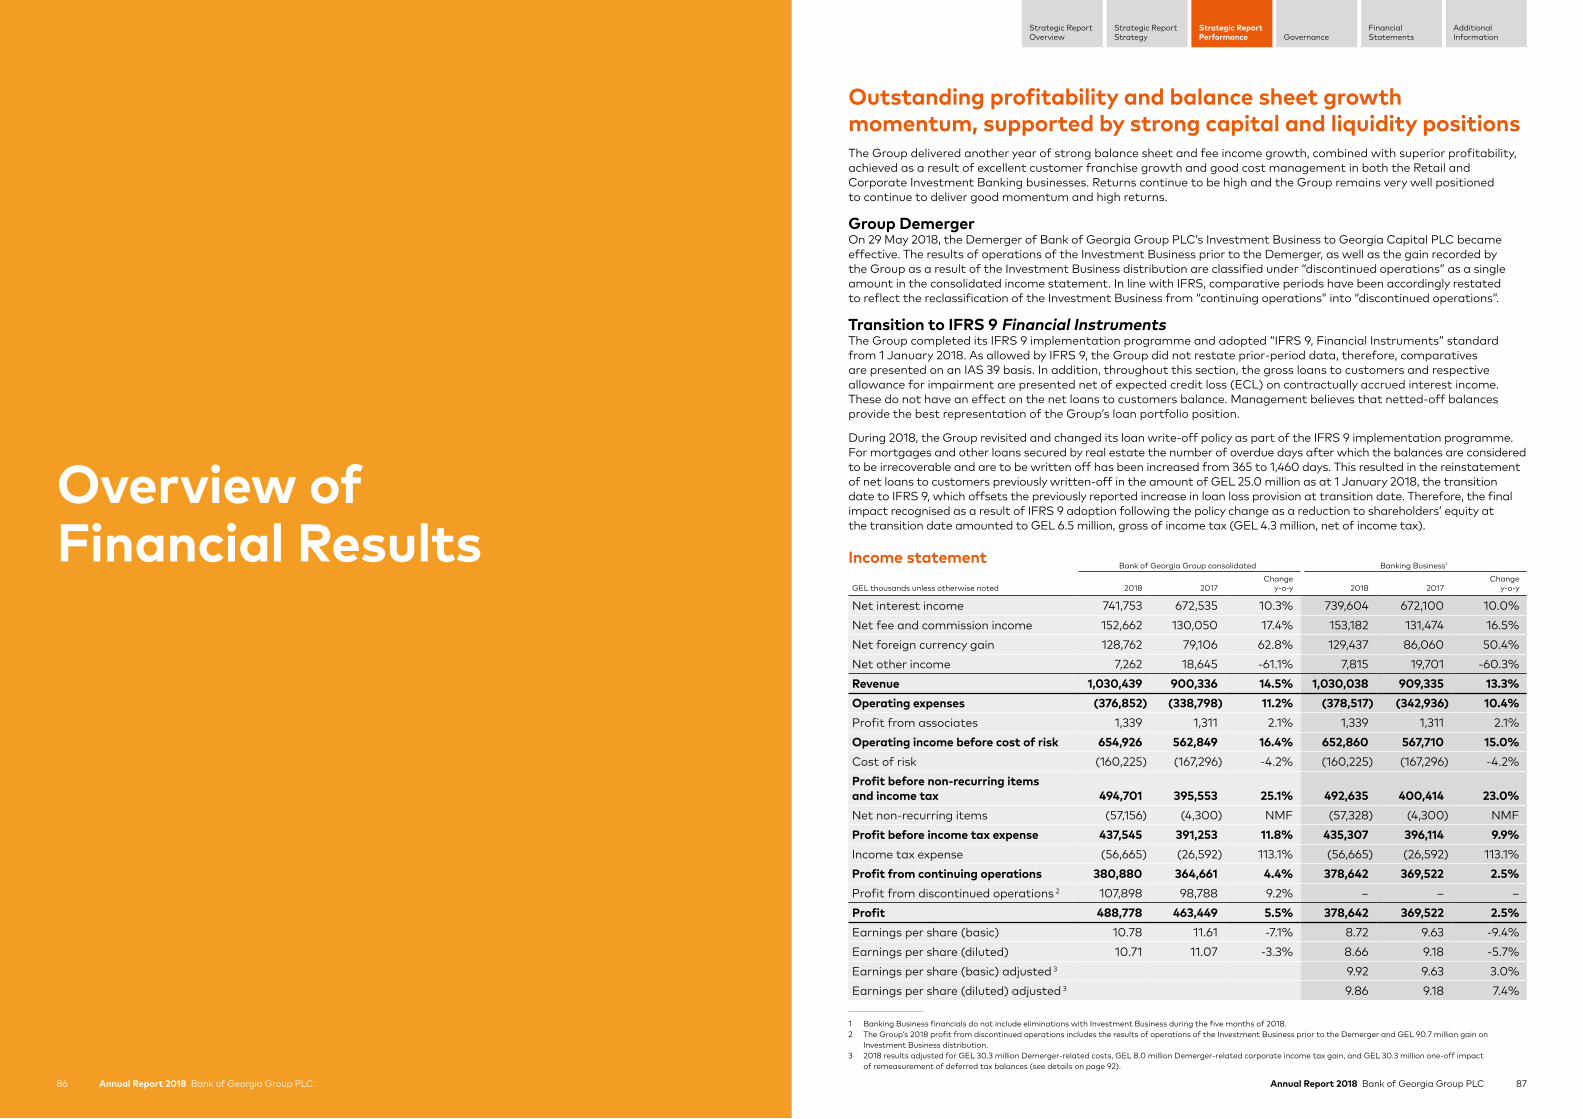
87Annual Report 2018 Bank of Georgia Group PLC
Strategic ReportStrategy
Strategic ReportPerformance Governance
FinancialStatements
AdditionalInformation
Strategic ReportOverview
Annual Report 2018 Bank of Georgia Group PLC86
Overview of Financial Results
Outstanding profitability and balance sheet growth momentum, supported by strong capital and liquidity positionsThe Group delivered another year of strong balance sheet and fee income growth, combined with superior profitability, achieved as a result of excellent customer franchise growth and good cost management in both the Retail and Corporate Investment Banking businesses. Returns continue to be high and the Group remains very well positioned to continue to deliver good momentum and high returns.
Group DemergerOn 29 May 2018, the Demerger of Bank of Georgia Group PLC’s Investment Business to Georgia Capital PLC became effective. The results of operations of the Investment Business prior to the Demerger, as well as the gain recorded by the Group as a result of the Investment Business distribution are classified under “discontinued operations” as a single amount in the consolidated income statement. In line with IFRS, comparative periods have been accordingly restated to reflect the reclassification of the Investment Business from “continuing operations” into “discontinued operations”.
Transition to IFRS 9 Financial InstrumentsThe Group completed its IFRS 9 implementation programme and adopted “IFRS 9, Financial Instruments” standard from 1 January 2018. As allowed by IFRS 9, the Group did not restate prior-period data, therefore, comparatives are presented on an IAS 39 basis. In addition, throughout this section, the gross loans to customers and respective allowance for impairment are presented net of expected credit loss (ECL) on contractually accrued interest income. These do not have an effect on the net loans to customers balance. Management believes that netted-off balances provide the best representation of the Group’s loan portfolio position.
During 2018, the Group revisited and changed its loan write-off policy as part of the IFRS 9 implementation programme. For mortgages and other loans secured by real estate the number of overdue days after which the balances are considered to be irrecoverable and are to be written off has been increased from 365 to 1,460 days. This resulted in the reinstatement of net loans to customers previously written-off in the amount of GEL 25.0 million as at 1 January 2018, the transition date to IFRS 9, which offsets the previously reported increase in loan loss provision at transition date. Therefore, the final impact recognised as a result of IFRS 9 adoption following the policy change as a reduction to shareholders’ equity at the transition date amounted to GEL 6.5 million, gross of income tax (GEL 4.3 million, net of income tax).
Income statementBank of Georgia Group consolidated Banking Business1
GEL thousands unless otherwise noted 2018 2017Change
y-o-y 2018 2017Change
y-o-y
Net interest income 741,753 672,535 10.3% 739,604 672,100 10.0%Net fee and commission income 152,662 130,050 17.4% 153,182 131,474 16.5%Net foreign currency gain 128,762 79,106 62.8% 129,437 86,060 50.4%Net other income 7,262 18,645 -61.1% 7,815 19,701 -60.3%Revenue 1,030,439 900,336 14.5% 1,030,038 909,335 13.3%Operating expenses (376,852) (338,798) 11.2% (378,517) (342,936) 10.4%Profit from associates 1,339 1,311 2.1% 1,339 1,311 2.1%Operating income before cost of risk 654,926 562,849 16.4% 652,860 567,710 15.0%Cost of risk (160,225) (167,296) -4.2% (160,225) (167,296) -4.2%Profit before non-recurring items and income tax 494,701 395,553 25.1% 492,635 400,414 23.0%Net non-recurring items (57,156) (4,300) NMF (57,328) (4,300) NMFProfit before income tax expense 437,545 391,253 11.8% 435,307 396,114 9.9%Income tax expense (56,665) (26,592) 113.1% (56,665) (26,592) 113.1%Profit from continuing operations 380,880 364,661 4.4% 378,642 369,522 2.5%Profit from discontinued operations 2 107,898 98,788 9.2% – – –Profit 488,778 463,449 5.5% 378,642 369,522 2.5%Earnings per share (basic) 10.78 11.61 -7.1% 8.72 9.63 -9.4%Earnings per share (diluted) 10.71 11.07 -3.3% 8.66 9.18 -5.7%Earnings per share (basic) adjusted 3 9.92 9.63 3.0%Earnings per share (diluted) adjusted 3 9.86 9.18 7.4%
1 Banking Business financials do not include eliminations with Investment Business during the five months of 2018.2 The Group’s 2018 profit from discontinued operations includes the results of operations of the Investment Business prior to the Demerger and GEL 90.7 million gain on
Investment Business distribution.3 2018 results adjusted for GEL 30.3 million Demerger-related costs, GEL 8.0 million Demerger-related corporate income tax gain, and GEL 30.3 million one-off impact
of remeasurement of deferred tax balances (see details on page 92).

88 Annual Report 2018 Bank of Georgia Group PLC 89Annual Report 2018 Bank of Georgia Group PLC
Strategic ReportStrategy
Strategic ReportPerformance Governance
FinancialStatements
AdditionalInformation
Strategic ReportOverview
Overview of financial results continued
4 Banking Business financials do not include eliminations with Investment Business during the five months of 2018.5 The y-o-y decline in book value per share as at 31 December 2018 is driven by the Demerger of Investment Business to Georgia Capital PLC on 29 May 2018 and the
issuance of additional 9,784,716 Bank of Georgia Group shares (equivalent to 19.9% of Bank of Georgia Group’s issued ordinary share capital) to Georgia Capital.6 2018 results adjusted for GEL 30.3 million Demerger-related costs, GEL 8.0 million Demerger-related corporate income tax gain, and GEL 30.3 million one-off impact
of remeasurement of deferred tax balances (see details on page 92).7 2018 ROAE adjusted for GEL 30.3 million Demerger-related costs, GEL 8.0 million Demerger-related corporate income tax gain, and GEL 30.3 million one-off impact of
remeasurement of deferred tax balances.
Balance sheetBank of Georgia Group consolidated Banking Business 4
GEL thousands unless otherwise noted 2018 2017Change
y-o-y 2018 2017Change
y-o-y
Liquid assets 4,540,032 4,373,251 3.8% 4,540,032 4,346,509 4.5%Cash and cash equivalents 1,215,799 1,582,435 -23.2% 1,215,799 1,516,401 -19.8%Amounts due from credit institutions 1,305,216 1,225,947 6.5% 1,305,216 1,216,349 7.3%Investment securities 2,019,017 1,564,869 29.0% 2,019,017 1,613,759 25.1%
Loans to customers and finance lease receivables 9,397,747 7,690,450 22.2% 9,397,747 7,741,420 21.4%Property and equipment 344,059 988,436 -65.2% 344,059 322,925 6.5%Assets of disposal group held for sale – 1,136,417 NMF – – –
Total assets 14,798,303 15,168,669 -2.4% 14,798,303 12,907,678 14.6%Client deposits and notes 8,133,853 6,712,482 21.2% 8,133,853 7,078,058 14.9%Amounts due to credit institutions 2,994,879 3,155,839 -5.1% 2,994,879 2,778,338 7.8%
Borrowings from DFI 1,302,679 1,624,347 -19.8% 1,302,679 1,297,749 0.4%Short-term loans from NBG 1,118,957 793,528 41.0% 1,118,957 793,528 41.0%Loans and deposits from commercial banks 573,243 737,964 -22.3% 573,243 687,061 -16.6%
Debt securities issued 1,730,414 1,709,152 1.2% 1,730,414 1,386,412 24.8%Liabilities of disposal group held for sale – 516,663 NMF – – –Total liabilities 13,000,030 12,436,299 4.5% 13,000,030 11,354,976 14.5%Total equity 1,798,273 2,732,370 -34.2% 1,798,273 1,552,702 15.8%Book value per share 5 37.59 65.22 -42.4%
Banking Business ratios2018 2017
ROAA6 3.2% 3.2%ROAE6 26.1% 25.2%Net interest margin 6.5% 7.3%Loan yield 13.5% 14.2%Liquid assets yield 3.8% 3.4%Cost of funds 5.0% 4.7%Cost of client deposits and notes 3.5% 3.5%Cost of amounts due to credit institutions 7.3% 6.4%Cost of debt securities issued 7.8% 7.4%Cost to income ratio 36.7% 37.7%NPLs to gross loans to clients 3.3% 3.8%NPL coverage ratio 90.5% 92.7%NPL coverage ratio, adjusted for discounted value of collateral 129.9% 130.6%Cost of credit risk ratio 1.6% 2.2%NBG (Basel III) Tier I capital adequacy ratio 12.2% 12.4%NBG (Basel III) Total capital adequacy ratio 16.6% 17.9%
Results highlights
• Strong performance. Profit before non-recurring items and income tax totalled GEL 492.6 million during 2018 (up 23.0% y-o-y), with profitability remaining high at 26.1% 7 in 2018 (up 90bps y-o-y).
• Strong capital position. Basel III Tier 1 and Total Capital Adequacy ratios stood at 12.2% and 16.6%, respectively, as at 31 December 2018, both above the minimum required level of 11.4% and 15.9%, respectively. At the same time Common Equity Tier 1 (CET1) ratio stood at 12.2% compared to a 9.5% minimum requirement at 31 December 2018 and already above the estimated fully-loaded CET1 requirement for 2021.
• Solid asset quality. NPLs to gross loans ratio was 3.3% at 31 December 2018 (down from 3.8% at 31 December 2017). NPL coverage ratio was 90.5% at 31 December 2018 (92.7% at 31 December 2017), while the NPL coverage ratio adjusted for discounted value of collateral was 129.9% at 31 December 2018 (130.6% at 31 December 2017). The cost of credit risk ratio improved significantly to 1.6% in 2018 (down from 2.2% in 2017).
• The loan book growth reached 21.4% y-o-y at 31 December 2018. Growth on a constant-currency basis was 19.0% y-o-y. Retail Banking loan book share in the total loan portfolio was 69.8% at 31 December 2018 (68.0% at 31 December 2017).
• Retail Banking (“RB”) continued to deliver solid growth across its business lines. RB revenue reached GEL 723.5 million in 2018, up 17.7% y-o-y. The Retail Banking net loan book reached GEL 6,267.1 million at 31 December 2018, up 24.2% y-o-y. The growth was predominantly driven by mortgage and micro and SME lending as a result of the Bank’s concentrated effort to grow these businesses following recent regulatory changes on unsecured consumer lending. The number of RB clients reached 2.4 million at 31 December 2018, up 5.4% y-o-y. At the same time, RB client deposits increased to GEL 4,338.7 million at 31 December 2018, up 32.8% y-o-y.
• Corporate Investment Banking (“CIB”) demonstrated further solid growth in 2018 after delivering on its risk de-concentration and loan portfolio repositioning targets in 2017. CIB’s net loan book reached GEL 2,618.5 million at 31 December 2018, up 15.9% y-o-y. The growth on a constant-currency basis was 12.9% y-o-y. The top ten CIB client concentration was 9.8% at the end of 4Q18 (10.7% at 31 December 2017).
• Assets Under Management (“AUM”) within the Group’s Investment Management business increased to GEL 2,271.5 million as of 31 December 2018, up 22.3% y-o-y, reflecting an increase in client assets and bond issuances at Galt & Taggart, our brokerage subsidiary.
• De-dollarisation of the loan book and client deposits. Loan book in local currency accounted for 38.3% of the total book at 31 December 2018, compared to 38.3% a year ago. Client deposits in local currency represented 32.5% of the total deposit portfolio at 31 December 2018, compared to 30.5% at 31 December 2017.
• Remote channels. We have actively continued the further development of our digital channels by introducing new features to both our mobile banking application and our internet bank. At the same time, we are introducing dedicated digital spaces in our branches to increase client penetration and incentivise offloading client activity to digital channels. As a result, the number of active internet and mobile banking users in December 2018 reached 295,226 (up 34.5% y-o-y) and 333,698 (up 88.3% y-o-y), respectively. Both the number and volume of transactions through our mobile and internet banking continued to expand at 69.0% and 91.1% y-o-y, respectively, in 2018. In total, c.78% of daily banking transactions were executed through remote channels in 2018.
• Bank of Georgia became the first bank to launch the innovative payment mechanism “QR PAY”. In 4Q18, BOG introduced a new payment method QR PAY to the local small business market, an alternative payment mechanism to the traditional point of sale terminal for small Georgian businesses that previously relied on cash transactions as a means for their customers to settle payments. For customers who use Bank of Georgia’s mobile bank and a debit or credit card, settling payments with QR PAY is simple, safe and user-friendly. Currently, there are around 800 small businesses connected to QR PAY.
• In 4Q18, in order to extend the scale of its payment system, BOG was licensed to offer its services to JCB cards users through its terminals and ATMs. This inclusion of JCB cards in the Bank’s payment services opens up access to around 117 million people from 190 countries. JCB is an international payment brand from Japan and given the increasing number of tourists from Asia in Georgia, the Bank is well equipped to offer them best-in-class service.
• The Banker publication named Bank of Georgia Bank of the Year 2018 in Central and Eastern Europe.
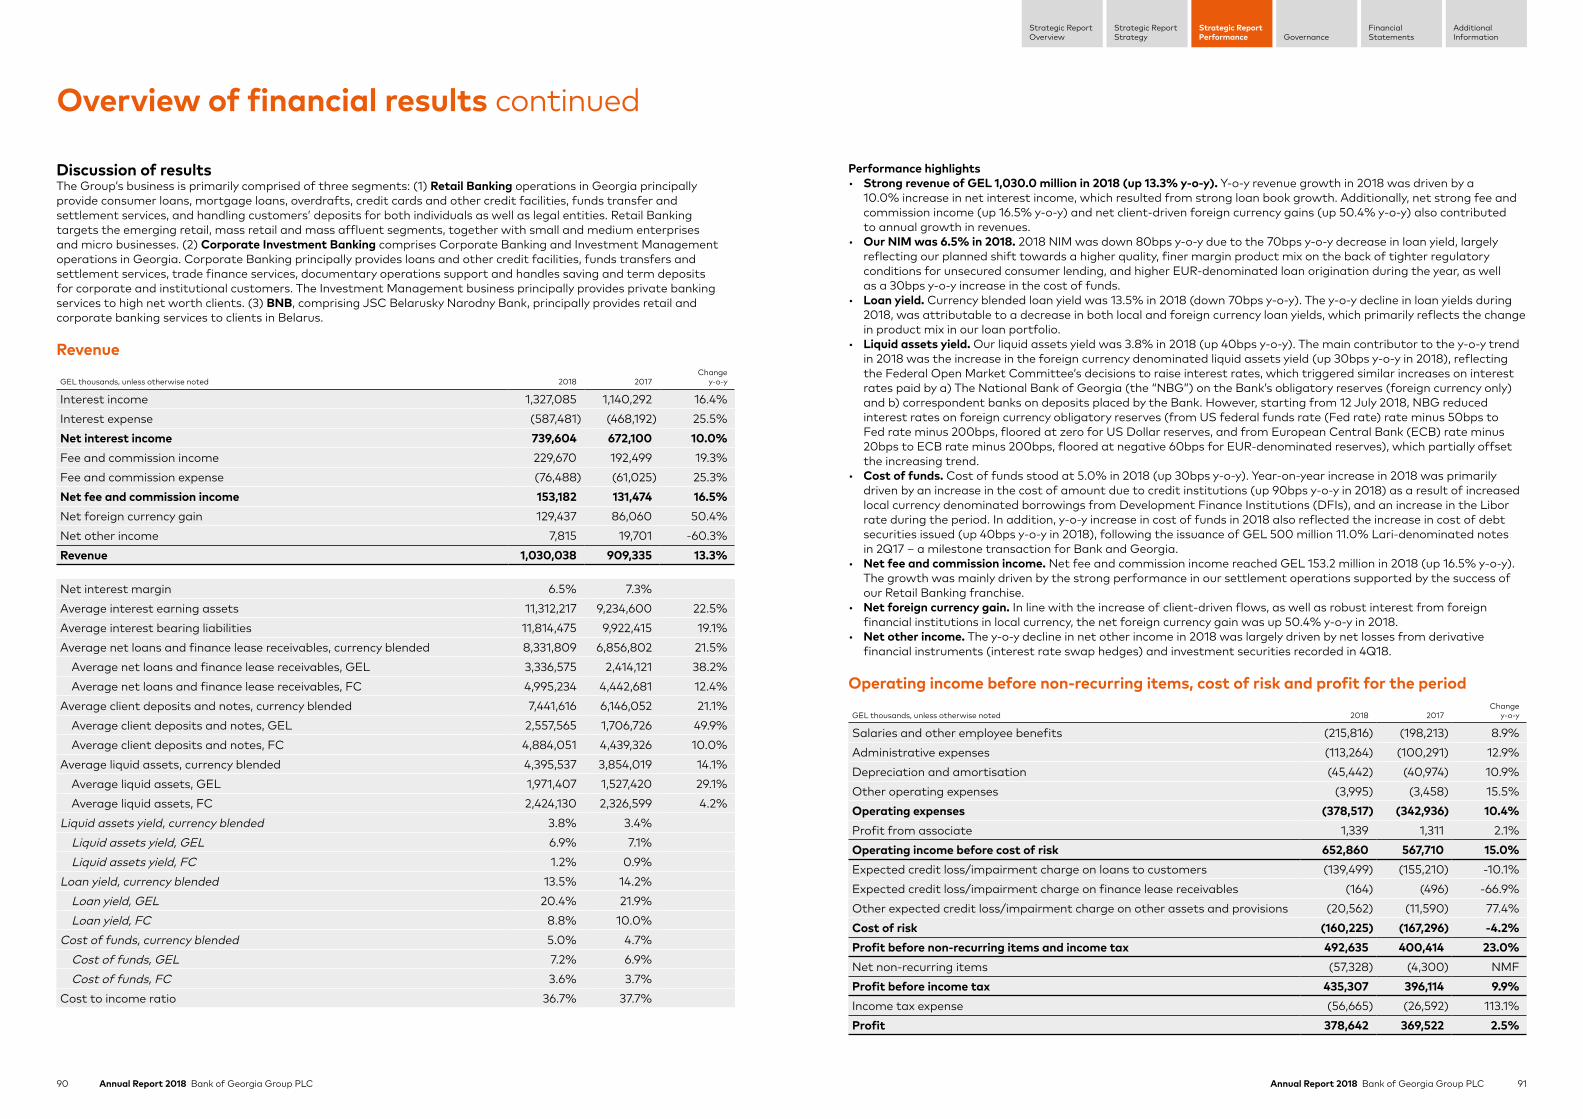
90 Annual Report 2018 Bank of Georgia Group PLC 91Annual Report 2018 Bank of Georgia Group PLC
Strategic ReportStrategy
Strategic ReportPerformance Governance
FinancialStatements
AdditionalInformation
Strategic ReportOverview
Overview of financial results continued
Discussion of resultsThe Group’s business is primarily comprised of three segments: (1) Retail Banking operations in Georgia principally provide consumer loans, mortgage loans, overdrafts, credit cards and other credit facilities, funds transfer and settlement services, and handling customers’ deposits for both individuals as well as legal entities. Retail Banking targets the emerging retail, mass retail and mass affluent segments, together with small and medium enterprises and micro businesses. (2) Corporate Investment Banking comprises Corporate Banking and Investment Management operations in Georgia. Corporate Banking principally provides loans and other credit facilities, funds transfers and settlement services, trade finance services, documentary operations support and handles saving and term deposits for corporate and institutional customers. The Investment Management business principally provides private banking services to high net worth clients. (3) BNB, comprising JSC Belarusky Narodny Bank, principally provides retail and corporate banking services to clients in Belarus.
Revenue
GEL thousands, unless otherwise noted 2018 2017Change
y-o-y
Interest income 1,327,085 1,140,292 16.4%Interest expense (587,481) (468,192) 25.5%Net interest income 739,604 672,100 10.0%Fee and commission income 229,670 192,499 19.3%Fee and commission expense (76,488) (61,025) 25.3%Net fee and commission income 153,182 131,474 16.5%Net foreign currency gain 129,437 86,060 50.4%Net other income 7,815 19,701 -60.3%Revenue 1,030,038 909,335 13.3%
Net interest margin 6.5% 7.3%Average interest earning assets 11,312,217 9,234,600 22.5%Average interest bearing liabilities 11,814,475 9,922,415 19.1%Average net loans and finance lease receivables, currency blended 8,331,809 6,856,802 21.5%
Average net loans and finance lease receivables, GEL 3,336,575 2,414,121 38.2%Average net loans and finance lease receivables, FC 4,995,234 4,442,681 12.4%
Average client deposits and notes, currency blended 7,441,616 6,146,052 21.1%Average client deposits and notes, GEL 2,557,565 1,706,726 49.9%Average client deposits and notes, FC 4,884,051 4,439,326 10.0%
Average liquid assets, currency blended 4,395,537 3,854,019 14.1%Average liquid assets, GEL 1,971,407 1,527,420 29.1%Average liquid assets, FC 2,424,130 2,326,599 4.2%
Liquid assets yield, currency blended 3.8% 3.4%Liquid assets yield, GEL 6.9% 7.1%Liquid assets yield, FC 1.2% 0.9%
Loan yield, currency blended 13.5% 14.2%Loan yield, GEL 20.4% 21.9%Loan yield, FC 8.8% 10.0%
Cost of funds, currency blended 5.0% 4.7%Cost of funds, GEL 7.2% 6.9%Cost of funds, FC 3.6% 3.7%
Cost to income ratio 36.7% 37.7%
Performance highlights• Strong revenue of GEL 1,030.0 million in 2018 (up 13.3% y-o-y). Y-o-y revenue growth in 2018 was driven by a
10.0% increase in net interest income, which resulted from strong loan book growth. Additionally, net strong fee and commission income (up 16.5% y-o-y) and net client-driven foreign currency gains (up 50.4% y-o-y) also contributed to annual growth in revenues.
• Our NIM was 6.5% in 2018. 2018 NIM was down 80bps y-o-y due to the 70bps y-o-y decrease in loan yield, largely reflecting our planned shift towards a higher quality, finer margin product mix on the back of tighter regulatory conditions for unsecured consumer lending, and higher EUR-denominated loan origination during the year, as well as a 30bps y-o-y increase in the cost of funds.
• Loan yield. Currency blended loan yield was 13.5% in 2018 (down 70bps y-o-y). The y-o-y decline in loan yields during 2018, was attributable to a decrease in both local and foreign currency loan yields, which primarily reflects the change in product mix in our loan portfolio.
• Liquid assets yield. Our liquid assets yield was 3.8% in 2018 (up 40bps y-o-y). The main contributor to the y-o-y trend in 2018 was the increase in the foreign currency denominated liquid assets yield (up 30bps y-o-y in 2018), reflecting the Federal Open Market Committee’s decisions to raise interest rates, which triggered similar increases on interest rates paid by a) The National Bank of Georgia (the “NBG”) on the Bank’s obligatory reserves (foreign currency only) and b) correspondent banks on deposits placed by the Bank. However, starting from 12 July 2018, NBG reduced interest rates on foreign currency obligatory reserves (from US federal funds rate (Fed rate) rate minus 50bps to Fed rate minus 200bps, floored at zero for US Dollar reserves, and from European Central Bank (ECB) rate minus 20bps to ECB rate minus 200bps, floored at negative 60bps for EUR-denominated reserves), which partially offset the increasing trend.
• Cost of funds. Cost of funds stood at 5.0% in 2018 (up 30bps y-o-y). Year-on-year increase in 2018 was primarily driven by an increase in the cost of amount due to credit institutions (up 90bps y-o-y in 2018) as a result of increased local currency denominated borrowings from Development Finance Institutions (DFIs), and an increase in the Libor rate during the period. In addition, y-o-y increase in cost of funds in 2018 also reflected the increase in cost of debt securities issued (up 40bps y-o-y in 2018), following the issuance of GEL 500 million 11.0% Lari-denominated notes in 2Q17 – a milestone transaction for Bank and Georgia.
• Net fee and commission income. Net fee and commission income reached GEL 153.2 million in 2018 (up 16.5% y-o-y). The growth was mainly driven by the strong performance in our settlement operations supported by the success of our Retail Banking franchise.
• Net foreign currency gain. In line with the increase of client-driven flows, as well as robust interest from foreign financial institutions in local currency, the net foreign currency gain was up 50.4% y-o-y in 2018.
• Net other income. The y-o-y decline in net other income in 2018 was largely driven by net losses from derivative financial instruments (interest rate swap hedges) and investment securities recorded in 4Q18.
Operating income before non-recurring items, cost of risk and profit for the period
GEL thousands, unless otherwise noted 2018 2017Change
y-o-y
Salaries and other employee benefits (215,816) (198,213) 8.9%Administrative expenses (113,264) (100,291) 12.9%Depreciation and amortisation (45,442) (40,974) 10.9%Other operating expenses (3,995) (3,458) 15.5%Operating expenses (378,517) (342,936) 10.4%Profit from associate 1,339 1,311 2.1%Operating income before cost of risk 652,860 567,710 15.0%Expected credit loss/impairment charge on loans to customers (139,499) (155,210) -10.1%Expected credit loss/impairment charge on finance lease receivables (164) (496) -66.9%Other expected credit loss/impairment charge on other assets and provisions (20,562) (11,590) 77.4%Cost of risk (160,225) (167,296) -4.2%Profit before non-recurring items and income tax 492,635 400,414 23.0%Net non-recurring items (57,328) (4,300) NMFProfit before income tax 435,307 396,114 9.9%Income tax expense (56,665) (26,592) 113.1%Profit 378,642 369,522 2.5%
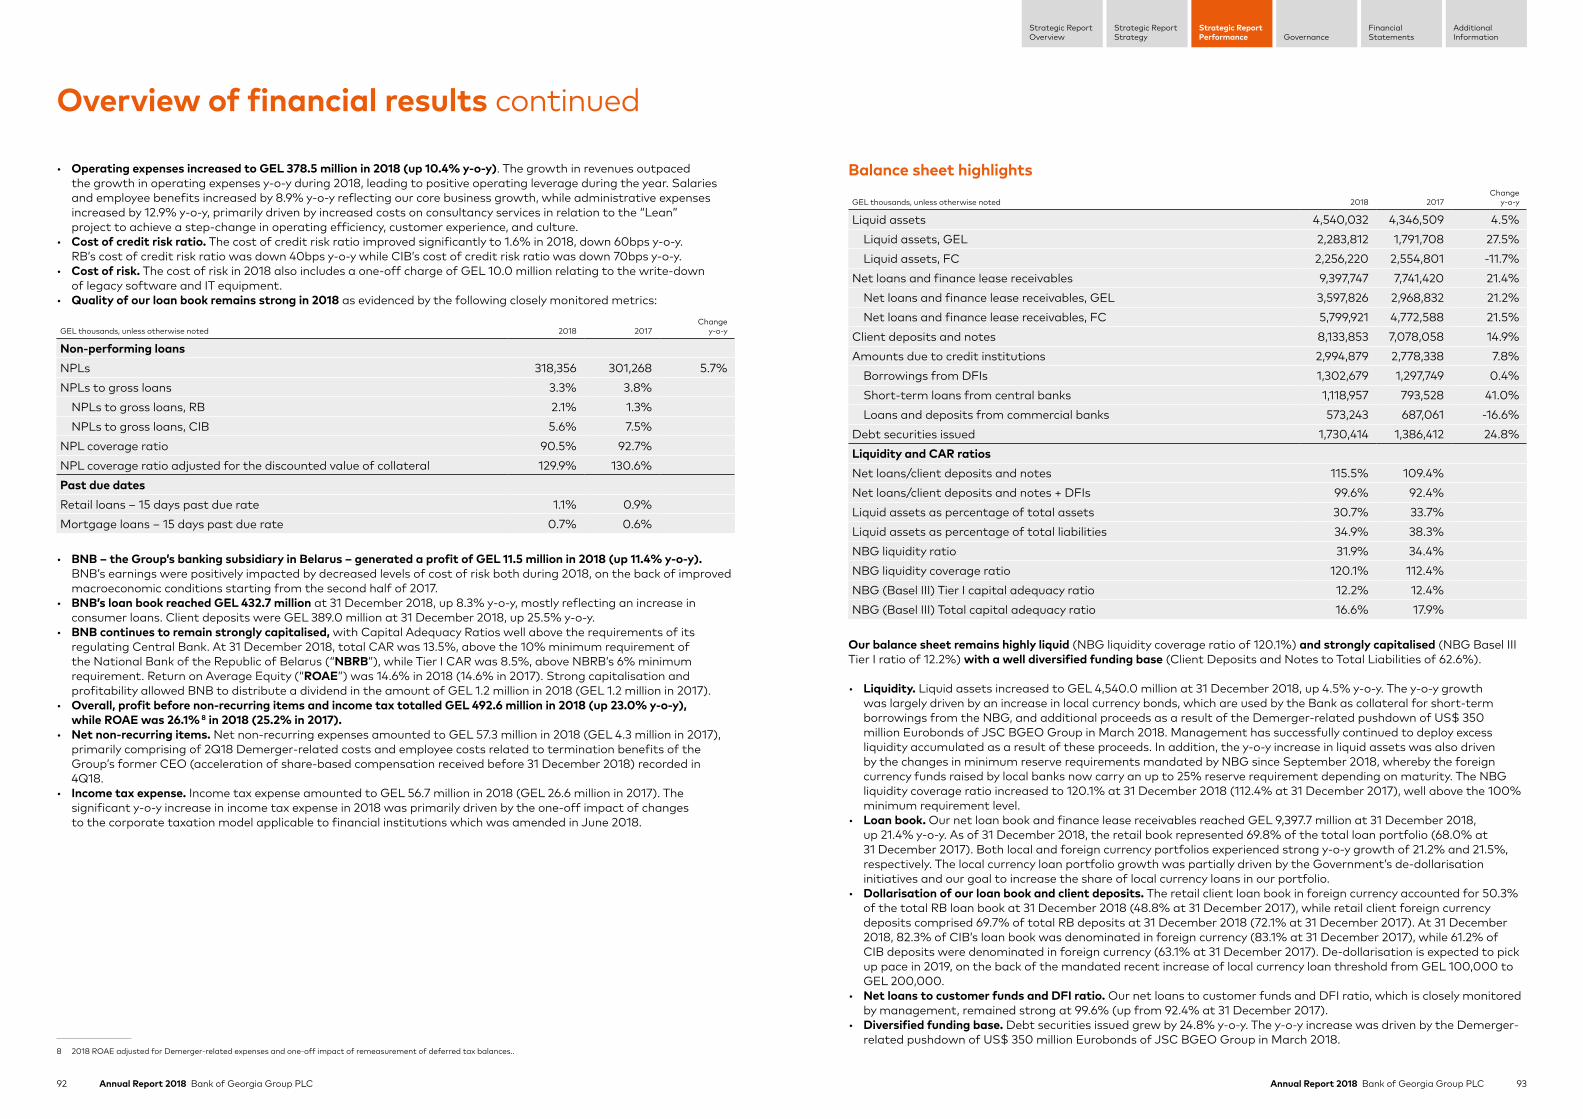
92 Annual Report 2018 Bank of Georgia Group PLC 93Annual Report 2018 Bank of Georgia Group PLC
Strategic ReportStrategy
Strategic ReportPerformance Governance
FinancialStatements
AdditionalInformation
Strategic ReportOverview
Overview of financial results continued
• Operating expenses increased to GEL 378.5 million in 2018 (up 10.4% y-o-y). The growth in revenues outpaced the growth in operating expenses y-o-y during 2018, leading to positive operating leverage during the year. Salaries and employee benefits increased by 8.9% y-o-y reflecting our core business growth, while administrative expenses increased by 12.9% y-o-y, primarily driven by increased costs on consultancy services in relation to the “Lean” project to achieve a step-change in operating efficiency, customer experience, and culture.
• Cost of credit risk ratio. The cost of credit risk ratio improved significantly to 1.6% in 2018, down 60bps y-o-y. RB’s cost of credit risk ratio was down 40bps y-o-y while CIB’s cost of credit risk ratio was down 70bps y-o-y.
• Cost of risk. The cost of risk in 2018 also includes a one-off charge of GEL 10.0 million relating to the write-down of legacy software and IT equipment.
• Quality of our loan book remains strong in 2018 as evidenced by the following closely monitored metrics:
GEL thousands, unless otherwise noted 2018 2017Change
y-o-y
Non-performing loansNPLs 318,356 301,268 5.7%NPLs to gross loans 3.3% 3.8%
NPLs to gross loans, RB 2.1% 1.3%NPLs to gross loans, CIB 5.6% 7.5%
NPL coverage ratio 90.5% 92.7%NPL coverage ratio adjusted for the discounted value of collateral 129.9% 130.6%Past due datesRetail loans – 15 days past due rate 1.1% 0.9%Mortgage loans – 15 days past due rate 0.7% 0.6%
• BNB – the Group’s banking subsidiary in Belarus – generated a profit of GEL 11.5 million in 2018 (up 11.4% y-o-y). BNB’s earnings were positively impacted by decreased levels of cost of risk both during 2018, on the back of improved macroeconomic conditions starting from the second half of 2017.
• BNB’s loan book reached GEL 432.7 million at 31 December 2018, up 8.3% y-o-y, mostly reflecting an increase in consumer loans. Client deposits were GEL 389.0 million at 31 December 2018, up 25.5% y-o-y.
• BNB continues to remain strongly capitalised, with Capital Adequacy Ratios well above the requirements of its regulating Central Bank. At 31 December 2018, total CAR was 13.5%, above the 10% minimum requirement of the National Bank of the Republic of Belarus (“NBRB”), while Tier I CAR was 8.5%, above NBRB’s 6% minimum requirement. Return on Average Equity (“ROAE”) was 14.6% in 2018 (14.6% in 2017). Strong capitalisation and profitability allowed BNB to distribute a dividend in the amount of GEL 1.2 million in 2018 (GEL 1.2 million in 2017).
• Overall, profit before non-recurring items and income tax totalled GEL 492.6 million in 2018 (up 23.0% y-o-y), while ROAE was 26.1% 8 in 2018 (25.2% in 2017).
• Net non-recurring items. Net non-recurring expenses amounted to GEL 57.3 million in 2018 (GEL 4.3 million in 2017), primarily comprising of 2Q18 Demerger-related costs and employee costs related to termination benefits of the Group’s former CEO (acceleration of share-based compensation received before 31 December 2018) recorded in 4Q18.
• Income tax expense. Income tax expense amounted to GEL 56.7 million in 2018 (GEL 26.6 million in 2017). The significant y-o-y increase in income tax expense in 2018 was primarily driven by the one-off impact of changes to the corporate taxation model applicable to financial institutions which was amended in June 2018.
Balance sheet highlights
GEL thousands, unless otherwise noted 2018 2017Change
y-o-y
Liquid assets 4,540,032 4,346,509 4.5%Liquid assets, GEL 2,283,812 1,791,708 27.5%Liquid assets, FC 2,256,220 2,554,801 -11.7%
Net loans and finance lease receivables 9,397,747 7,741,420 21.4%Net loans and finance lease receivables, GEL 3,597,826 2,968,832 21.2%Net loans and finance lease receivables, FC 5,799,921 4,772,588 21.5%
Client deposits and notes 8,133,853 7,078,058 14.9%Amounts due to credit institutions 2,994,879 2,778,338 7.8%
Borrowings from DFIs 1,302,679 1,297,749 0.4%Short-term loans from central banks 1,118,957 793,528 41.0%Loans and deposits from commercial banks 573,243 687,061 -16.6%
Debt securities issued 1,730,414 1,386,412 24.8%Liquidity and CAR ratiosNet loans/client deposits and notes 115.5% 109.4%Net loans/client deposits and notes + DFIs 99.6% 92.4%Liquid assets as percentage of total assets 30.7% 33.7%Liquid assets as percentage of total liabilities 34.9% 38.3%NBG liquidity ratio 31.9% 34.4%NBG liquidity coverage ratio 120.1% 112.4%NBG (Basel III) Tier I capital adequacy ratio 12.2% 12.4%NBG (Basel III) Total capital adequacy ratio 16.6% 17.9%
Our balance sheet remains highly liquid (NBG liquidity coverage ratio of 120.1%) and strongly capitalised (NBG Basel III Tier I ratio of 12.2%) with a well diversified funding base (Client Deposits and Notes to Total Liabilities of 62.6%).
• Liquidity. Liquid assets increased to GEL 4,540.0 million at 31 December 2018, up 4.5% y-o-y. The y-o-y growth was largely driven by an increase in local currency bonds, which are used by the Bank as collateral for short-term borrowings from the NBG, and additional proceeds as a result of the Demerger-related pushdown of US$ 350 million Eurobonds of JSC BGEO Group in March 2018. Management has successfully continued to deploy excess liquidity accumulated as a result of these proceeds. In addition, the y-o-y increase in liquid assets was also driven by the changes in minimum reserve requirements mandated by NBG since September 2018, whereby the foreign currency funds raised by local banks now carry an up to 25% reserve requirement depending on maturity. The NBG liquidity coverage ratio increased to 120.1% at 31 December 2018 (112.4% at 31 December 2017), well above the 100% minimum requirement level.
• Loan book. Our net loan book and finance lease receivables reached GEL 9,397.7 million at 31 December 2018, up 21.4% y-o-y. As of 31 December 2018, the retail book represented 69.8% of the total loan portfolio (68.0% at 31 December 2017). Both local and foreign currency portfolios experienced strong y-o-y growth of 21.2% and 21.5%, respectively. The local currency loan portfolio growth was partially driven by the Government’s de-dollarisation initiatives and our goal to increase the share of local currency loans in our portfolio.
• Dollarisation of our loan book and client deposits. The retail client loan book in foreign currency accounted for 50.3% of the total RB loan book at 31 December 2018 (48.8% at 31 December 2017), while retail client foreign currency deposits comprised 69.7% of total RB deposits at 31 December 2018 (72.1% at 31 December 2017). At 31 December 2018, 82.3% of CIB’s loan book was denominated in foreign currency (83.1% at 31 December 2017), while 61.2% of CIB deposits were denominated in foreign currency (63.1% at 31 December 2017). De-dollarisation is expected to pick up pace in 2019, on the back of the mandated recent increase of local currency loan threshold from GEL 100,000 to GEL 200,000.
• Net loans to customer funds and DFI ratio. Our net loans to customer funds and DFI ratio, which is closely monitored by management, remained strong at 99.6% (up from 92.4% at 31 December 2017).
• Diversified funding base. Debt securities issued grew by 24.8% y-o-y. The y-o-y increase was driven by the Demerger-related pushdown of US$ 350 million Eurobonds of JSC BGEO Group in March 2018.
8 2018 ROAE adjusted for Demerger-related expenses and one-off impact of remeasurement of deferred tax balances..
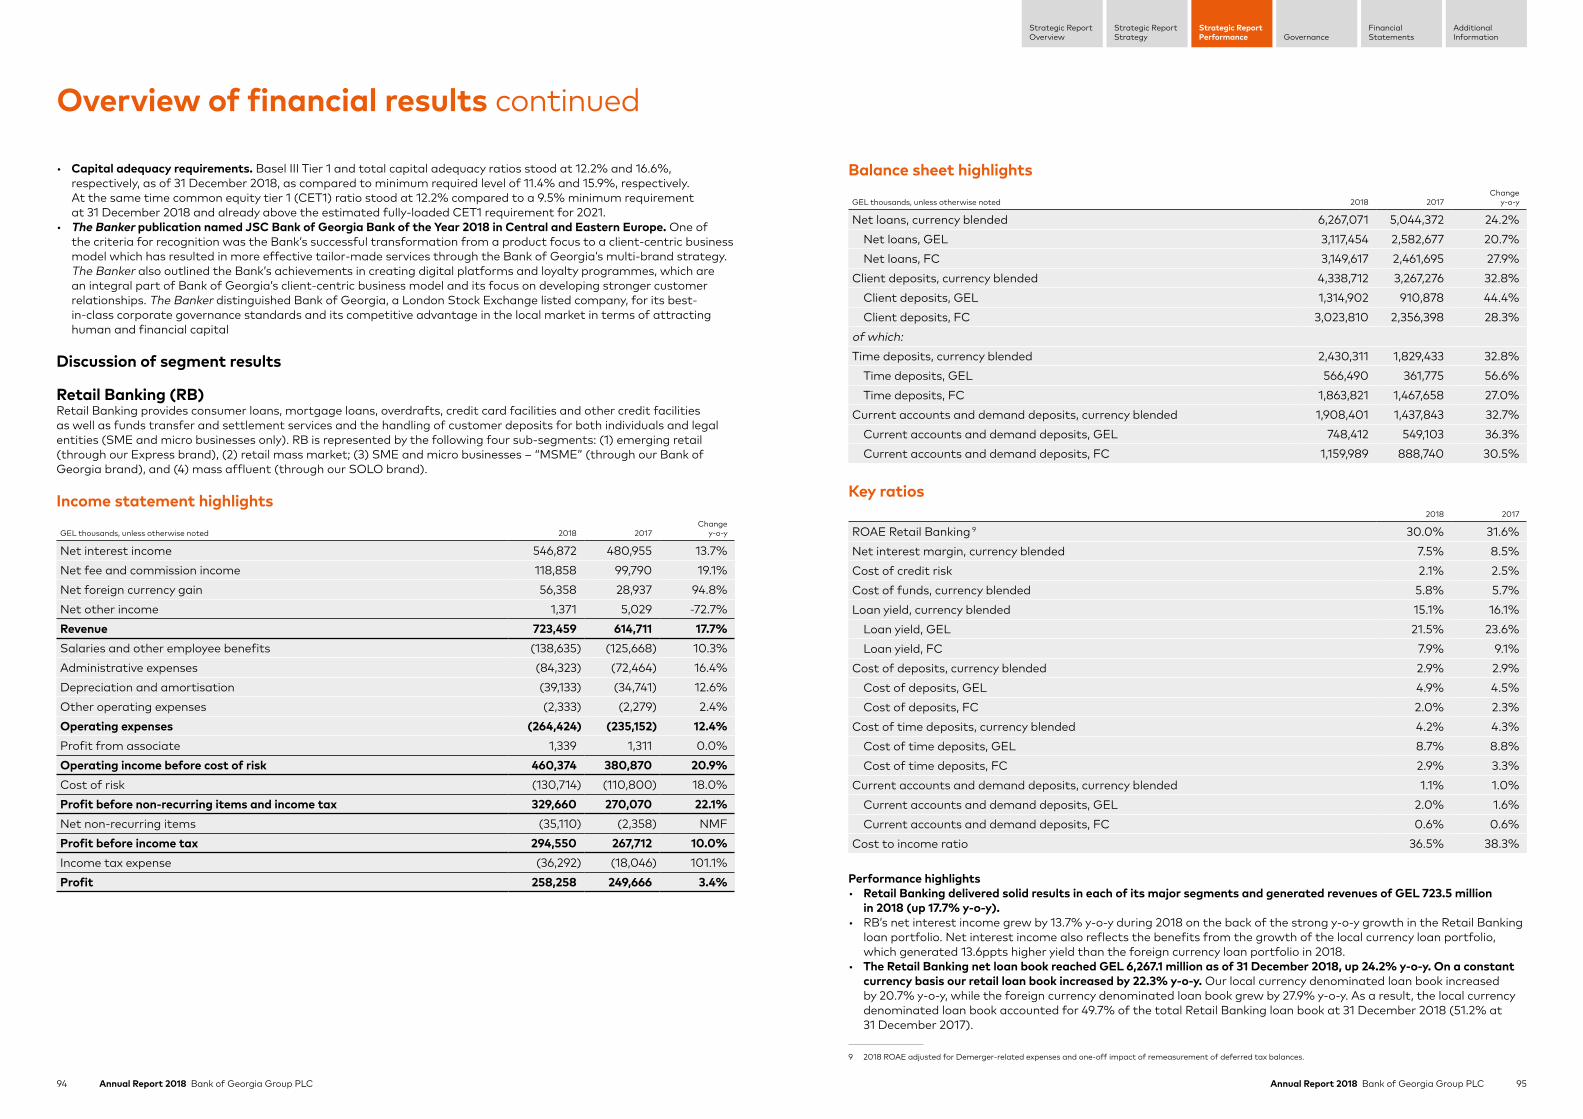
94 Annual Report 2018 Bank of Georgia Group PLC 95Annual Report 2018 Bank of Georgia Group PLC
Strategic ReportStrategy
Strategic ReportPerformance Governance
FinancialStatements
AdditionalInformation
Strategic ReportOverview
Overview of financial results continued
• Capital adequacy requirements. Basel III Tier 1 and total capital adequacy ratios stood at 12.2% and 16.6%, respectively, as of 31 December 2018, as compared to minimum required level of 11.4% and 15.9%, respectively. At the same time common equity tier 1 (CET1) ratio stood at 12.2% compared to a 9.5% minimum requirement at 31 December 2018 and already above the estimated fully-loaded CET1 requirement for 2021.
• The Banker publication named JSC Bank of Georgia Bank of the Year 2018 in Central and Eastern Europe. One of the criteria for recognition was the Bank’s successful transformation from a product focus to a client-centric business model which has resulted in more effective tailor-made services through the Bank of Georgia’s multi-brand strategy. The Banker also outlined the Bank’s achievements in creating digital platforms and loyalty programmes, which are an integral part of Bank of Georgia’s client-centric business model and its focus on developing stronger customer relationships. The Banker distinguished Bank of Georgia, a London Stock Exchange listed company, for its best-in-class corporate governance standards and its competitive advantage in the local market in terms of attracting human and financial capital
Discussion of segment results
Retail Banking (RB)Retail Banking provides consumer loans, mortgage loans, overdrafts, credit card facilities and other credit facilities as well as funds transfer and settlement services and the handling of customer deposits for both individuals and legal entities (SME and micro businesses only). RB is represented by the following four sub-segments: (1) emerging retail (through our Express brand), (2) retail mass market; (3) SME and micro businesses – “MSME” (through our Bank of Georgia brand), and (4) mass affluent (through our SOLO brand).
Income statement highlights
GEL thousands, unless otherwise noted 2018 2017Change
y-o-y
Net interest income 546,872 480,955 13.7%Net fee and commission income 118,858 99,790 19.1%Net foreign currency gain 56,358 28,937 94.8%Net other income 1,371 5,029 -72.7%Revenue 723,459 614,711 17.7%Salaries and other employee benefits (138,635) (125,668) 10.3%Administrative expenses (84,323) (72,464) 16.4%Depreciation and amortisation (39,133) (34,741) 12.6%Other operating expenses (2,333) (2,279) 2.4%Operating expenses (264,424) (235,152) 12.4%Profit from associate 1,339 1,311 0.0%Operating income before cost of risk 460,374 380,870 20.9%Cost of risk (130,714) (110,800) 18.0%Profit before non-recurring items and income tax 329,660 270,070 22.1%Net non-recurring items (35,110) (2,358) NMFProfit before income tax 294,550 267,712 10.0%Income tax expense (36,292) (18,046) 101.1%Profit 258,258 249,666 3.4%
Balance sheet highlights
GEL thousands, unless otherwise noted 2018 2017Change
y-o-y
Net loans, currency blended 6,267,071 5,044,372 24.2%Net loans, GEL 3,117,454 2,582,677 20.7%Net loans, FC 3,149,617 2,461,695 27.9%
Client deposits, currency blended 4,338,712 3,267,276 32.8%Client deposits, GEL 1,314,902 910,878 44.4%Client deposits, FC 3,023,810 2,356,398 28.3%
of which:Time deposits, currency blended 2,430,311 1,829,433 32.8%
Time deposits, GEL 566,490 361,775 56.6%Time deposits, FC 1,863,821 1,467,658 27.0%
Current accounts and demand deposits, currency blended 1,908,401 1,437,843 32.7%Current accounts and demand deposits, GEL 748,412 549,103 36.3%Current accounts and demand deposits, FC 1,159,989 888,740 30.5%
Key ratios
2018 2017
ROAE Retail Banking 9 30.0% 31.6%Net interest margin, currency blended 7.5% 8.5%Cost of credit risk 2.1% 2.5%Cost of funds, currency blended 5.8% 5.7%Loan yield, currency blended 15.1% 16.1%
Loan yield, GEL 21.5% 23.6%Loan yield, FC 7.9% 9.1%
Cost of deposits, currency blended 2.9% 2.9%Cost of deposits, GEL 4.9% 4.5%Cost of deposits, FC 2.0% 2.3%
Cost of time deposits, currency blended 4.2% 4.3%Cost of time deposits, GEL 8.7% 8.8%Cost of time deposits, FC 2.9% 3.3%
Current accounts and demand deposits, currency blended 1.1% 1.0%Current accounts and demand deposits, GEL 2.0% 1.6%Current accounts and demand deposits, FC 0.6% 0.6%
Cost to income ratio 36.5% 38.3%
Performance highlights• Retail Banking delivered solid results in each of its major segments and generated revenues of GEL 723.5 million
in 2018 (up 17.7% y-o-y). • RB’s net interest income grew by 13.7% y-o-y during 2018 on the back of the strong y-o-y growth in the Retail Banking
loan portfolio. Net interest income also reflects the benefits from the growth of the local currency loan portfolio, which generated 13.6ppts higher yield than the foreign currency loan portfolio in 2018.
• The Retail Banking net loan book reached GEL 6,267.1 million as of 31 December 2018, up 24.2% y-o-y. On a constant currency basis our retail loan book increased by 22.3% y-o-y. Our local currency denominated loan book increased by 20.7% y-o-y, while the foreign currency denominated loan book grew by 27.9% y-o-y. As a result, the local currency denominated loan book accounted for 49.7% of the total Retail Banking loan book at 31 December 2018 (51.2% at 31 December 2017).
9 2018 ROAE adjusted for Demerger-related expenses and one-off impact of remeasurement of deferred tax balances.

96 Annual Report 2018 Bank of Georgia Group PLC 97Annual Report 2018 Bank of Georgia Group PLC
Strategic ReportStrategy
Strategic ReportPerformance Governance
FinancialStatements
AdditionalInformation
Strategic ReportOverview
Overview of financial results continued
• The y-o-y loan book growth reflected continued strong loan origination levels delivered across the mortgage and MSME segments. The trend reflects the shift towards a higher quality, finer margin product mix on the back of tighter lending conditions for unsecured consumer lending:
Retail Banking loan book by products
GEL thousands, unless otherwise noted 2018 2017Change
y-o-y
Loan originationsConsumer loans 1,381.6 1,383.6 -0.2%Mortgage loans 1,725.9 1,062.5 62.4%Micro loans 1,066.3 1,017.6 4.8%SME loans 660.2 593.7 11.2%POS loans 119.0 243.8 -51.2%Outstanding balanceConsumer loans 1,379.7 1,242.0 11.1%Mortgage loans 2,539.3 1,706.1 48.8%Micro loans 1,246.3 1,030.8 20.9%SME loans 758.7 606.5 25.1%POS loans 58.6 130.8 -55.2%
• Retail Banking client deposits increased to GEL 4,338.7 million, up 32.8% y-o-y. The dollarisation level of our deposits decreased to 69.7% at 31 December 2018 from 72.1% at 31 December 2017. The cost of foreign currency denominated deposits decreased by 30bps y-o-y in 2018. The cost of local currency denominated deposits, on the contrary, increased by 40bps y-o-y in 2018. The spread between the cost of RB’s client deposits in GEL and foreign currency widened 2.9 ppts in 2018 (GEL: 4.9%; FC: 2.0%) compared to 2.2 ppts in 2017 (GEL: 4.5%; FC: 2.3%).
• Retail Banking NIM was 7.5% in 2018 (down 100bps y-o-y). The decline in NIM was attributable to lower loan yields, reflecting the significant growth in the mortgage portfolio during 2018. The 100bps y-o-y decrease in loan yields in 2018 was mainly driven by the change in the Retail Banking loan portfolio product mix, with the lower yield-lower risk products share increasing in total RB loan portfolio. Furthermore, the cost of funds increased by 10bps y-o-y in 2018.
• Strong growth in Retail Banking net fee and commission income. The strong growth in net fee and commission income during all reported periods was driven by an increase in settlement operations and the strong underlying growth in our Solo and MSME segments.
• RB asset quality improved in 2018 further reflecting tighter conditions for unsecured consumer lending post regulatory changes in May 2018, which primarily affected the high-yield express and micro loans as expected. Our increasing focus on lending in the mortgage segment and to finer margin SME clients has led to a product mix shift, and improvement in our asset quality metrics. RB’s cost of credit risk ratio improved to 2.1% in 2018 (down from 2.5% in 2017).
Retail Banking performance indicatorsOur Retail Banking business continues to deliver solid growth as we further develop our strategy towards continuous digitalisation, as demonstrated by the following performance indicators:
Volume information in GEL thousands 2018 2017Change
y-o-y
Retail Banking customersNumber of new customers 202,386 198,488 2.0%Number of customers 2,440,754 2,315,038 5.4%CardsNumber of cards issued 833,807 1,022,283 -18.4%Number of cards outstanding 2,177,273 2,227,000 -2.2%Express Pay terminalsNumber of Express Pay terminals 3,115 2,842 9.6%Number of transactions via Express Pay terminals 108,240,230 104,021,767 4.1%Volume of transactions via Express Pay terminals 6,741,247 4,748,036 42.0%POS terminalsNumber of desks 10,009 9,934 0.8%Number of contracted merchants 6,575 5,341 23.1%Number of POS terminals 14,220 13,291 7.0%Number of transactions via POS terminals 62,110,165 46,177,412 34.5%Volume of transactions via POS terminals 1,937,392 1,405,800 37.8%Internet bankingNumber of active users 295,226 219,496 34.5%Number of transactions via internet bank (iBank) 5,892,493 6,415,427 -8.2%Volume of transactions via internet bank (iBank) 2,029,599 1,402,969 44.7%Mobile bankingNumber of active users 333,698 177,243 88.3%Number of transactions via mobile bank (mBank) 15,676,447 6,348,533 146.9%Volume of transactions via mobile Bank (mBank) 1,961,108 685,470 186.1%
• Growth in the client base was due to the increased offering of cost-effective remote channels. The increase to 2,440,754 customers in 2018 (up 5.4% y-o-y) reflects the sustained growth in our client base over recent periods and was one of the drivers of the increase in our Retail Banking net fee and commission income.
• The number of outstanding cards decreased by 2.2% y-o-y in 2018 due to Express cards which have been declining in line with the recently introduced regulations on consumer lending. Excluding the Express cards, total number of cards outstanding at 31 December 2018 increased by 30.4% y-o-y. Loyalty programme Plus+ cards launched in July 2017 as part of RB’s client-centric approach, more than doubled y-o-y. We had 592,458 active Plus+ cards outstanding as at 31 December 2018.
• In November 2018, in order to extend the scale of its payment system, Bank of Georgia was licensed to offer its services to the JCB cards users through the Bank’s terminals and ATMs. Inclusion of JCB cards in Bank of Georgia’s payment services opens up access to around 117 million people from 190 countries. JCB is an international payment brand originating from Japan and given the increasing number of tourists from Asia in Georgia (visitors from Asia increased at an impressive CAGR of 56.3% over 2014-2018, reaching up to 8% of total international visitors in Georgia in 2018), Bank of Georgia is well equipped to offer them best-in-class services.
• Utilisation of Express Pay terminals continued to grow in 2018. The volume of transactions increased to GEL 6,741.2 million in 2018 (up 42.0% y-o-y). The number of transactions increased by 4.1% y-o-y in 2018. The fees charged to clients for transactions executed through Express Pay terminals amounted to GEL 22.0 million in 2018 (up 6.8% y-o-y).
• Digital penetration growth. For our mobile banking application, the number of transactions (up 146.9% y-o-y) and the volume of transactions (up 186.1% y-o-y) continue to show outstanding growth. The fully-transformed, user-friendly, multi-feature mobile banking application (mBank) continues to gain popularity. Since its launch on 29 May 2017, 595,541 downloads have been made by the Bank’s customers. During the same period approximately 19.3 million online transactions were performed using the application.
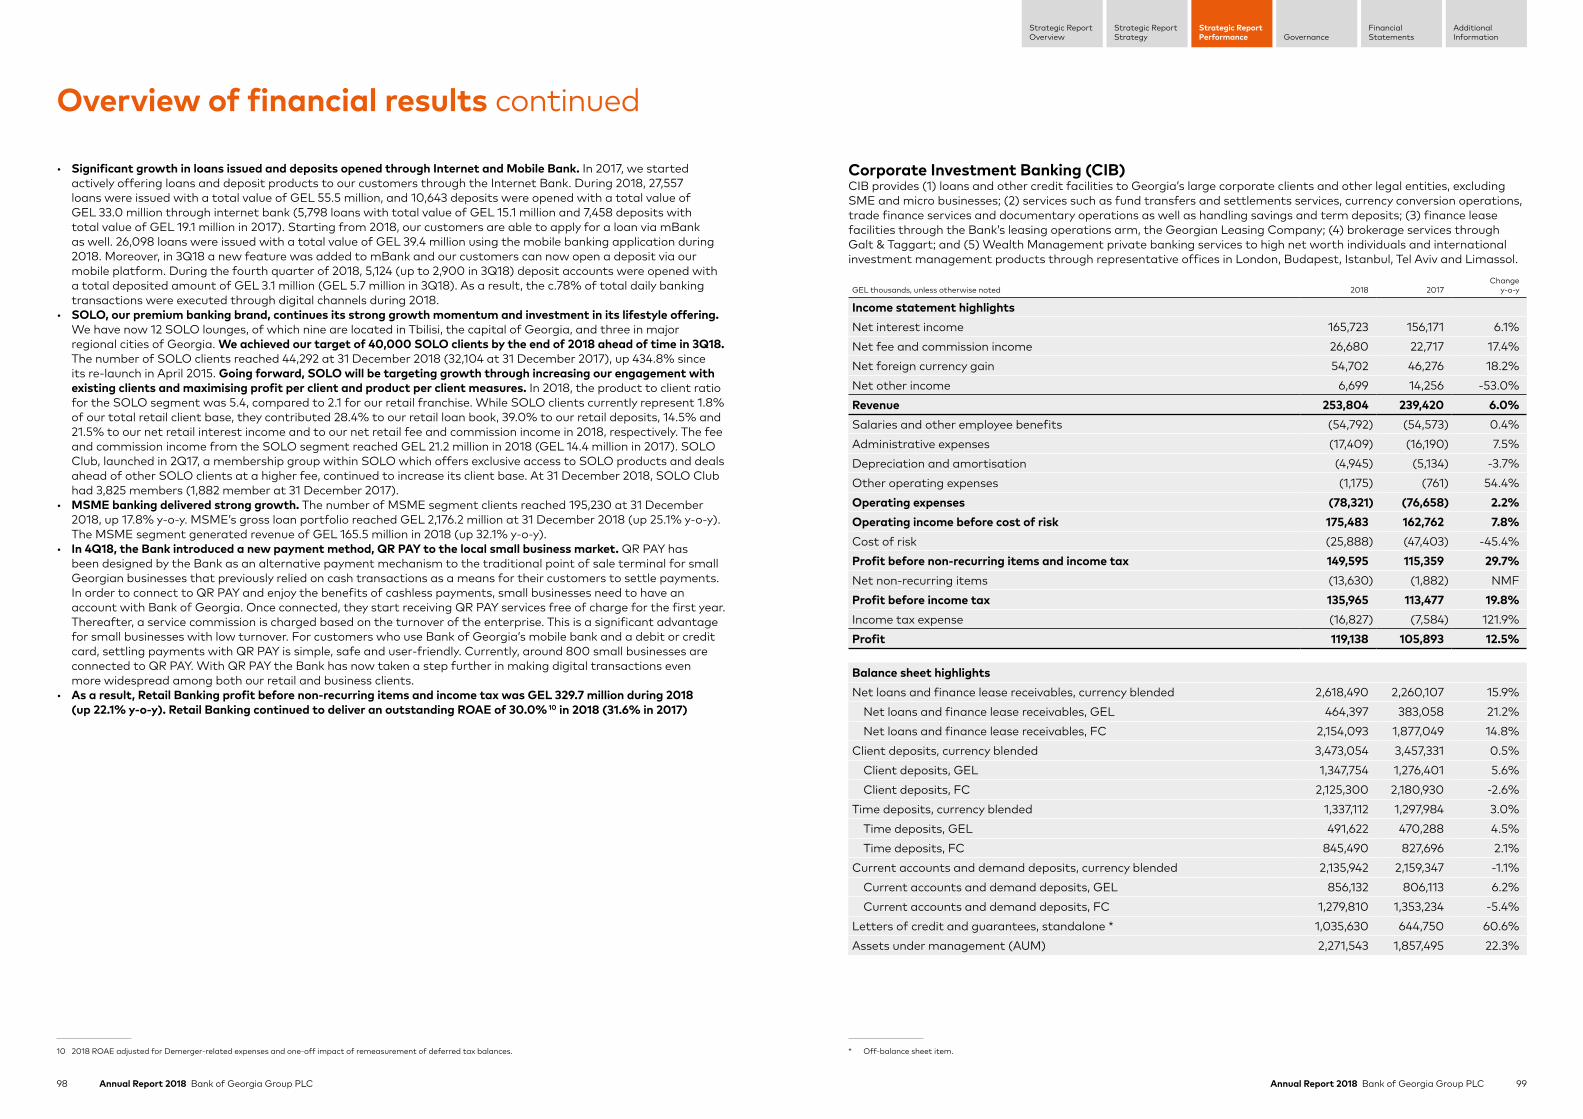
98 Annual Report 2018 Bank of Georgia Group PLC 99Annual Report 2018 Bank of Georgia Group PLC
Strategic ReportStrategy
Strategic ReportPerformance Governance
FinancialStatements
AdditionalInformation
Strategic ReportOverview
Overview of financial results continued
• Significant growth in loans issued and deposits opened through Internet and Mobile Bank. In 2017, we started actively offering loans and deposit products to our customers through the Internet Bank. During 2018, 27,557 loans were issued with a total value of GEL 55.5 million, and 10,643 deposits were opened with a total value of GEL 33.0 million through internet bank (5,798 loans with total value of GEL 15.1 million and 7,458 deposits with total value of GEL 19.1 million in 2017). Starting from 2018, our customers are able to apply for a loan via mBank as well. 26,098 loans were issued with a total value of GEL 39.4 million using the mobile banking application during 2018. Moreover, in 3Q18 a new feature was added to mBank and our customers can now open a deposit via our mobile platform. During the fourth quarter of 2018, 5,124 (up to 2,900 in 3Q18) deposit accounts were opened with a total deposited amount of GEL 3.1 million (GEL 5.7 million in 3Q18). As a result, the c.78% of total daily banking transactions were executed through digital channels during 2018.
• SOLO, our premium banking brand, continues its strong growth momentum and investment in its lifestyle offering. We have now 12 SOLO lounges, of which nine are located in Tbilisi, the capital of Georgia, and three in major regional cities of Georgia. We achieved our target of 40,000 SOLO clients by the end of 2018 ahead of time in 3Q18. The number of SOLO clients reached 44,292 at 31 December 2018 (32,104 at 31 December 2017), up 434.8% since its re-launch in April 2015. Going forward, SOLO will be targeting growth through increasing our engagement with existing clients and maximising profit per client and product per client measures. In 2018, the product to client ratio for the SOLO segment was 5.4, compared to 2.1 for our retail franchise. While SOLO clients currently represent 1.8% of our total retail client base, they contributed 28.4% to our retail loan book, 39.0% to our retail deposits, 14.5% and 21.5% to our net retail interest income and to our net retail fee and commission income in 2018, respectively. The fee and commission income from the SOLO segment reached GEL 21.2 million in 2018 (GEL 14.4 million in 2017). SOLO Club, launched in 2Q17, a membership group within SOLO which offers exclusive access to SOLO products and deals ahead of other SOLO clients at a higher fee, continued to increase its client base. At 31 December 2018, SOLO Club had 3,825 members (1,882 member at 31 December 2017).
• MSME banking delivered strong growth. The number of MSME segment clients reached 195,230 at 31 December 2018, up 17.8% y-o-y. MSME’s gross loan portfolio reached GEL 2,176.2 million at 31 December 2018 (up 25.1% y-o-y). The MSME segment generated revenue of GEL 165.5 million in 2018 (up 32.1% y-o-y).
• In 4Q18, the Bank introduced a new payment method, QR PAY to the local small business market. QR PAY has been designed by the Bank as an alternative payment mechanism to the traditional point of sale terminal for small Georgian businesses that previously relied on cash transactions as a means for their customers to settle payments. In order to connect to QR PAY and enjoy the benefits of cashless payments, small businesses need to have an account with Bank of Georgia. Once connected, they start receiving QR PAY services free of charge for the first year. Thereafter, a service commission is charged based on the turnover of the enterprise. This is a significant advantage for small businesses with low turnover. For customers who use Bank of Georgia’s mobile bank and a debit or credit card, settling payments with QR PAY is simple, safe and user-friendly. Currently, around 800 small businesses are connected to QR PAY. With QR PAY the Bank has now taken a step further in making digital transactions even more widespread among both our retail and business clients.
• As a result, Retail Banking profit before non-recurring items and income tax was GEL 329.7 million during 2018 (up 22.1% y-o-y). Retail Banking continued to deliver an outstanding ROAE of 30.0% 10 in 2018 (31.6% in 2017)
Corporate Investment Banking (CIB)CIB provides (1) loans and other credit facilities to Georgia’s large corporate clients and other legal entities, excluding SME and micro businesses; (2) services such as fund transfers and settlements services, currency conversion operations, trade finance services and documentary operations as well as handling savings and term deposits; (3) finance lease facilities through the Bank’s leasing operations arm, the Georgian Leasing Company; (4) brokerage services through Galt & Taggart; and (5) Wealth Management private banking services to high net worth individuals and international investment management products through representative offices in London, Budapest, Istanbul, Tel Aviv and Limassol.
GEL thousands, unless otherwise noted 2018 2017Change
y-o-y
Income statement highlightsNet interest income 165,723 156,171 6.1%Net fee and commission income 26,680 22,717 17.4%Net foreign currency gain 54,702 46,276 18.2%Net other income 6,699 14,256 -53.0%Revenue 253,804 239,420 6.0%Salaries and other employee benefits (54,792) (54,573) 0.4%Administrative expenses (17,409) (16,190) 7.5%Depreciation and amortisation (4,945) (5,134) -3.7%Other operating expenses (1,175) (761) 54.4%Operating expenses (78,321) (76,658) 2.2%Operating income before cost of risk 175,483 162,762 7.8%Cost of risk (25,888) (47,403) -45.4%Profit before non-recurring items and income tax 149,595 115,359 29.7%Net non-recurring items (13,630) (1,882) NMFProfit before income tax 135,965 113,477 19.8%Income tax expense (16,827) (7,584) 121.9%Profit 119,138 105,893 12.5%
Balance sheet highlightsNet loans and finance lease receivables, currency blended 2,618,490 2,260,107 15.9%
Net loans and finance lease receivables, GEL 464,397 383,058 21.2%Net loans and finance lease receivables, FC 2,154,093 1,877,049 14.8%
Client deposits, currency blended 3,473,054 3,457,331 0.5%Client deposits, GEL 1,347,754 1,276,401 5.6%Client deposits, FC 2,125,300 2,180,930 -2.6%
Time deposits, currency blended 1,337,112 1,297,984 3.0%Time deposits, GEL 491,622 470,288 4.5%Time deposits, FC 845,490 827,696 2.1%
Current accounts and demand deposits, currency blended 2,135,942 2,159,347 -1.1%Current accounts and demand deposits, GEL 856,132 806,113 6.2%Current accounts and demand deposits, FC 1,279,810 1,353,234 -5.4%
Letters of credit and guarantees, standalone * 1,035,630 644,750 60.6%Assets under management (AUM) 2,271,543 1,857,495 22.3%
10 2018 ROAE adjusted for Demerger-related expenses and one-off impact of remeasurement of deferred tax balances. * Off-balance sheet item.
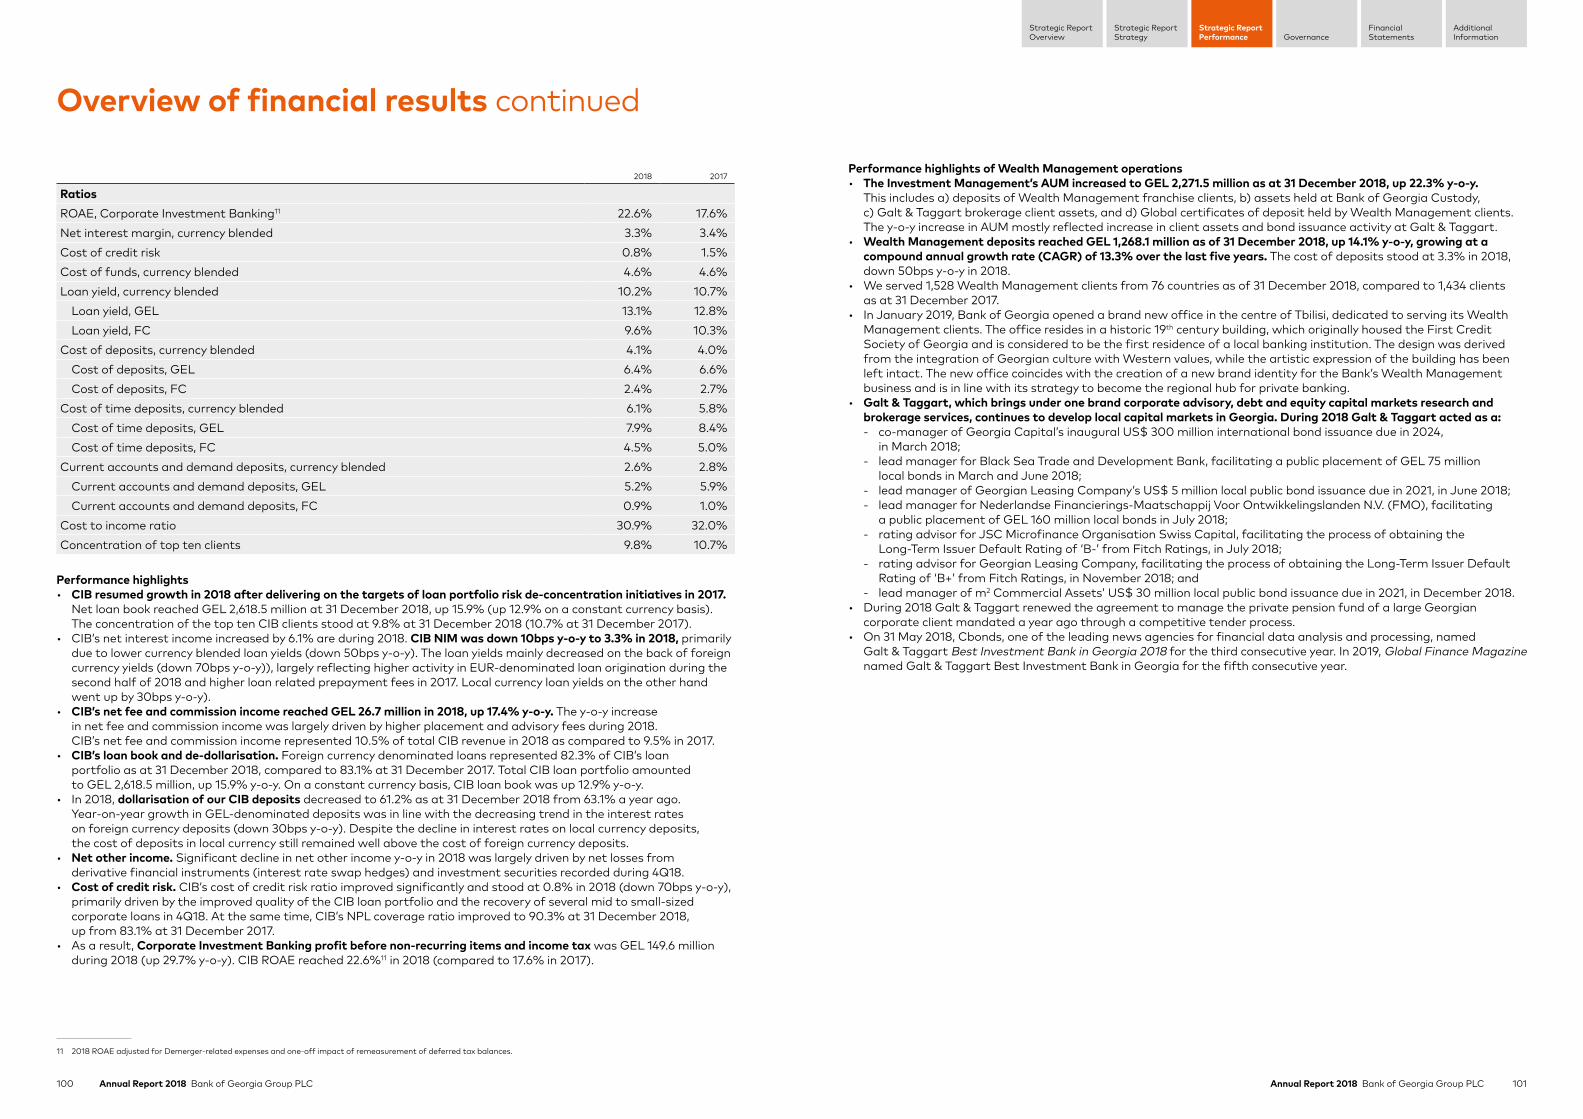
100 Annual Report 2018 Bank of Georgia Group PLC 101Annual Report 2018 Bank of Georgia Group PLC
Strategic ReportStrategy
Strategic ReportPerformance Governance
FinancialStatements
AdditionalInformation
Strategic ReportOverview
Overview of financial results continued
2018 2017
RatiosROAE, Corporate Investment Banking11 22.6% 17.6%Net interest margin, currency blended 3.3% 3.4%Cost of credit risk 0.8% 1.5%Cost of funds, currency blended 4.6% 4.6%Loan yield, currency blended 10.2% 10.7%
Loan yield, GEL 13.1% 12.8%Loan yield, FC 9.6% 10.3%
Cost of deposits, currency blended 4.1% 4.0%Cost of deposits, GEL 6.4% 6.6%Cost of deposits, FC 2.4% 2.7%
Cost of time deposits, currency blended 6.1% 5.8%Cost of time deposits, GEL 7.9% 8.4%Cost of time deposits, FC 4.5% 5.0%
Current accounts and demand deposits, currency blended 2.6% 2.8%Current accounts and demand deposits, GEL 5.2% 5.9%Current accounts and demand deposits, FC 0.9% 1.0%
Cost to income ratio 30.9% 32.0%Concentration of top ten clients 9.8% 10.7%
Performance highlights• CIB resumed growth in 2018 after delivering on the targets of loan portfolio risk de-concentration initiatives in 2017.
Net loan book reached GEL 2,618.5 million at 31 December 2018, up 15.9% (up 12.9% on a constant currency basis). The concentration of the top ten CIB clients stood at 9.8% at 31 December 2018 (10.7% at 31 December 2017).
• CIB’s net interest income increased by 6.1% are during 2018. CIB NIM was down 10bps y-o-y to 3.3% in 2018, primarily due to lower currency blended loan yields (down 50bps y-o-y). The loan yields mainly decreased on the back of foreign currency yields (down 70bps y-o-y)), largely reflecting higher activity in EUR-denominated loan origination during the second half of 2018 and higher loan related prepayment fees in 2017. Local currency loan yields on the other hand went up by 30bps y-o-y).
• CIB’s net fee and commission income reached GEL 26.7 million in 2018, up 17.4% y-o-y. The y-o-y increase in net fee and commission income was largely driven by higher placement and advisory fees during 2018. CIB’s net fee and commission income represented 10.5% of total CIB revenue in 2018 as compared to 9.5% in 2017.
• CIB’s loan book and de-dollarisation. Foreign currency denominated loans represented 82.3% of CIB’s loan portfolio as at 31 December 2018, compared to 83.1% at 31 December 2017. Total CIB loan portfolio amounted to GEL 2,618.5 million, up 15.9% y-o-y. On a constant currency basis, CIB loan book was up 12.9% y-o-y.
• In 2018, dollarisation of our CIB deposits decreased to 61.2% as at 31 December 2018 from 63.1% a year ago. Year-on-year growth in GEL-denominated deposits was in line with the decreasing trend in the interest rates on foreign currency deposits (down 30bps y-o-y). Despite the decline in interest rates on local currency deposits, the cost of deposits in local currency still remained well above the cost of foreign currency deposits.
• Net other income. Significant decline in net other income y-o-y in 2018 was largely driven by net losses from derivative financial instruments (interest rate swap hedges) and investment securities recorded during 4Q18.
• Cost of credit risk. CIB’s cost of credit risk ratio improved significantly and stood at 0.8% in 2018 (down 70bps y-o-y), primarily driven by the improved quality of the CIB loan portfolio and the recovery of several mid to small-sized corporate loans in 4Q18. At the same time, CIB’s NPL coverage ratio improved to 90.3% at 31 December 2018, up from 83.1% at 31 December 2017.
• As a result, Corporate Investment Banking profit before non-recurring items and income tax was GEL 149.6 million during 2018 (up 29.7% y-o-y). CIB ROAE reached 22.6%11 in 2018 (compared to 17.6% in 2017).
Performance highlights of Wealth Management operations• The Investment Management’s AUM increased to GEL 2,271.5 million as at 31 December 2018, up 22.3% y-o-y.
This includes a) deposits of Wealth Management franchise clients, b) assets held at Bank of Georgia Custody, c) Galt & Taggart brokerage client assets, and d) Global certificates of deposit held by Wealth Management clients. The y-o-y increase in AUM mostly reflected increase in client assets and bond issuance activity at Galt & Taggart.
• Wealth Management deposits reached GEL 1,268.1 million as of 31 December 2018, up 14.1% y-o-y, growing at a compound annual growth rate (CAGR) of 13.3% over the last five years. The cost of deposits stood at 3.3% in 2018, down 50bps y-o-y in 2018.
• We served 1,528 Wealth Management clients from 76 countries as of 31 December 2018, compared to 1,434 clients as at 31 December 2017.
• In January 2019, Bank of Georgia opened a brand new office in the centre of Tbilisi, dedicated to serving its Wealth Management clients. The office resides in a historic 19th century building, which originally housed the First Credit Society of Georgia and is considered to be the first residence of a local banking institution. The design was derived from the integration of Georgian culture with Western values, while the artistic expression of the building has been left intact. The new office coincides with the creation of a new brand identity for the Bank’s Wealth Management business and is in line with its strategy to become the regional hub for private banking.
• Galt & Taggart, which brings under one brand corporate advisory, debt and equity capital markets research and brokerage services, continues to develop local capital markets in Georgia. During 2018 Galt & Taggart acted as a: - co-manager of Georgia Capital’s inaugural US$ 300 million international bond issuance due in 2024,
in March 2018; - lead manager for Black Sea Trade and Development Bank, facilitating a public placement of GEL 75 million
local bonds in March and June 2018; - lead manager of Georgian Leasing Company’s US$ 5 million local public bond issuance due in 2021, in June 2018; - lead manager for Nederlandse Financierings-Maatschappij Voor Ontwikkelingslanden N.V. (FMO), facilitating
a public placement of GEL 160 million local bonds in July 2018; - rating advisor for JSC Microfinance Organisation Swiss Capital, facilitating the process of obtaining the
Long-Term Issuer Default Rating of ‘B-’ from Fitch Ratings, in July 2018; - rating advisor for Georgian Leasing Company, facilitating the process of obtaining the Long-Term Issuer Default
Rating of ‘B+’ from Fitch Ratings, in November 2018; and - lead manager of m2 Commercial Assets’ US$ 30 million local public bond issuance due in 2021, in December 2018.
• During 2018 Galt & Taggart renewed the agreement to manage the private pension fund of a large Georgian corporate client mandated a year ago through a competitive tender process.
• On 31 May 2018, Cbonds, one of the leading news agencies for financial data analysis and processing, named Galt & Taggart Best Investment Bank in Georgia 2018 for the third consecutive year. In 2019, Global Finance Magazine named Galt & Taggart Best Investment Bank in Georgia for the fifth consecutive year.
11 2018 ROAE adjusted for Demerger-related expenses and one-off impact of remeasurement of deferred tax balances.

103Annual Report 2018 Bank of Georgia Group PLC
Strategic ReportStrategy
Strategic ReportPerformance Governance
FinancialStatements
AdditionalInformation
Strategic ReportOverview
Annual Report 2018 Bank of Georgia Group PLC102
Governance
Dear Shareholders,
We are pleased to present the first Governance Statement since the Group was admitted to listing and commenced business following the successful Demerger of the Investment Business of BGEO Group PLC in May 2018 leading to the creation of Bank of Georgia Group PLC. All Directors were appointed prior to listing to allow them time to understand the business as a Board. In addition, Directors received detailed training in respect of the responsibilities and obligations of directors of premium listed companies on the London Stock Exchange. This training included their duties and responsibilities under the UK Corporate Governance Code, the Companies Act 2006, the Listing Rules, the Disclosure Guidance and Transparency Rules and the Market Abuse Regulation.
The Board is responsible for ensuring sound management and long-term success of the Group which can only be achieved with an appropriate governance framework. The Board has applied the UK Corporate Governance Code published in 2016 (the “Code”) and it is against that version of the Code that we are reporting.
The Board is entirely committed to the principles of good corporate governance and is of the view that good governance delivers a series of strategic and organisational benefits. Good governance gives us as a Board confidence that we are making the right decisions, keeping in mind what is truly in the Group’s long-term interest. It allows us to take into account the opinions of our stakeholders, including our shareholders, our customers, our employees and our suppliers. It allows us to be a positive driver for the banking sector and for the society we operate in more widely.
We are pleased to report that we have made very good progress in delivering on our key corporate governance commitments since the Bank of Georgia Group was admitted to listing in May 2018, including: • a committee structure with terms of reference that
are compliant with the Code, with each committee composed to ensure that we have the right skill set for it to operate effectively;
• a Board with a proven track record in finance and business with both sector and country-specific knowledge; and
• our Board consists of nine Directors: our Independent Non-Executive Chairman, CEO and seven Independent Non-Executive Directors.
The Board has been fully briefed on the revisions made to the Code during 2018, which applied to the Group from 1 January 2019. An analysis has already been undertaken of the Group’s compliance with the revised Code and the Group has been taking appropriate steps to ensure it complies with the new requirements. For example, the Board reviewed the Schedule of Matters Reserved for the Board, the various committees’ Terms of Reference and the Group’s current governance policies to take into account the changes in the new Code. Hanna Loikkanen was appointed as the designated Non-Executive Director to engage with the workforce. The Board will report on its compliance with the updated Code in its 2019 annual report.
The Board was also briefed on changes to governance standards introduced by the National Bank of Georgia and has put in place a series of changes to procedures and processes to comply with these new standards. We look forward to providing an update in next year’s report on the steps we have put in place to comply with the updated requirements.
We remain committed to working with our management to ensure that our high standards extend beyond the boardroom and are implemented throughout the business in the successful delivery of the Group’s strategic priorities.
Neil JaninChairman 27 March 2019
Hanna LoikkanenSenior Independent Non-Executive Director27 March 2019
Directors’ governance overview
Neil JaninChairman
Hanna LoikkanenSenior Independent Non-Executive Director
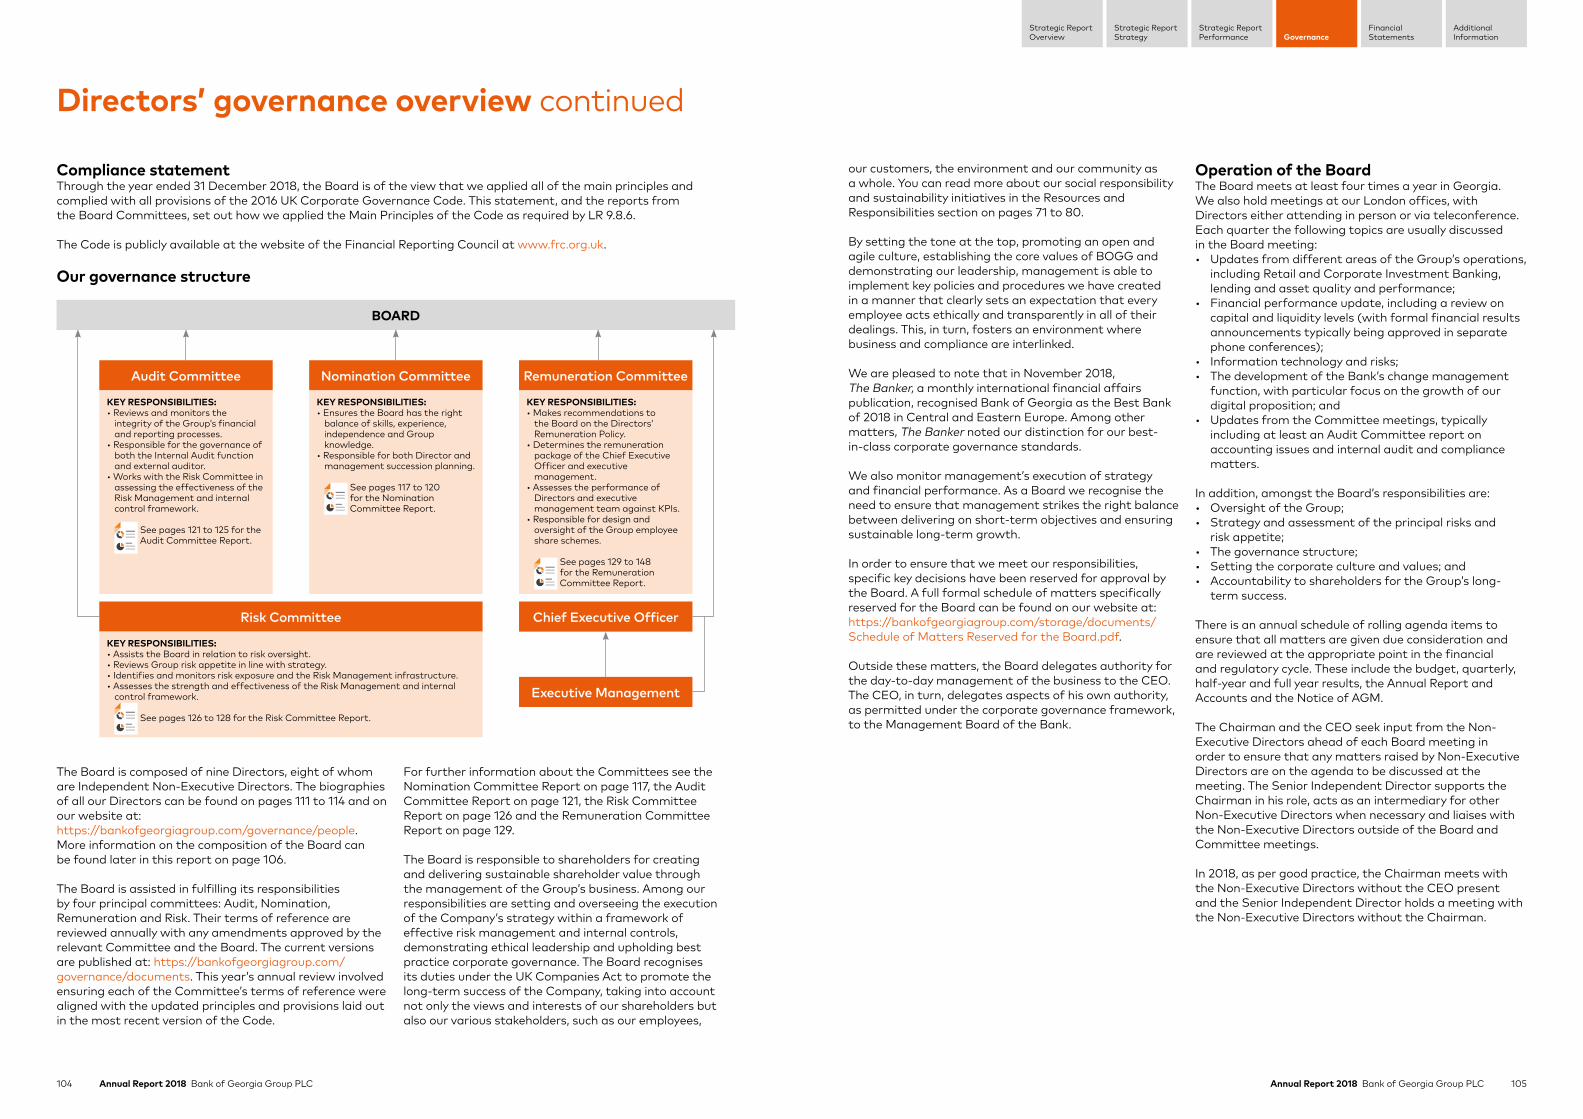
104 Annual Report 2018 Bank of Georgia Group PLC 105Annual Report 2018 Bank of Georgia Group PLC
Strategic ReportStrategy
Strategic ReportPerformance Governance
FinancialStatements
AdditionalInformation
Strategic ReportOverview
Audit Committee
Risk Committee Chief Executive Officer
Nomination Committee Remuneration Committee
BOARD
KEY RESPONSIBILITIES:• Reviews and monitors the
integrity of the Group’s financial and reporting processes.
• Responsible for the governance of both the Internal Audit function and external auditor.
• Works with the Risk Committee in assessing the effectiveness of the Risk Management and internal control framework.
See pages 121 to 125 for the Audit Committee Report.
KEY RESPONSIBILITIES:• Assists the Board in relation to risk oversight.• Reviews Group risk appetite in line with strategy.• Identifies and monitors risk exposure and the Risk Management infrastructure.• Assesses the strength and effectiveness of the Risk Management and internal
control framework.
See pages 126 to 128 for the Risk Committee Report.
KEY RESPONSIBILITIES:• Ensures the Board has the right
balance of skills, experience, independence and Group knowledge.
• Responsible for both Director and management succession planning.
See pages 117 to 120 for the Nomination Committee Report.
KEY RESPONSIBILITIES:• Makes recommendations to
the Board on the Directors’ Remuneration Policy.
• Determines the remuneration package of the Chief Executive Officer and executive management.
• Assesses the performance of Directors and executive management team against KPIs.
• Responsible for design and oversight of the Group employee share schemes.
See pages 129 to 148 for the Remuneration Committee Report.
Executive Management
Compliance statement Through the year ended 31 December 2018, the Board is of the view that we applied all of the main principles and complied with all provisions of the 2016 UK Corporate Governance Code. This statement, and the reports from the Board Committees, set out how we applied the Main Principles of the Code as required by LR 9.8.6.
The Code is publicly available at the website of the Financial Reporting Council at www.frc.org.uk.
Our governance structure
The Board is composed of nine Directors, eight of whom are Independent Non-Executive Directors. The biographies of all our Directors can be found on pages 111 to 114 and on our website at: https://bankofgeorgiagroup.com/governance/people. More information on the composition of the Board can be found later in this report on page 106.
The Board is assisted in fulfilling its responsibilities by four principal committees: Audit, Nomination, Remuneration and Risk. Their terms of reference are reviewed annually with any amendments approved by the relevant Committee and the Board. The current versions are published at: https://bankofgeorgiagroup.com/governance/documents. This year’s annual review involved ensuring each of the Committee’s terms of reference were aligned with the updated principles and provisions laid out in the most recent version of the Code.
For further information about the Committees see the Nomination Committee Report on page 117, the Audit Committee Report on page 121, the Risk Committee Report on page 126 and the Remuneration Committee Report on page 129.
The Board is responsible to shareholders for creating and delivering sustainable shareholder value through the management of the Group’s business. Among our responsibilities are setting and overseeing the execution of the Company’s strategy within a framework of effective risk management and internal controls, demonstrating ethical leadership and upholding best practice corporate governance. The Board recognises its duties under the UK Companies Act to promote the long-term success of the Company, taking into account not only the views and interests of our shareholders but also our various stakeholders, such as our employees,
our customers, the environment and our community as a whole. You can read more about our social responsibility and sustainability initiatives in the Resources and Responsibilities section on pages 71 to 80.
By setting the tone at the top, promoting an open and agile culture, establishing the core values of BOGG and demonstrating our leadership, management is able to implement key policies and procedures we have created in a manner that clearly sets an expectation that every employee acts ethically and transparently in all of their dealings. This, in turn, fosters an environment where business and compliance are interlinked.
We are pleased to note that in November 2018, The Banker, a monthly international financial affairs publication, recognised Bank of Georgia as the Best Bank of 2018 in Central and Eastern Europe. Among other matters, The Banker noted our distinction for our best- in-class corporate governance standards.
We also monitor management’s execution of strategy and financial performance. As a Board we recognise the need to ensure that management strikes the right balance between delivering on short-term objectives and ensuring sustainable long-term growth.
In order to ensure that we meet our responsibilities, specific key decisions have been reserved for approval by the Board. A full formal schedule of matters specifically reserved for the Board can be found on our website at: https://bankofgeorgiagroup.com/storage/documents/Schedule of Matters Reserved for the Board.pdf.
Outside these matters, the Board delegates authority for the day-to-day management of the business to the CEO. The CEO, in turn, delegates aspects of his own authority, as permitted under the corporate governance framework, to the Management Board of the Bank.
Operation of the BoardThe Board meets at least four times a year in Georgia. We also hold meetings at our London offices, with Directors either attending in person or via teleconference. Each quarter the following topics are usually discussed in the Board meeting: • Updates from different areas of the Group’s operations,
including Retail and Corporate Investment Banking, lending and asset quality and performance;
• Financial performance update, including a review on capital and liquidity levels (with formal financial results announcements typically being approved in separate phone conferences);
• Information technology and risks; • The development of the Bank’s change management
function, with particular focus on the growth of our digital proposition; and
• Updates from the Committee meetings, typically including at least an Audit Committee report on accounting issues and internal audit and compliance matters.
In addition, amongst the Board’s responsibilities are: • Oversight of the Group; • Strategy and assessment of the principal risks and
risk appetite; • The governance structure; • Setting the corporate culture and values; and• Accountability to shareholders for the Group’s long-
term success.
There is an annual schedule of rolling agenda items to ensure that all matters are given due consideration and are reviewed at the appropriate point in the financial and regulatory cycle. These include the budget, quarterly, half-year and full year results, the Annual Report and Accounts and the Notice of AGM.
The Chairman and the CEO seek input from the Non-Executive Directors ahead of each Board meeting in order to ensure that any matters raised by Non-Executive Directors are on the agenda to be discussed at the meeting. The Senior Independent Director supports the Chairman in his role, acts as an intermediary for other Non-Executive Directors when necessary and liaises with the Non-Executive Directors outside of the Board and Committee meetings.
In 2018, as per good practice, the Chairman meets with the Non-Executive Directors without the CEO present and the Senior Independent Director holds a meeting with the Non-Executive Directors without the Chairman.
Directors’ governance overview continued
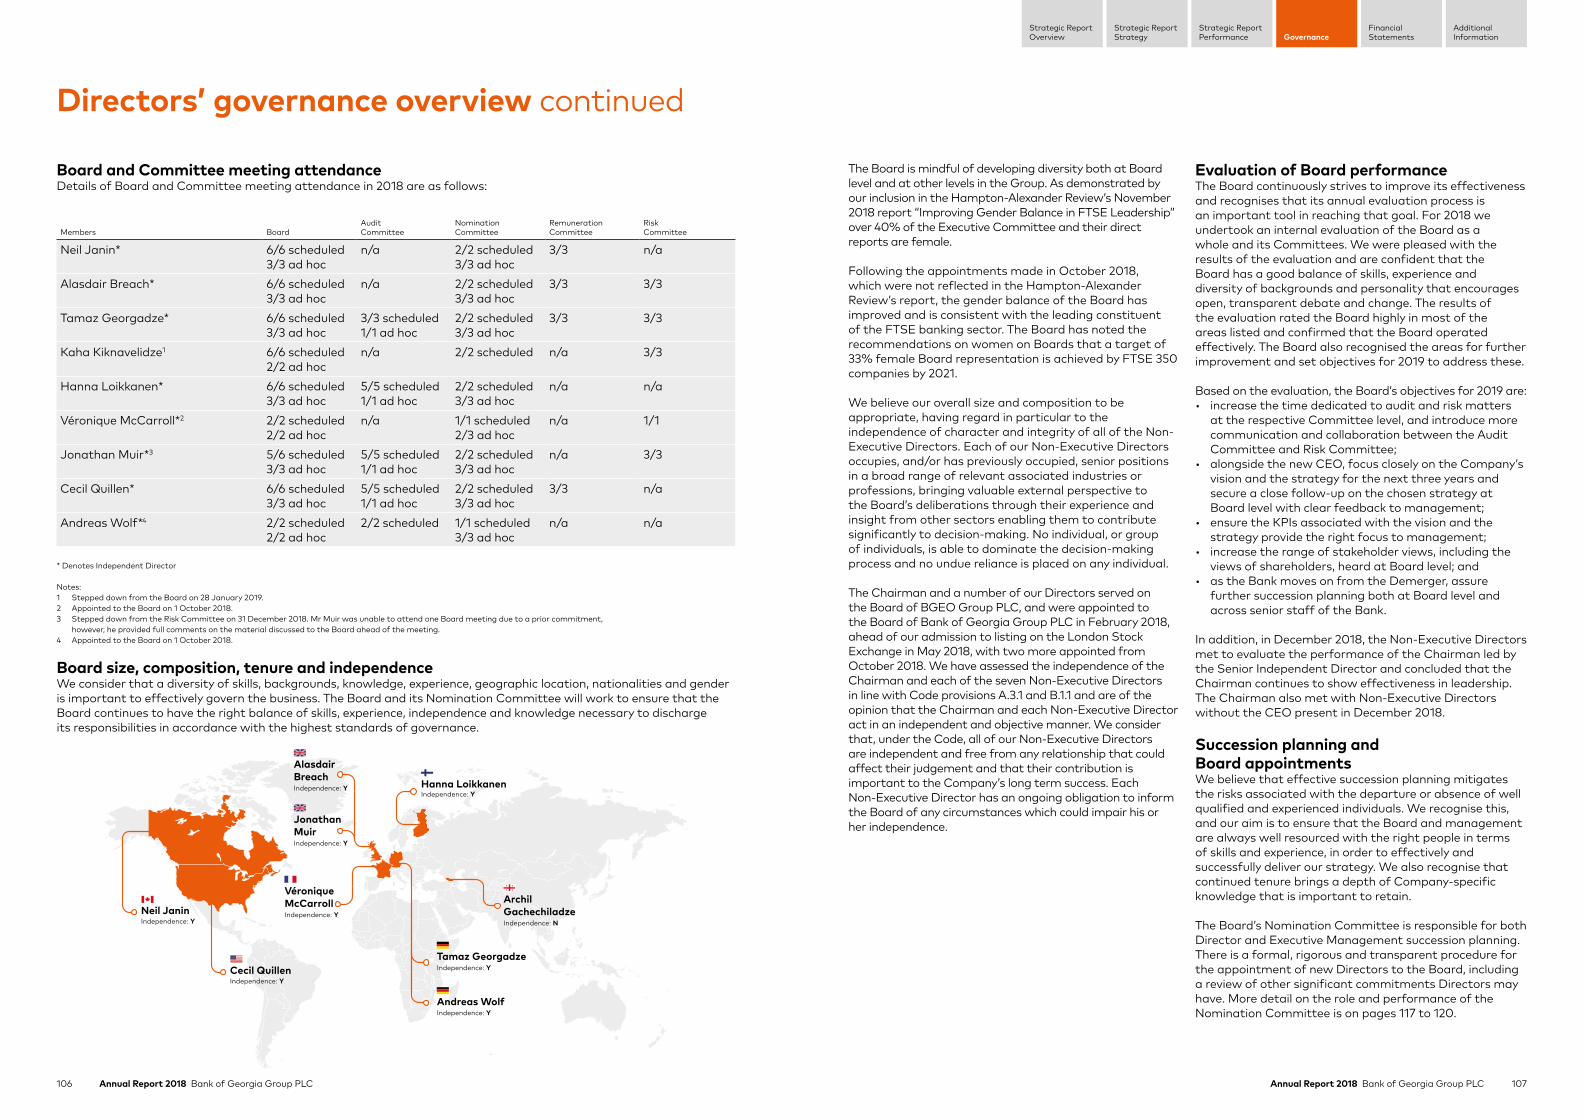
106 Annual Report 2018 Bank of Georgia Group PLC 107Annual Report 2018 Bank of Georgia Group PLC
Strategic ReportStrategy
Strategic ReportPerformance Governance
FinancialStatements
AdditionalInformation
Strategic ReportOverview
Independence: YNeil Janin
Independence: YCecil Quillen
Independence: N
ArchilGachechiladze
Independence: Y
AlasdairBreach
Independence: Y
Independence: Y
Independence: Y
Hanna Loikkanen
Independence: Y
JonathanMuir
Independence: Y
VéroniqueMcCarroll
Andreas Wolf
Tamaz Georgadze
Board size, composition, tenure and independence We consider that a diversity of skills, backgrounds, knowledge, experience, geographic location, nationalities and gender is important to effectively govern the business. The Board and its Nomination Committee will work to ensure that the Board continues to have the right balance of skills, experience, independence and knowledge necessary to discharge its responsibilities in accordance with the highest standards of governance.
The Board is mindful of developing diversity both at Board level and at other levels in the Group. As demonstrated by our inclusion in the Hampton-Alexander Review’s November 2018 report “Improving Gender Balance in FTSE Leadership” over 40% of the Executive Committee and their direct reports are female.
Following the appointments made in October 2018, which were not reflected in the Hampton-Alexander Review’s report, the gender balance of the Board has improved and is consistent with the leading constituent of the FTSE banking sector. The Board has noted the recommendations on women on Boards that a target of 33% female Board representation is achieved by FTSE 350 companies by 2021.
We believe our overall size and composition to be appropriate, having regard in particular to the independence of character and integrity of all of the Non-Executive Directors. Each of our Non-Executive Directors occupies, and/or has previously occupied, senior positions in a broad range of relevant associated industries or professions, bringing valuable external perspective to the Board’s deliberations through their experience and insight from other sectors enabling them to contribute significantly to decision-making. No individual, or group of individuals, is able to dominate the decision-making process and no undue reliance is placed on any individual.
The Chairman and a number of our Directors served on the Board of BGEO Group PLC, and were appointed to the Board of Bank of Georgia Group PLC in February 2018, ahead of our admission to listing on the London Stock Exchange in May 2018, with two more appointed from October 2018. We have assessed the independence of the Chairman and each of the seven Non-Executive Directors in line with Code provisions A.3.1 and B.1.1 and are of the opinion that the Chairman and each Non-Executive Director act in an independent and objective manner. We consider that, under the Code, all of our Non-Executive Directors are independent and free from any relationship that could affect their judgement and that their contribution is important to the Company’s long term success. Each Non-Executive Director has an ongoing obligation to inform the Board of any circumstances which could impair his or her independence.
Evaluation of Board performanceThe Board continuously strives to improve its effectiveness and recognises that its annual evaluation process is an important tool in reaching that goal. For 2018 we undertook an internal evaluation of the Board as a whole and its Committees. We were pleased with the results of the evaluation and are confident that the Board has a good balance of skills, experience and diversity of backgrounds and personality that encourages open, transparent debate and change. The results of the evaluation rated the Board highly in most of the areas listed and confirmed that the Board operated effectively. The Board also recognised the areas for further improvement and set objectives for 2019 to address these.
Based on the evaluation, the Board’s objectives for 2019 are:• increase the time dedicated to audit and risk matters
at the respective Committee level, and introduce more communication and collaboration between the Audit Committee and Risk Committee;
• alongside the new CEO, focus closely on the Company’s vision and the strategy for the next three years and secure a close follow-up on the chosen strategy at Board level with clear feedback to management;
• ensure the KPIs associated with the vision and the strategy provide the right focus to management;
• increase the range of stakeholder views, including the views of shareholders, heard at Board level; and
• as the Bank moves on from the Demerger, assure further succession planning both at Board level and across senior staff of the Bank.
In addition, in December 2018, the Non-Executive Directors met to evaluate the performance of the Chairman led by the Senior Independent Director and concluded that the Chairman continues to show effectiveness in leadership. The Chairman also met with Non-Executive Directors without the CEO present in December 2018.
Succession planning and Board appointments We believe that effective succession planning mitigates the risks associated with the departure or absence of well qualified and experienced individuals. We recognise this, and our aim is to ensure that the Board and management are always well resourced with the right people in terms of skills and experience, in order to effectively and successfully deliver our strategy. We also recognise that continued tenure brings a depth of Company-specific knowledge that is important to retain.
The Board’s Nomination Committee is responsible for both Director and Executive Management succession planning. There is a formal, rigorous and transparent procedure for the appointment of new Directors to the Board, including a review of other significant commitments Directors may have. More detail on the role and performance of the Nomination Committee is on pages 117 to 120.
Directors’ governance overview continued
Board and Committee meeting attendance Details of Board and Committee meeting attendance in 2018 are as follows:
Members Board Audit Committee
Nomination Committee
Remuneration Committee
Risk Committee
Neil Janin* 6/6 scheduled3/3 ad hoc
n/a 2/2 scheduled3/3 ad hoc
3/3 n/a
Alasdair Breach* 6/6 scheduled3/3 ad hoc
n/a 2/2 scheduled3/3 ad hoc
3/3 3/3
Tamaz Georgadze* 6/6 scheduled3/3 ad hoc
3/3 scheduled1/1 ad hoc
2/2 scheduled3/3 ad hoc
3/3 3/3
Kaha Kiknavelidze1 6/6 scheduled2/2 ad hoc
n/a 2/2 scheduled n/a 3/3
Hanna Loikkanen* 6/6 scheduled3/3 ad hoc
5/5 scheduled1/1 ad hoc
2/2 scheduled3/3 ad hoc
n/a n/a
Véronique McCarroll*2 2/2 scheduled2/2 ad hoc
n/a 1/1 scheduled2/3 ad hoc
n/a 1/1
Jonathan Muir*3 5/6 scheduled3/3 ad hoc
5/5 scheduled 1/1 ad hoc
2/2 scheduled3/3 ad hoc
n/a 3/3
Cecil Quillen* 6/6 scheduled3/3 ad hoc
5/5 scheduled1/1 ad hoc
2/2 scheduled3/3 ad hoc
3/3 n/a
Andreas Wolf*4 2/2 scheduled2/2 ad hoc
2/2 scheduled 1/1 scheduled3/3 ad hoc
n/a n/a
* Denotes Independent Director
Notes: 1 Stepped down from the Board on 28 January 2019.2 Appointed to the Board on 1 October 2018.3 Stepped down from the Risk Committee on 31 December 2018. Mr Muir was unable to attend one Board meeting due to a prior commitment,
however, he provided full comments on the material discussed to the Board ahead of the meeting.4 Appointed to the Board on 1 October 2018.
108 Annual Report 2018 Bank of Georgia Group PLC 109Annual Report 2018 Bank of Georgia Group PLC
Strategic ReportStrategy
Strategic ReportPerformance Governance
FinancialStatements
AdditionalInformation
Strategic ReportOverview
Non-Executive Directors’ terms of appointment On appointment, our Non-Executive Directors are provided with a letter of appointment that sets out the terms and conditions of their directorship, including the fees payable and the expected time commitment. Each Non-Executive Director is expected to commit approximately 25-35 days per year to the role. An additional time commitment is required to fulfil their roles as Board Committee members and/or Board Committee Chairmen, as applicable. We are satisfied that all Non-Executive Directors dedicate the amount of time necessary to contribute to the effectiveness of the Board.
The letters of appointment for our Non-Executive Directors are available for inspection at the Group’s registered office during normal business hours.
External appointments Prior to accepting any external appointments, Directors are required to seek the Board’s approval. The Board believes that other external directorships and positions held provide the Directors with valuable expertise which enhances their ability to act as a Non-Executive Director of the Company. The number of external directorships and positions should however, be limited to secure that Directors are able to dedicate the amount of time necessary to contribute effectively to the Board.
Board induction, ongoing training, professional development and independent adviceOn appointment, each Director takes part in an induction programme, during which they meet members of the Management Board and receive information about the role of the Board and individual Directors, each Board Committee and the powers delegated to those Committees. They are also advised by the Company Secretary of the legal and regulatory obligations of a Director of a company listed on the London Stock Exchange. Induction sessions are designed to be interactive and are tailored to suit the needs of the individual’s previous experience and knowledge. Prior to the Demerger, all Directors received detailed training in respect of the responsibilities of companies that have a premium listing on the London Stock Exchange.
We are committed to the continuing development of our Directors in order that they may build on their expertise and develop an ever more detailed understanding of the business and the markets in which Group companies operate. All of our Directors participated in ongoing training and professional development throughout 2018, which included briefings, site visits, development sessions and presentations by our UK General Counsel, Company Secretary, members of management, and our professional advisors. During the year, our UK General Counsel and Company Secretary provided updates on legislative changes including the Non-Financial Reporting Directive and diversity initiatives, as well as refresher training on directors’ duties under the UK Companies Act, in particular section 172. In addition, amendments to the Disclosure Guidance and Transparency Rules and the FRC’s guidance on reporting were presented. The UK General Counsel also trained the Board on proposed changes to the UK Corporate Governance Code and the new FRC Guidance on Board Effectiveness. Audit Committee members also received training on developments in audit and accounting.
All Directors have access to the advice of the UK General Counsel and Company Secretary as well as independent professional advice, at the Company’s expense, on any matter relating to their responsibilities.
Company Secretary The Board appointed Link Company Matters Limited to act as Company Secretary to Bank of Georgia Group PLC in June 2018. Link Company Matters Limited is one of the UK’s largest professional services secretarial teams. Previously this position was held by Rebecca Wooldridge, a lawyer specialising in corporate governance, who was subsequently appointed as UK General Counsel to the Group.
Directors All Directors are required by the Company’s Articles of Association and the UK Corporate Governance Code to be elected by shareholders at the first Annual General Meeting in May 2019 following their appointment. Going forward, in line with the Code’s recommendation, all Directors will seek re-election on an annual basis. The Board has set out in its Notice of Annual General Meeting the qualifications of each Director and support for election as applicable.
Annual General Meeting The Notice of Annual General Meeting will be circulated to all shareholders at least 20 working days prior to such meeting. All shareholders are invited to attend the Annual General Meeting, where there is an opportunity for individual shareholders to question the Chairman and, through him, the Chairs of the principal Board Committees. After the Annual General Meeting, shareholders can meet informally with the Directors.
As recommended by the UK Corporate Governance Code, all resolutions proposed at the 2019 Annual General Meeting will be voted on separately and the voting results will be announced to the London Stock Exchange and made available on the Company’s website as soon as practicable after the meeting. These will include all votes cast for and against and those withheld, together with all proxies lodged prior to the meeting. In the event that 20% or more of votes have been cast against a resolution, an explanation will be provided in the announcement to the London Stock Exchange of the actions the Company will be taking to address shareholders’ concerns. A follow-up announcement would then be made within six months of the Annual General Meeting regarding feedback received from shareholders and the subsequent actions taken by the Company.
See page 288 for further Shareholder Information and page 110 for further information on shareholder engagement.
See page 150 for further details on our AGM and the voting process.
UK Bribery Act 2010 (the “Bribery Act”)The Board stands firmly against bribery and corruption and is committed to the Group acting in an ethical manner. To support this and in response to this legislation the Group has implemented and enforces its Anti-Bribery and Anti-Corruption Policy. The Board attaches the utmost importance to the Policy and its systems. The Company has also introduced a whistleblowing system, including an anonymous and externally operated helpline, under its Whistleblowing Policy.
Diversity policy More information on the Company’s Diversity policy, its objectives, implementation and results can be found on page 119.
Directors’ responsibilities Statements explaining the responsibilities of the Directors for preparing the Annual Report and consolidated and separate financial statements can be found on page 149 of this Annual Report.
A further statement is provided confirming that the Board considers the Annual Report, taken as a whole, to be fair, balanced and understandable and provides the information necessary for shareholders to assess the Company’s position and performance, business model and strategy.
Internal controls and risk management The Group has a comprehensive system of internal controls in place, designed to ensure that risks are identified, recognised and mitigated and that the Group’s objectives are attained. The Board recognises its responsibility to present a fair, balanced and understandable assessment of the Group’s position and prospects. It is accountable for reviewing and approving the effectiveness of internal controls operated by the Group, including financial, operational and compliance controls, and risk management. The Board recognises its responsibility in respect of the Group’s risk management process and system of internal control and oversees the activities of the Group’s external auditor and the Group’s risk management function (supported by the Audit Committee).
A review of the Group’s risk management approach is further discussed in the Strategic Report on pages 48 to 59. For detail on the management and mitigation of each principal risk see pages 60 to 67. The Group’s viability statement is detailed on pages 68. Please refer to pages 121 to 125 for further detail in relation to the role of the Audit Committee.
The Group’s governance structure for risk management is illustrated on pages 48 to 59.
Directors’ governance overview continued

110 Annual Report 2018 Bank of Georgia Group PLC 111Annual Report 2018 Bank of Georgia Group PLC
Strategic ReportStrategy
Strategic ReportPerformance Governance
FinancialStatements
AdditionalInformation
Strategic ReportOverview
Neil JaninNon-Executive Chairman Neil Janin was appointed Non-Executive Chairman of Bank of Georgia Group PLC on 24 February 2018. Mr Janin serves as Chairman of Bank of Georgia Group PLC’s Nomination Committee, as well as being a member of the Remuneration Committee. Mr Janin also serves as a member of the Supervisory Board of the Bank. Mr Janin previously served as Chairman of BGEO Group PLC from October 2011 until May 2018, which included positions on BGEO Group PLC’s Nomination and Remuneration Committees. Mr Janin also served as a Non-Executive Director of Georgia Healthcare Group PLC, from September 2015 to April 2018.
Skills and experience:Mr Janin serves as counsel to CEOs of both for-profit and non-profit organisations and continues to provide consulting services to McKinsey & Company. Prior to joining the Bank in 2010, Mr Janin was a Director of McKinsey & Company, based in its Paris office, for over 27 years, from 1982 until his retirement. At McKinsey & Company, he conducted engagements in the retail, asset management and corporate banking sectors, and was actively involved in every aspect of organisational practice, including design, leadership, governance, performance enhancement and transformation. Before joining
McKinsey & Company, Mr Janin worked for Chase Manhattan Bank (now JP Morgan Chase) in New York and Paris, and Procter & Gamble in Toronto. Mr Janin has practised in Europe, Asia and North America. Mr Janin is also a Director of Neil Janin Limited, a company through which he provides his ongoing consulting services.
Education:Mr Janin holds an MBA from York University, Toronto, and a joint honours degree in Economics and Accounting from McGill University, Montreal.
Archil Gachechiladze CEO Archil Gachechiladze was appointed as Executive Director and CEO of Bank of Georgia Group PLC on 28 January 2019. Mr Gachechiladze serves as a member of the Risk Committee and as CEO of the Bank. Prior to his recent appointment Mr Gachechiladze served as CEO of Georgian Global Utilities from January 2017 to January 2019. Mr Gachechiladze joined the Bank in 2009 as Deputy CEO, Corporate Banking (2009-2013) and has since held various roles with the Bank and the Group, such as Deputy CEO, Investment Management (2013-2015), CFO of BGEO Group (2015-2016) and Deputy CEO, Corporate Investment Banking (2016- 2017).
Skills and experience:Mr Gachechiladze has over 17 years of experience in the financial services, including various senior positions both in local and international organisations, such as TBC Bank (2008-2009), Lehman Brothers Private Equity (currently Trilantic Capital Partners) (2006-2008), Salford Equity Partners, KPMG and the World Bank’s CERMA (1998-2004).
Education:Mr Gachechiladze received his undergraduate degree in Economics from Tbilisi State University and holds his MBA with distinction from Cornell University. He is also a CFA Charterholder and a member of the CFA Society in the United Kingdom.
Board of DirectorsDiverse and balanced team who govern with experience
How we engage with our shareholders In May 2018, the Company’s shares were admitted to listing on the London Stock Exchange following the Demerger of BGEO Group PLC. Since then, the Company has continued to follow a comprehensive shareholder engagement programme established by BGEO Group PLC. The programme encourages an open and transparent dialogue with existing and potential shareholders.
The Board’s primary contact with institutional shareholders is through the Chairman, CEO and Head of Investor Relations, each of whom provides a standing invitation to shareholders to meet and discuss any matters they wish to raise. Our Committee Chairmen also make themselves available to answer questions from investors. The Board has also appointed Hanna Loikkanen as Senior Independent Director whose role includes acting as an intermediary for shareholders.
Ahead of the Demerger, a presentation was provided to shareholders of BGEO Group PLC which laid out the key milestones in the Demerger process and provided a detailed breakdown of the structure of this Company post Demerger. Shareholders were engaged frequently throughout the Demerger process to address any concerns.
We will engage with shareholders through the Company’s forthcoming Annual General Meeting to be held in May 2019 but will also continue to communicate with shareholders on important developments throughout the year. Our annual, half-year and quarterly results announcement are supported by a combination of presentations and telephone briefings. Over the course of 2018, we met with over 400 institutional investors, and participated in more than 40 investor conferences and road shows. Throughout the year, our Directors and management met with shareholders in Georgia, the UK, Europe, the US, Singapore and South Africa.
In October 2018 the Company, together with Galt & Taggart (part of the Group and the leading brokerage firm in Georgia), hosted a Georgia Investor Day at the London Stock Exchange, which was open to all investors and analysts. This investor day provided an opportunity for investors to receive an update from the Board and executive management on strategy and performance as well as meet informally with Board members and raise matters of interest. The Company was pleased to host approximately 130 investors and analysts at the event and has ensured that the views expressed by the investors at the day have been fed back to the Board.
In addition to our shareholders, we meet with analysts throughout the year, hold regular meetings with the Group’s existing lenders and actively engage with potential lenders to discuss our funding strategy. Our UK General Counsel and Company Secretary have ongoing dialogue with the shareholders’ advisory group and proxy voting agencies.
The Chairman has overall responsibility for ensuring that the Board understands the views of major stakeholders.
The full Board is regularly kept informed of these views by the Chairman as well as executive management and the Investor Relations team and, to the extent deemed appropriate, the Group has taken active steps to adopt different ways of working in response to feedback received from shareholders and other stakeholders. Informal feedback from analysts and the Group’s corporate advisors is also shared with the Board.
How we engage with our other key stakeholdersAs one of the largest banking institutions in Georgia and in the Caucasus region, we also understand the importance of ensuring that we actively engage with, and take into account the views of, our major stakeholders. We detail below who we consider our major stakeholders to be and how we take them into account, and respond to them.
Stakeholders Our engagement
Our customers As we detail in Resources and Responsibilities on page 70, our engagement with customers is one of our strategic priorities.
Employees We detail in Resources and Responsibilities our engagement with employees, which includes:• half-yearly and annual
performance reviews;• employee engagement surveys;• town hall sessions with
senior management; • a designated workforce engagement
non-executive director; and• ‘Meet the Board’ sessions.
Government Regular liaison with Government departments, including Ministerial liaison, as the Bank is regulated.
Local communities
As we detail in Resources and Responsibilities, we have a range of initiatives including volunteer days for employees, support of relevant charities through selective partnerships and the regular review of additional ways we can provide support to the wider community and relevant charitable organisations.
Third party suppliers
Regular meetings and review within key contacts and with suppliers and their senior management teams.
Our website, https://bankofgeorgiagroup.com/ provides our shareholders with access to the Group’s results, press releases, investor presentations, analyst coverage, details on our corporate governance and corporate and social responsibility framework, our leadership, as well as other information relevant to our shareholders. We also ensure that shareholders can access details of the Group’s results and other news releases through the London Stock Exchange’s Regulatory News Service.
Shareholder and stakeholder engagement

112 Annual Report 2018 Bank of Georgia Group PLC 113Annual Report 2018 Bank of Georgia Group PLC
Strategic ReportStrategy
Strategic ReportPerformance Governance
FinancialStatements
AdditionalInformation
Strategic ReportOverview
Hanna LoikkanenSenior Independent Non-Executive DirectorHanna Loikkanen was appointed as the Senior Independent Non-Executive Director of Bank of Georgia Group PLC on 24 February 2018. Ms Loikkanen also serves as a member of the Audit Committee and Nomination Committee. Ms Loikkanen was appointed to the Bank’s Supervisory Board in August 2015. Ms Loikkanen previously served as an Independent Non-Executive Director of BGEO Group PLC from 2011 until 2013 and from 2015 until 2018, which included positions on BGEO Group PLC’s Audit, Nomination and Risk Committees.
Skills and experience:Ms Loikkanen has over 20 years of experience working with financial institutions in Russia and Eastern Europe. She currently serves as an advisor to East Capital Private Equity AB. Prior to this, she served from 2010 to 2012 as the Chief Representative and Head of the Private Equity team at East Capital, a Swedish asset management company in Moscow, with a special focus on financial institutions. Prior to this, Ms Loikkanen held the position of Country Manager and Chief Executive Officer at FIM Group in Russia, a Finnish investment bank, where she was responsible for setting up and running FIM Group’s brokerage and corporate finance operations in Russia. During her tenure at FIM Group, the company advised several large foreign companies in their M&A activities in Russia. Earlier in her career, Ms Loikkanen worked for Nordea Finance in various management positions in Poland, the Baltic States and Scandinavia with a focus on business development, strategy and business integration; for SEB in Moscow where she was responsible
for the restructuring of SEB’s debt capital market operations in Russia; and for MeritaNordbanken in St Petersburg where she focused on trade finance and correspondent banking. In addition to her directorships at Bank of Georgia Group PLC, Ms Loikkanen serves as a Non-Executive Director, Chair of the Compensation and Remuneration Committee and member of the Audit Committee of PJSC Rosbank, a universal bank listed on the Moscow Stock Exchange (Société Générale Group in Russia). Since 2014, she has acted as Non-Executive Chairman of the Board of T&B Capital, an independent regulated wealth management company based in Helsinki.
Education:Ms Loikkanen holds a Master’s degree in Economics and Business Administration from the Helsinki School of Economics, and was a Helsinki School of Economics scholar at the University of New South Wales.
Tamaz GeorgadzeIndependent Non-Executive DirectorTamaz Georgadze was appointed as an Independent Non-Executive Director of Bank of Georgia Group PLC on 24 February 2018. Mr Georgadze serves as Chairman of Bank of Georgia Group PLC’s Risk Committee, as well as being a member of the Remuneration Committee and the Nomination Committee. Mr Georgadze was also appointed to the Bank’s Supervisory Board in December 2013. Mr Georgadze previously served as an Independent Non-Executive Director of BGEO Group PLC, which included positions on BGEO Group PLC’s Audit, Nomination and Risk Committees.
Skills and experience:In 2013, Mr Georgadze founded Raisin GmbH (formerly SavingGlobal GmbH) a company which launched the first global deposit intermediation in Europe and he continues to serve as its CEO/Chairman. Prior to founding this company, Mr Georgadze had a ten-year career at McKinsey & Company in Berlin, where he served as a Partner from 2009 to 2013. At McKinsey & Company, he conducted engagements with banks in Germany, Switzerland, Russia, Georgia and Vietnam, focusing on strategy, risk identification and management, deposit and investment products, operations and sales.
Prior to joining McKinsey & Company, Mr Georgadze worked as an aide to the President of Georgia in the Foreign Relations Department from 1994 to 1995. Save for his role at Raisin GmbH, Mr Georgadze does not hold any other directorships.
Education:Mr Georgadze holds two PhDs, one in Economics from Tbilisi State University and the other in Agricultural Economics from Justus-Liebig University Gießen, Germany. Mr Georgadze also studied Law at Justus-Liebig Universität Gießen and graduated with honours.
Alasdair (Al) BreachIndependent Non-Executive DirectorAlasdair Breach was appointed as an Independent Non-Executive Director of Bank of Georgia Group PLC on 24 February 2018. Mr Breach serves as Chairman of Bank of Georgia Group PLC’s Remuneration Committee, as well as being a member of the Risk Committee and Nomination Committee. Mr Breach also serves as a member of the Supervisory Board. Mr Breach previously served as an Independent Non-Executive Director of BGEO Group PLC, which included positions on BGEO Group PLC’s Remuneration, Nomination and Risk Committees.
Skills and experience:In 2013, Mr Breach co-founded Gemsstock Limited, a UK FCA-regulated fund manager, where he also serves as an Executive Director. In 2010, Mr Breach founded Furka Advisors AG, a Swiss-based asset management firm, and served as an Executive Director until founding Gemsstock Limited, which manages the Gemsstock Fund, which was previously called the Gemsstock Growth Fund and was managed by Mr Breach at Furka Advisors AG. His previous career was in research in investment banks, principally in Russia. In January 2003, Mr Breach joined Brunswick UBS (later UBS Russia) as Chief Economist, and later was appointed Head of Research and Managing Director until
October 2007. From 1998 to 2002, Mr Breach was a Russia and Former Soviet Union (FSU) economist at Goldman Sachs, based in Moscow. Mr Breach is also the co-founder of The Browser.com, a web-based curator of current affairs writing, established in 2008. Mr Breach serves as a Director of Gemsstock Limited, the Gemsstock Fund, The Browser and Furka Holdings AG, all of which are private entities. He is also an advisor to East Capital.
Education:Mr Breach holds an MSc in Economics from the London School of Economics and an undergraduate degree in Mathematics and Philosophy from Edinburgh University.
Board of Directors continued
Jonathan MuirIndependent Non-Executive DirectorJonathan Muir was appointed as an Independent Non-Executive Director of Bank of Georgia Group PLC on 24 February 2018. Mr Muir serves as Chairman of Bank of Georgia Group PLC’s Audit Committee, as well as being a member of the Nomination Committee. He was appointed as an Independent Non-Executive Director to BGEO Group PLC’s Board of Directors in June 2017 after previously serving as an advisor to BGEO Group PLC’s Board since December 2016. Mr Muir was appointed to the Bank’s Supervisory Board in August 2017.
Skills and experience:Mr Muir has over 30 years’ experience working as a professional in accounting and finance. He is an executive director (CEO) of LetterOne Holdings SA and is CEO of LetterOne Investment Holdings. LetterOne is an international investment business consisting of two groups which target investments in the healthcare, energy, telecoms and technology, and retail sectors. Prior to joining LetterOne, Mr Muir was CFO (2008-2013) and Vice President of Finance and Control (2003-2008)
of TNK-BP, which he joined after serving as CFO of SIDANCO, one of TNK-BP’s heritage companies. Prior to this, he was a partner at the global audit and consulting company Ernst & Young (1985-2000).
Education:Mr Muir graduated with first class honours from St. Andrews University in the UK. He is a British qualified Chartered Accountant and a member of the Institute of Chartered Accountants of England and Wales.

114 Annual Report 2018 Bank of Georgia Group PLC 115Annual Report 2018 Bank of Georgia Group PLC
Strategic ReportStrategy
Strategic ReportPerformance Governance
FinancialStatements
AdditionalInformation
Strategic ReportOverview
Cecil QuillenIndependent Non-Executive DirectorCecil Quillen was appointed as an Independent Non-Executive Director of Bank of Georgia Group PLC on 24 February 2018. Mr Quillen serves as a member of Bank of Georgia Group PLC’s Audit Committee, Remuneration Committee and Nomination Committee. Mr Quillen also serves as a member of the Supervisory Board.
Skills and experience:Mr Quillen is a lawyer and a London-based US partner
of Linklaters LLP, the global law firm. He is the leader of the firm’s US securities practice. Mr Quillen works on a broad spectrum of securities and finance matters. A particular focus of his practice has been transactions in the CIS and in Central and Eastern Europe. Mr Quillen is an officer of the Securities Law Committee of the International Bar Association, chairing its Underwriting and Distribution Subcommittee, and sits on the Advisory Committee for Securities Regulation in Europe of the Practising Law
Institute. He is a trustee of the University of Virginia Law School Foundation and of UK Friends of Harvard University. Mr Quillen became a partner of Linklaters in 1996 and was resident in the firm’s New York office before transferring to the London office in 2000. He is admitted to practice in New York and the District of Columbia and is a registered foreign lawyer in England and Wales.
Education:Mr Quillen received his undergraduate degree from Harvard and his law degree from the University of Virginia.
Véronique McCarrollIndependent Non-Executive DirectorVéronique McCarroll was appointed as an Independent Non-Executive Director of Bank of Georgia Group PLC on 1 October 2018. Ms McCarroll serves as a member of Bank of Georgia Group PLC’s Risk and Nomination Committees.
Skills and experience:Ms McCarroll has over 30 years’ experience in financial services, with a strong focus
on corporate and investment banking and risk management. She currently sits on the Executive Committee of Mobile Finance, where she heads Strategy and Innovation for Digital banking across Europe. She was until recently an Executive Director at Crédit Agricole CIB, in charge of Strategy and Business Transformation. Prior to joining CACIB in 2016, she spent 19 years in consulting firms, helping large banking
clients on financial matters, including as a Partner at McKinsey & Company (2013-2016), Oliver Wyman (2004-2013) and Andersen/Ernst & Young (1996-2003). Ms McCarroll started her career with Banque Indosuez in Capital Markets in 1986, serving in various front office fixed income and then market risk management roles. Ms McCarroll teaches Finance at Paris Dauphine University.
Education:Ms McCarroll graduated from ESSEC (Ecole Supérieure des Sciences Economiques et Commerciales) in 1985.
Andreas Wolf Independent Non-Executive DirectorAndreas Wolf was appointed as an Independent Non-Executive Director of Bank of Georgia Group PLC on 1 October 2018. Mr Wolf serves as a member of Bank of Georgia Group PLC’s Audit and Nomination Committees and as a member of the Bank’s Supervisory Board.
Skills and experience:Mr Wolf has more than 12 years of experience working
with financial institutions in Central and Eastern Europe as well as Asia. He currently serves as Head of Strategy and Business Development for MHB-Bank AG in Germany. He also serves as an advisor to Raisin, a European deposit brokerage marketplace. Prior to his current positions, Mr Wolf had more than ten years at McKinsey & Company in Frankfurt, where he served as a Partner from 2014 to 2018. At McKinsey, he worked with banking and insurance
clients in Germany, Austria, the Netherlands, Croatia, Georgia, India and China, focusing on digital transformation/ digital attackers, strategy, risk management, operations and sales. Prior to that, Mr Wolf worked as a lecturer in Statistics at the University of Jena for four years.
Education:Mr Wolf holds a PhD in Statistics and Research Methodology from the Friedrich-Schiller-University of Jena, and also studied Psychology at the Universities of Tuebingen, St. Andrews and Jena and graduated with honours.
Archil GachechiladzeCEO
David TsiklauriDeputy CEO, Chief Financial Officer
Levan KulijanishviliDeputy CEO, Operations
Mikheil GomarteliDeputy CEO, Retail Banking (Emerging and Mass Retail, and Micro Business Banking)
Please see page 111 for his biography.
David Tsiklauri was appointed as Deputy CEO, Chief Financial Officer in September 2017, prior to which he served as Deputy CEO, Corporate Investment Banking from July 2017. Mr Tsiklauri has extensive experience in banking as well as the corporate segment in Georgia, having worked as the Deputy CEO in charge of Corporate Banking at TBC Bank since 2014. Prior to that he served as the Vice President of the Capital Markets and Treasury Solutions team at Deutsche Bank since 2011, where he started as an associate in the Debt Capital Markets Department in 2008. Mr Tsiklauri has an MBA degree from London Business School.
Levan Kulijanishvili was appointed as Deputy CEO, Operations in September 2017, prior to which he served as BGEO Group PLC’s CFO and as Deputy CEO, Finance of the Bank from February 2016. He has been with the Bank since 1997. During his 20 years of service, Mr Kulijanishvili has held various senior positions, including Head of Compliance and Internal Control from 2009 until his appointment as Deputy CEO, Finance, Head of the Internal Audit department (2000 to 2009), Manager of the Financial Monitoring, Strategy and Planning department (1999 to 2000) and Head of the Financial Analysis division (1997 to 1999). Mr Kulijanishvili received his undergraduate degree in Economics and Commerce from Tbilisi State University and received his MBA from Grenoble Graduate School of Business.
Following the split of Retail Banking into two segments in February 2017 due to significant growth in the Retail Banking business, Mr Gomarteli assumed the role of Deputy CEO responsible for Emerging and Mass Retail Banking and Micro Business Banking. Prior to this, Mr Gomarteli had served as the sole Deputy CEO of Retail Banking since February 2009. He has been with the Bank since December 1997. During his 20 years of service with the Bank, Mr Gomarteli has held various senior positions, including Co-Head of Retail Banking (March 2007 to February 2009), Head of Business Development (March 2005 to July 2005), Head of Strategy and Planning (2004 to 2005), Head of Branch Management and Sales Coordination (2003 to 2004), Head of Branch Management and Marketing (2002 to 2003) and Head of Banking Products and Marketing (2000 to 2002). Mr Gomarteli received an undergraduate degree in Economics from Tbilisi State University.
Executive management Experienced leadership who deliver our strategy
Board of Directors continued

116 Annual Report 2018 Bank of Georgia Group PLC 117Annual Report 2018 Bank of Georgia Group PLC
Strategic ReportStrategy
Strategic ReportPerformance Governance
FinancialStatements
AdditionalInformation
Strategic ReportOverview
Vasil KhodeliDeputy CEO, Corporate Investment Banking
George ChiladzeDeputy CEO, Chief Risk Officer
Vakhtang Bobokhidze Deputy CEO, Chief Information Officer
Mr Khodeli was appointed as Deputy CEO, Corporate Investment Banking in September 2017, having previously served as Head of Corporate Banking of the Bank since 2004. He has more than 20 years of banking experience and has held various roles with the Bank since 2004. Mr Khodeli has been actively involved in shaping the Bank’s Corporate Banking business platform since its launch. He holds an MBA degree from Grenoble Business School.
Mr Chiladze was appointed as Deputy CEO, Chief Risk Officer in September 2013. He re-joined the Bank having already served as Deputy CEO, Finance from 2008 to 2012. From 2012 to 2013, Mr Chiladze was Deputy CEO at the Partnership Fund, and he served as general director of BTA Bank (Georgia) from 2005 to 2008. Prior to joining BTA Bank, he was an executive member of the Supervisory Board of JSC Europace Insurance Company and a founding partner of the management consulting firm, Altergroup Ltd. Mr Chiladze had previously worked in the US at the Programme Trading Desk at Bear Stearns in New York City, prior to returning to Georgia in 2003. Mr Chiladze received a PhD in Physics from Johns Hopkins University in Baltimore, Maryland and an undergraduate degree in Physics from Tbilisi State University.
Mr Bobokhidze was appointed as Deputy CEO, Chief Information Officer in March 2018, prior to which he served as Head of IT since April 2016. He joined the Bank in late 2005 as a Quality Control Manager through a progression of positions until he joined JSC Bank Republic in 2010. Mr Bobokhidze made his return to the Bank in December 2010 as IT Business Consultant and he currently holds the position Chief Information Officer. He received his undergraduate and MBA degree from Tbilisi State University.
Ramaz KukuladzeDeputy CEO, SME and Premium Retail Business Banking
Mr Kukuladze was appointed as Deputy CEO, SME and Premium Retail Banking in February 2017. Prior to his current role, Mr Kukuladze held the joint role of Chief Commercial Officer and Deputy CEO at Bank Republic since 2013, having previously served as the Chief Commercial Officer since 2011. Before working at Bank Republic, Société Générale Group, Mr Kukuladze spent two years working for Silknet as Deputy CEO, in charge of commercial business. Mr Kukuladze first joined the Bank in 2006 and served as a Deputy CEO, Corporate Banking until 2009. Before joining the Bank, Mr Kukuladze served as CEO of BCI Insurance Company, an insurance company founded by him in 1998, which later was acquired by the Group. Mr Kukuladze received his MBA from IE Business School.
Executive Management continued Nomination Committee ReportPlanning for our future in the best interests of our shareholders
Dear Shareholders,
I am delighted to present the report of the Nomination Committee. The report contains full details of the processes we adopted to appoint our new Chief Executive, Archil Gachechiladze, and our two new Non-Executive Directors, Véronique McCarroll and Andreas Wolf.
In December 2018 it was announced that Kaha Kiknavelidze would be stepping down from the Board and as CEO. The Committee acted quickly to recruit a new CEO who could take the Group forward into the next chapter of its story. After the Committee and candidates underwent the process described herein, Archil Gachechiladze was the unanimous recommendation of the Committee. Archil brings a strong strategic perspective, with an excellent track record of delivering growth in the Georgian banking environment. He is an extremely strong business leader with great drive and will bring these skills and experience to the organisation. The Board is looking forward to working with him.
We were delighted to appoint two new Directors to the Board, Andreas Wolf and Véronique McCarroll, from 1 October 2018. Having carefully reviewed the balance of skills and experience amongst the existing Board members, we identified areas where we thought additional expertise may be required. With more than 12 years’ experience in the financial sector in Europe and Asia, including Georgia, Andreas brings valuable expertise in the field of banking digitisation. Véronique is a highly accomplished professional with more than 30 years’ background in corporate and investment banking, risk management and credit within consulting and technology firms and also at one of the largest banks in the world.
Mr Wolf has also been appointed to the Audit and Nomination Committees, and Ms McCarroll to the Risk and Nomination Committees. We believe that the skills, experience, knowledge and attributes of the members of our Board and Executive Management are the key drivers for successful delivery of the Group’s strategic and financial objectives. These appointments help ensure that fresh perspective and challenge are brought to the decision-making process.
In addition, following the Demerger of the Group, the Committee undertook a significant amount of work to separate some functions of the Investment Business and Banking Business and to reposition the management team. This gave us the opportunity to ensure that there is a pipeline of talent immediately below the Board as part of our overall review of succession planning. We believe that the right mixture of talent, experience and diversity at senior management level is vital to the continued success of the Group and to our aim of attracting and inspiring the best people possible.
I invite you to read more about our work in the following report.
Neil JaninChairman of the Nomination Committee27 March 2019
Neil JaninChairman of the Nomination Committee
118 Annual Report 2018 Bank of Georgia Group PLC 119Annual Report 2018 Bank of Georgia Group PLC
Strategic ReportStrategy
Strategic ReportPerformance Governance
FinancialStatements
AdditionalInformation
Strategic ReportOverview
Using the candidate specification, and mindful of the Diversity Policy discussed below, the Nomination Committee drew up a shortlist of eligible candidates. Before the role was offered to Archil Gachechiladze, he met with each Independent Director to discuss the position. Following these meetings, the Nomination Committee unanimously recommended the appointment of Archil Gachechiladze as CEO and Director to the Board. The Nomination Committee has recommended that the Board support Archil’s election to the Board at our 2019 AGM.
Mr Gachechiladze has commenced an induction programme, including:• meetings with senior management and employees
across the business to understand the Company’s strategy and structure and the Company’s risk profile and risk management procedures;
• meetings with major shareholders and a range of stakeholders, including the Company’s external advisors and senior governmental figures; and
• a session with the Company Sectretary on the statutory and regulatory obligations of the Company.
Appointment of Independent DirectorsWe did not engage an external search consultancy for the appointments of Mr Wolf and Ms McCarroll. Instead, we were provided with a broad range of candidates from our extended network and also from our targeted advertising on websites. This was appropriate because these sources generated a shortlist of candidates with the particular skills the Board had identified during the Demerger process as needing to be filled, from which Mr Wolf and Ms McCarroll were chosen after a series of interviews.
A full induction programme was provided to Mr Wolf and Ms McCarroll, including an explanation of the requirements placed upon Directors by UK law.
Continuing education and trainingDuring the year, Committee members received training on the National Bank of Georgia’s new Corporate Governance Code for Commercial Banks and both the current and new UK Corporate Governance Codes, including the required composition of the Board and Board Committees, and proposed changes to the UK Corporate Governance Code and diversity initiatives.
Diversity policyThe Board has adopted a Diversity policy, mirroring current best practice, which was most recently reviewed in December 2018.
Diversity of skills, background, experience, knowledge, outlook, approach, gender, nationality and ethnicity, amongst other factors, will be taken into consideration when seeking to appoint a new Director to the Board. Similarly, we are clear that diversity of outlook and approach, while inevitably being difficult to measure, may be equally as important.
As a Board, we are supportive of the ambition shown in recent reviews on diversity, including the Davies Review and the Hampton-Alexander Review, and will continue to examine ways in which we can increase female representation at Board and senior management level. While we do not currently employ any formal diversity targets at Board level, the Nomination Committee will continue to keep this approach under review.
The Nomination Committee was pleased to note the November 2018 edition of the Hampton-Alexander Review report, which indicated that the Bank of Georgia Group PLC was one of the highest performing banks listed in the FTSE 350: the Group’s female representation in executive committee and direct reporting positions, a combined total of 40.7%, is considerably above the average in the FTSE 350 (30.7%). This is a tribute to some of the talent development and management processes and initiatives we have in place, detailed below.
We are committed to sustaining and developing our gender balance and wider diversity in 2019 and will oversee the following initiatives to help us achieve these goals:
1. Women leaders mentoring programme: Each woman in the Leadership Talent Pool (currently 49 in total) will have an individual development plan tailored to her developmental areas. Nine will be nominated as candidates for progression to Management Board level and will be mentored by Management Board members to offer practical guidance and experience.
2. Entrepreneurs’ event: A free event, tailored towards female entrepreneurs, will aim to promote and support the success of small start-up companies and charities, by providing advice on business-related issues, such as legal, marketing and HR.
3. Sessions for staff with Board members and successful Georgian women leaders: In a “business café” style setting, we will share stories of success between guests and staff, and host discussion sessions on other related issues.
Nomination Committee Report continued
The role of the Nomination CommitteeThe role of the Nomination Committee is to assist in ensuring that the Board comprises individuals who are best able to discharge the responsibilities of Directors, having regard to the highest standards of governance, the strategic direction of the Group and ambitions of the Board in respect of diversity and inclusion. We also monitor the processes in place to ensure that the Group appoints excellent executive managers capable of successfully guiding their teams and delivering the Group’s strategic objectives.
In summary, the key responsibilities of the Nomination Committee include:• a regular review of the composition of the Board
and its Committees to ensure they are appropriately constituted and balanced in terms of gender, social and ethnic backgrounds, cognitive and personal strengths, and balance in terms of skills, experience, independence, and knowledge;
• responsibility for identifying and nominating for the approval of the Board, candidates to fill Board vacancies as and when they arise;
• giving full consideration to succession planning for Directors, including the Chairman and CEO and other senior executives, taking into account the challenges and opportunities facing the Company, and the skills and expertise needed on the Board in the future;
• keeping under review the leadership needs of the Company, both executive and non-executive, with a view to ensuring the continued ability of the Company to compete effectively in the marketplace;
• making recommendations to the Board on the re-appointment of any Non-Executive Director at the conclusion of their specified term of office having given due regard to their performance and ability to continue to contribute to the Board in light of the knowledge, skills and experience required and their independence; and
• making recommendations to the Board concerning the re-election by shareholders of Directors under the annual re-election provisions of the UK Corporate Governance Code or the retirement by rotation provisions in the Company’s Articles of Association, having due regard to their performance and ability to continue to contribute to the Board in light of the knowledge, skills and experience required and their independence, bearing in mind the need for progressive refreshing of the Board (particularly in relation to Directors being re-elected for a term beyond six years).
The Nomination Committee undertook a review of its Terms of Reference in December 2018 and agreed upon necessary revisions to ensure the responsibilities of the Committee were aligned with those set out in the 2018 UK Corporate Governance Code, which applies to the Group from 1 January 2019. The full Terms of Reference are available on our website at https://bankofgeorgiagroup.com/governance/documents.
Composition and members’ meeting attendance The composition of the Nomination Committee and the members’ meeting attendance for the year are set out in the Board and Committee Meeting Attendance table on page 106.
In order to maintain the right balance of skills and knowledge on our Board, the Nomination Committee keeps Board composition under continual review. In addition, as part of the Board effectiveness review, the Committee asks Board members to evaluate their own contribution. For each Non-Executive Director, the Nomination Committee reviews the time commitment required by them, taking into account any external directorships, their length of service as well as independence of character and integrity. It then recommends to the Board whether each Non-Executive Director should be re-appointed.
Following careful consideration of a range of factors, including Directors’ other commitments and the outcomes of this year’s Board and Committee effectiveness review, which concluded that the Board functions as an effective and efficient team, and with regard to the required skills on the Board to meet current and future priorities, the Committee is pleased to recommend to shareholders, through the Board, the election of Neil Janin, Archil Gachechiladze, Hanna Loikkanen, Tamaz Georgadze, Al Breach, Jonathan Muir, Cecil Quillen, Véronique McCarroll, and Andreas Wolf at our 2019 Annual General Meeting.
Appointment of the Chief Executive OfficerFollowing the announcement of Kaha Kiknavelidze’s intention to step down from the Board, the Nomination Committee acted quickly to find and appoint a new Chief Executive Officer and Board member. As an initial step, the role description and candidate specification were drawn up and agreed by the Nomination Committee. Detailed qualities and requirements included candidates’ approach to strategy, mode of leadership, engagement with stakeholders, ability to deliver financial KPIs, certain values and qualities (including those promoted by our Talent development programmes, on pages 119 to 120) and their experience in banking. Exploratory talks were held with a global recruitment agency but, given Committee members’ knowledge of potential candidates in the Georgian market, the Nomination Committee decided that no additional value would be obtained through appointment of external advisors to assist with the search.
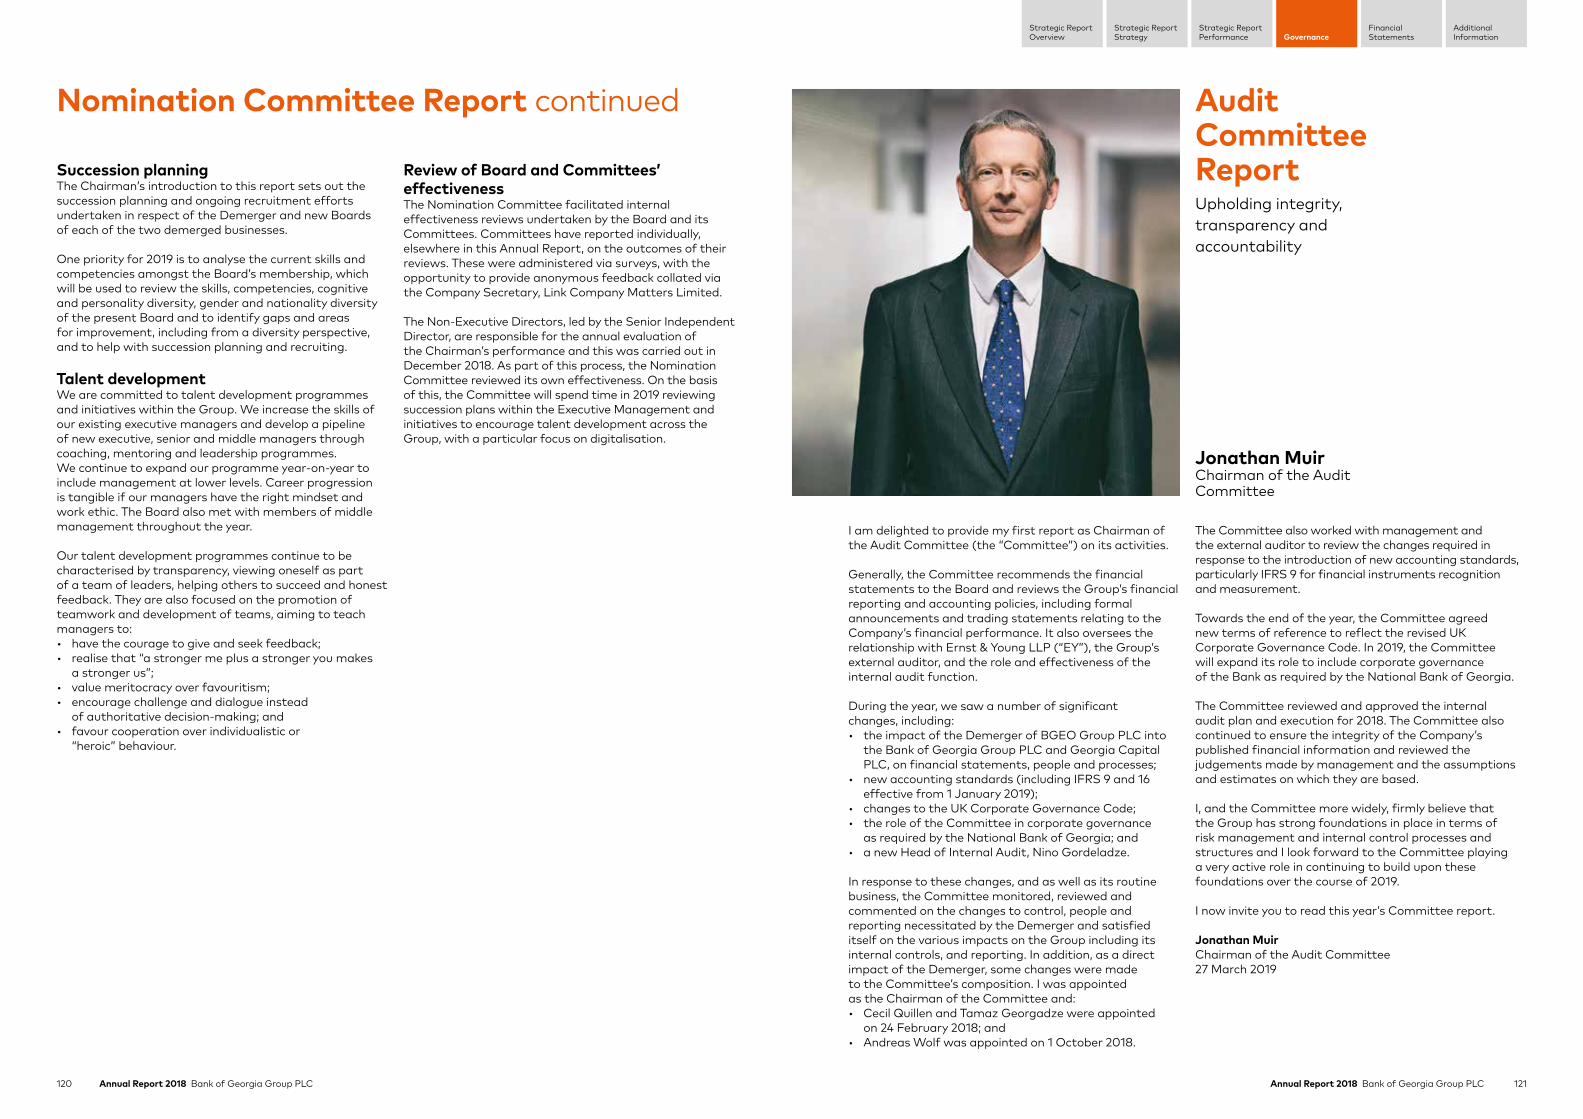
120 Annual Report 2018 Bank of Georgia Group PLC 121Annual Report 2018 Bank of Georgia Group PLC
Strategic ReportStrategy
Strategic ReportPerformance Governance
FinancialStatements
AdditionalInformation
Strategic ReportOverview
Succession planningThe Chairman’s introduction to this report sets out the succession planning and ongoing recruitment efforts undertaken in respect of the Demerger and new Boards of each of the two demerged businesses.
One priority for 2019 is to analyse the current skills and competencies amongst the Board’s membership, which will be used to review the skills, competencies, cognitive and personality diversity, gender and nationality diversity of the present Board and to identify gaps and areas for improvement, including from a diversity perspective, and to help with succession planning and recruiting.
Talent developmentWe are committed to talent development programmes and initiatives within the Group. We increase the skills of our existing executive managers and develop a pipeline of new executive, senior and middle managers through coaching, mentoring and leadership programmes. We continue to expand our programme year-on-year to include management at lower levels. Career progression is tangible if our managers have the right mindset and work ethic. The Board also met with members of middle management throughout the year.
Our talent development programmes continue to be characterised by transparency, viewing oneself as part of a team of leaders, helping others to succeed and honest feedback. They are also focused on the promotion of teamwork and development of teams, aiming to teach managers to:• have the courage to give and seek feedback;• realise that “a stronger me plus a stronger you makes
a stronger us”;• value meritocracy over favouritism;• encourage challenge and dialogue instead
of authoritative decision-making; and• favour cooperation over individualistic or
“heroic” behaviour.
Review of Board and Committees’ effectivenessThe Nomination Committee facilitated internal effectiveness reviews undertaken by the Board and its Committees. Committees have reported individually, elsewhere in this Annual Report, on the outcomes of their reviews. These were administered via surveys, with the opportunity to provide anonymous feedback collated via the Company Secretary, Link Company Matters Limited.
The Non-Executive Directors, led by the Senior Independent Director, are responsible for the annual evaluation of the Chairman’s performance and this was carried out in December 2018. As part of this process, the Nomination Committee reviewed its own effectiveness. On the basis of this, the Committee will spend time in 2019 reviewing succession plans within the Executive Management and initiatives to encourage talent development across the Group, with a particular focus on digitalisation.
Nomination Committee Report continued Audit Committee ReportUpholding integrity, transparency and accountability
I am delighted to provide my first report as Chairman of the Audit Committee (the “Committee”) on its activities.
Generally, the Committee recommends the financial statements to the Board and reviews the Group’s financial reporting and accounting policies, including formal announcements and trading statements relating to the Company’s financial performance. It also oversees the relationship with Ernst & Young LLP (“EY”), the Group’s external auditor, and the role and effectiveness of the internal audit function.
During the year, we saw a number of significant changes, including: • the impact of the Demerger of BGEO Group PLC into
the Bank of Georgia Group PLC and Georgia Capital PLC, on financial statements, people and processes;
• new accounting standards (including IFRS 9 and 16 effective from 1 January 2019);
• changes to the UK Corporate Governance Code; • the role of the Committee in corporate governance
as required by the National Bank of Georgia; and• a new Head of Internal Audit, Nino Gordeladze.
In response to these changes, and as well as its routine business, the Committee monitored, reviewed and commented on the changes to control, people and reporting necessitated by the Demerger and satisfied itself on the various impacts on the Group including its internal controls, and reporting. In addition, as a direct impact of the Demerger, some changes were made to the Committee’s composition. I was appointed as the Chairman of the Committee and:• Cecil Quillen and Tamaz Georgadze were appointed
on 24 February 2018; and• Andreas Wolf was appointed on 1 October 2018.
The Committee also worked with management and the external auditor to review the changes required in response to the introduction of new accounting standards, particularly IFRS 9 for financial instruments recognition and measurement.
Towards the end of the year, the Committee agreed new terms of reference to reflect the revised UK Corporate Governance Code. In 2019, the Committee will expand its role to include corporate governance of the Bank as required by the National Bank of Georgia.
The Committee reviewed and approved the internal audit plan and execution for 2018. The Committee also continued to ensure the integrity of the Company’s published financial information and reviewed the judgements made by management and the assumptions and estimates on which they are based.
I, and the Committee more widely, firmly believe that the Group has strong foundations in place in terms of risk management and internal control processes and structures and I look forward to the Committee playing a very active role in continuing to build upon these foundations over the course of 2019.
I now invite you to read this year’s Committee report.
Jonathan MuirChairman of the Audit Committee27 March 2019
Jonathan MuirChairman of the Audit Committee
122 Annual Report 2018 Bank of Georgia Group PLC 123Annual Report 2018 Bank of Georgia Group PLC
Strategic ReportStrategy
Strategic ReportPerformance Governance
FinancialStatements
AdditionalInformation
Strategic ReportOverview
Matter considered Action taken
Pension reform Noted the introduction of mandatory contributions to the Georgian Pension Agency from January 2019, to be recognised as part of salaries and other employee benefit expenses. The Group’s Georgian companies, including the Bank, will double their contributions to employees’ pensions under this initiative.
The Committee also received regular reports on recoveries and write-offs of loans, and a report on non-recurring losses arising from sale of assets.
Internal AuditThe Audit Committee is responsible, on behalf of the Board, for overseeing the Internal Audit function, which serves as the Group’s independent assurance over the adequacy and effectiveness of the systems and processes of risk management and control across the Group.
The Audit Committee monitors the scope, extent and effectiveness of the Group’s Internal Audit function. It reviews and approves the Internal Audit Policy and oversees the internal audit plan, which is designed using a risk-based approach aligned with the overall strategy of the Group. Regular reports are received from Internal Audit on audit activities and significant findings as well as corrective measures and follow-up.
The Head of Internal Audit has direct access to the Audit Committee and the opportunity to discuss matters with the Audit Committee without other members of management present. The Audit Committee also monitors the staffing of the Internal Audit department as well as the relevant qualifications and experience of the team.
A review was also conducted of the effectiveness of the Internal Audit department by considering the progress of Internal Audit against the agreed plan, considering the need to respond to changes in the Group’s business and the external environment. The Audit Committee also considered the quality of the reporting by Internal Audit to the Audit Committee and the ability of Internal Audit to address unsatisfactory results. On this basis, it concluded that the Internal Audit function is effective and respected by management, and that it conforms to the standards set by the Institute of Internal Auditors.
External auditWith respect to our responsibilities for the external audit process on behalf of the Board, the Audit Committee:• approved the annual audit plan, which included setting
the areas of responsibility, scope and materiality of the audit and key risks identified;
• oversaw the audit engagement, including the degree to which the external auditor was able to assess key accounting and audit judgement;
• reviewed the findings of the external audit with the external auditor, including the level of errors identified during the audit;
• monitored management’s responsiveness to the external auditor’s findings and recommendations;
• reviewed the qualifications, expertise and resources of the external auditor;
• monitored the external auditor’s independence, objectivity and compliance with ethical, professional and regulatory requirement;
• reviewed audit fees;• monitored the rotation of key partners in accordance
with applicable legislation; and• recommended the appointment, re-appointment
or removal, as applicable, of the external auditor.
Auditor independenceTo safeguard the auditor’s independence and objectivity, the Group has a policy on non-audit services which is approved and maintained by the Audit Committee. It is available at https://bankofgeorgiagroup.com/governance/documents.
The Audit Committee has formally assessed the independence of EY, which included the review of: (i) a report from EY describing their arrangements to identify, report and manage any conflicts of interest, and their policies and procedures for maintaining independence and monitoring compliance with relevant requirements; and (ii) the value of non-audit services provided by EY. EY has also confirmed its independence throughout the year, within the meaning of the regulations on this matter and in accordance with their professional standards. As indicated in Note 23 of the audited IFRS financial statements for 2018 the total fees paid to EY for the year ended 31 December 2018 were GEL 5.8 million of which GEL 4.2 million related to work other than the audit or review of the interim accounts, from which GEL 2.1 million was paid by demerged entities: JSC Georgia Capital and Georgia Capital PLC.
The ratio of non-audit fees to audit fees exceeds 1:1. However, nearly all of the non-audit fees relate to reporting accountant services provided in relation to the Demerger. The Committee is convinced that appointing EY to undertake these services was the most efficient method of achieving them. The Audit Committee (and EY) do not consider that this work compromises the independence of the external auditor.
Audit Committee Report continued
Composition and operations of the Audit Committee The composition of the Committee complies with the 2016 UK Corporate Governance Code (the “Code”), which provides that the Committee should comprise of at least three Independent Non-Executive Directors. The Committee members are Jonathan Muir (Chairman), Hanna Loikkanen, Cecil Quillen and Andreas Wolf, all of whom are independent. The Board is satisfied that at least one member of the Audit Committee has recent and relevant financial experience and competence relevant to the sector in which the Company operates. Mr Muir is a member of the Institute of Chartered Accountants of England and Wales and has both accounting and auditing experience. Full details of the Committee members’ qualifications can be found on pages 111 to 114 of this Report.
The Audit Committee works to a planned programme of activities focused on key events in the annual financial reporting cycle and standing items that it considers regularly under its Terms of Reference. (The Terms of Reference, as reviewed and updated in December 2018, are available at: https://bankofgeorgiagroup.com/governance/documents). It also reacts to business developments as they arise.
Attendance at meetings by Committee members during the year can be found on page 106 of this Report. The Company Secretary is secretary to the Committee and attends all meetings. The meetings are also attended by the Bank’s Chief Finance Officer, Chief Risk Officer, Head of Internal Audit and Head of Compliance. Representatives of EY also attend meetings. The Group’s Chief Executive Officer, General Counsel and UK General Counsel attend as required.
Private meetingsDuring the year, the Committee met privately, without management present, with the Bank’s CFO, EY and the Head of Internal Audit. The Chairman of the Committee also held discussions with the lead audit partner in advance of meetings. The focus of these private meetings was to encourage discussion of any issues of concern in more detail and directly with the external auditor and Bank’s Head of Internal Audit.
The Chairman of the Audit Committee attends the AGM to respond to any shareholder questions that may be raised on the Audit Committee’s activities.
Key purpose and responsibilitiesOn behalf of the Board, the Audit Committee safeguards high standards of integrity and oversees conduct in financial reporting, internal control and risk management (together with the Risk Committee) and Internal Audit. It also oversees the work of our external auditor. A full description of the Committee’s roles and responsibilities is set out in the Terms of Reference.
The Chairman of the Committee reports to the Board on how it has discharged its responsibilities at a subsequent Board meeting.
Financial reporting The Committee received detailed reporting from the CFO and external auditor in respect of key areas of management judgement, reporting and audit during the year. The Committee and the external auditor, without management present, discussed the key areas of audit focus, the suitability of the accounting policies which have been adopted and whether management’s key reporting estimates and judgements were appropriate. Considering the external auditor’s assessment of risk, but also using our own independent knowledge of the Group, we reviewed and challenged where necessary the actions, estimates and judgements of management in relation to the preparation of the financial statements.
The significant accounting matters and financial judgements considered by the Committee in relation to the financial statements are addressed below.
Matter considered Action taken
Valuation of the Bank’s investment property
Reviewed reports from independent valuers on a sample of the Bank’s properties, as well as broader market research results. In addition, assurance was received from the external auditor’s review of the valuation agency’s assumptions. The Committee was satisfied that market conditions did not warrant a full portfolio revaluation. Separately, the Committee approved the reclassification of a proportion of the portfolio from investment property (IAS 40) to assets held for sale (IFRS 5).
Litigation Reviewed litigation that could be material to the Company and whether a provision for contingent liabilities was required in respect of such cases. For further information please see Note 19 on page 243 of this report.
IFRS 9 and IFRS 16 implementation
Received regular reports on, and discussed with management, the practical measures being put in place to implement IFRS 9 (from 1 January 2018) and IFRS 16 (from 1 January 2019), and were satisfied by progress at year-end.
124 Annual Report 2018 Bank of Georgia Group PLC 125Annual Report 2018 Bank of Georgia Group PLC
Strategic ReportStrategy
Strategic ReportPerformance Governance
FinancialStatements
AdditionalInformation
Strategic ReportOverview
Whistleblowing, conflicts of interest, anti-bribery and anti-corruption, data protection The Committee ensures that there are effective procedures relating to whistleblowing, and a policy is in place allowing staff to confidentially raise any concerns about business practices and is kept under review. In 2018, following the Demerger, the Group also implemented Whistle B, an advanced independent whistleblowing reporting channel and case management tool to replace its existing whistleblowing platform. The Audit Committee also reviewed additional measures being put in place to improve the robustness of the whistleblowing processes.
In line with the new UK Corporate Governance Code 2018, responsibility for the whistleblowing process passed to the Board at the end of the year. However, as part of our broader work on Fraud Risk Management and culture, we will continue to monitor use of the system.
The Committee reviews the Group’s Anti-Bribery and Anti-Corruption Policy and procedures and receives reports from management on a regular basis in relation to any actual or potential wrong-doing. There were no significant findings in 2018. The Audit Committee monitored the introduction of the Group’s response to the new General Data Protection Regulation.
Risk management and internal controls Although the Board assumes ultimate responsibility for the Group’s risk management and internal control framework, its work is supported by both our Committee and the Risk Committee.
The Audit Committee assists the Board in fulfilling its responsibility to review the adequacy and effectiveness of the controls over financial reporting and certain areas of operational risk: IT and information security (including cyber-security), corporate security and similar areas of operational risk and internal and external fraud or misconduct.
The Committee also monitors the Group’s compliance with the corporate governance policies and procedures related to anti-bribery and anti-corruption, conflicts of interest and whistleblowing.
For 2018, the internal audit plan included a thorough risk management and internal control assessment, including compliance with corporate governance policies and procedures. During 2018 and up to the date of this Annual Report and Accounts, Internal Audit did not find any material weaknesses in the risk management processes or internal controls. We challenged the reports by management and Internal Audit and requested data regarding compliance with key policies and procedures related to operational risk.
With respect to external assurance, the Audit Committee reviews the external auditor’s reports to the Audit Committee, which include the external auditor’s observations on risk management and internal financial controls identified as part of its audit. Without management present, the Committee and EY discussed the key areas of audit focus, the suitability of the accounting policies which have been adopted and whether management’s key reporting estimates and judgements were appropriate.
Fair, balanced and understandable reporting The Committee reviewed this Annual Report and Accounts to consider whether it is fair, balanced and understandable and provides the information necessary for shareholders to assess the Group’s performance, business model and strategy. We gained assurance that there is a robust process of review and challenge at different levels within the Group to ensure balance and consistency. We also discussed the overall messages and tone of the Annual Report with the Bank’s CEO and CFO. We also considered other information regarding performance presented to the Board during the period, from both management and the external auditor. After consideration of all this information, we are satisfied that the Annual Report and Accounts are fair, balanced and understandable, and provide the information necessary for shareholders to assess performance, business model and strategy.
Committee effectivenessTowards the end of the year, the Committee reviewed its effectiveness as part of a broader review of all Board committees’ effectiveness facilitated by the Company Secretary. A key development arising from this exercise is a plan to hold quarterly joint discussions with the Risk Committee from 2019 onwards, in addition to the Committee’s current meeting schedule. These will allow the Committee to be more efficient, with time for more detailed examination of matters (“deep dives”) during the Committee’s meetings, and discussion during the joint sessions of issues, primarily operational risks, which cut across both audit and risk.
Audit Committee Report continued
EffectivenessThe Audit Committee has an established framework for assessing the effectiveness of the external audit process. This includes:• a review of the audit plan, including the materiality level
set by the auditor and the process they have adopted to identify financial statement risks and key areas of audit focus;
• regular communications between the external auditor and both the Committee and management, including discussion of regular papers prepared by management and EY;
• regular discussions with EY (without management present) and management (without EY present) to discuss the external audit process;
• a review of the final audit report, noting key areas of auditor judgement and the reasoning behind the conclusions reached;
• a review of EY’s 2018 Transparency Report and the annual FRC Audit Quality Inspection Report of EY; and
• a formal questionnaire issued to all Committee members and to the executive management of the Group leading the audit which covers among other items the quality of the audit and audit team, the audit planning approach and execution, the presence and capabilities of the lead audit partner, the audit team’s communication with the Committee and management and the auditor’s independence and objectivity.
Following the Audit Committee’s assessment of the external auditor, it formed its own judgement (which was consistent with management’s view) and reported to the Board that:• the audit team was sound and reliable, providing
high-quality execution and service;• the quality of the audit work was of a high standard;• EY’s independence and objectivity were affirmed;• EY was able to challenge management on its approach
to key judgements; and• appropriate discussions were held with the Audit
Committee during the audit planning process.
EY was re-appointed by shareholders at the predecessor company’s 2018 BGEO Group plc AGM and the Committee was authorised to set the remuneration of the auditor by 99.96% and 99.90% votes in favour respectively. The Audit Committee has recommended to the Board that EY be appointed under the current external audit contract and EY has expressed its willingness to continue as auditor of the Group. Separate resolutions proposing EY’s appointment and determination of EY’s remuneration by the Committee will be proposed at the 2019 AGM.
Audit tender and lead partner rotation EY was appointed by the Board of BGEO Group plc as Group statutory auditor in 2012, and subsequently re-appointed by shareholders at the 2013 AGM. EY was appointed as auditors of Bank of Georgia Group PLC in 2018 ahead of the Demerger. We believe that appointing EY as our auditor (subject to shareholder approval) is in the best interests of shareholders given EY’s continued independence, objectivity and performance on the audits they have completed, following assessment of their effectiveness by the Committee.
The Company complied with the mandatory audit processes and the Committee complied with the responsibility provisions set out in terms of the Competition and Markets Authority Statutory Audit Services Order 2014 (“CMA Order”) relating to (a) putting the audit services engagement on tender every ten years; and (b) strengthening the accountability of the external auditor to the Committee, including requiring that only the Committee is permitted to agree to the external auditor’s fees and scope of services; influence the appointment of the audit engagement partner; make recommendations regarding the appointment of auditors; and authorise the auditors to carry out non-audit services. The Committee confirms compliance with the provisions of the CMA Order for the year ended 31 December 2018.
The Group will be required to put the external audit contract out to tender no later than 2027 although this date is under review. We continue to review the auditor appointment and, following the Demerger in 2018, will in 2019 consider the appropriate time to next tender for the provision of audit services to the Company. EY appointed John Headley as BGEO Group PLC’s lead audit partner responsible for the Group.
Viability statementIn accordance with the Code, the Directors are required to assess the viability of the Group. In collaboration with the Risk Committee, and considering the recommendations of the FRC guidance, we spent time considering the timeframe over which the viability statement should be made as well as an assessment underlying the period of coverage, which we agreed should be three years. In addition to aligning with the period covered by the Group’s strategy and financial forecasts, this three-year period seems particularly appropriate for BOGG whose business model continues to evolve in a rapidly developing market like that of Georgia. We considered: the Group’s principal risks and uncertainties, including those that will threaten its business model, future performance and solvency or liquidity; the current financial position of the Group, including future cash flows, allocated capital expenditure and funding requirements; prospects; and downside stress tests involving several different scenarios.
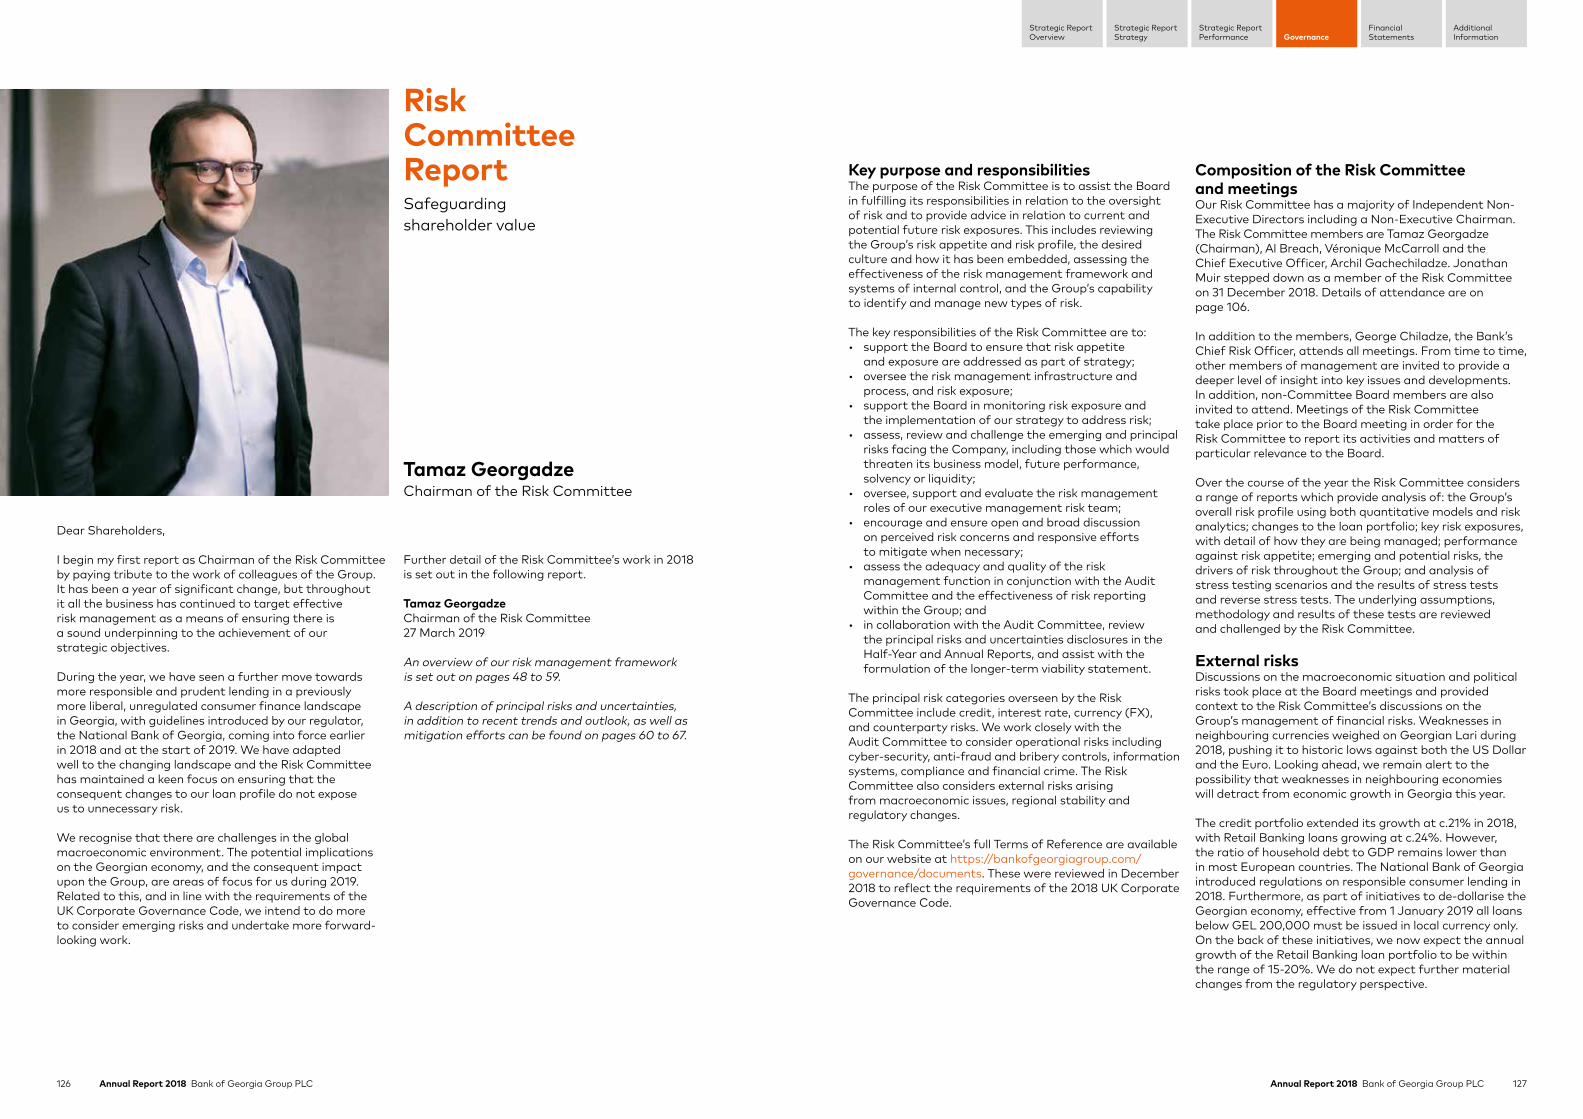
126 Annual Report 2018 Bank of Georgia Group PLC 127Annual Report 2018 Bank of Georgia Group PLC
Strategic ReportStrategy
Strategic ReportPerformance Governance
FinancialStatements
AdditionalInformation
Strategic ReportOverview
Dear Shareholders,
I begin my first report as Chairman of the Risk Committee by paying tribute to the work of colleagues of the Group. It has been a year of significant change, but throughout it all the business has continued to target effective risk management as a means of ensuring there is a sound underpinning to the achievement of our strategic objectives.
During the year, we have seen a further move towards more responsible and prudent lending in a previously more liberal, unregulated consumer finance landscape in Georgia, with guidelines introduced by our regulator, the National Bank of Georgia, coming into force earlier in 2018 and at the start of 2019. We have adapted well to the changing landscape and the Risk Committee has maintained a keen focus on ensuring that the consequent changes to our loan profile do not expose us to unnecessary risk.
We recognise that there are challenges in the global macroeconomic environment. The potential implications on the Georgian economy, and the consequent impact upon the Group, are areas of focus for us during 2019. Related to this, and in line with the requirements of the UK Corporate Governance Code, we intend to do more to consider emerging risks and undertake more forward-looking work.
Further detail of the Risk Committee’s work in 2018 is set out in the following report.
Tamaz Georgadze Chairman of the Risk Committee27 March 2019
An overview of our risk management framework is set out on pages 48 to 59.
A description of principal risks and uncertainties, in addition to recent trends and outlook, as well as mitigation efforts can be found on pages 60 to 67.
Risk Committee ReportSafeguarding shareholder value
Tamaz Georgadze Chairman of the Risk Committee
Key purpose and responsibilitiesThe purpose of the Risk Committee is to assist the Board in fulfilling its responsibilities in relation to the oversight of risk and to provide advice in relation to current and potential future risk exposures. This includes reviewing the Group’s risk appetite and risk profile, the desired culture and how it has been embedded, assessing the effectiveness of the risk management framework and systems of internal control, and the Group’s capability to identify and manage new types of risk.
The key responsibilities of the Risk Committee are to:• support the Board to ensure that risk appetite
and exposure are addressed as part of strategy;• oversee the risk management infrastructure and
process, and risk exposure;• support the Board in monitoring risk exposure and
the implementation of our strategy to address risk;• assess, review and challenge the emerging and principal
risks facing the Company, including those which would threaten its business model, future performance, solvency or liquidity;
• oversee, support and evaluate the risk management roles of our executive management risk team;
• encourage and ensure open and broad discussion on perceived risk concerns and responsive efforts to mitigate when necessary;
• assess the adequacy and quality of the risk management function in conjunction with the Audit Committee and the effectiveness of risk reporting within the Group; and
• in collaboration with the Audit Committee, review the principal risks and uncertainties disclosures in the Half-Year and Annual Reports, and assist with the formulation of the longer-term viability statement.
The principal risk categories overseen by the Risk Committee include credit, interest rate, currency (FX), and counterparty risks. We work closely with the Audit Committee to consider operational risks including cyber-security, anti-fraud and bribery controls, information systems, compliance and financial crime. The Risk Committee also considers external risks arising from macroeconomic issues, regional stability and regulatory changes.
The Risk Committee’s full Terms of Reference are available on our website at https://bankofgeorgiagroup.com/governance/documents. These were reviewed in December 2018 to reflect the requirements of the 2018 UK Corporate Governance Code.
Composition of the Risk Committee and meetings Our Risk Committee has a majority of Independent Non-Executive Directors including a Non-Executive Chairman. The Risk Committee members are Tamaz Georgadze (Chairman), Al Breach, Véronique McCarroll and the Chief Executive Officer, Archil Gachechiladze. Jonathan Muir stepped down as a member of the Risk Committee on 31 December 2018. Details of attendance are on page 106.
In addition to the members, George Chiladze, the Bank’s Chief Risk Officer, attends all meetings. From time to time, other members of management are invited to provide a deeper level of insight into key issues and developments. In addition, non-Committee Board members are also invited to attend. Meetings of the Risk Committee take place prior to the Board meeting in order for the Risk Committee to report its activities and matters of particular relevance to the Board.
Over the course of the year the Risk Committee considers a range of reports which provide analysis of: the Group’s overall risk profile using both quantitative models and risk analytics; changes to the loan portfolio; key risk exposures, with detail of how they are being managed; performance against risk appetite; emerging and potential risks, the drivers of risk throughout the Group; and analysis of stress testing scenarios and the results of stress tests and reverse stress tests. The underlying assumptions, methodology and results of these tests are reviewed and challenged by the Risk Committee.
External risksDiscussions on the macroeconomic situation and political risks took place at the Board meetings and provided context to the Risk Committee’s discussions on the Group’s management of financial risks. Weaknesses in neighbouring currencies weighed on Georgian Lari during 2018, pushing it to historic lows against both the US Dollar and the Euro. Looking ahead, we remain alert to the possibility that weaknesses in neighbouring economies will detract from economic growth in Georgia this year.
The credit portfolio extended its growth at c.21% in 2018, with Retail Banking loans growing at c.24%. However, the ratio of household debt to GDP remains lower than in most European countries. The National Bank of Georgia introduced regulations on responsible consumer lending in 2018. Furthermore, as part of initiatives to de-dollarise the Georgian economy, effective from 1 January 2019 all loans below GEL 200,000 must be issued in local currency only. On the back of these initiatives, we now expect the annual growth of the Retail Banking loan portfolio to be within the range of 15-20%. We do not expect further material changes from the regulatory perspective.
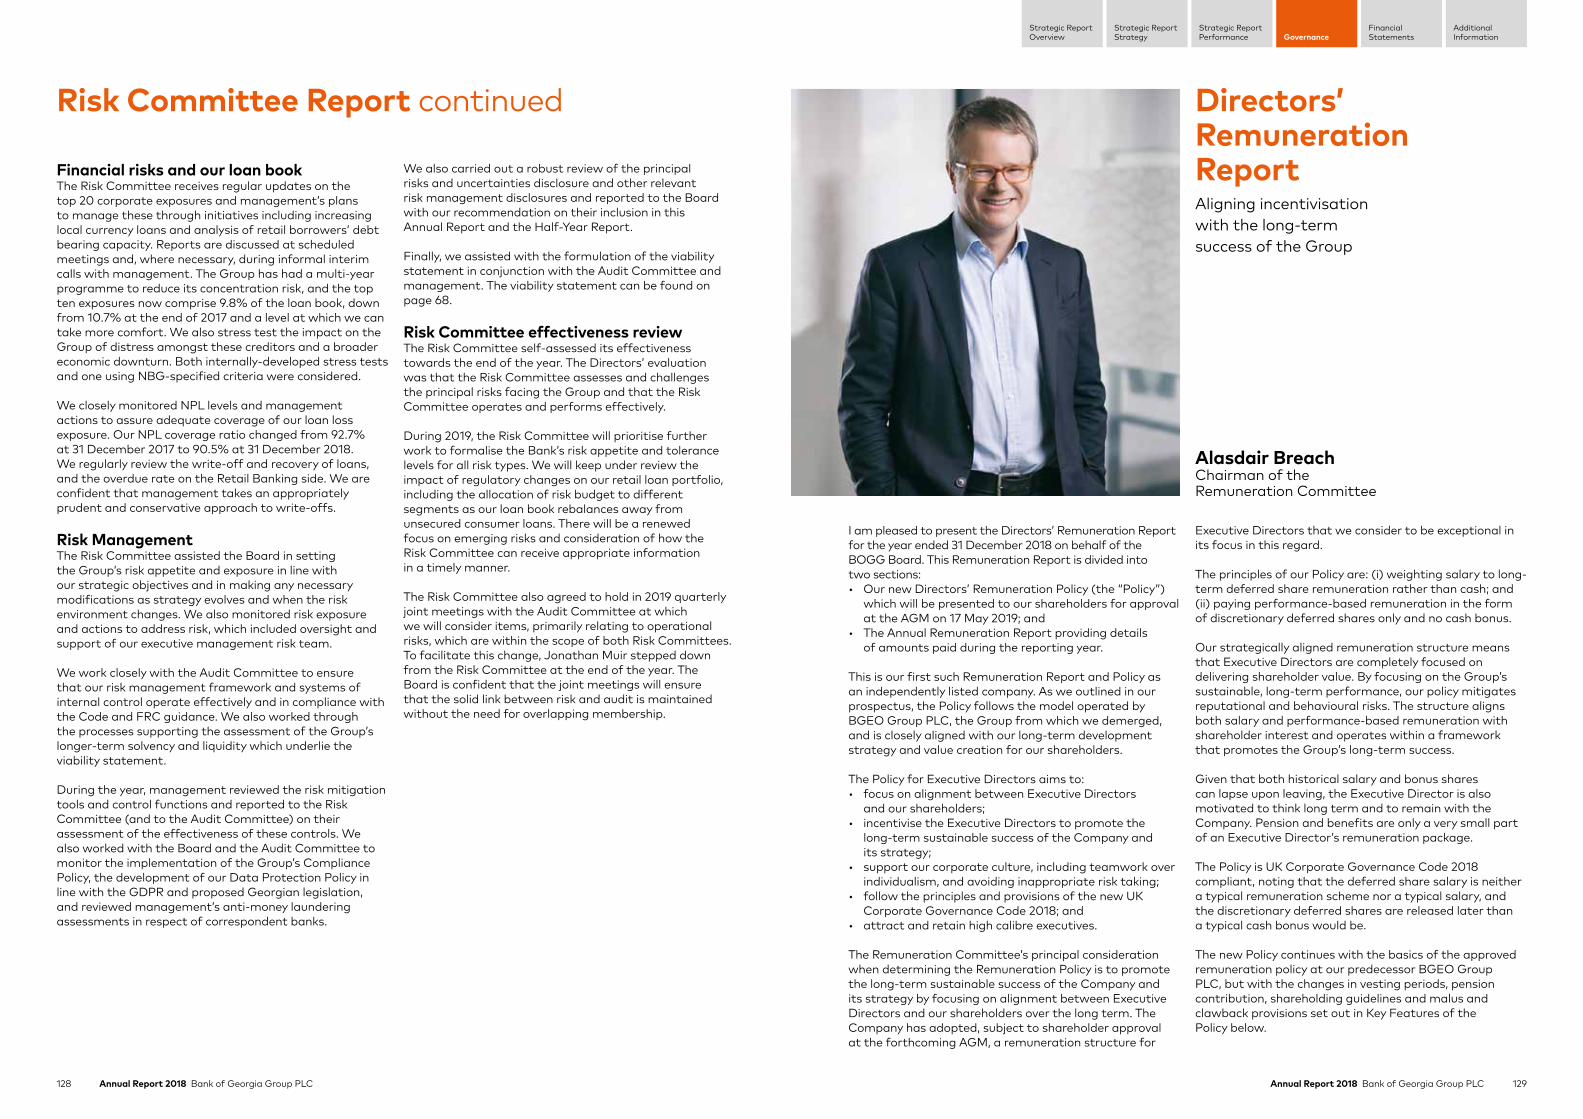
128 Annual Report 2018 Bank of Georgia Group PLC 129Annual Report 2018 Bank of Georgia Group PLC
Strategic ReportStrategy
Strategic ReportPerformance Governance
FinancialStatements
AdditionalInformation
Strategic ReportOverview
Financial risks and our loan bookThe Risk Committee receives regular updates on the top 20 corporate exposures and management’s plans to manage these through initiatives including increasing local currency loans and analysis of retail borrowers’ debt bearing capacity. Reports are discussed at scheduled meetings and, where necessary, during informal interim calls with management. The Group has had a multi-year programme to reduce its concentration risk, and the top ten exposures now comprise 9.8% of the loan book, down from 10.7% at the end of 2017 and a level at which we can take more comfort. We also stress test the impact on the Group of distress amongst these creditors and a broader economic downturn. Both internally-developed stress tests and one using NBG-specified criteria were considered.
We closely monitored NPL levels and management actions to assure adequate coverage of our loan loss exposure. Our NPL coverage ratio changed from 92.7% at 31 December 2017 to 90.5% at 31 December 2018. We regularly review the write-off and recovery of loans, and the overdue rate on the Retail Banking side. We are confident that management takes an appropriately prudent and conservative approach to write-offs.
Risk ManagementThe Risk Committee assisted the Board in setting the Group’s risk appetite and exposure in line with our strategic objectives and in making any necessary modifications as strategy evolves and when the risk environment changes. We also monitored risk exposure and actions to address risk, which included oversight and support of our executive management risk team.
We work closely with the Audit Committee to ensure that our risk management framework and systems of internal control operate effectively and in compliance with the Code and FRC guidance. We also worked through the processes supporting the assessment of the Group’s longer-term solvency and liquidity which underlie the viability statement.
During the year, management reviewed the risk mitigation tools and control functions and reported to the Risk Committee (and to the Audit Committee) on their assessment of the effectiveness of these controls. We also worked with the Board and the Audit Committee to monitor the implementation of the Group’s Compliance Policy, the development of our Data Protection Policy in line with the GDPR and proposed Georgian legislation, and reviewed management’s anti-money laundering assessments in respect of correspondent banks.
We also carried out a robust review of the principal risks and uncertainties disclosure and other relevant risk management disclosures and reported to the Board with our recommendation on their inclusion in this Annual Report and the Half-Year Report.
Finally, we assisted with the formulation of the viability statement in conjunction with the Audit Committee and management. The viability statement can be found on page 68.
Risk Committee effectiveness reviewThe Risk Committee self-assessed its effectiveness towards the end of the year. The Directors’ evaluation was that the Risk Committee assesses and challenges the principal risks facing the Group and that the Risk Committee operates and performs effectively.
During 2019, the Risk Committee will prioritise further work to formalise the Bank’s risk appetite and tolerance levels for all risk types. We will keep under review the impact of regulatory changes on our retail loan portfolio, including the allocation of risk budget to different segments as our loan book rebalances away from unsecured consumer loans. There will be a renewed focus on emerging risks and consideration of how the Risk Committee can receive appropriate information in a timely manner.
The Risk Committee also agreed to hold in 2019 quarterly joint meetings with the Audit Committee at which we will consider items, primarily relating to operational risks, which are within the scope of both Risk Committees. To facilitate this change, Jonathan Muir stepped down from the Risk Committee at the end of the year. The Board is confident that the joint meetings will ensure that the solid link between risk and audit is maintained without the need for overlapping membership.
Risk Committee Report continued Directors’ Remuneration ReportAligning incentivisation with the long-term success of the Group
I am pleased to present the Directors’ Remuneration Report for the year ended 31 December 2018 on behalf of the BOGG Board. This Remuneration Report is divided into two sections:• Our new Directors’ Remuneration Policy (the “Policy”)
which will be presented to our shareholders for approval at the AGM on 17 May 2019; and
• The Annual Remuneration Report providing details of amounts paid during the reporting year.
This is our first such Remuneration Report and Policy as an independently listed company. As we outlined in our prospectus, the Policy follows the model operated by BGEO Group PLC, the Group from which we demerged, and is closely aligned with our long-term development strategy and value creation for our shareholders.
The Policy for Executive Directors aims to:• focus on alignment between Executive Directors
and our shareholders;• incentivise the Executive Directors to promote the
long-term sustainable success of the Company and its strategy;
• support our corporate culture, including teamwork over individualism, and avoiding inappropriate risk taking;
• follow the principles and provisions of the new UK Corporate Governance Code 2018; and
• attract and retain high calibre executives.
The Remuneration Committee’s principal consideration when determining the Remuneration Policy is to promote the long-term sustainable success of the Company and its strategy by focusing on alignment between Executive Directors and our shareholders over the long term. The Company has adopted, subject to shareholder approval at the forthcoming AGM, a remuneration structure for
Executive Directors that we consider to be exceptional in its focus in this regard.
The principles of our Policy are: (i) weighting salary to long-term deferred share remuneration rather than cash; and (ii) paying performance-based remuneration in the form of discretionary deferred shares only and no cash bonus.
Our strategically aligned remuneration structure means that Executive Directors are completely focused on delivering shareholder value. By focusing on the Group’s sustainable, long-term performance, our policy mitigates reputational and behavioural risks. The structure aligns both salary and performance-based remuneration with shareholder interest and operates within a framework that promotes the Group’s long-term success.
Given that both historical salary and bonus shares can lapse upon leaving, the Executive Director is also motivated to think long term and to remain with the Company. Pension and benefits are only a very small part of an Executive Director’s remuneration package.
The Policy is UK Corporate Governance Code 2018 compliant, noting that the deferred share salary is neither a typical remuneration scheme nor a typical salary, and the discretionary deferred shares are released later than a typical cash bonus would be.
The new Policy continues with the basics of the approved remuneration policy at our predecessor BGEO Group PLC, but with the changes in vesting periods, pension contribution, shareholding guidelines and malus and clawback provisions set out in Key Features of the Policy below.
Alasdair BreachChairman of the Remuneration Committee

130 Annual Report 2018 Bank of Georgia Group PLC 131Annual Report 2018 Bank of Georgia Group PLC
Strategic ReportStrategy
Strategic ReportPerformance Governance
FinancialStatements
AdditionalInformation
Strategic ReportOverview
Directors’ Remuneration Report continued
Directors’ Remuneration PolicySubject to shareholder approval, the Policy will take effect from 17 May 2019 at the AGM, and will become formally effective for three years following that date.
It is a provision of this Policy that the Group will honour all pre-existing obligations and commitments that were entered into prior to this Policy taking effect. The terms of those pre-existing obligations and commitments may differ from the terms of the Policy and may include (without limitation) obligations and commitments under service agreements (as detailed in the information below), deferred share remuneration schemes and pension and benefit plans. After the Policy becomes effective after the 2019 AGM, the Group will amend the existing terms of the service contract of the Group’s sole Executive Director and CEO, Archil Gachechiladze, to incorporate the terms of the new Policy.
The Remuneration Committee retains its discretion under the new Policy to make minor amendments to the Policy for regulatory, exchange control, tax or administrative purposes or to take account of a change in legislation without obtaining prior shareholder approval.
The Policy is UK Corporate Governance Code 2018 compliant, noting that the deferred share salary is neither a typical remuneration scheme nor a typical salary, and the discretionary deferred shares are released later than a typical cash bonus.
Executive directors’ Remuneration PolicyThe Policy provides for an Executive Director’s remuneration package to be comprised of the elements set forth below. For the avoidance of doubt, all references to Executive Directors refer to the Executive Directors of Bank of Georgia Group PLC, to cover the present Executive Director Archil Gachechiladze and any future Executive Directors of BOGG PLC while this Policy is in force. The compensation structure of the Executive Management Team (who serve on the Management Board of the Bank but who are not Executive Directors of BOGG PLC) is set by the Remuneration Committee and is modelled on the Policy but is not bound by it. The Remuneration Committee can set different vesting or other terms and conditions for some or all of the Executive Management Team as the Remuneration Committee thinks appropriate.
Key features of the Policy:Weighting salary to deferred share remuneration rather than cash. The majority of the salary will be in deferred shares which vest in tranches over five years from the beginning of the work year.
Paying performance-based remuneration in the form of discretionary deferred shares only. No cash bonus and no LTIP. This will be subject to annual performance targets and the discretion of the Remuneration Committee. The discretionary deferred shares will vest on a phased basis (40% in year two and 60% in year three after award), have a two-year holding period and have total maximum vesting and holding period of five years.
Pension contribution by the Company to be the same (2%) as for Group employees: A 2% company pension contribution for Executive Directors is proposed in line with that available for the wider workforce, together with an executive benefits package that is reflective of market practice.
Shareholding guidelines during and post employment: Executive Directors to build and maintain a shareholding equivalent to 200% of cash plus deferred share salary, with a requirement that a departing Executive Director maintains the required shareholding for two years post-employment. Indeed, given the pay structure, an Executive Director who has been with the Company more than a couple of years will naturally hold a higher amount in unvested shares at any given time.
Malus and clawback provisions: Malus and clawback provisions have been extended consistent with UK best practice, with specific triggers set out on page 136. These provisions are in addition to the unusual structure of remuneration whereby part of the salary is paid in deferred share salary and no bonuses are paid in cash. Both unvested salary shares and discretionary shares lapse if the service contract is terminated under certain circumstances.
Other activities of the Remuneration CommitteeSince the Demerger, the Remuneration Committee has also considered and awarded the discretionary deferred shares for Kaha Kiknavelidze, the sole Executive Director until early 2019. Mr Kiknavelidze’s performance against financial KPIs set pre-Demerger was strong, with targets met or exceeded except where new external factors influenced some of the results against target. The Remuneration Committee also took into account non-financial matters as explained further below. Further detail on the performance targets and the level of performance achieved can be found on pages 142 and 143.
Other activities of the Remuneration Committee have included:• considering the revised UK Corporate Governance
Code 2018 and the impact on role and remit of the Remuneration Committee;
• reviewing and recommending updated Terms of Reference for the Remuneration Committee;
• reviewing the Group companies’ remuneration structures;• overseeing the remuneration of, and deciding the
discretionary deferred shares for, senior management, including the executive team, for 2018; and
• determining the remuneration of the new Executive Director, Archil Gachechiladze.
Looking forwardThe Remuneration Committee has devoted a considerable amount of time to considering the executive remuneration framework, and subject to shareholder approval, it is our intention that the new Policy will operate for the next three years as the CEO and Executive Management Team continue to focus on delivering long-term value to you, our shareholders.
We hope that the new Policy will meet with your support at the upcoming 2019 Annual General Meeting.
Alasdair BreachChairman of the Remuneration Committee27 March 2019
This Remuneration Report is split into two sections:• The new Directors’ Remuneration Policy which will be voted on at the 2019 AGM. Subject to approval by
shareholders, the new Policy will apply from the 2019 AGM.• The Annual Report on Remuneration (set out on pages 129 to 148) which includes the Annual Statement by the
Chairman of the Remuneration Committee, describes the implementation of Bank of Georgia Group PLC’s Directors’ Remuneration Policy and discloses the amounts earned relating to the year ended 31 December 2018. The Annual Report on Remuneration will be subject to an advisory vote at the 2019 AGM.
The Remuneration Report complies with the provisions of the Companies Act 2006 and Schedule 8 of The Large and Medium-sized Companies and Groups (Accounts and Reports) Regulations 2008. The Remuneration Report has been prepared in line with the recommendations of the new UK Corporate Governance Code 2018 and the requirements of the UKLA Listing Rules.
What is in this report?

132 Annual Report 2018 Bank of Georgia Group PLC 133Annual Report 2018 Bank of Georgia Group PLC
Strategic ReportStrategy
Strategic ReportPerformance Governance
FinancialStatements
AdditionalInformation
Strategic ReportOverview
Directors’ Remuneration Report continued
Performance-based remuneration – discretionary deferred sharesPurpose and link to strategy Operation Opportunity
• In the context of overall Group performance, to motivate and reward an Executive Director in relation to his or her contribution to the achievement of the KPIs set for him or her by the Remuneration Committee towards the beginning of the year.
• Performance-based remuneration solely in the form of deferred shares (no cash): - Closely aligns the interests of an Executive Director with shareholders.
- Avoids inappropriate risk taking for short-term gain.
- Encourages long-term commitment to the Group.
• Performance-based remuneration is awarded annually entirely in the form of nil-cost options over shares which are subject to vesting (“discretionary deferred shares”). BOGG does not award cash bonuses to Executive Directors.
• The Remuneration Committee will determine annually the number of shares to be awarded based on the Executive Director’s achievement of his/her KPIs set for the work year and the performance of the Group during that year. If appropriate, where a strategic change or change in business circumstances has made one or more of the KPIs an inaccurate gauge of the Executive Director’s performance, the Remuneration Committee may decide to base its assessment on alternative measures. The Remuneration Committee also has the discretion to consider the performance of the individual and the Group as a whole. The outcome of the Executive Director’s performance and the Remuneration Committee’s determination will be reported in the Directors’ Remuneration Report for the work year in consideration.
• Any discretionary deferred shares will normally be granted following the end of the work year, although the Remuneration Committee retains the discretion to determine the timing of the awards. Any discretionary deferred shares will vest 40% on the third and 60% on the fourth anniversary of the start of the work year (effectively over four years from the beginning of the work year).
• Each tranche will be subject to a further holding period of two years.
• Upon vesting, the Executive Director also receives cash payments equal to the dividends paid on the underlying shares between the date the award was made and the vesting date.
• KPIs for the Executive Director are set near the start of each work year and reflect the Executive Director’s targeted contribution to the Group’s overall key strategic and financial objectives for the work year. KPIs may also include non-tangible factors such as self-development, mentoring and social responsibility.
• There is no contractual right to discretionary deferred shares and the Remuneration Committee reserves the right to award no discretionary deferred share remuneration if the Group’s performance is unsatisfactory.
• Extended malus and clawback, in addition to lapse provisions (natural malus) apply as set out in the notes to this Policy table.
• The maximum number of discretionary deferred shares that may be awarded in respect of the previous work year is capped at 100% of total salary (i.e. cash and deferred share salary), calculated as set out in the notes to this Policy table.
PensionPurpose and link to strategy Operation Opportunity
• The Group is required to comply with pension requirements set by the Georgian Government.
• Pension provision is the same for all employees in the Group in Georgia.
• Pension provision will be in line with Georgian pension legislation, which may change from time to time.
• The most recent pension legislation that the Bank must comply with has been in effect since January 2019.
• There is no provision for the recovery or withholding of pension payments.
• In line with current Georgian legislation, the Executive Director and the Bank each contribute 2% of total remuneration from the Bank, and the Georgian Government may contribute a further small amount (0-2% depending on income levels).
• Pension contributions will only increase above this level if mandated by Georgian legislation or if mandated by any other applicable legislation.
• The same arrangement applies to employees across the Group in Georgia.
Salary in the form of cash and long-term deferred sharesPurpose and link to strategy Operation Opportunity
• To closely align the Executive Directors’ and shareholders’ interests.
• To promote long-term value creation and share price growth.
• To reflect the role and required duties, skills, experience and individual contribution to the Group.
• To encourage commitment to the Group and to recruit and retain high-calibre talent.
• The level of base salary for an Executive Director is fixed in his or her service agreements. The level of salary is reviewed by the Remuneration Committee when a service agreement is up for renewal or if there is a significant change in circumstances and the Executive Director and Remuneration Committee agree to consequent changes in their agreements, for example the implementation of a new Remuneration Policy.
• Salary is comprised principally of long-term deferred shares (“deferred share salary”), plus a cash salary.
• Deferred share salary is awarded in the form of nil-cost options annually in respect of the work year, and is usually expected to be awarded towards the beginning of the work year. It is noted that none of the deferred share salary vests during the work year or the year after; and also it is subject to pro rata lapse in the event an incomplete year is worked.
• Deferred share salary in respect of a work year will vest over five years from the start of the year in which the salary is earned as follows: 25% will vest on each of the second, third, fourth and fifth anniversary of the start of the work year.
• Upon vesting the Executive Director also receives cash payments equal to the dividends paid on the underlying shares between the date the award was made and the vesting date.
• Lapse provisions (natural malus) are built into the deferred share salary as set out in the notes to this Policy table. Extended malus and clawback provisions do not apply to the deferred share salary as the awards attach to salary already earned. Instead the Remuneration Committee considers the discretionary deferred salary as a sufficiently large pool from which to apply the extended malus and clawback provisions if necessary in the circumstances to do so.
• The level of cash salary and number of deferred salary shares are set in the Executive Directors’ service agreements, and will be no more than the Remuneration Committee considers reasonable based on his or her duties, skills and experience. In the event that another Executive Director is appointed, the value of his or her total salary and his or her bonus opportunity (i.e. the discretionary deferred shares) is not expected to exceed that of the CEO at the time.
• The Remuneration Committee has the discretion to change the split of total salary between the cash salary and the deferred share salary.
Cash salary• The total amount payable to
the current CEO and Executive Director, Mr Gachechiladze, is US$ 370,000 per annum.
Deferred share salary• The total number of deferred
share salary shares for Mr Gachechiladze is fixed at 75,000 per annum.
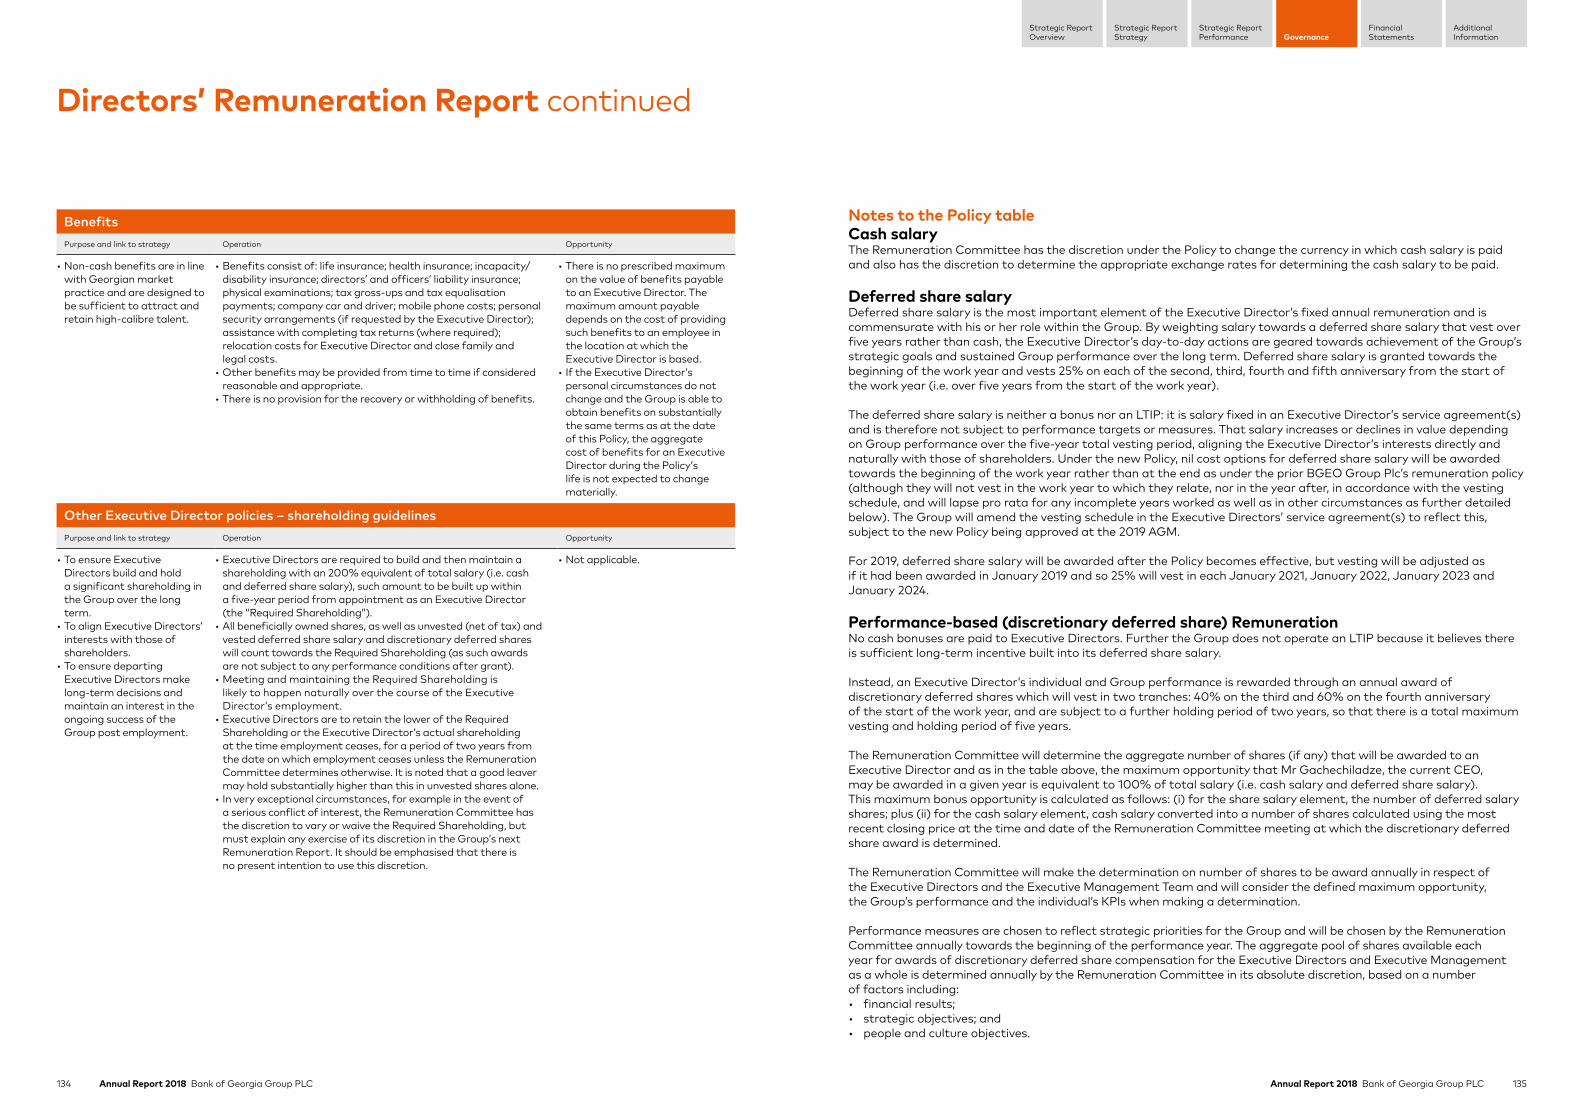
134 Annual Report 2018 Bank of Georgia Group PLC 135Annual Report 2018 Bank of Georgia Group PLC
Strategic ReportStrategy
Strategic ReportPerformance Governance
FinancialStatements
AdditionalInformation
Strategic ReportOverview
Directors’ Remuneration Report continued
Notes to the Policy table Cash salaryThe Remuneration Committee has the discretion under the Policy to change the currency in which cash salary is paid and also has the discretion to determine the appropriate exchange rates for determining the cash salary to be paid.
Deferred share salaryDeferred share salary is the most important element of the Executive Director’s fixed annual remuneration and is commensurate with his or her role within the Group. By weighting salary towards a deferred share salary that vest over five years rather than cash, the Executive Director’s day-to-day actions are geared towards achievement of the Group’s strategic goals and sustained Group performance over the long term. Deferred share salary is granted towards the beginning of the work year and vests 25% on each of the second, third, fourth and fifth anniversary from the start of the work year (i.e. over five years from the start of the work year).
The deferred share salary is neither a bonus nor an LTIP: it is salary fixed in an Executive Director’s service agreement(s) and is therefore not subject to performance targets or measures. That salary increases or declines in value depending on Group performance over the five-year total vesting period, aligning the Executive Director’s interests directly and naturally with those of shareholders. Under the new Policy, nil cost options for deferred share salary will be awarded towards the beginning of the work year rather than at the end as under the prior BGEO Group Plc’s remuneration policy (although they will not vest in the work year to which they relate, nor in the year after, in accordance with the vesting schedule, and will lapse pro rata for any incomplete years worked as well as in other circumstances as further detailed below). The Group will amend the vesting schedule in the Executive Directors’ service agreement(s) to reflect this, subject to the new Policy being approved at the 2019 AGM.
For 2019, deferred share salary will be awarded after the Policy becomes effective, but vesting will be adjusted as if it had been awarded in January 2019 and so 25% will vest in each January 2021, January 2022, January 2023 and January 2024.
Performance-based (discretionary deferred share) RemunerationNo cash bonuses are paid to Executive Directors. Further the Group does not operate an LTIP because it believes there is sufficient long-term incentive built into its deferred share salary.
Instead, an Executive Director’s individual and Group performance is rewarded through an annual award of discretionary deferred shares which will vest in two tranches: 40% on the third and 60% on the fourth anniversary of the start of the work year, and are subject to a further holding period of two years, so that there is a total maximum vesting and holding period of five years.
The Remuneration Committee will determine the aggregate number of shares (if any) that will be awarded to an Executive Director and as in the table above, the maximum opportunity that Mr Gachechiladze, the current CEO, may be awarded in a given year is equivalent to 100% of total salary (i.e. cash salary and deferred share salary). This maximum bonus opportunity is calculated as follows: (i) for the share salary element, the number of deferred salary shares; plus (ii) for the cash salary element, cash salary converted into a number of shares calculated using the most recent closing price at the time and date of the Remuneration Committee meeting at which the discretionary deferred share award is determined.
The Remuneration Committee will make the determination on number of shares to be award annually in respect of the Executive Directors and the Executive Management Team and will consider the defined maximum opportunity, the Group’s performance and the individual’s KPIs when making a determination.
Performance measures are chosen to reflect strategic priorities for the Group and will be chosen by the Remuneration Committee annually towards the beginning of the performance year. The aggregate pool of shares available each year for awards of discretionary deferred share compensation for the Executive Directors and Executive Management as a whole is determined annually by the Remuneration Committee in its absolute discretion, based on a number of factors including:• financial results; • strategic objectives; and• people and culture objectives.
Benefits Purpose and link to strategy Operation Opportunity
• Non-cash benefits are in line with Georgian market practice and are designed to be sufficient to attract and retain high-calibre talent.
• Benefits consist of: life insurance; health insurance; incapacity/disability insurance; directors’ and officers’ liability insurance; physical examinations; tax gross-ups and tax equalisation payments; company car and driver; mobile phone costs; personal security arrangements (if requested by the Executive Director); assistance with completing tax returns (where required); relocation costs for Executive Director and close family and legal costs.
• Other benefits may be provided from time to time if considered reasonable and appropriate.
• There is no provision for the recovery or withholding of benefits.
• There is no prescribed maximum on the value of benefits payable to an Executive Director. The maximum amount payable depends on the cost of providing such benefits to an employee in the location at which the Executive Director is based.
• If the Executive Director’s personal circumstances do not change and the Group is able to obtain benefits on substantially the same terms as at the date of this Policy, the aggregate cost of benefits for an Executive Director during the Policy’s life is not expected to change materially.
Other Executive Director policies – shareholding guidelinesPurpose and link to strategy Operation Opportunity
• To ensure Executive Directors build and hold a significant shareholding in the Group over the long term.
• To align Executive Directors’ interests with those of shareholders.
• To ensure departing Executive Directors make long-term decisions and maintain an interest in the ongoing success of the Group post employment.
• Executive Directors are required to build and then maintain a shareholding with an 200% equivalent of total salary (i.e. cash and deferred share salary), such amount to be built up within a five-year period from appointment as an Executive Director (the “Required Shareholding”).
• All beneficially owned shares, as well as unvested (net of tax) and vested deferred share salary and discretionary deferred shares will count towards the Required Shareholding (as such awards are not subject to any performance conditions after grant).
• Meeting and maintaining the Required Shareholding is likely to happen naturally over the course of the Executive Director’s employment.
• Executive Directors are to retain the lower of the Required Shareholding or the Executive Director’s actual shareholding at the time employment ceases, for a period of two years from the date on which employment ceases unless the Remuneration Committee determines otherwise. It is noted that a good leaver may hold substantially higher than this in unvested shares alone.
• In very exceptional circumstances, for example in the event of a serious conflict of interest, the Remuneration Committee has the discretion to vary or waive the Required Shareholding, but must explain any exercise of its discretion in the Group’s next Remuneration Report. It should be emphasised that there is no present intention to use this discretion.
• Not applicable.
136 Annual Report 2018 Bank of Georgia Group PLC 137Annual Report 2018 Bank of Georgia Group PLC
Strategic ReportStrategy
Strategic ReportPerformance Governance
FinancialStatements
AdditionalInformation
Strategic ReportOverview
Consideration of employment conditions elsewhere in the GroupRemuneration packages for all Group employees comprise both fixed and variable elements. In accordance with prevailing commercial practice, the Remuneration Committee does not formally consult with employees in preparing the Remuneration Policy but in determining an Executive Director’s remuneration, the Remuneration Committee considers:(i) pay and employment conditions of senior management (including Executive Management);(ii) pay and employment conditions across the Group as a whole;(iii) whether employees across the Group are personally satisfied with the way they are remunerated; and (iv) feedback received from Human Resources Executive Management and other employees in the executive
remuneration structure.
Our employees’ remuneration packages are comprised of cash salary, bonus opportunity and benefits. For Executive Management, the remuneration package is heavily weighted towards deferred shares in the form of nil-cost options which align remuneration of Executive Management with shareholder interest. All employees receive a competitive benefit package in line with Georgian market practice and all Georgian employees are entitled to participate in the national pension scheme on the same terms as applicable to Executive Directors. Other factors taken into consideration are competition in the market place, individual performance and competencies. Usually, exceptional personal performance is recognised through variable pay. The Company also operates an Employee Equity Compensation Plan on a discretionary basis.
For a FTSE 250 company of our size and depth, our Executive Directors and senior management must have the skills, experience, work ethic and attitude required to successfully execute our strategy, meet our objectives and create value for shareholders over the long term. In order to recruit and retain this talent, we must benchmark the value of remuneration against other FTSE companies of similar size and sector listed in the UK.
The remuneration of employees in the Group, other than Executive Director(s) and senior management, is benchmarked against the Georgian Labour Market as this is the most relevant comparator. The Remuneration Committee is regularly informed by Human Resources of remuneration developments across the Group.
The compensation structure of the Executive Management is set by the Remuneration Committee and is modelled on the Policy but the Remuneration Committee is not bound by it when setting the Executive Management’s remuneration. The Remuneration Committee generally awards members of the Executive Management discretionary deferred shares as a bonus to ensure maximum alignment with shareholders and to help set the tone from the top.
Equity Compensation Trusts and dilution limitsThe Bank of Georgia Group operates two employee benefit trusts (EBT), one for senior executives, and the other for employees below the executive level (the “ESOPs”), which hold ordinary shares on trust for the benefit of employees and former employees of the Group, and their dependents, and which is used in conjunction with the Group’s employee share schemes.
The Bank of Georgia Group has committed that new shares issued in satisfaction of share compensation from the time of the Company’s listing on the premium segment of the LSE will not exceed 10% of Bank of Georgia Group’s ordinary share capital over any ten-year period.
Business expensesExecutive Directors are reimbursed for reasonable business expenses incurred in the course of carrying out duties under their service contract, on provision of valid receipts.
Directors’ Remuneration Report continued
The Remuneration Committee does not utilise strict weighting of performance measures; this is in order to ensure that it has flexibility to adjust awards for example, if strategic objectives evolve or if business circumstances change during the year. The Remuneration Committee believes that this flexibility ensures that the Board can work with an Executive Director so that he or she does not take excessive risk to achieve KPIs. Even in a “good” year for an Executive Director (e.g. achievement of most of his or hers KPIs), if this coincides with a “bad” year for the Group (e.g. markets have turned), the Remuneration Committee has the discretion to award little or no discretionary remuneration to the Executive Director if it considers it appropriate to do so. The precise measures will be determined by the Remuneration Committee and disclosed retrospectively in the Remuneration Report following the year of the Remuneration Committee’s determination.
Malus and Clawback Discretionary deferred shares are subject to malus and clawback in the following circumstances:• misconduct in the performance or substantial failure to perform duties by the Executive;• significant financial losses, serious failure of risk management or serious damage to the reputation of BOGG
or the Bank caused by misconduct or gross negligence (including inaction) of the Executive; • material misstatement or material errors in the financial statements that relate to the area of responsibility
of the Executive or can be attributed to action or inaction of the Executive’s performance of their duties; • deliberately misleading BOGG or the Bank in relation to financial performance;• failure to continue to meet the fitness and properness criteria for an Executive of the Bank;• material increase with respect to the required regulatory capital of the Bank that can be attributed to the action
or inaction of the Executive; • misconduct that contributed to the imposition of material regulatory or other similar sanctions; and• payments based on erroneous or misleading data, for which malus and clawback apply to discretionary
deferred remuneration for awarded for the year in question.
Provided that the Policy is approved by shareholders at the AGM 2019, the above provisions will form part of Mr Gachechiladze’s service contract. The Group also intends to amend the Executive Equity Compensation Plan to reflect the above.
Clawback is for up to one year from vesting and for the Group’s current Executive Director and CEO, Mr Gachechiladze, the Group also has unusually strong malus provisions where all unvested shares (including deferred share salary and discretionary deferred shares) lapse when the service contract is terminated under certain circumstances, including for “Cause” such as gross misconduct, failure to perform duties, material breach of obligations and unethical behaviour. This may be several years of deferred share salary and discretionary deferred shares. See the “Termination of the JSC Bank of Georgia service agreement” in the table on page 140.
DiscretionThe Remuneration Committee retains a substantial degree of discretion in relation to discretionary share remuneration. This includes:• the determination of the award, if any;• selection of KPIs, which may vary from year to year in order to align with strategy and financial objectives; • any adjustments required to an Executive Director’s KPIs during the work year when, for example, there has been
a change in strategy or business circumstances which results in one or more KPIs becoming an inaccurate gauge of performance; and
• the discretion to override any formulaic outcomes when it considers it reasonable in the circumstances to do so prior to or upon vesting of discretionary deferred shares.
For the avoidance of doubt the Group shall not award (or shall reduce the amount of the award accordingly) to theextent that such award would cause a breach of the NBG’s capital adequacy requirements and other regulatory ratios.

138 Annual Report 2018 Bank of Georgia Group PLC 139Annual Report 2018 Bank of Georgia Group PLC
Strategic ReportStrategy
Strategic ReportPerformance Governance
FinancialStatements
AdditionalInformation
Strategic ReportOverview
In addition to the components and outside of the limits set out in the Policy table, the Remuneration Committee may also decide to provide to an incoming Executive Director:• Relocation support, tax support and legal fees depending on the individual’s circumstances, including, where relevant,
to his or her family. The Group has not set a maximum aggregate amount that may be paid in respect of any individual’s relocation support, but it will aim to provide support of an appropriate level and quality on the best terms that can reasonably be obtained.
• Upon the recommendation of the Remuneration Committee, a “buy out” incentive award intended to compensate the incoming Executive Director for any awards which were granted to an incoming Executive Director by a previous employer and which have been foregone as a result of an individual’s employment with the Group. In these circumstances, the Group’s approach will be to match the estimated current value of the foregone awards by granting awards of deferred share compensation which vest over a similar period to the awards being bought out. The application of performance conditions and/or clawback provisions may also be considered, where appropriate. Such new awards may be granted in addition to any deferred share salary and discretionary deferred share compensation.
Non-Executive Directors’ Remuneration PolicyThe table below sets out our Policy for the operation of Non-Executive Directors’ fees and benefits at the Company. Each Non-Executive Director also serves as a member of the Supervisory Board of the Bank. It is proposed that, if the Policy is approved, the Non-Executive Director fees stated below will apply in each year that the Policy operates from the date of approval of the Policy.
Purpose and link to strategy Operation Opportunity
• To attract and retain high performing Non-Executive Directors with the requisite skills, knowledge, experience, independence and other attributes to add value to the Group.
• To reflect the responsibilities of time commitment dedicated by Non-Executive Directors.
• All fees are paid in cash on a quarterly basis.• Fees may be reviewed from time to time by the Board
(but not necessarily changed), taking into account the time commitment, responsibilities and the technical skills required to make a valuable contribution to the Board, and by reference to comparators, benchmarking, results of the annual review and other guidance. The fees may also be amended and varied if there are genuinely unforeseen and exceptional circumstances which necessitate such review and in such circumstances any significant increase shall be the minimum reasonably required. The Board reserves the right to structure the Non-Executive Directors’ fee differently in its absolute discretion.
• Non-Executive Directors receive a base fee. Additional Committee fees are payable to compensate for time spent discharging Bank duties and Committee duties.
• There is no remuneration in the form of deferred share salary or discretionary deferred shares, pension contributions, benefits or any variable or performance-linked remuneration or incentives.
• Non-Executive Directors are reimbursed for reasonable business expenses, including travel and accommodation, which are incurred in the course of carrying out duties under their letters of appointment, on provision of valid receipts.
• The maximum aggregate BOGG PLC fees for all Non-Executive Directors which may be paid under BOGG PLC’s Articles of Association is GBP 750,000.
• A specific maximum has not been set for the individual base cash fee.
• The Senior Independent Non-Executive Director receives a higher base fee which reflects the extra time commitment and responsibility.
• The Chairman receives a fee which reflects the extra time commitment and responsibility. The Chairman does not receive Committee fees.
• The fees paid to each Non-Executive Director will be disclosed in the relevant reporting year’s Annual Report.
Service agreements and policy on payments for loss of office for our DirectorsAt the date of this Annual Report, Mr Gachechiladze is the sole Executive Director of the Company. Mr Gachechiladze has a service agreement with an effective date of 28 January 2019 with BOGG for an indefinite term (subject to annual re-election at the AGM) which is terminable by either party on four months’ notice unless for cause where notice served by BOGG shall have immediate effect.
Mr Gachechiladze also has a service agreement with JSC Bank of Georgia with an effective date of 28 January 2019 for an employment term of five years which is terminable by the Company with immediate effect and by the Executive on not less than four months’ notice.
Both documents are available for inspection by shareholders at BOGG’s registered office.
Directors’ Remuneration Report continued
Illustration of application of Remuneration PolicyThe chart below shows an estimate of the remuneration that could be received by Mr Gachechiladze, our sole Executive Director and CEO, in respect of 2019 under the proposed Policy at three different performance levels. The chart represents a full year’s remuneration for illustration purposes.
Fixed cash salary Fixed share salary Discretionary deferred share compensation
Share price growth
23%77%
15%45%
12%39%
9%28%
22%38%
40% 49% 35%
28%
40%
No share price growth
Minimum MaximumTarget Target
No share price growth
No share price growth
50% share price growth
50% share price decline
US$1,789,166
US$3,039,737US$3,575,696
US$4,984,826
US$1,841,976
The 50% share price appreciation disclosure is made voluntarily by the Group (as performance measures are limited to one year) for investor information.
Notes:1. Salary is comprised of cash and deferred salary shares. Mr Gachechiladze’s total cash salary in 2019 in respect of his service agreement with the Group would be US$ 370,000
(noting the chart represents a full year’s salary for illustration purposes). The value of the deferred share salary payable would be US$ 1,381,500 calculated by reference to the closing share price of BOGG on 8 January 2019, the day before the Remuneration Committee meeting, being US$ 18.419 per share (the official share price of GBP 14.468 per share converted into Dollars using an exchange rate of 1.2731, being the official exchange rate published by the Bank of England on the same date). Deferred share salary in respect of 2019 will be formally granted following the 2019 AGM and will vest over five years from the start of the year in which it is earned as follows: 25% will vest in January 2021, 2022, 2023 and 2024. For the purpose of this graph, we have added the value of pension and benefits to cash salary.
2. The means of determining the number of shares underlying the discretionary deferred share remuneration and terms and conditions applicable to this remuneration are described in the Policy table. Discretionary deferred shares in respect of 2019 will be formally granted in 2020 and will vest 40% in January 2022 and 60% in January 2023, and each tranche will be subject to a further two-year holding period following vesting.
3. Minimum opportunity reflects a scenario whereby Mr Gachechiladze receives only fixed remuneration which is salary (cash and deferred share salary), pension contributions and benefits and the Remuneration Committee considers that the Group’s and/or Mr Gachechiladze’s performance in 2019 does not warrant any award of discretionary deferred shares.
4. On-target opportunity reflects a scenario whereby Mr Gachechiladze receives fixed remuneration (as described in 3. above) and discretionary deferred shares with a value of US$ 1,226,050, being 70% of the maximum opportunity (as described in 5. below). In this scenario, the Remuneration Committee considers that the Group’s and Mr Gachechiladze’s performance in 2019 are in line with the Group’s expectations.
5. Maximum opportunity reflects a scenario whereby Mr Gachechiladze receives fixed remuneration (as described in 3. above) and discretionary deferred shares with a value of US$ 1,751,500, being 100% of total salary (i.e. cash and deferred share salary). In this scenario, the Remuneration Committee considers that the Group’s and Mr Gachechiladze’s performance in 2019 warrant the highest possible level of discretionary deferred share remuneration.
6. The Group made a voluntary disclosure of 50% share price appreciation at the maximum opportunity for illustrative purposes. The calculations were based on the share price increasing from US$ 18.419 per share (the share price on 8 January 2019).
7. The Group made a disclosure of 50% share price depreciation at the on-target opportunity for illustrative purposes. The calculations were based on the share price decreasing from US$ 18.419 per share (the share price on 8 January 2019).
8. For long-term incentive awards, disclosure of the value of the award in the event of a 50% share price appreciation is required by the Companies (Miscellaneous Reporting) Regulations 2018. Such disclosure is not required for short-term incentive awards, such as those made by the Group, where performance measures are limited to one year, nor is it required for salary compensation in the form of shares. The reason for this is that an increase in the value of the deferred shares resulting from share price appreciation in the period through to the vesting date is not considered to constitute remuneration for the purposes of the regulations. However, the Group has decided to voluntarily disclose information showing the value of a 50% increase in the share price for investor information.
Policy on the appointment of external hires and internal appointmentsAny new Executive Director appointed to the Board would be paid no more than the Remuneration Committee considers reasonably necessary to attract a candidate with the relevant skills and experience. His or her maximum remuneration package would comprise the components described in the Policy table above. The Remuneration Committee may, at its sole discretion and taking into account the role assumed by the new Executive Director, vary the amount of any component in the package up to the limits set out in the Policy table above in relation to new Executive Directors. This discretion will only be exercised to the extent required to facilitate the recruitment of the particular individual. In addition, the terms and conditions attaching to any component of the remuneration might be varied insofar as the Remuneration Committee considers it necessary or desirable to do so in all the circumstances.

140 Annual Report 2018 Bank of Georgia Group PLC 141Annual Report 2018 Bank of Georgia Group PLC
Strategic ReportStrategy
Strategic ReportPerformance Governance
FinancialStatements
AdditionalInformation
Strategic ReportOverview
There are also garden leave provisions and non-compete provisions which may apply up to six months after termination of the service agreement and during which the Executive Director would be paid salary (including cash salary and deferred share salary) but not bonuses (i.e. discretionary deferred shares).
(3) Termination of Non-Executive Directors’ appointmentsEach Non-Executive Director is required to submit himself or herself for annual re-election at the AGM. The letters of appointment for Non-Executive Directors provide for a one-month notice period although the Group may terminate the appointment with immediate effect without notice or pay in lieu of notice if the Non-Executive Director has committed any serious breach or non-observance of his or her obligations to the Group, is guilty of fraud or dishonesty, brings the Company or him/herself into disrepute or is disqualified as acting as a Non-Executive Director, among other circumstances. Upon termination, the only remuneration a Non-Executive Director is entitled to is accrued fees as at the date of termination together with reimbursement of properly incurred expenses incurred prior to the termination date.
Consideration of shareholder viewsThe Remuneration Committee is committed to an open and transparent dialogue with its shareholders on all aspects of remuneration. The Remuneration Committee seeks to regularly and actively engage with shareholders and shareholder representative bodies, seeking views which will be considered when making decisions about the remuneration framework. The Remuneration Committee consulted its major shareholders on the proposed Policy with letters, follow- up-calls and the offer of face-to-face meetings in early 2019. The Remuneration Committee is grateful for the feedback and the time taken to consider the Remuneration Committee’s proposals.
Annual report on remunerationThe Remuneration Committee and its advisorsThe Remuneration Committee is principally responsible to the Board for establishing a remuneration policy for the Executive Directors, Chairman and designated members of the Executive Management Team that rewards fairly and responsibly and is designed to support the Company’s strategy and promote its long-term sustainable success. The Remuneration Committee’s full Terms of Reference were updated in December 2018 to reflect the requirements of the 2018 UK Corporate Governance Code and are available on our website at https://www.bankofgeorgiagroup.com/governance/documents.
Under these new Terms of Reference, the Remuneration Committee will take into account pay and employment conditions elsewhere in the Group. The Remuneration Committee will also oversee any major changes in employee benefits structures throughout the Group.
The Remuneration Committee is comprised of four independent Non-Executive Directors: Al Breach serves as Chairman; Neil Janin; Tamaz Georgadze; and Cecil Quillen. The members’ attendance is shown in the Board and Committee meetings attendance table on page 106.
In addition to the formal meetings held during the year, the Remuneration Committee participated in various discussions by telephone outside of these meetings. Other attendees at Remuneration Committee meetings who provided advice or assistance to the Remuneration Committee on remuneration matters from time to time included the CEO, the other Board members and UK General Counsel. Attendees at Remuneration Committee meetings do not participate in discussions or decisions related to their own remuneration.
The Remuneration Committee received additional advice on compliance from Baker & McKenzie LLP, the Group’s legal advisors. The Remuneration Committee is of the view that the advice received from Baker & McKenzie LLP is objective and independent.
Shareholder contextThe Group has not held an Annual General Meeting since listing and therefore there are no voting results on which to report. Details of the remuneration-related voting will be reported on in the 2019 Directors’ Remuneration Report.
Directors’ Remuneration Report continued
The Group’s policy towards exit payments allows for a variety of circumstances whereby an Executive Director may leave the business. The Remuneration Committee reserves the right to determine exit payments other than those set out below, where appropriate and reasonable in the circumstances to do so, including where an Executive Director leaves by mutual agreement. The Remuneration Committee may decide to pay some or all of the Executive Director’s legal fees in relation to the termination. In all circumstances, the Remuneration Committee does not intend to reward failure and will make decisions based on the individual circumstances. The Remuneration Committee’s objective is that any such agreements are determined on an individual basis and are in the best interests of the Company and shareholders at the time.
The provisions in section (1) and (2) below summarise the termination and payments for loss of office provisions pursuant to Mr Gachechiladze’s service agreement with BOGG and the Bank respectively. The Remuneration Committee retains the discretion to apply different notice, termination and payment for loss of office provisions to incoming Executive Directors.
(1) Termination of BOGG PLC service agreement Where the service agreement is to be terminated on notice, BOGG may put Mr Gachechiladze on garden leave and continue to pay his cash salary under the BOGG service contract provided that any accrued and unused holiday entitlement shall be deemed to be taken during the garden leave period. BOGG may terminate Mr Gachechiladze’s employment early with immediate effect and without notice or pay in lieu of notice in the case of, among other circumstances, his dishonesty, gross misconduct, gross incompetence, conviction of an offence (other than traffic-related where a non-custodial penalty is imposed) or becoming of unsound mind. BOGG may also terminate the agreement with immediate effect by payment in lieu of notice, in which case the payment in lieu of notice shall be of his basic salary only.
(2) Termination of Bank service agreement Termination reason Separation payments Vesting and lapse of awards
Termination by the Bank for cause. Accrued but not yet paid: salary, dividends (or equivalent amounts), benefits and expenses.
Any unvested awarded deferred share salary and discretionary deferred shares as at the date when the Executive Director ceases to be an Executive Director shall lapse (unless the Remuneration Committee determines otherwise).
Termination by the Bank without cause.
As above but with a leaving allowance and severance payment constituting the immediate monetary value of no less than four months’ salary.
Any unvested awarded deferred share salary and discretionary deferred shares as at the date when the Executive Director ceases to be an Executive Director shall continue to vest in the normal way during the respective vesting period(s).
Termination by the Chief Executive Officer for good reason.
As per termination of the Bank without Cause.
Any unvested awarded deferred share salary and discretionary deferred shares shall vest immediately.
Termination by the Chief Executive Officer without good reason.
Upon serving four months written notice, as per termination of the Company for Cause.
Any unvested awarded deferred share salary and discretionary deferred shares as at the date when the Executive ceases to be an Executive Director shall lapse (unless the Remuneration Committee determines otherwise).
In addition to the vesting and lapse provisions above, in certain circumstances, including if the Executive Director terminates by reason of death or there is a change of control, unvested deferred share salary and discretionary deferred shares shall vest immediately (subject to NBG requirements otherwise). If the Executive Director is not offered a new service contract upon substantially the same terms or continued Board membership at the end of his or her service contract or the Executive Director terminates due to injury, disability, redundancy or retirement, unvested deferred share salary and discretionary deferred shares will continue to vest in the normal way during the respective vesting period(s).
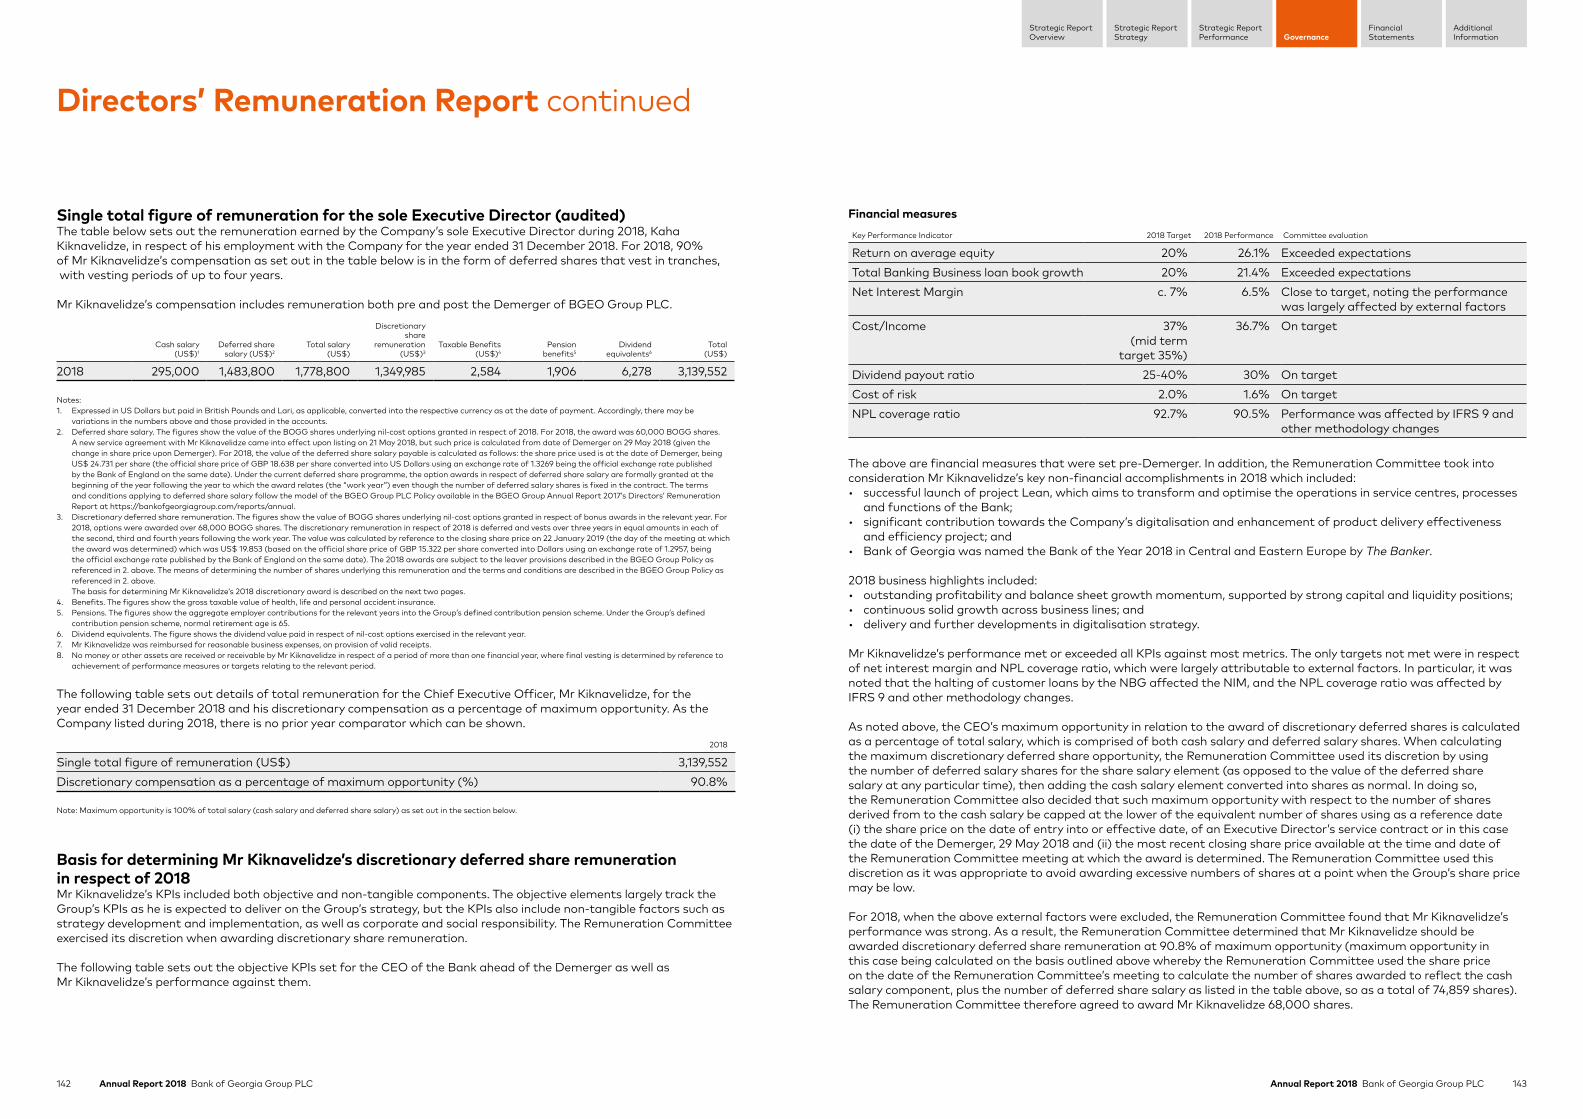
142 Annual Report 2018 Bank of Georgia Group PLC 143Annual Report 2018 Bank of Georgia Group PLC
Strategic ReportStrategy
Strategic ReportPerformance Governance
FinancialStatements
AdditionalInformation
Strategic ReportOverview
Financial measures
Key Performance Indicator 2018 Target 2018 Performance Committee evaluation
Return on average equity 20% 26.1% Exceeded expectationsTotal Banking Business loan book growth 20% 21.4% Exceeded expectationsNet Interest Margin c. 7% 6.5% Close to target, noting the performance
was largely affected by external factorsCost/Income 37%
(mid term target 35%)
36.7% On target
Dividend payout ratio 25-40% 30% On target Cost of risk 2.0% 1.6% On targetNPL coverage ratio 92.7% 90.5% Performance was affected by IFRS 9 and
other methodology changes
The above are financial measures that were set pre-Demerger. In addition, the Remuneration Committee took into consideration Mr Kiknavelidze’s key non-financial accomplishments in 2018 which included:• successful launch of project Lean, which aims to transform and optimise the operations in service centres, processes
and functions of the Bank;• significant contribution towards the Company’s digitalisation and enhancement of product delivery effectiveness
and efficiency project; and• Bank of Georgia was named the Bank of the Year 2018 in Central and Eastern Europe by The Banker.
2018 business highlights included:• outstanding profitability and balance sheet growth momentum, supported by strong capital and liquidity positions; • continuous solid growth across business lines; and• delivery and further developments in digitalisation strategy.
Mr Kiknavelidze’s performance met or exceeded all KPIs against most metrics. The only targets not met were in respect of net interest margin and NPL coverage ratio, which were largely attributable to external factors. In particular, it was noted that the halting of customer loans by the NBG affected the NIM, and the NPL coverage ratio was affected by IFRS 9 and other methodology changes.
As noted above, the CEO’s maximum opportunity in relation to the award of discretionary deferred shares is calculated as a percentage of total salary, which is comprised of both cash salary and deferred salary shares. When calculating the maximum discretionary deferred share opportunity, the Remuneration Committee used its discretion by using the number of deferred salary shares for the share salary element (as opposed to the value of the deferred share salary at any particular time), then adding the cash salary element converted into shares as normal. In doing so, the Remuneration Committee also decided that such maximum opportunity with respect to the number of shares derived from to the cash salary be capped at the lower of the equivalent number of shares using as a reference date (i) the share price on the date of entry into or effective date, of an Executive Director’s service contract or in this case the date of the Demerger, 29 May 2018 and (ii) the most recent closing share price available at the time and date of the Remuneration Committee meeting at which the award is determined. The Remuneration Committee used this discretion as it was appropriate to avoid awarding excessive numbers of shares at a point when the Group’s share price may be low.
For 2018, when the above external factors were excluded, the Remuneration Committee found that Mr Kiknavelidze’s performance was strong. As a result, the Remuneration Committee determined that Mr Kiknavelidze should be awarded discretionary deferred share remuneration at 90.8% of maximum opportunity (maximum opportunity in this case being calculated on the basis outlined above whereby the Remuneration Committee used the share price on the date of the Remuneration Committee’s meeting to calculate the number of shares awarded to reflect the cash salary component, plus the number of deferred share salary as listed in the table above, so as a total of 74,859 shares). The Remuneration Committee therefore agreed to award Mr Kiknavelidze 68,000 shares.
Directors’ Remuneration Report continued
Single total figure of remuneration for the sole Executive Director (audited)The table below sets out the remuneration earned by the Company’s sole Executive Director during 2018, Kaha Kiknavelidze, in respect of his employment with the Company for the year ended 31 December 2018. For 2018, 90% of Mr Kiknavelidze’s compensation as set out in the table below is in the form of deferred shares that vest in tranches, with vesting periods of up to four years.
Mr Kiknavelidze’s compensation includes remuneration both pre and post the Demerger of BGEO Group PLC.
Cash salary (US$)1
Deferred share salary (US$)2
Total salary (US$)
Discretionary share
remuneration (US$)3
Taxable Benefits (US$)4
Pension benefits5
Dividend equivalents6
Total (US$)
2018 295,000 1,483,800 1,778,800 1,349,985 2,584 1,906 6,278 3,139,552
Notes:1. Expressed in US Dollars but paid in British Pounds and Lari, as applicable, converted into the respective currency as at the date of payment. Accordingly, there may be
variations in the numbers above and those provided in the accounts.2. Deferred share salary. The figures show the value of the BOGG shares underlying nil-cost options granted in respect of 2018. For 2018, the award was 60,000 BOGG shares.
A new service agreement with Mr Kiknavelidze came into effect upon listing on 21 May 2018, but such price is calculated from date of Demerger on 29 May 2018 (given the change in share price upon Demerger). For 2018, the value of the deferred share salary payable is calculated as follows: the share price used is at the date of Demerger, being US$ 24.731 per share (the official share price of GBP 18.638 per share converted into US Dollars using an exchange rate of 1.3269 being the official exchange rate published by the Bank of England on the same date). Under the current deferred share programme, the option awards in respect of deferred share salary are formally granted at the beginning of the year following the year to which the award relates (the “work year”) even though the number of deferred salary shares is fixed in the contract. The terms and conditions applying to deferred share salary follow the model of the BGEO Group PLC Policy available in the BGEO Group Annual Report 2017’s Directors’ Remuneration Report at https://bankofgeorgiagroup.com/reports/annual.
3. Discretionary deferred share remuneration. The figures show the value of BOGG shares underlying nil-cost options granted in respect of bonus awards in the relevant year. For 2018, options were awarded over 68,000 BOGG shares. The discretionary remuneration in respect of 2018 is deferred and vests over three years in equal amounts in each of the second, third and fourth years following the work year. The value was calculated by reference to the closing share price on 22 January 2019 (the day of the meeting at which the award was determined) which was US$ 19.853 (based on the official share price of GBP 15.322 per share converted into Dollars using an exchange rate of 1.2957, being the official exchange rate published by the Bank of England on the same date). The 2018 awards are subject to the leaver provisions described in the BGEO Group Policy as referenced in 2. above. The means of determining the number of shares underlying this remuneration and the terms and conditions are described in the BGEO Group Policy as referenced in 2. above.
The basis for determining Mr Kiknavelidze’s 2018 discretionary award is described on the next two pages.4. Benefits. The figures show the gross taxable value of health, life and personal accident insurance.5. Pensions. The figures show the aggregate employer contributions for the relevant years into the Group’s defined contribution pension scheme. Under the Group’s defined
contribution pension scheme, normal retirement age is 65.6. Dividend equivalents. The figure shows the dividend value paid in respect of nil-cost options exercised in the relevant year.7. Mr Kiknavelidze was reimbursed for reasonable business expenses, on provision of valid receipts.8. No money or other assets are received or receivable by Mr Kiknavelidze in respect of a period of more than one financial year, where final vesting is determined by reference to
achievement of performance measures or targets relating to the relevant period.
The following table sets out details of total remuneration for the Chief Executive Officer, Mr Kiknavelidze, for the year ended 31 December 2018 and his discretionary compensation as a percentage of maximum opportunity. As the Company listed during 2018, there is no prior year comparator which can be shown.
2018
Single total figure of remuneration (US$) 3,139,552 Discretionary compensation as a percentage of maximum opportunity (%) 90.8%
Note: Maximum opportunity is 100% of total salary (cash salary and deferred share salary) as set out in the section below.
Basis for determining Mr Kiknavelidze’s discretionary deferred share remuneration in respect of 2018Mr Kiknavelidze’s KPIs included both objective and non-tangible components. The objective elements largely track the Group’s KPIs as he is expected to deliver on the Group’s strategy, but the KPIs also include non-tangible factors such as strategy development and implementation, as well as corporate and social responsibility. The Remuneration Committee exercised its discretion when awarding discretionary share remuneration.
The following table sets out the objective KPIs set for the CEO of the Bank ahead of the Demerger as well as Mr Kiknavelidze’s performance against them.
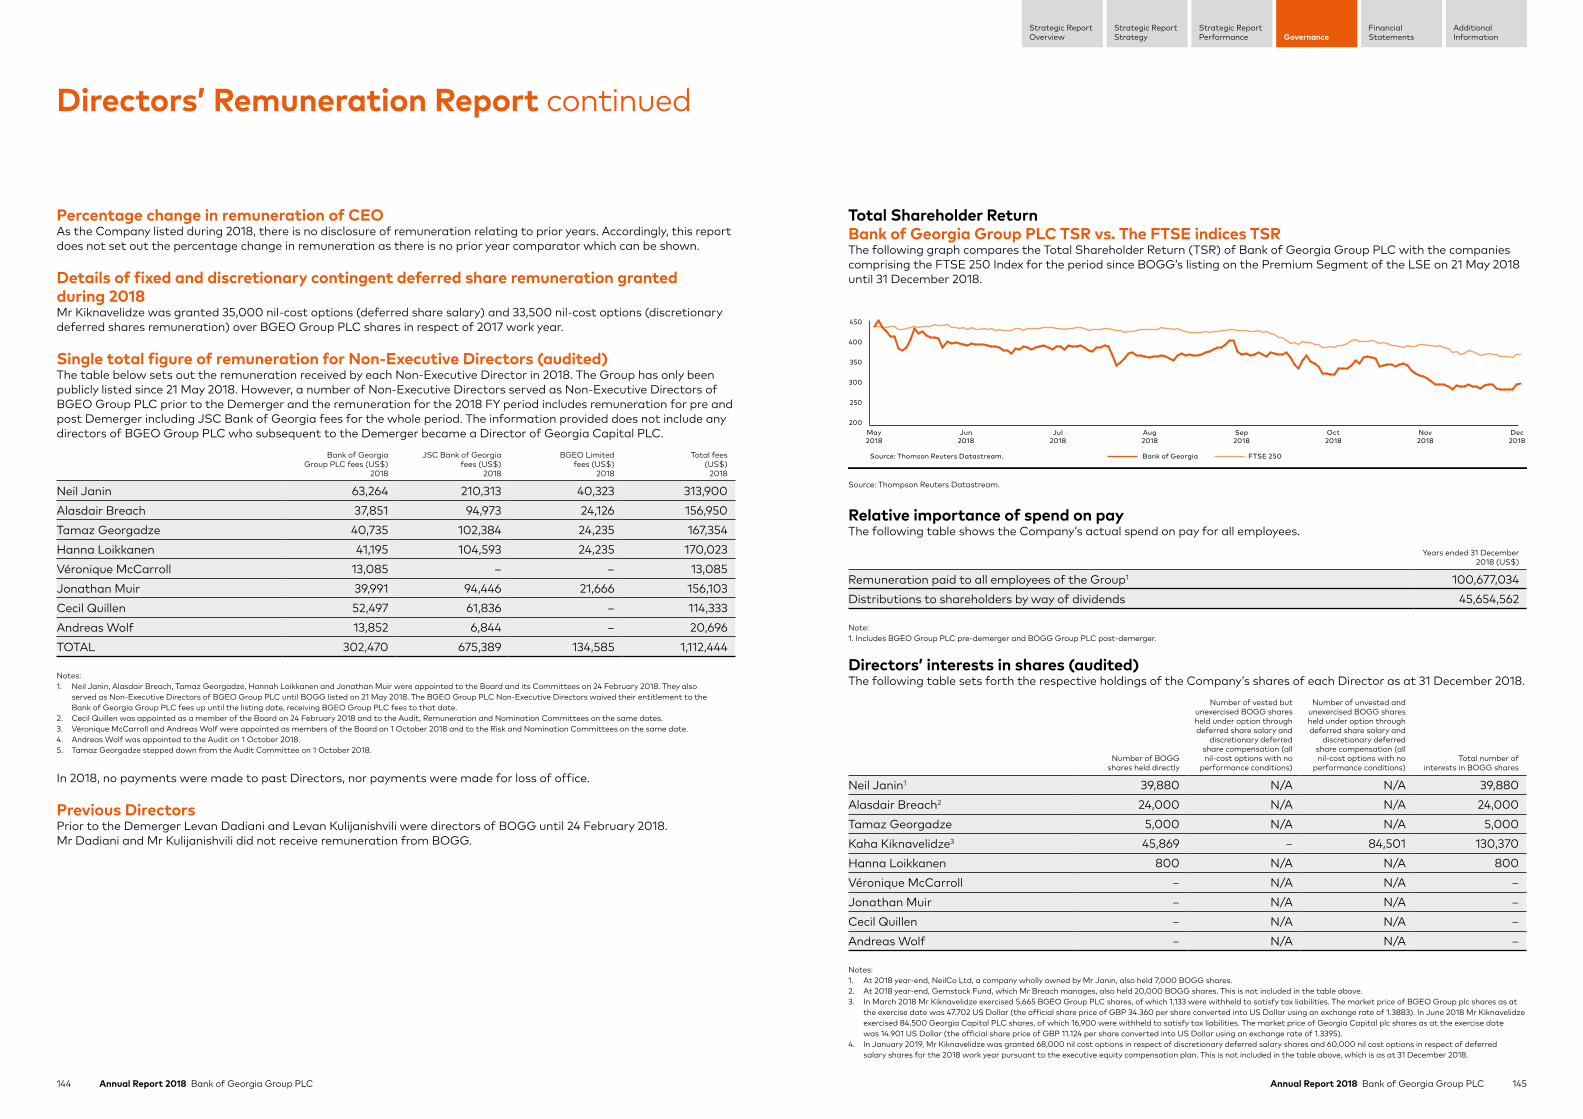
144 Annual Report 2018 Bank of Georgia Group PLC 145Annual Report 2018 Bank of Georgia Group PLC
Strategic ReportStrategy
Strategic ReportPerformance Governance
FinancialStatements
AdditionalInformation
Strategic ReportOverview
Total Shareholder ReturnBank of Georgia Group PLC TSR vs. The FTSE indices TSRThe following graph compares the Total Shareholder Return (TSR) of Bank of Georgia Group PLC with the companies comprising the FTSE 250 Index for the period since BOGG’s listing on the Premium Segment of the LSE on 21 May 2018 until 31 December 2018.
200
250
300
350
400
450
May2018
Jun2018
Jul2018
Aug2018
Sep2018
Oct2018
Nov2018
Dec2018
Bank of Georgia FTSE 250Source: Thomson Reuters Datastream.
Source: Thompson Reuters Datastream.
Relative importance of spend on payThe following table shows the Company’s actual spend on pay for all employees.
Years ended 31 December 2018 (US$)
Remuneration paid to all employees of the Group1 100,677,034Distributions to shareholders by way of dividends 45,654,562
Note: 1. Includes BGEO Group PLC pre-demerger and BOGG Group PLC post-demerger.
Directors’ interests in shares (audited)The following table sets forth the respective holdings of the Company’s shares of each Director as at 31 December 2018.
Number of BOGG shares held directly
Number of vested but unexercised BOGG shares held under option through deferred share salary and
discretionary deferred share compensation (all nil-cost options with no
performance conditions)
Number of unvested and unexercised BOGG shares held under option through deferred share salary and
discretionary deferred share compensation (all nil-cost options with no
performance conditions)Total number of
interests in BOGG shares
Neil Janin1 39,880 N/A N/A 39,880Alasdair Breach2 24,000 N/A N/A 24,000Tamaz Georgadze 5,000 N/A N/A 5,000Kaha Kiknavelidze3 45,869 – 84,501 130,370Hanna Loikkanen 800 N/A N/A 800Véronique McCarroll – N/A N/A –Jonathan Muir – N/A N/A –Cecil Quillen – N/A N/A –Andreas Wolf – N/A N/A –
Notes:1. At 2018 year-end, NeilCo Ltd, a company wholly owned by Mr Janin, also held 7,000 BOGG shares. 2. At 2018 year-end, Gemstock Fund, which Mr Breach manages, also held 20,000 BOGG shares. This is not included in the table above. 3. In March 2018 Mr Kiknavelidze exercised 5,665 BGEO Group PLC shares, of which 1,133 were withheld to satisfy tax liabilities. The market price of BGEO Group plc shares as at
the exercise date was 47.702 US Dollar (the official share price of GBP 34.360 per share converted into US Dollar using an exchange rate of 1.3883). In June 2018 Mr Kiknavelidze exercised 84,500 Georgia Capital PLC shares, of which 16,900 were withheld to satisfy tax liabilities. The market price of Georgia Capital plc shares as at the exercise date was 14.901 US Dollar (the official share price of GBP 11.124 per share converted into US Dollar using an exchange rate of 1.3395).
4. In January 2019, Mr Kiknavelidze was granted 68,000 nil cost options in respect of discretionary deferred salary shares and 60,000 nil cost options in respect of deferred salary shares for the 2018 work year pursuant to the executive equity compensation plan. This is not included in the table above, which is as at 31 December 2018.
Directors’ Remuneration Report continued
Percentage change in remuneration of CEOAs the Company listed during 2018, there is no disclosure of remuneration relating to prior years. Accordingly, this report does not set out the percentage change in remuneration as there is no prior year comparator which can be shown.
Details of fixed and discretionary contingent deferred share remuneration granted during 2018Mr Kiknavelidze was granted 35,000 nil-cost options (deferred share salary) and 33,500 nil-cost options (discretionary deferred shares remuneration) over BGEO Group PLC shares in respect of 2017 work year.
Single total figure of remuneration for Non-Executive Directors (audited)The table below sets out the remuneration received by each Non-Executive Director in 2018. The Group has only been publicly listed since 21 May 2018. However, a number of Non-Executive Directors served as Non-Executive Directors of BGEO Group PLC prior to the Demerger and the remuneration for the 2018 FY period includes remuneration for pre and post Demerger including JSC Bank of Georgia fees for the whole period. The information provided does not include any directors of BGEO Group PLC who subsequent to the Demerger became a Director of Georgia Capital PLC.
Bank of Georgia Group PLC fees (US$)
2018
JSC Bank of Georgia fees (US$)
2018
BGEO Limited fees (US$)
2018
Total fees (US$)
2018
Neil Janin 63,264 210,313 40,323 313,900Alasdair Breach 37,851 94,973 24,126 156,950Tamaz Georgadze 40,735 102,384 24,235 167,354Hanna Loikkanen 41,195 104,593 24,235 170,023Véronique McCarroll 13,085 – – 13,085Jonathan Muir 39,991 94,446 21,666 156,103Cecil Quillen 52,497 61,836 – 114,333Andreas Wolf 13,852 6,844 – 20,696TOTAL 302,470 675,389 134,585 1,112,444
Notes:1. Neil Janin, Alasdair Breach, Tamaz Georgadze, Hannah Loikkanen and Jonathan Muir were appointed to the Board and its Committees on 24 February 2018. They also
served as Non-Executive Directors of BGEO Group PLC until BOGG listed on 21 May 2018. The BGEO Group PLC Non-Executive Directors waived their entitlement to the Bank of Georgia Group PLC fees up until the listing date, receiving BGEO Group PLC fees to that date.
2. Cecil Quillen was appointed as a member of the Board on 24 February 2018 and to the Audit, Remuneration and Nomination Committees on the same dates. 3. Véronique McCarroll and Andreas Wolf were appointed as members of the Board on 1 October 2018 and to the Risk and Nomination Committees on the same date.4. Andreas Wolf was appointed to the Audit on 1 October 2018.5. Tamaz Georgadze stepped down from the Audit Committee on 1 October 2018.
In 2018, no payments were made to past Directors, nor payments were made for loss of office.
Previous Directors Prior to the Demerger Levan Dadiani and Levan Kulijanishvili were directors of BOGG until 24 February 2018. Mr Dadiani and Mr Kulijanishvili did not receive remuneration from BOGG.
146 Annual Report 2018 Bank of Georgia Group PLC 147Annual Report 2018 Bank of Georgia Group PLC
Strategic ReportStrategy
Strategic ReportPerformance Governance
FinancialStatements
AdditionalInformation
Strategic ReportOverview
For Archil Gachechiladze Fixed pay
Total cash salary (combined BOGG and Bank)
US$ 341,616
Total deferred share salary(combined BOGG and Bank)
US$ 1,275,522
Pension The Executive Director and the Company each contribute 2% and the Georgian Government contributes between 0-2% of total remuneration from the Bank, all in line with Georgian legislation and the pension arrangements for the Georgian workforce.
Benefits Details of the benefits received by Executive Directors are on page 134.
There are circumstances in which unvested deferred shares may lapse, and narrow circumstances in which such shares may vest immediately (i.e. when an Executive Director’s employment is terminated without Cause) and these are set out in the Policy.
2019 Discretionary deferred share remuneration
Opportunity Maximum is 100% of total salary (total cash salary and total deferred share salary as explained in the table and notes to the Policy above).
Deferral terms The Remuneration Committee will determine whether an award is merited based on an Executive Director’s achievement of the KPIs set for the work year and the performance of the Group during the work year. If Mr Gachechiladze is awarded discretionary deferred shares, the award will vest 40% in the third and 60% in fourth year following the work year. Each tranche will be subject to a further holding period of two years. Upon vesting, Mr Gachechiladze will receive (in addition to the vested shares) cash payments equal to the dividends paid (if any) on the underlying shares between the date the award was made and the vesting date.
Performance measures Archil Gachechiladze was appointed as the Group’s CEO and Executive Director on 28 January 2019. The Remuneration Committee has set his KPIs for 2019, which will be reviewed by the Remuneration Committee and by the Board as appropriate throughout the year, subject to the terms of the Policy.
• ROAE as targeted• NPS as targeted• Capital adequacy as required and further targeted• Managing the Bank within the agreed risk tolerance• Employee engagement and culture• Developing corporate social responsibility in accordance with the Group’s mission
See page 136 for malus and clawback and page 140 for termination of the Bank service agreement for lapse provisions (natural malus).
Directors’ Remuneration Report continued
As at 31 December 2018, Mr Kiknavelidze’s vested and unvested shareholding was 130,370 BOGG shares, representing approximately 0.3% of the share capital of BOGG. The vesting period for the majority of unvested shares exceeds three years. None of Mr Kiknavelidze’s connected persons have any interests in the shares of the Company.
The Policy is heavily weighted towards remuneration in deferred salary shares and discretionary compensation in deferred shares. The Policy and the long vesting periods, even for salary shares, naturally results in the Executive Director and our Executive Management team holding a significant number of unvested shares and achieves a delay between performance and vesting. We believe these results are consistent with the principles of the Investment Management Association. However to further strengthen this, under the new proposed Policy, the Company is introducing formal guidelines on shareholding and on post-employment shareholding.
The Group does not require Non-Executive Directors to hold a specified number of shares in Bank of Georgia Group. Notwithstanding this, some Non-Executive Directors have chosen to become shareholders. There have been no changes in the Non-Executive Directors’ Bank of Georgia Group shareholdings since the date of their appointment to the Board further to those reported above.
Details of Non-Executive Directors’ terms of appointmentThe Company has entered into letters of appointment with each Non-Executive Director. The letters of appointment require Non-Executive Directors to provide one month’s notice prior to termination. The letters of appointment for the majority of current Non-Executive Directors are effective from 24 February 2018, with Véronique McCarroll and Andreas Wolf’s letters of appointment being effective from 1 October 2018. Each Non-Executive Director is put forward for election at each Annual General Meeting following his or her appointment. Continuation of a Non-Executive Director’s employment is conditional on his or her continued satisfactory performance and re-election by shareholders at each Annual General Meeting.
A succession plan adopted by the Board provides for a tenure of six years on the Bank of Georgia Group Board. Upon the expiry of such six-year tenure, the Board will consider if the appointment of the relevant Non-Executive Director will generally cease at the next upcoming Annual General Meeting. Notwithstanding the foregoing, if the Board determines that, in order to maintain the balance of appropriate skills and experience required for the Board, it is important to retain a Non-Executive Director on the Board beyond the relevant six-year period, the Board may offer the Non-Executive Director a letter of appointment for an additional one-year term. Such a one-year “re-appointment” may be renewed no more than two times, with the effect that the usual six-year tenure may be extended to a maximum of nine years if circumstances were to warrant such extension.
Remuneration Committee effectiveness reviewAn internal effectiveness review was conducted by the Remuneration Committee. The evaluation addressed the structure and effectiveness of the Remuneration Committee and the performance evaluation process. The effectiveness evaluation concluded that the Remuneration Committee operates and performs effectively.
Our priorities for 2019 include the implementation of the new Directors’ Remuneration Policy (subject to its approval by shareholders) and ensuring that the structure for senior management and other employees remains appropriate while enhancing long-term shareholder value.
Implementation of Remuneration Policy for 2019Details of how the revised Policy will be implemented for the 2019 financial year if approved by shareholders at the 2019 Annual General Meeting are set out below. Subject to shareholder approval, the Policy will take effect from the date of the 2019 Annual General Meeting and is intended to apply until the date of Annual General Meeting in 2022.

148 Annual Report 2018 Bank of Georgia Group PLC 149Annual Report 2018 Bank of Georgia Group PLC
Strategic ReportStrategy
Strategic ReportPerformance Governance
FinancialStatements
AdditionalInformation
Strategic ReportOverview
For Non-Executive DirectorsThe table below shows the fee structure for Non-Executive Directors for 2019. Non-Executive Directors’ fees are determined by the Board.
Component Purpose and link to strategy Operation Opportunity
Base cash fee The fee for the Board is competitive enough to attract and retain individuals.
The Chairman receives a fee which reflects the extra time committed and responsibility.
The Senior Independent Non-Executive Director receives a higher base fee which reflects the extra time and responsibility.
Cash payment on quarterly basis.
The amount of remuneration may be reviewed from time to time by the Board.
The fees may also be amended and varied if there are genuinely unforeseen and exceptional circumstances which necessitate such review and in such circumstances any significant increase shall be the minimum reasonably required.
The maximum aggregate BOGG PLC fees for all Non-Executive Directors which may be paid by BOGG PLC is GBP 750,000, which is consistent with BOGG PLC’s Articles of Association.
Cash fee for each Committee membership
Additional fee to compensate for additional time spent discharging Committee duties.
Cash payment on quarterly basis.
The amount of remuneration for the membership may be reviewed from time to time by the Board.
The Chairman does not receive Committee fees.
Signed on behalf of the Board of Directors
Alasdair BreachChairman of the Remuneration Committee27 March 2019
Directors’ Remuneration Report continued Statement of Directors’ responsibilities
The Directors are responsible for preparing the Annual Report and the consolidated and separate financial statements in accordance with applicable law and regulations.
Company law requires us to prepare financial statements for each financial year. As required, we have prepared the accompanying consolidated and separate statements in accordance with International Financial Reporting Standards (IFRS) as adopted by the European Union and applicable law.
We must not approve the accompanying consolidated and separate financial statements unless we are satisfied that they give a true and fair view of the state of affairs of the Group and the Bank of Georgia Group PLC (the “Company”) and of the profit or loss of the Group and the Company for that period.
In preparing the accompanying consolidated and separate financial statements, we are required to:• select suitable accounting policies and then apply
them consistently;• make judgements and estimates that are reasonable
and prudent;• state whether they have been prepared in accordance
with IFRS as adopted by the European Union, subject to any material departures disclosed and explained in the financial statements; and
• prepare the financial statements on the going concern basis unless it is inappropriate to presume that the Company will continue in business.
We are also responsible for keeping adequate accounting records that are sufficient to show and explain the Company’s and the Group’s transactions, to disclose with reasonable accuracy at any time the financial position of the Company and the Group, and to enable us to ensure that the consolidated and separate financial statements and the Directors’ Remuneration Report comply with the Companies Act 2006 and, as regards the consolidated and separate financial statements, Article 4 of the IAS Regulation.
We have further responsibility for safeguarding the assets of the Company and the Group and for taking reasonable steps for the prevention and detection of fraud and other irregularities.
We are also responsible for the maintenance and integrity of the Company’s website. Legislation in the UK governing the preparation and dissemination of financial statements may differ from legislation in other jurisdictions.
We confirm that to the best of our knowledge:• the consolidated and separate financial statements,
prepared in accordance with IFRS as adopted by the European Union, give a true and fair view of the assets, liabilities, financial position and profit or loss of the Company and the Group taken as a whole;
• the Strategic Report and Directors’ Report contained in this Annual Report include a fair review of the development and performance of the business and the position of the Company and the Group, together with a description of the principal risks and uncertainties that it faces.
We consider that the Annual Report and Accounts, taken as a whole, are fair, balanced and understandable and gives shareholders the information needed to assess the Group’s position and performance, business model and strategy.
By order of the Board
Neil Janin Archil GachechiladzeChairman CEO27 March 2019 27 March 2019
150 Annual Report 2018 Bank of Georgia Group PLC 151Annual Report 2018 Bank of Georgia Group PLC
Strategic ReportStrategy
Strategic ReportPerformance Governance
FinancialStatements
AdditionalInformation
Strategic ReportOverview
Strategic ReportThe Strategic Report on pages 1 to 101 was approved by the Board of Directors on 27 March 2019 and signed on its behalf by Archil Gachechiladze.
Management Report This Directors’ Report together with the Strategic Report on pages 1 to 101 form the Management Report for the basis of DTR 4.1.5 R.
Information contained elsewhere in the Annual Report Information required to be included in this Directors’ Report can be found elsewhere in the Annual Report as indicated in the table below and is incorporated into this report by reference:
Information Location in Annual Report
Future developments Pages 4 to 101Going concern statement Page 68Viability statement Page 68Risk management Pages 48 to 59Principal risks and uncertainties Pages 60 to 67Directors’ Governance Statement Page 102The Board of Directors Pages 111 to 114Nomination Committee Report Pages 117 to 120Audit Committee Report Pages 121 to 125Risk Committee Report Pages 126 to 128Greenhouse gas emissions Pages 73 to 74Employee matters Pages 80 to 83Environmental matters Pages 71 to 74Share capital Note 20 pages
244 and 245Information on the Group’s financial risk management objectives and policies, and its exposure to credit risk, foreign currency risk and financial instruments
Note 27 pages 254 to 269
Articles of Association The Articles of Association of the Bank of the Georgia Group PLC (“the Company” or “Bank of Georgia Group PLC”) may only be amended by a special resolution at a general meeting of the shareholders. The process for the appointment and removal of Directors is included in our Articles of Association. The Bank of Georgia Group Articles of Association are available on the BOGG website:https://bankofgeorgiagroup.com/storage/documents/Articles of Association.pdf.
Share capital and rights attaching to the sharesDetails of the movements in share capital during the year are provided in Note 20 to the consolidated financial statements on pages 244 to 245 of this Annual Report.
As at the date of this Annual Report there was a single class of 49,169,428 ordinary shares of one pence each in issue, each with one vote. The rights and obligations attaching to the Bank of Georgia Group’s ordinary shares are set out in its Articles of Association. Holders of ordinary shares are entitled, subject to any applicable law and the Company’s Articles of Association, to: • have shareholder documents made available to them
including notice of any general meeting; • attend, speak and exercise voting rights at general
meetings, either in person or by proxy; and• participate in any distribution of income or capital.
As disclosed in the Company’s prospectus dated 26 March 2018 (“Prospectus”), for such time as JSC Georgia Capital (or its concert parties) holding in the Company is greater than 9.99% of the voting rights exercisable at a general meeting, JSC Georgia Capital will exercise its voting rights at general meetings of the Company in accordance with the votes cast by all other Company shareholders other than for an “Excluded Resolution”, as such term is defined in the Articles of Association. This is known as the proportional voting mechanism which operates, in accordance with the terms in the Company’s Articles of Association, as follows: • on a resolution proposed to a general meeting,
all shareholders of the Company (other than JSC Georgia Capital and its concert parties) will be entitled to vote their shares at their discretion on a poll vote (each an “Initial Vote”); and
• following the closing of the Initial Vote(s), the poll will as soon as possible thereafter reopen for the sole purpose of enabling the shares held by JSC Georgia Capital (or its concert parties) to be voted in each case proportionally (calculated to two decimal places) in accordance with the votes cast on each resolution on an Initial Vote (the “Proportional Voting Mechanism”).
Irrespective of the percentage of shares voted on any Initial Vote, all shares held by JSC Georgia Capital (or its concert parties) will be voted in accordance with the Proportional Voting Mechanism. As at 27 March 2019, JSC Georgia Capital held 9,784,716 Company shares. As set out in the Prospectus, the number of shares held by JSC Georgia Capital impacts the Effective Rule 9 Threshold applicable to the Company. As at 27 March 2019 the number of shares required to reach the effective rule 9 threshold is 11,815,413, representing 24.03% of the Company’s total issued share capital.
Directors’ ReportThe Directors present their Annual Report and the audited consolidated financial statements for the year ended 31 December 2018.
The Bank of Georgia Group PLC is permitted to make market purchases of its own shares provided it is duly authorised by its members in a general meeting and subject to and in accordance with section 701 of the Companies Act 2006. Authority was given by conditional special resolution at a general meeting of the Company on 26 March 2018 for the Group to purchase up to 4,916,943 shares (approximately 10%) of the Group’s shares up to a maximum price for each share being the higher of (i) 105% of the average of the middle-market price of an ordinary share as derived from the London Stock Exchange Daily Official List for the five business days immediately preceding the day on which such ordinary share is contracted to be purchased; and (ii) an amount equal to the higher of the price of the last independent trade of shares and the highest current independent purchase bid for an ordinary share as derived from the London Stock Exchange Trading System at the time the purchase is carried out. This authority will expire at the conclusion of the Company’s AGM in 2019 or, if earlier, the close of business on 23 June 2019.
A renewal of the authority to make market purchases will be sought from shareholders at each AGM of the Company. Purchases of ordinary shares will be made within guidelines established from time to time by the Board. Any purchase of ordinary shares would be made only out of the available cash resources of the Company. ordinary shares purchased by the Company may be held in treasury or cancelled. The Company had no Ordinary Shares held in treasury as at 27 March 2019.
At a general meeting of the Bank of Georgia Group PLC on 26 March 2018, the Directors were given the power a) to allot shares up to a maximum nominal amount of GBP 163,898.09 representing approximately one third of the Group’s issued share capital after the Demerger process was completed, and b) to allot equity securities up to an aggregate nominal amount of GBP 163,898.09, in connection with an offer by way of a rights issue: (i) to holders of shares in proportion (as nearly as may be practicable) to their existing holdings; and (ii) to holders of other equity securities as required by the rights of those securities or, if the Directors consider it necessary, as permitted by the rights of those securities, such amount to be reduced by the aggregate nominal amount of shares allotted or rights to subscribe for or to convert any securities into shares granted under paragraph (a), and subject to the Directors having the right to make such exclusions or other arrangements as they may deem necessary or expedient in relation to treasury shares, fractional entitlements, record dates or legal, regulatory or practical problems in, or under the laws of, any territory. These authorities will expire at the conclusion of the 2019 AGM (or, if earlier, at the close of business on 23 June 2019) and approval will be sought at that meeting to renew a similar authority for a further year.
Save as disclosed above for proportional voting, none of the ordinary shares carry any special rights with regard to control of Bank of Georgia Group PLC.
There are no restrictions on transfers of shares other than:• certain restrictions which may from time to time be
imposed by laws or regulations such as those relating to insider dealing or pursuant to the Company’s Inside Information Disclosure Policy;
• pursuant to the Company’s Securities Dealing Policy and Code, whereby the Directors and designated employees require approval to deal in Bank of Georgia Group PLC’s shares or cannot deal at certain times; and
• where a person with an interest in the Company’s shares has been served with a disclosure notice and has failed to provide the Bank of Georgia Group PLC with information concerning interests in those shares.
Bank of Georgia Group PLC is not aware of any arrangements between shareholders that may result in restrictions on the transfer of securities or voting rights, or the exercise of voting rights.
Results and dividends The Group made a profit from continued operations before taxation of GEL 437.5 million. The Group’s profit from continued operations after taxation for the year was GEL 380.9 million. The Group’s total profit after taxation (including discontinued) for the year was GEL 488.8 million.
Bank of Georgia Group PLC may by ordinary resolution declare dividends provided that no such dividend shall exceed the amount recommended by the Company’s Directors. The Directors may also pay such interim dividends as appear to be justified by the profits of the Group available for distribution.
In accordance with the Dividend Policy set out in the Company’s prospectus dated 26 March 2018, the Company will continue the dividend policy previously disclosed by BGEO Group PLC. Therefore, the Company’s Dividend Policy is a targeted payout of 25-40% of the Company’s profits on an annual basis. Therefore, the Board intends to recommend a final dividend for 2018 of GEL 2.55 per share.
On 9 July 2018, Bank of Georgia Group PLC announced an interim dividend of GEL 2.44 per share in respect of the period ended 30 June 2018. This was in accordance with previous announcements that the Bank of Georgia Group PLC would recommend a payment of a dividend in an aggregate amount of approximately GEL 120 million following the Demerger.
152 Annual Report 2018 Bank of Georgia Group PLC 153Annual Report 2018 Bank of Georgia Group PLC
Strategic ReportStrategy
Strategic ReportPerformance Governance
FinancialStatements
AdditionalInformation
Strategic ReportOverview
As Bank of Georgia Group PLC is a holding company, the Group relies primarily on dividends and other statutorily (if any) and contractually permissible payments from its subsidiaries to generate the funds necessary to meet its obligations and pay dividends to its shareholders.
Equity-Settled Option Plan (“ESOP”)The Bank of Georgia Group operates two employee benefit trusts (EBT), one for Executive Management, and the other for employees below the executive level (the “ESOPs”), which hold ordinary shares on trust for the benefit of employees and former employees of the Group, and their dependents, and which is used in conjunction with the Group’s employee share schemes. Whilst ordinary shares are held in the EBT, the voting rights in respect of these ordinary shares may be exercised by the trustees of the EBT. In accordance with the ESOP documentation, Sanne Fiduciary Services Limited has waived its right to receive any dividends. This waiver will remain in place indefinitely, unless otherwise instructed by the Company. The Company has committed that new shares issued in satisfaction of share compensation from the time of the Company’s listing on the premium segment of the LSE will not exceed 10% of Bank of Georgia Group’s ordinary share capital over any ten-year period.
Powers of Directors The Directors may exercise all powers of the Company subject to applicable legislation and regulations and Bank of Georgia Group’s Articles of Association.
Conflicts of interestIn accordance with the Companies Act 2006, the Directors have adopted a policy and procedure for the disclosure and authorisation (if appropriate) of conflicts of interest, and these have been followed during 2018. The Company’s Articles of Association also contain provisions to allow the Directors to authorise potential conflicts of interest so that a Director is not in breach of his or her duty under company law.
Directors’ renumeration Directors’ fees are determined by the Remuneration Committee from time to time. The remuneration of Directors must be in accordance with the Directors’ Remuneration Policy. A remuneration policy will be put to the shareholders for approval at the 2019 AGM. In the meantime, remuneration has been determined following the model as approved by shareholders of BGEO Group PLC during the Demerger. The fees paid to the
Non-Executive Directors in 2018 pursuant to their letters of appointment are shown on page 144. The fees paid to our sole Executive Director in 2018 pursuant to his service agreements with the Group are shown on page 142.
Directors’ interestsThe Directors’ beneficial interests in ordinary shares of Bank of Georgia Group PLC as at 31 December 2018 are shown on page 145 together with any changes in those interests between the financial year-end and the date on which this Directors’ Report was approved by the Board on page 146.
IndemnitySubject to applicable legislation, every current and former Director or other officer of the Company (other than any person engaged by the Company as auditor) shall be indemnified by the Bank of Georgia Group PLC against any liability in relation to Bank of Georgia Group PLC, other than (broadly) any liability to the Company or a member of the Group, or any criminal or regulatory fine. In addition, the Company has put in place Directors’ and officers’ indemnity insurance.
Related party disclosures Details of related party disclosures are set out in Note 30 to the consolidated financial statements on page 281 of this Annual Report.
Significant agreements The Bank of Georgia Group is not party to any significant agreements that take effect, alter or terminate upon a change of control of the Company. The Bank of Georgia Group is not aware of any agreements between holders of its ordinary shares that may result in restrictions on the transfer of its ordinary shares or on voting rights.
Presence outside of Georgia We have additional offices in London, Budapest, Istanbul, Tel Aviv, and Limassol, as well as the BNB Bank in Belarus.
Employee disclosures Our disclosures relating to the number of women in senior management, employee engagement, and our policies on human rights, including employment of disabled persons, are included in the section Employee matters on pages 80 to 83.
Political donations The Group did not make any political donations or expenditure during 2018. Authority to make political donations and incur political expenditure will be put to shareholder vote at the 2019 AGM.
Code of Conduct and ethicsThe Board has adopted a Code of Conduct relating to the lawful and ethical conduct of the business, supported by the Group core values. The Code of Conduct has been communicated to all Directors and employees, all of whom are expected to observe high standards of integrity and fair dealing in relation to customers, staff and regulators in the communities in which the Group operates. Our Code of Conduct is available on our website: https://bankofgeorgiagroup.com/storage/documents/Code of Conduct and Ethics.pdf.
Independent auditor A resolution to appoint Ernst & Young LLP as auditor of Bank of Georgia Group PLC will be put to shareholders at the upcoming AGM.
Major interests in sharesThe table below lists shareholders with voting rights of more than 3% as of 31 December 2018.
As of 31 December 2018
ShareholderNumber of
voting rights% of
voting rights
JSC Georgia Capital 9,784,716 19.90Harding Loevner LP 2,291,249 4.66JP Morgan Asset Management 1,481,494 3.01
Source: Georgeson, Computershare.
The table below shows the changes in voting rights which have been notified to the Company for the period 1 January 2019 up to and including 27 March 2019:
As of 27 March 2019
ShareholderNumber of
voting rights % of voting rights
Norges Bank 1,497,227 3.05Standard Life Aberdeen PLC 2,466,293 5.02
It should be noted that these holdings are likely to have changed since the Company was notified. However, notification of any change is not required until the next notifiable threshold is crossed. The respective regulatory filings by shareholders are available on the BOGG website: https://www.bankofgeorgiagroup.com/news/regulatory and the London Stock Exchange website: https://www.londonstockexchange.com/home/homepage.htm.
Post balance sheet eventsAs detailed elsewhere in this report, Mr Gachechiladze was appointed as Chief Executive Officer of Bank of Georgia Group on 28 January 2019. The process underpinning his selection and appointment is detailed in the Nomination Committee Report.
Issue of US$ 100 million Additional Tier 1 Capital NotesOn 21 March 2019 JSC Bank of Georgia successfully priced inaugural US$ 100 million 11.125% offering of Additional Tier 1 Capital Perpetual Subordinated Notes callable after 5.25 years and on every subsequent interest payment date, subject to prior consent of the National Bank of Georgia (the “Notes”).
Please also see page 283, Note 32 regarding Events After the Reporting Period in the Financial Statements.
Statement of disclosure of information to the auditor We confirm that, so far as we are aware, there is no relevant audit information of which the Bank of Georgia Group’s auditor is unaware and we have taken all steps that we reasonably believe should be taken as Directors in order to make ourselves aware of any relevant audit information and to establish that the Bank of Georgia Group’s statutory auditor is aware of such information.
Information to be disclosed in accordance with the Listing Rule 9.8.4R The following information required to be disclosed in terms of Listing Rule 9.8.4R is not applicable unless stated otherwise:• the amount of interest capitalised during the period
under review and details of any related tax relief; • information in relation to the publication of unaudited
financial information; • any arrangements under which a Director has
waived emoluments, or agreed to waive any future emoluments, from the Group;
• details of any non-pre-emptive issues of equity for cash by the Group: - any non-pre-emptive issues of equity for cash
by the Group or by any unlisted major subsidiary undertaking;
- parent participation in a placing by a listed subsidiary;
- any contract of significance in which a Director of Bank of Georgia Group is or was materially interested;
- any waiver of dividends by a shareholder; and• details of any long-term incentive schemes.
The Directors’ Report on pages 150 to 153 was approved by the Board of Directors on 27 March 2019 and signed on its behalf:
By order of the Board
Link Company Matters LimitedGroup Company Secretary27 March 2019
Directors’ Report continued
155Annual Report 2018 Bank of Georgia Group PLC
Strategic ReportStrategy
Strategic ReportPerformance Governance
FinancialStatements
AdditionalInformation
Strategic ReportOverview
Annual Report 2018 Bank of Georgia Group PLC154
Opinion
In our opinion:• Bank of Georgia Group PLC’s Group financial statements and Parent Company financial statements (the
“financial statements”) give a true and fair view of the state of the Group’s and of the Parent Company’s affairs as at 31 December 2018 and of the Group’s profit for the year then ended;
• the Group financial statements have been properly prepared in accordance with IFRSs as adopted by the European Union;• the Parent Company financial statements have been properly prepared in accordance with IFRSs as adopted by the
European Union as applied in accordance with the provisions of the Companies Act 2006; and• the financial statements have been prepared in accordance with the requirements of the Companies Act 2006,
and, as regards the Group financial statements, Article 4 of the IAS Regulation.
We have audited the financial statements of Bank of Georgia Group PLC which comprise:Group• consolidated statement of financial position as at 31 December 2018• consolidated income statement for the year then ended• consolidated statement of comprehensive income for the year then ended• consolidated statement of changes in equity for the year then ended• consolidated statement of cash flows for the year then ended• related notes 1 to 32 to the consolidated financial statements, including a summary of significant accounting policies
Parent Company• separate statement of financial position as at 31 December 2018• separate statement of changes in equity for the year then ended• separate statement of cash flows for the year then ended• related notes 1 to 32 to the effect they apply to the Parent Company financial statements, including a summary
of significant accounting policies
The financial reporting framework that has been applied in their preparation is applicable law and International Financial Reporting Standards (IFRSs) as adopted by the European Union and, as regards the Parent Company financial statements, as applied in accordance with the provisions of the Companies Act 2006.
Basis for opinionWe conducted our audit in accordance with International Standards on Auditing (UK) (ISAs (UK)) and applicable law. Our responsibilities under those standards are further described in the Auditor’s responsibilities for the audit of the financial statements section of our report below. We are independent of the Group and Parent Company in accordance with the ethical requirements that are relevant to our audit of the financial statements in the UK, including the FRC’s Ethical Standard as applied to listed public interest entities, and we have fulfilled our other ethical responsibilities in accordance with these requirements.
We believe that the audit evidence we have obtained is sufficient and appropriate to provide a basis for our opinion.
Independent auditor’s report to the members of Bank of Georgia Group PLC
Financial Statements

156 Annual Report 2018 Bank of Georgia Group PLC 157Annual Report 2018 Bank of Georgia Group PLC
Strategic ReportStrategy
Strategic ReportPerformance Governance
FinancialStatements
AdditionalInformation
Strategic ReportOverview
Conclusions relating to principal risks, going concern and viability statementWe have nothing to report in respect of the following information in the annual report, in relation to which the ISAs (UK) require us to report to you whether we have anything material to add or draw attention to:
• the disclosures in the Annual Report set out on pages 60 to 67 that describe the principal risks and explain how they are being managed or mitigated;
• the Directors’ confirmation set out on page 124 in the Annual Report that they have carried out a robust assessment of the principal risks facing the entity, including those that would threaten its business model, future performance, solvency or liquidity;
• the Directors’ statement set out on page 178 in the financial statements about whether they considered it appropriate to adopt the going concern basis of accounting in preparing them, and their identification of any material uncertainties to the entity’s ability to continue to do so over a period of at least 12 months from the date of approval of the financial statements;
• whether the Directors’ statement relating to going concern required under the Listing Rules in accordance with Listing Rule 9.8.6R(3) is materially inconsistent with our knowledge obtained in the audit; or
• the Directors’ explanation set out on page 69 in the Annual Report as to how they have assessed the prospects of the entity, over what period they have done so and why they consider that period to be appropriate, and their statement as to whether they have a reasonable expectation that the Group will be able to continue in operation and meet its liabilities as they fall due over the period of their assessment, including any related disclosures drawing attention to any necessary qualifications or assumptions.
Overview of our audit approach
Key audit matters • Allowance for expected credit loss • Revenue recognition• Valuation of investment property
Audit scope We performed an audit of the complete financial information of three components and audit procedures on specific balances for a further one component.
The components where we performed full or specific audit procedures accounted for 99% of Profit before non-recurring items and tax, 94% of Revenue and 94% of Total assets.
Materiality Overall Group materiality of GEL 20 million which represents 4% of pre-tax profit adjusted for non-recurring items.
Key audit mattersKey audit matters are those matters that, in our professional judgment, were of most significance in our audit of the financial statements of the current period and include the most significant assessed risks of material misstatement (whether or not due to fraud) that we identified. These matters included those which had the greatest effect on: the overall audit strategy, the allocation of resources in the audit; and directing the efforts of the engagement team. These matters were addressed in the context of our audit of the financial statements as a whole, and in forming our opinion thereon, and we do not provide a separate opinion on these matters. There have been no changes in the key audit matters compared to 2017, but the relative significance of each of them has changed as a result of the demerger and the introduction of IFRS 9, as indicated in the relevant sections below.
Risk Our response to the risk Key observations communicated to the Audit Committee
Allowance for expected credit loss
Expected credit loss allowance GEL 313.5m, (2017: GEL 279.3m)
The allowance for expected credit loss is highly judgmental and changes in assumptions could have a material impact on reported profits.
On 1 January 2018, a new accounting standard for financial instruments (IFRS9) became effective, which requires loan impairment based on expected credit losses, rather than the incurred loss model previously required by IAS39.
The allowance for expected credit loss is calculated using a combination of a collective provisioning model and specific loan provisions.
Both collective and specific provisioning depend on a number of assumptions and judgments including:• accounting interpretations and modelling
assumptions used to build the models for calculating the expected credit loss (ECL);
• allocation of loans to stage 1, 2 or 3 based on credit risk using criteria set in accordance with IFRS9;
• estimation of probability of default (PD), loss given default (LGD) and exposure at default (EAD), including the valuation of collateral;
• inputs and assumptions used to estimate the impact of multiple economic scenarios; and
• measurement of individually assessed provisions, including expected future cash flows and the valuation of collateral.
There are also risks over:• the accuracy and completeness of underlying
loan data used in the ECL model;• the accuracy and adequacy of financial
statement disclosures.
As a consequence of the judgment involved in establishing the allowance, there is a greater risk of misstatement in this balance, either by fraud or error, including through the potential override of controls by management.
The risk has increased in the current year as a result of the first time application of IFRS 9.
Refer to the Audit Committee Report (page 122); Accounting policies (pages 188-194, 201-203 and 207-210); and Note 10 to the financial statements
• We obtained an understanding, performed walkthroughs and tested the design and operating effectiveness of key controls across the processes relevant to the ECL. This included the controls over, data accuracy and completeness, credit monitoring, allocation of borrowers into their respective impairment stages, individual provisioning and production of journal entries and disclosures.
• Using our internal IFRS9 specialists, we assessed and challenged the Company’s IFRS9 provisioning methodology to determine that the new accounting standard had been interpreted appropriately.
• Using our modelling specialists, we tested the assumptions, inputs and formulae used in the ECL model to confirm that the model was consistent with the stated methodology. This included assessing the appropriateness of the model design and formulae used, recalculating the PD, LGD and EAD on a sample basis.
• We assessed the appropriateness of the macroeconomic scenarios used by management and tested that they had been properly applied in the ECL calculations
• We tested the completeness and accuracy of key data inputs used in ECL model by reconciling loans and advances between the underlying source systems and the ECL model.
• We challenged the criteria used to allocate assets to stage 1, 2 or 3 in accordance with IFRS 9. For a sample of loans we independently assessed whether they had been allocated to the appropriate stage.
• For a sample of stage 3 credit impaired loans we evaluated the basis on which the allowance was determined and the evidence supporting the management analysis; independently challenged whether the key assumptions and inputs used, such as recovery strategies, collateral rights and valuations and ranges of potential outcomes, were appropriate in the borrower’s circumstances; and we re-calculated the impairment allowance.
• We verified the appropriate restriction of the property pledged as collateral to the Georgian public real estate register and, for real estate collateral where the valuation changed by more than 10% compared to the prior year and for new real estate collateral, we reviewed the details of the valuation and validated the reasonableness of the new value by benchmarking major inputs to publicly available market data.
• We assessed the adequacy and appropriateness of disclosures for compliance with the requirements of IFRS.
Although the loan loss allowance is by nature highly judgmental, based on the results of our audit procedures, we concluded that the loan loss allowance is within a reasonable range and properly presented in accordance with IFRS as at 31 December 2018.
Independent auditor’s report to the members of Bank of Georgia Group PLC continued

158 Annual Report 2018 Bank of Georgia Group PLC 159Annual Report 2018 Bank of Georgia Group PLC
Strategic ReportStrategy
Strategic ReportPerformance Governance
FinancialStatements
AdditionalInformation
Strategic ReportOverview
Risk Our response to the risk Key observations communicated to the Audit Committee
Valuation of investment property
Investment property of GEL 151m and real estate classified as held-for-sale of GEL 42m (2017: investment property of GEL 354m)
The Group applies the fair value model for its investment property, which largely comprises real estate assets that were previously held as collateral against loans that have now defaulted.
Real estate valuations are inherently uncertain and subject to an estimation process. Furthermore, the Group’s real estate is located primarily in Georgia, where the secondary market is relatively illiquid. Although the real estate valuations are performed by appropriately qualified valuers, there remains a risk that individual assets might be inappropriately valued.
Management has reclassified certain properties as Held for Sale (HFS) reflecting increased focus on realisation of the property portfolio. Properties on the register at 1 November 2018, that were either actively marketed through websites or marketed in private with the help of brokers or personal contacts, were reclassified as HFS on the basis that a sale was highly probable. On reclassification to HFS, management applied a reduction in value of 1.5% to reflect costs to sell, and for assets for which active deals had been initiated the carrying value was adjusted to recoverable amount as required by IFRS 5 ‘Non-current Assets Held for Sale and Discontinued Operations’.
To support the carrying value of the investment properties and held for sale assets, management obtained market overviews for the major segments and geographical locations in which the Group operates from independent external valuers. They also obtained valuations for certain specific properties.
As a result of the Demerger of the Investment Business, which contained the properties with more complex valuations, the risk has decreased in the current year.
Refer to the Audit Committee Report (page 122); Accounting policies (pages 196); and Notes 3 and 11 to the financial statements
• We evaluated the competence, professional qualifications and objectivity of the external experts engaged by the Group to prepare overviews for various segments of the Georgian property market and valuation of certain items of investment property.
• Through reading the market overview reports and the valuation reports and through discussion with management and the valuers, we obtained an understanding of the objectives and scope of the experts’ work, the methods and assumptions that they had used and the conclusions that they had reached.
• We challenged the methods and assumptions used in the valuation reports, including consideration as to whether there was contrary market intelligence that had not been taken into account in the appraisers’ analyses.
• For items that were specifically revalued during the period, utilising our real estate valuation specialists we assessed the valuations performed by the external valuers. We verified the input data, the application of the methods and logic as well as the reasoning applied by the appraisers. We compared this information to the publicly available information on norms and benchmarks in the Georgian market.
• We applied the percentage movements shown in the market reports by type and location of real estate where available, to determine the overall impact on the value of investment property.
• We considered the gains and losses on real estate disposed of during the period, noting that individual gains and losses represented a wide range of the carrying value but did not indicate that the carrying value materially differed from fair value.
• We obtained the list of assets reclassified as held-for-sale and, for a sample of such items, verified the appropriateness of their classification as assets held for sale under IFRS5 by inspecting websites and broker reports to determine that a sale was highly probable.
• We considered whether the presentation and disclosure of real estate in the financial statements are in accordance with relevant accounting standards.
Based on the results of our audit procedures, we concluded that:• The independent
valuation reports obtained by management supported their assessment of the valuation of investment properties being within the market range.
• The Group has appropriately classified and measured the properties which it started to actively market and for which sales are highly probable.
• Valuation of real estate presented in Investment properties and Assets held for sale as at 31 December 2018 is materially fairly stated.
Risk Our response to the risk Key observations communicated to the Audit Committee
Revenue recognition
Gross revenue GEL 1,687m (2017: GEL 1,420m)
In applying IFRS 15 ‘Revenue from Contracts with Customers’, judgment is required to be exercised by management in determining the point at which it is appropriate to recognise revenue, and in particular the nature of performance obligations and the allocation of the contract price to those obligations. Specific considerations include the timing of recognition of revenue in respect of card servicing fees, bundled products and customer loyalty schemes.
The Group’s accounting systems are not configured to allow automated IFRS 15 accounting for revenue and the adjustments to conform to the requirements of IFRS 15 are booked as an overlay.
These factors mean that there is a greater risk of misstatement in revenue balances, either by fraud or error, including through the potential override of controls by management.
As a result of the Demerger of Banking and Investment Businesses of the Group in May 2018, certain revenue streams where revenue recognition followed a significantly more complex pattern than banking revenue, were transferred out of the Group. Consequently, the risk has been decreased in the current year.
Refer to the Accounting policies (page 199); and Notes 3, 21, and 22 to the financial statements.
• We gained an understanding of the revenue processes and assessed the design and operating effectiveness of key controls.
• We performed substantive testing of revenue transactions including key items testing and representative sampling where we agreed transactions to the underlying documentation, testing manual and topside adjustments and cut-off testing (by selecting a sample of transactions either side of year-end).
• For non-automated transactions, we agreed them on a sample basis to supporting evidence, including underlying contracts and cash receipts to determine whether revenue had been recognised in accordance with the Group’s accounting policies and IFRS. Where appropriate, we re-computed revenue and compared to reported amounts. The samples used for this testing were increased to reflect that revenue recognition is a significant risk.
• We specifically considered the timing of recognition of revenue in respect of card servicing fees, bundled products and customer loyalty schemes – we analysed the terms and conditions of new and existing products, reconciled these to the accounting data and validated the IFRS 15 adjustment calculation.
• We performed substantive audit procedures over the IFRS 15 adjustments, covering the timing of satisfaction of performance obligations, allocation of transaction price to each performance obligation and estimation of variable consideration amounts, if applicable, including analytical procedures, testing of key items and representative sample testing.
• We performed analytical procedures for revenue to consider unusual trends that could indicate material misstatements, including monthly fluctuations analysis and analysis of changes in key drivers of revenue.
• We performed journal entry testing in order to identify and test the risk of misstatement arising from management override of controls.
• We considered whether the presentation and disclosure of revenue in the financial statements are in accordance with relevant accounting standards.
Based on the results of our audit procedures, we concluded that revenue for the year ended 31 December 2018 has been recognised in accordance with IFRS.
Independent auditor’s report to the members of Bank of Georgia Group PLC continued

160 Annual Report 2018 Bank of Georgia Group PLC 161Annual Report 2018 Bank of Georgia Group PLC
Strategic ReportStrategy
Strategic ReportPerformance Governance
FinancialStatements
AdditionalInformation
Strategic ReportOverview
Audit team structureAll audit work for the purposes of the Group audit was undertaken by the primary audit team.
The Senior Statutory Auditor is based in the UK, but since the Group management and operations reside in Georgia, the Group audit team operates as an integrated primary team including members from the UK, Georgia, Russia and the CIS. The UK members of the audit team continued to follow a programme of planned visits that has been designed to make sure that the Senior Statutory Auditor visits the principal components of the Group. There was regular interaction between team members in each jurisdiction and the Senior Statutory Auditor and the UK members of the audit team visited Georgia five times during the current year’s audit.
These visits involved discussing the audit approach with the local team members and any issues arising from their work, as well as meeting with local management. In addition, the UK members of the team interacted regularly with the Georgia members of the team where appropriate during various stages of the audit and were responsible for the scope and direction of the audit process. This, together with the additional procedures performed at the UK level, gave us appropriate evidence for our opinion on the financial statements.
Our application of materialityWe apply the concept of materiality in planning and performing the audit, in evaluating the effect of identified misstatements on the audit and in forming our audit opinion.
MaterialityThe magnitude of an omission or misstatement that, individually or in the aggregate, could reasonably be expected to influence the economic decisions of the users of the financial statements. Materiality provides a basis for determining the nature and extent of our audit procedures.
We determined materiality for the Group to be GEL 20 million (2017: GEL 25 million), which was approximately 5% (2017: 5%) of forecast profit from continuing operations before tax and non-recurring items at the time of our audit planning. We consider that this adjusted profit figure best represents the results of the underlying operations of the Group and as such provides us with an appropriate basis for determining the nature, timing and extent of risk assessment procedures, identifying and assessing the risk of material misstatement and determining the nature, timing and extent of further audit procedures. Although the actual profit for the financial year exceeded the forecast, we decided to retain the original materiality amount. As a consequence, materiality is approximately 4% of actual profit from continuing operations before tax and non-recurring items.
Starting basis • Profit before tax from continuing operations: GEL 437.5 million
Adjustments • Non-recurring items: GEL 57.2 million
Materiality • Totals GEL 494.7 million (materiality basis)• Materiality of GEL 20.0 million (approx. 4% of materiality basis)
We determined materiality for the Parent Company to be GEL 70 million, which is approximately 2% of equity of £3,461m. We consider that, in respect of the Parent Company, equity is most relevant to the stakeholders and is best representative of the economic size of the entity and as such provides us with an appropriate basis for determining the nature, timing and extent of risk assessment procedures, identifying and assessing the risk of material misstatement and determining the nature, timing and extent of further audit procedures.
An overview of the scope of our auditTailoring the scopeOur assessment of audit risk, our evaluation of materiality and our allocation of performance materiality determine our audit scope for each entity within the Group. Taken together, this enables us to form an opinion on the financial statements. We take into account size, risk profile, the organisation of the Group and effectiveness of Group-wide controls, changes in the business environment and other factors such as recent Internal Audit findings when assessing the level of work to be performed at each entity.
In assessing the risk of material misstatement to the Group financial statements, and to ensure we had adequate quantitative coverage of significant accounts in the financial statements, of the 22 reporting components of the Group (pre-Demerger: 33), we selected four components covering entities within the UK and Georgia, which represent the principal business units within the Group.
Of the four components selected, we performed an audit of the complete financial information of three components (“full scope components”) which were selected based on their size or risk characteristics. For the remaining one component (“specific scope component”), we performed audit procedures on specific account balances within that component that we considered had the potential for the greatest impact on the significant accounts in the financial statements either because of the size of these accounts or their risk profile.
The reporting components where we performed audit procedures accounted for 99% (2017: 98%) of the Group’s Profit before non-recurring items and tax, 94% (2017: 91%) of the Group’s Revenue and 94% (2017: 96%) of the Group’s Total assets, all benchmarks related to continuing operations.
The table below illustrates the coverage obtained from the work we performed:
2018 2017No. Revenue Profit4 Total assets No. Revenue Profit4 Total assets
Full scope1 3 94% 99% 93% 5 88% 93% 94%
Specific scope2 1 0% 0% 1% 1 3% 5% 2%
Full and specific scope coverage 4 94% 99% 94% 6 91% 98% 96%
Remaining components3 18 6% 1% 6% 24 9% 2% 4%
Total reporting components 22 100% 100% 100% 30 100% 100% 100%
1. We audited the complete financial information.2. We audited specific account balances within these components. The audit scope of these components may not have included testing of all significant accounts of the
components but will have contributed to the coverage of significant accounts tested for the Group.3. We performed other procedures, including analytical review and testing of consolidation journal entries and intercompany eliminations to respond to any potential risks of
material misstatement to the Group financial statements.4. Profit from continuing operations before non-recurring items and tax.
The components for which we performed full or specific scope procedures are set out below:
Component Scope Location/teamBank of Georgia Group PLC Full London/primary teamBGEO Group Limited Full London/primary teamJSC Bank of Georgia Full Georgia/primary teamJSC BGEO Group Specific Georgia/primary team
Changes from the prior year For the year ended 31 December 2018, we changed the scope for JSC BGEO Group from full scope to specific scope because of the decrease in the size and risk characteristics of this component and we have removed from scope the components that have been transferred out of the Group as a result of the Demerger of Banking and Investment Businesses of the Group in May 2018. We have specifically verified that the profit and total comprehensive income from their operations together with the results of the Demerger have been properly presented in lines ‘Profit from discontinued operations’ in the consolidated income statement and ‘Total comprehensive income for the year from discontinued operations’ in the consolidated statement of comprehensive income, respectively.
Independent auditor’s report to the members of Bank of Georgia Group PLC continued
162 Annual Report 2018 Bank of Georgia Group PLC 163Annual Report 2018 Bank of Georgia Group PLC
Strategic ReportStrategy
Strategic ReportPerformance Governance
FinancialStatements
AdditionalInformation
Strategic ReportOverview
In this context, we also have nothing to report in regard to our responsibility to specifically address the following items in the other information and to report as uncorrected material misstatements of the other information where we conclude that those items meet the following conditions:• Fair, balanced and understandable set out on page 125 – the statement given by the Directors that they consider
the Annual Report and financial statements taken as a whole is fair, balanced and understandable and provide the information necessary for shareholders to assess the Group’s performance, business model and strategy, is materially inconsistent with our knowledge obtained in the audit; or
• Audit Committee reporting set out on pages 121 to 125 – the section describing the work of the Audit Committee does not appropriately address matters communicated by us to the Audit Committee; or
• Directors’ statement of compliance with the UK Corporate Governance Code set out on page 104 – the parts of the Directors’ statement required under the Listing Rules relating to the Company’s compliance with the UK Corporate Governance Code containing provisions specified for review by the auditor in accordance with Listing Rule 9.8.10R(2) do not properly disclose a departure from a relevant provision of the UK Corporate Governance Code.
Opinions on other matters prescribed by the Companies Act 2006In our opinion, the part of the Directors’ remuneration report to be audited has been properly prepared in accordance with the Companies Act 2006.
In our opinion, based on the work undertaken in the course of the audit:• the information given in the Strategic Report and the Directors’ Report for the financial year for which the financial
statements are prepared is consistent with the financial statements; and • the Strategic Report and the Directors’ Report have been prepared in accordance with applicable legal requirements.
Matters on which we are required to report by exceptionIn the light of the knowledge and understanding of the Group and the Parent Company and its environment obtained in the course of the audit, we have not identified material misstatements in the Strategic Report or the Directors’ Report.
We have nothing to report in respect of the following matters in relation to which the Companies Act 2006 requires us to report to you if, in our opinion:• adequate accounting records have not been kept by the Parent Company, or returns adequate for our audit have
not been received from branches not visited by us; or• the Parent Company financial statements and the part of the Directors’ remuneration report to be audited are not
in agreement with the accounting records and returns; or• certain disclosures of Directors’ remuneration specified by law are not made; or• we have not received all the information and explanations we require for our audit.
Responsibilities of DirectorsAs explained more fully in the Directors’ Responsibilities Statement set out on page 149, the Directors are responsible for the preparation of the financial statements and for being satisfied that they give a true and fair view, and for such internal control as the Directors determine is necessary to enable the preparation of financial statements that are free from material misstatement, whether due to fraud or error.
In preparing the financial statements, the Directors are responsible for assessing the Group’s and the Parent Company’s ability to continue as a going concern, disclosing, as applicable, matters related to going concern and using the going concern basis of accounting unless the Directors either intend to liquidate the Group or the Parent Company or to cease operations, or have no realistic alternative but to do so.
Auditor’s responsibilities for the audit of the financial statementsOur objectives are to obtain reasonable assurance about whether the financial statements as a whole are free from material misstatement, whether due to fraud or error, and to issue an auditor’s report that includes our opinion. Reasonable assurance is a high level of assurance, but is not a guarantee that an audit conducted in accordance with ISAs (UK) will always detect a material misstatement when it exists. Misstatements can arise from fraud or error and are considered material if, individually or in the aggregate, they could reasonably be expected to influence the economic decisions of users taken on the basis of these financial statements.
Performance materialityThe application of materiality at the individual account or balance level. It is set at an amount to reduce to an appropriately low level the probability that the aggregate of uncorrected and undetected misstatements exceeds materiality.
On the basis of our risk assessments, together with our assessment of the Group’s overall control environment, our judgment was that performance materiality was 50% (2017: 50%) of our planning materiality, namely GEL 10 million (2017: GEL 12.5 million).
Audit work at component locations for the purpose of obtaining audit coverage over significant financial statement accounts is undertaken based on a percentage of total performance materiality. The performance materiality set for each component is based on the relative scale and risk of the component to the Group as a whole and our assessment of the risk of misstatement at that component. In the current year, the performance materiality allocated to components was set at the level of the Group performance materiality, namely GEL 10 million.
Reporting thresholdAn amount below which identified misstatements are considered as being clearly trivial.
We agreed with the Audit Committee that we would report to them all uncorrected audit differences in excess of GEL 1 million (2017: GEL 1.25 million), which is set at 5% of planning materiality, as well as differences below that threshold that, in our view, warranted reporting on qualitative grounds.
We evaluate any uncorrected misstatements against both the quantitative measures of materiality discussed above and in light of other relevant qualitative considerations in forming our opinion.
Other informationThe other information comprises the information included in the Annual Report, other than the financial statements and our auditor’s report thereon, including the following sections of the Annual Report:• Strategic Report, including Overview, Strategy and Performance sections, set out on pages 1 to 101.• Governance section, including Directors’ Governance Overview, Shareholder and Stakeholder Engagement, Board of
Directors, Executive Management, Nomination Committee Report, Audit Committee Report, Risk Committee Report, Directors’ Remuneration Report, Statement of Directors’ Responsibilities and Directors’ Report, set out on pages 102 to 153.
• Additional information, including Abbreviations, References, Glossary and Shareholder information, set out on pages 284 to 288.
The Directors are responsible for the other information.
Our opinion on the financial statements does not cover the other information and, except to the extent otherwise explicitly stated in our report, we do not express any form of assurance conclusion thereon.
In connection with our audit of the financial statements, our responsibility is to read the other information and, in doing so, consider whether the other information is materially inconsistent with the financial statements or our knowledge obtained in the audit or otherwise appears to be materially misstated. If we identify such material inconsistencies or apparent material misstatements, we are required to determine whether there is a material misstatement in the financial statements or a material misstatement of the other information. If, based on the work we have performed, we conclude that there is a material misstatement of the other information, we are required to report that fact.
We have nothing to report in this regard.
Independent auditor’s report to the members of Bank of Georgia Group PLC continued
164 Annual Report 2018 Bank of Georgia Group PLC 165Annual Report 2018 Bank of Georgia Group PLC
Strategic ReportStrategy
Strategic ReportPerformance Governance
FinancialStatements
AdditionalInformation
Strategic ReportOverview
Other matters which we are required to addressWe were appointed by Bank of Georgia Group PLC on 25 January 2018 to audit the financial statements for the first accounting period ending 31 December 2017 and subsequent annual financial periods. The period of total uninterrupted engagement is 14 months, covering the first accounting period ended 31 December 2017 and the year ended 31 December 2018.
The non-audit services prohibited by the FRC’s Ethical Standard were not provided to the Group or the Parent Company and we remain independent of the Group and the Parent Company in conducting our audit.
Our audit opinion is consistent with the additional report to the Audit Committee.
Use of our reportThis report is made solely to the Company’s members, as a body, in accordance with Chapter 3 of Part 16 of the Companies Act 2006. Our audit work has been undertaken so that we might state to the Company’s members those matters we are required to state to them in an auditor’s report and for no other purpose. To the fullest extent permitted by law, we do not accept or assume responsibility to anyone other than the Company and the Company’s members as a body, for our audit work, for this report, or for the opinions we have formed.
John Headley (Senior Statutory Auditor)for and on behalf of Ernst & Young LLP, Statutory AuditorLondon27 March 2019
Notes:1. The maintenance and integrity of the Bank of Georgia Group PLC’s website is the responsibility of the Directors; the work carried out by the auditors does not involve
consideration of these matters and, accordingly, the auditors accept no responsibility for any changes that may have occurred to the financial statements since they were initially presented on the website.
2. Legislation in the United Kingdom governing the preparation and dissemination of financial statements may differ from legislation in other jurisdictions.
Explanation as to what extent the audit was considered capable of detecting irregularities, including fraudThe objectives of our audit:• in respect to fraud, are: to identify and assess the risks of material misstatement of the financial statements due
to fraud; to obtain sufficient appropriate audit evidence regarding the assessed risks of material misstatement due to fraud, through designing and implementing appropriate responses; and to respond appropriately to fraud or suspected fraud identified during the audit. However, the primary responsibility for the prevention and detection of fraud rests with both those charged with governance of the entity and management; and
• in respect to irregularities, considered to be non-compliance with laws and regulations, are: to obtain sufficient appropriate audit evidence regarding compliance with the provisions of those laws and regulations generally recognised to have a direct effect on the determination of material amounts and disclosures in the financial statements (‘direct laws and regulations’), and perform other audit procedures to help identify instances of non-compliance with other laws and regulations that may have a material effect on the financial statements. We are not responsible for preventing non-compliance with laws and regulations and our audit procedures cannot be expected to detect non-compliance with all laws and regulations.
Our approach was as follows:
• We obtained a general understanding of the legal and regulatory frameworks that are applicable to the Group and determined that the most significant were the relevant regulations of the UK Listing Authority (‘UKLA’), as well as the various Georgian legal and regulatory requirements applying to the components of the Group, of which the most material are the regulations of the National Bank of Georgia.
• We obtained a general understanding of how the Group complies with these legal and regulatory frameworks by making enquiries of management, internal audit, and those responsible for legal and compliance matters. We also reviewed correspondence between the Group and its regulators; reviewed minutes of the Board and Executive Risk Committee; and gained an understanding of the Group’s approach to governance, demonstrated by the Board’s approval of the Group’s governance framework and the Board’s review of the Group’s risk management framework (‘RMF’) and internal control processes.
• For direct laws and regulations, we considered the extent of compliance with those laws and regulations as part of our procedures on the related financial statement items.
• For both direct and other laws and regulations, our procedures involved: making enquiry of those charged with governance and senior management for their awareness of any non-compliance of laws or regulations, inquiring about the policies that have been established to prevent non-compliance with laws and regulations by officers and employees, inquiring about the Group’s methods of enforcing and monitoring compliance with such policies, inspecting significant correspondence with the regulators.
• The Group operates in the banking industry which is a highly regulated environment. As such, the Senior Statutory Auditor considered the experience and expertise of the engagement team to ensure that the team had the appropriate competence and capabilities which included the use of specialists where appropriate.
• We assessed the susceptibility of the Group’s financial statements to material misstatement, including how fraud might occur, by considering the controls that the Group has established to address risks identified by the entity, or that otherwise seek to prevent, deter or detect fraud. We also considered areas of significant judgment, complex transactions, performance targets, economic or external pressures and the impact these have on the control environment. Where this risk was considered to be higher, we performed audit procedures to address each identified fraud risk which included management, internal audit and legal enquiries, testing of internal control, journal entry testing, analytical procedures, tests of detail and focused testing as referred to in the Key Audit Matters section above. These procedures were designed to provide reasonable assurance that the financial statements were free from fraud or error.
A further description of our responsibilities for the audit of the financial statements is located on the Financial Reporting Council’s website at https://www.frc.org.uk/auditorsresponsibilities. This description forms part of our auditor’s report.
Independent auditor’s report to the members of Bank of Georgia Group PLC continued
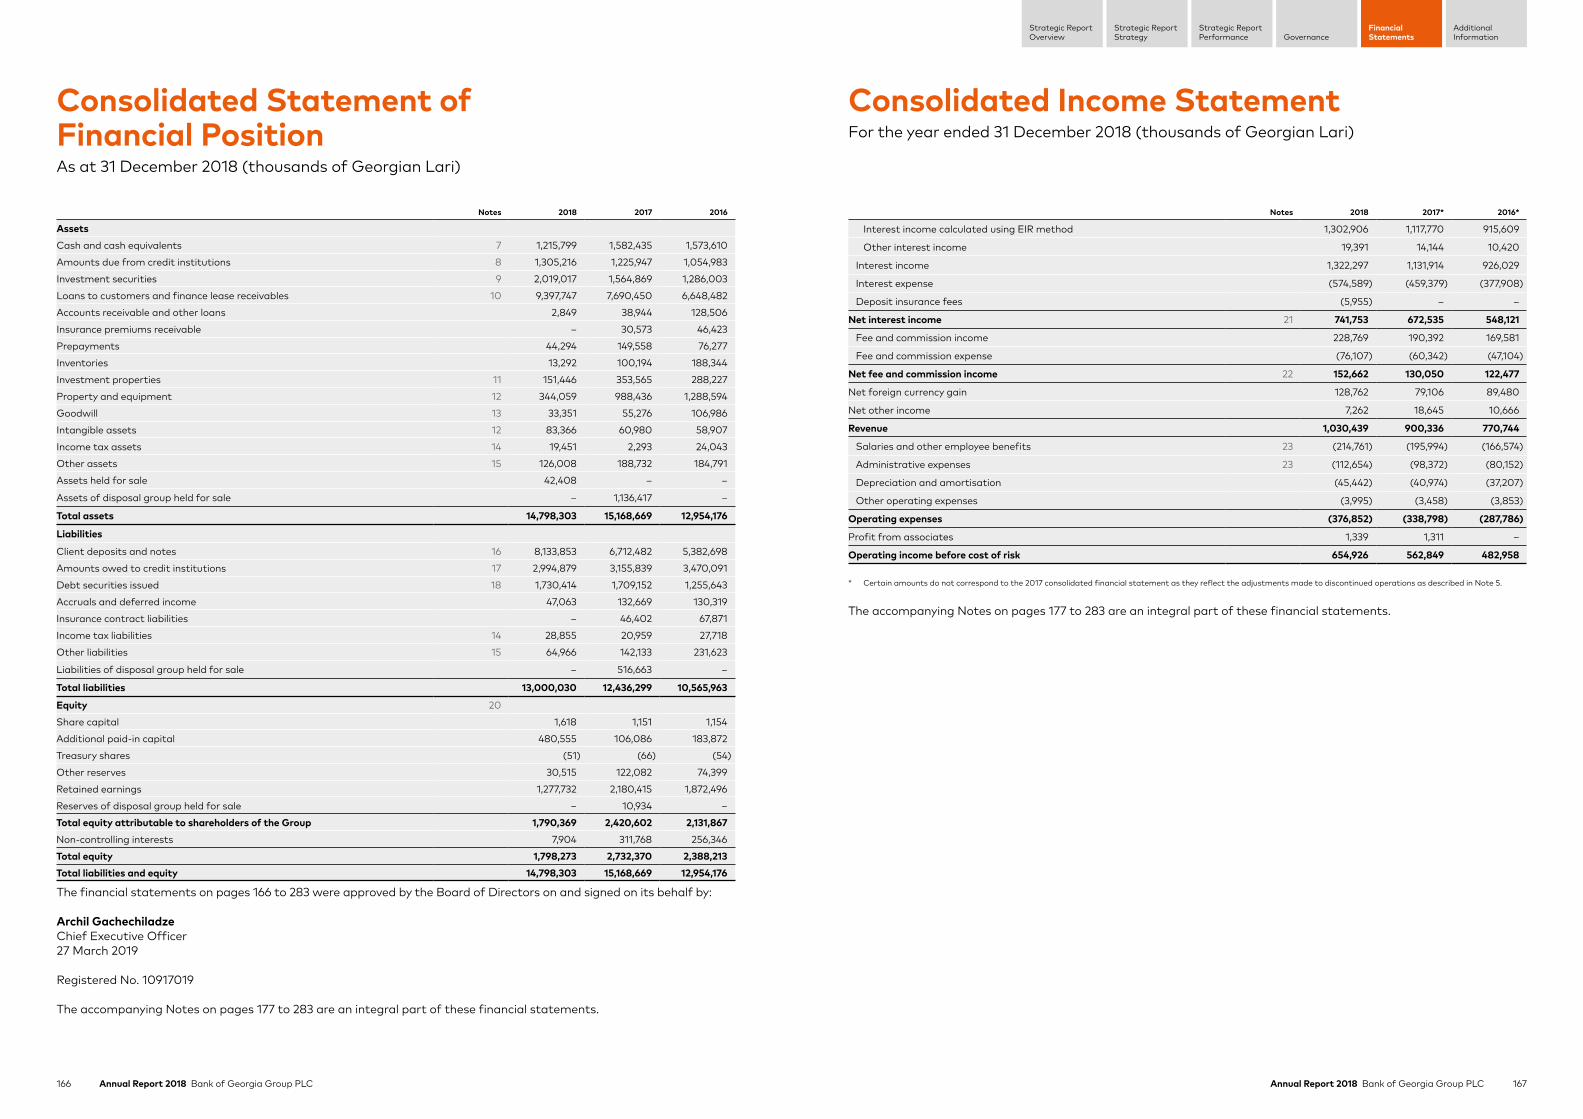
166 Annual Report 2018 Bank of Georgia Group PLC 167Annual Report 2018 Bank of Georgia Group PLC
Strategic ReportStrategy
Strategic ReportPerformance Governance
FinancialStatements
AdditionalInformation
Strategic ReportOverview
Consolidated Income StatementFor the year ended 31 December 2018 (thousands of Georgian Lari)
Consolidated Statement of Financial PositionAs at 31 December 2018 (thousands of Georgian Lari)
Notes 2018 2017 2016
AssetsCash and cash equivalents 7 1,215,799 1,582,435 1,573,610
Amounts due from credit institutions 8 1,305,216 1,225,947 1,054,983
Investment securities 9 2,019,017 1,564,869 1,286,003
Loans to customers and finance lease receivables 10 9,397,747 7,690,450 6,648,482
Accounts receivable and other loans 2,849 38,944 128,506
Insurance premiums receivable – 30,573 46,423
Prepayments 44,294 149,558 76,277
Inventories 13,292 100,194 188,344
Investment properties 11 151,446 353,565 288,227
Property and equipment 12 344,059 988,436 1,288,594
Goodwill 13 33,351 55,276 106,986
Intangible assets 12 83,366 60,980 58,907
Income tax assets 14 19,451 2,293 24,043
Other assets 15 126,008 188,732 184,791
Assets held for sale 42,408 – –
Assets of disposal group held for sale – 1,136,417 –
Total assets 14,798,303 15,168,669 12,954,176
Liabilities
Client deposits and notes 16 8,133,853 6,712,482 5,382,698
Amounts owed to credit institutions 17 2,994,879 3,155,839 3,470,091
Debt securities issued 18 1,730,414 1,709,152 1,255,643
Accruals and deferred income 47,063 132,669 130,319
Insurance contract liabilities – 46,402 67,871
Income tax liabilities 14 28,855 20,959 27,718
Other liabilities 15 64,966 142,133 231,623
Liabilities of disposal group held for sale – 516,663 –
Total liabilities 13,000,030 12,436,299 10,565,963
Equity 20
Share capital 1,618 1,151 1,154
Additional paid-in capital 480,555 106,086 183,872
Treasury shares (51) (66) (54)
Other reserves 30,515 122,082 74,399
Retained earnings 1,277,732 2,180,415 1,872,496
Reserves of disposal group held for sale – 10,934 –
Total equity attributable to shareholders of the Group 1,790,369 2,420,602 2,131,867Non-controlling interests 7,904 311,768 256,346
Total equity 1,798,273 2,732,370 2,388,213Total liabilities and equity 14,798,303 15,168,669 12,954,176
The financial statements on pages 166 to 283 were approved by the Board of Directors on and signed on its behalf by:
Archil GachechiladzeChief Executive Officer27 March 2019
Registered No. 10917019
The accompanying Notes on pages 177 to 283 are an integral part of these financial statements.
Notes 2018 2017* 2016*
Interest income calculated using EIR method 1,302,906 1,117,770 915,609
Other interest income 19,391 14,144 10,420
Interest income 1,322,297 1,131,914 926,029
Interest expense (574,589) (459,379) (377,908)
Deposit insurance fees (5,955) – –
Net interest income 21 741,753 672,535 548,121
Fee and commission income 228,769 190,392 169,581
Fee and commission expense (76,107) (60,342) (47,104)
Net fee and commission income 22 152,662 130,050 122,477
Net foreign currency gain 128,762 79,106 89,480
Net other income 7,262 18,645 10,666
Revenue 1,030,439 900,336 770,744
Salaries and other employee benefits 23 (214,761) (195,994) (166,574)
Administrative expenses 23 (112,654) (98,372) (80,152)
Depreciation and amortisation (45,442) (40,974) (37,207)
Other operating expenses (3,995) (3,458) (3,853)
Operating expenses (376,852) (338,798) (287,786)
Profit from associates 1,339 1,311 –
Operating income before cost of risk 654,926 562,849 482,958
* Certain amounts do not correspond to the 2017 consolidated financial statement as they reflect the adjustments made to discontinued operations as described in Note 5.
The accompanying Notes on pages 177 to 283 are an integral part of these financial statements.

168 Annual Report 2018 Bank of Georgia Group PLC 169Annual Report 2018 Bank of Georgia Group PLC
Strategic ReportStrategy
Strategic ReportPerformance Governance
FinancialStatements
AdditionalInformation
Strategic ReportOverview
Consolidated Statement of Comprehensive IncomeFor the year ended 31 December 2018 (thousands of Georgian Lari)
Consolidated Income Statement continuedFor the year ended 31 December 2018 (thousands of Georgian Lari)
Notes 2018 2017* 2016*
Operating income before cost of risk 654,926 562,849 482,958
Expected credit loss/impairment charge on loans to customers 24 (139,499) (155,210) (158,892)
Expected credit loss/impairment charge on finance lease receivables 24 (164) (496) (777)
Other expected credit loss 24 (2,799) – –
Impairment charge on other assets and provisions (17,763) (11,590) (8,083)
Cost of risk (160,225) (167,296) (167,752)
Net operating income before non-recurring items 494,701 395,553 315,206
Net non-recurring items 25 (57,156) (4,300) (45,355)
Profit before income tax expense from continuing operations 437,545 391,253 269,851
Income tax (expense) gain 14 (56,665) (26,592) 26,444
Profit for the year from continuing operations 380,880 364,661 296,295
Profit from discontinued operations 5 107,898 98,788 132,281
Profit for the year 488,778 463,449 428,576
Total profit attributable to:
– shareholders of BOGG 468,996 437,615 398,538
– non-controlling interests 19,782 25,834 30,038
488,778 463,449 428,576
Profit from continuing operations attributable to:
– shareholders of BOGG 379,313 362,971 293,773
– non-controlling interests 1,567 1,690 2,522
380,880 364,661 296,295
Profit from discontinued operations attributable to:
– shareholders of BOGG 89,683 74,644 104,765
– non-controlling interests 18,215 24,144 27,516
107,898 98,788 132,281
Basic earnings per share: 20 10.7783 11.6086 10.4148
– earnings per share from continuing operations 8.7173 9.6285 7.6771
– earnings per share from discontinued operations 2.0610 1.9801 2.7377
Diluted earnings per share: 20 10.7125 11.0724 10.0895
– earnings per share from continuing operations 8.6640 9.1838 7.4372
– earnings per share from discontinued operations 2.0485 1.8886 2.6523
* Certain amounts do not correspond to the 2017 consolidated financial statement as they reflect the adjustments made to discontinued operations as described in Note 5.
The accompanying Notes on pages 177 to 283 are an integral part of these financial statements.
Notes 2018 2017* 2016*
Profit for the year 488,778 463,449 428,576
Other comprehensive (loss) income from continuing operations
Other comprehensive (loss) income from continuing operations to be reclassified to profit or loss in subsequent periods:
– Net change in fair value on investments in debt instruments measured at FVOCI 1,571 n/a n/a
– Unrealised revaluation of available-for-sale securities n/a 3,862 86,245
– Realised gain on financial assets measured at FVOCI (137) n/a n/a
– Realised gain on available-for-sale securities reclassified to the consolidated income statement n/a (2,060) (28,325)
– Change in allowance for expected credit losses on investments in debt instruments measured at FVOCI reclassified to the consolidated income statement 792 n/a n/a
– (Loss) gain from currency translation differences (4,737) (6,383) 11,088
Income tax impact 14 (265) (549) (2,274)
Net other comprehensive (loss) income from continuing operations to be reclassified to profit or loss in subsequent periods (2,776) (5,130) 66,734
Other comprehensive (loss) income from continuing operations not to be reclassified to profit or loss in subsequent periods:
– Revaluation of property and equipment reclassified to investment property 1,455 3,483 –
– Net loss on investments in equity instruments designated at FVOCI (2,525) – –
Income tax impact 14 – (779) –
Impact of income tax changes on associates – – 5,580
Net other comprehensive (loss) income from continuing operations not to be reclassified to profit or loss in subsequent periods (1,070) 2,704 5,580
Other comprehensive (loss) income for the year from discontinued operations to be reclassified to profit or loss in subsequent periods 5 (10,881) (3,850) 1,429
Other comprehensive (loss) income for the year from discontinued operations not to be reclassified to profit or loss in subsequent periods 5 – (4,564) 20,804
Other comprehensive (loss) income for the year, net of tax (14,727) (10,840) 94,547
Total comprehensive income for the year from continuing operations 377,034 362,235 368,609
Total comprehensive income for the year from discontinued operations 97,017 90,374 154,514
Total comprehensive income for the year 474,051 452,609 523,123
Total comprehensive income attributable to:
– shareholders of BOGG 453,591 429,916 486,799
– non-controlling interests 20,460 22,693 36,324
474,051 452,609 523,123
Total comprehensive income from continuing operations attributable to:
– shareholders of BOGG 374,789 361,280 367,459
– non-controlling interests 2,245 955 1,150
377,034 362,235 368,609
Total comprehensive income from discontinued operations attributable to:
– shareholders of BOGG 78,802 68,636 119,340
– non-controlling interests 18,215 21,738 35,174
97,017 90,374 154,514
* Certain amounts do not correspond to the 2017 consolidated financial statement as they reflect the adjustments made to discontinued operations as described in Note 5.
The accompanying Notes on pages 177 to 283 are an integral part of these financial statements.
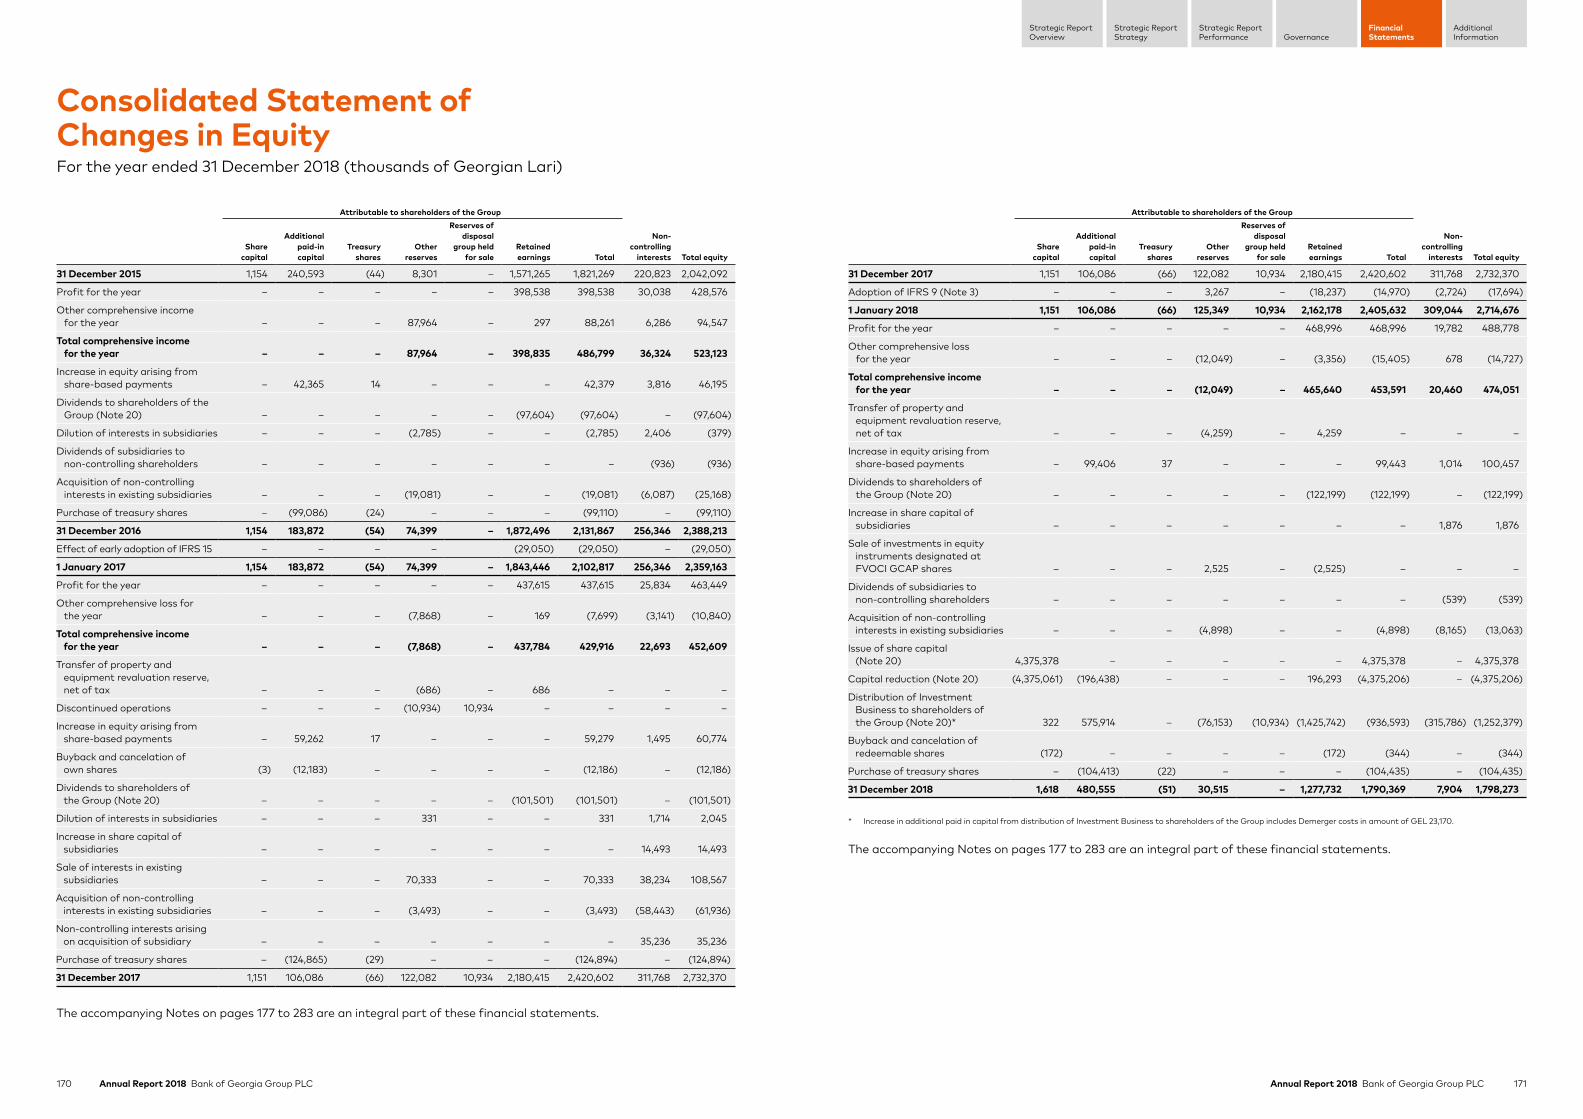
170 Annual Report 2018 Bank of Georgia Group PLC 171Annual Report 2018 Bank of Georgia Group PLC
Strategic ReportStrategy
Strategic ReportPerformance Governance
FinancialStatements
AdditionalInformation
Strategic ReportOverview
Consolidated Statement of Changes in EquityFor the year ended 31 December 2018 (thousands of Georgian Lari)
Attributable to shareholders of the Group
Share capital
Additional paid-in capital
Treasury shares
Other reserves
Reserves of disposal
group held for sale
Retained earnings Total
Non-controlling
interests Total equity
31 December 2015 1,154 240,593 (44) 8,301 – 1,571,265 1,821,269 220,823 2,042,092
Profit for the year – – – – – 398,538 398,538 30,038 428,576
Other comprehensive income for the year – – – 87,964 – 297 88,261 6,286 94,547
Total comprehensive income for the year – – – 87,964 – 398,835 486,799 36,324 523,123
Increase in equity arising from share-based payments – 42,365 14 – – – 42,379 3,816 46,195
Dividends to shareholders of the Group (Note 20) – – – – – (97,604) (97,604) – (97,604)
Dilution of interests in subsidiaries – – – (2,785) – – (2,785) 2,406 (379)
Dividends of subsidiaries to non-controlling shareholders – – – – – – – (936) (936)
Acquisition of non-controlling interests in existing subsidiaries – – – (19,081) – – (19,081) (6,087) (25,168)
Purchase of treasury shares – (99,086) (24) – – – (99,110) – (99,110)
31 December 2016 1,154 183,872 (54) 74,399 – 1,872,496 2,131,867 256,346 2,388,213
Effect of early adoption of IFRS 15 – – – – (29,050) (29,050) – (29,050)
1 January 2017 1,154 183,872 (54) 74,399 – 1,843,446 2,102,817 256,346 2,359,163
Profit for the year – – – – – 437,615 437,615 25,834 463,449
Other comprehensive loss for the year – – – (7,868) – 169 (7,699) (3,141) (10,840)
Total comprehensive income for the year – – – (7,868) – 437,784 429,916 22,693 452,609
Transfer of property and equipment revaluation reserve, net of tax – – – (686) – 686 – – –
Discontinued operations – – – (10,934) 10,934 – – – –
Increase in equity arising from share-based payments – 59,262 17 – – – 59,279 1,495 60,774
Buyback and cancelation of own shares (3) (12,183) – – – – (12,186) – (12,186)
Dividends to shareholders of the Group (Note 20) – – – – – (101,501) (101,501) – (101,501)
Dilution of interests in subsidiaries – – – 331 – – 331 1,714 2,045
Increase in share capital of subsidiaries – – – – – – – 14,493 14,493
Sale of interests in existing subsidiaries – – – 70,333 – – 70,333 38,234 108,567
Acquisition of non-controlling interests in existing subsidiaries – – – (3,493) – – (3,493) (58,443) (61,936)
Non-controlling interests arising on acquisition of subsidiary – – – – – – – 35,236 35,236
Purchase of treasury shares – (124,865) (29) – – – (124,894) – (124,894)
31 December 2017 1,151 106,086 (66) 122,082 10,934 2,180,415 2,420,602 311,768 2,732,370
Attributable to shareholders of the Group
Share capital
Additional paid-in capital
Treasury shares
Other reserves
Reserves of disposal
group held for sale
Retained earnings Total
Non-controlling
interests Total equity
31 December 2017 1,151 106,086 (66) 122,082 10,934 2,180,415 2,420,602 311,768 2,732,370
Adoption of IFRS 9 (Note 3) – – – 3,267 – (18,237) (14,970) (2,724) (17,694)
1 January 2018 1,151 106,086 (66) 125,349 10,934 2,162,178 2,405,632 309,044 2,714,676
Profit for the year – – – – – 468,996 468,996 19,782 488,778
Other comprehensive loss for the year – – – (12,049) – (3,356) (15,405) 678 (14,727)
Total comprehensive income for the year – – – (12,049) – 465,640 453,591 20,460 474,051
Transfer of property and equipment revaluation reserve, net of tax – – – (4,259) – 4,259 – – –
Increase in equity arising from share-based payments – 99,406 37 – – – 99,443 1,014 100,457
Dividends to shareholders of the Group (Note 20) – – – – – (122,199) (122,199) – (122,199)
Increase in share capital of subsidiaries – – – – – – – 1,876 1,876
Sale of investments in equity instruments designated at FVOCI GCAP shares – – – 2,525 – (2,525) – – –
Dividends of subsidiaries to non-controlling shareholders – – – – – – – (539) (539)
Acquisition of non-controlling interests in existing subsidiaries – – – (4,898) – – (4,898) (8,165) (13,063)
Issue of share capital (Note 20) 4,375,378 – – – – – 4,375,378 – 4,375,378
Capital reduction (Note 20) (4,375,061) (196,438) – – – 196,293 (4,375,206) – (4,375,206)
Distribution of Investment Business to shareholders of the Group (Note 20)* 322 575,914 – (76,153) (10,934) (1,425,742) (936,593) (315,786) (1,252,379)
Buyback and cancelation of redeemable shares (172) – – – – (172) (344) – (344)
Purchase of treasury shares – (104,413) (22) – – – (104,435) – (104,435)
31 December 2018 1,618 480,555 (51) 30,515 – 1,277,732 1,790,369 7,904 1,798,273
* Increase in additional paid in capital from distribution of Investment Business to shareholders of the Group includes Demerger costs in amount of GEL 23,170.
The accompanying Notes on pages 177 to 283 are an integral part of these financial statements.
The accompanying Notes on pages 177 to 283 are an integral part of these financial statements.
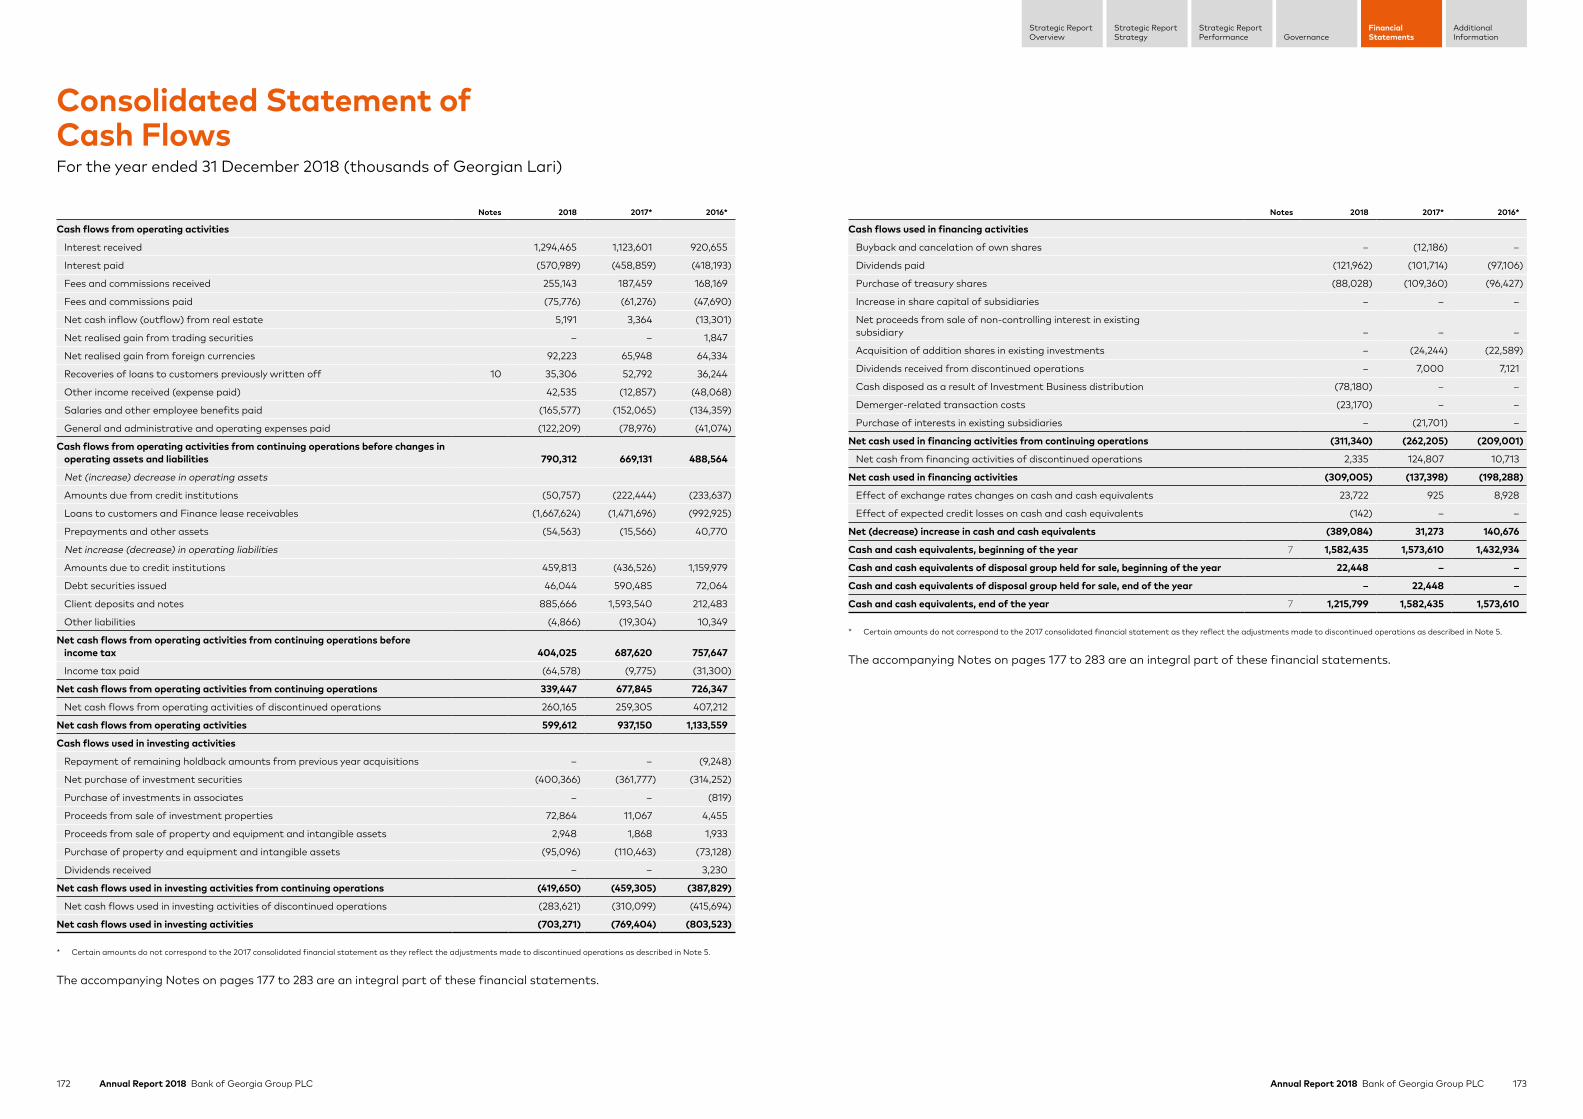
172 Annual Report 2018 Bank of Georgia Group PLC 173Annual Report 2018 Bank of Georgia Group PLC
Strategic ReportStrategy
Strategic ReportPerformance Governance
FinancialStatements
AdditionalInformation
Strategic ReportOverview
Consolidated Statement of Cash FlowsFor the year ended 31 December 2018 (thousands of Georgian Lari)
Notes 2018 2017* 2016*
Cash flows from operating activities
Interest received 1,294,465 1,123,601 920,655
Interest paid (570,989) (458,859) (418,193)
Fees and commissions received 255,143 187,459 168,169
Fees and commissions paid (75,776) (61,276) (47,690)
Net cash inflow (outflow) from real estate 5,191 3,364 (13,301)
Net realised gain from trading securities – – 1,847
Net realised gain from foreign currencies 92,223 65,948 64,334
Recoveries of loans to customers previously written off 10 35,306 52,792 36,244
Other income received (expense paid) 42,535 (12,857) (48,068)
Salaries and other employee benefits paid (165,577) (152,065) (134,359)
General and administrative and operating expenses paid (122,209) (78,976) (41,074)
Cash flows from operating activities from continuing operations before changes in operating assets and liabilities 790,312 669,131 488,564
Net (increase) decrease in operating assets
Amounts due from credit institutions (50,757) (222,444) (233,637)
Loans to customers and Finance lease receivables (1,667,624) (1,471,696) (992,925)
Prepayments and other assets (54,563) (15,566) 40,770
Net increase (decrease) in operating liabilities
Amounts due to credit institutions 459,813 (436,526) 1,159,979
Debt securities issued 46,044 590,485 72,064
Client deposits and notes 885,666 1,593,540 212,483
Other liabilities (4,866) (19,304) 10,349
Net cash flows from operating activities from continuing operations before income tax 404,025 687,620 757,647
Income tax paid (64,578) (9,775) (31,300)
Net cash flows from operating activities from continuing operations 339,447 677,845 726,347
Net cash flows from operating activities of discontinued operations 260,165 259,305 407,212
Net cash flows from operating activities 599,612 937,150 1,133,559
Cash flows used in investing activities
Repayment of remaining holdback amounts from previous year acquisitions – – (9,248)
Net purchase of investment securities (400,366) (361,777) (314,252)
Purchase of investments in associates – – (819)
Proceeds from sale of investment properties 72,864 11,067 4,455
Proceeds from sale of property and equipment and intangible assets 2,948 1,868 1,933
Purchase of property and equipment and intangible assets (95,096) (110,463) (73,128)
Dividends received – – 3,230
Net cash flows used in investing activities from continuing operations (419,650) (459,305) (387,829)
Net cash flows used in investing activities of discontinued operations (283,621) (310,099) (415,694)
Net cash flows used in investing activities (703,271) (769,404) (803,523)
* Certain amounts do not correspond to the 2017 consolidated financial statement as they reflect the adjustments made to discontinued operations as described in Note 5.
The accompanying Notes on pages 177 to 283 are an integral part of these financial statements.
Notes 2018 2017* 2016*
Cash flows used in financing activities
Buyback and cancelation of own shares – (12,186) –
Dividends paid (121,962) (101,714) (97,106)
Purchase of treasury shares (88,028) (109,360) (96,427)
Increase in share capital of subsidiaries – – –
Net proceeds from sale of non-controlling interest in existing subsidiary – – –
Acquisition of addition shares in existing investments – (24,244) (22,589)
Dividends received from discontinued operations – 7,000 7,121
Cash disposed as a result of Investment Business distribution (78,180) – –
Demerger-related transaction costs (23,170) – –
Purchase of interests in existing subsidiaries – (21,701) –
Net cash used in financing activities from continuing operations (311,340) (262,205) (209,001)
Net cash from financing activities of discontinued operations 2,335 124,807 10,713
Net cash used in financing activities (309,005) (137,398) (198,288)
Effect of exchange rates changes on cash and cash equivalents 23,722 925 8,928
Effect of expected credit losses on cash and cash equivalents (142) – –
Net (decrease) increase in cash and cash equivalents (389,084) 31,273 140,676
Cash and cash equivalents, beginning of the year 7 1,582,435 1,573,610 1,432,934
Cash and cash equivalents of disposal group held for sale, beginning of the year 22,448 – –
Cash and cash equivalents of disposal group held for sale, end of the year – 22,448 –
Cash and cash equivalents, end of the year 7 1,215,799 1,582,435 1,573,610
* Certain amounts do not correspond to the 2017 consolidated financial statement as they reflect the adjustments made to discontinued operations as described in Note 5.
The accompanying Notes on pages 177 to 283 are an integral part of these financial statements.
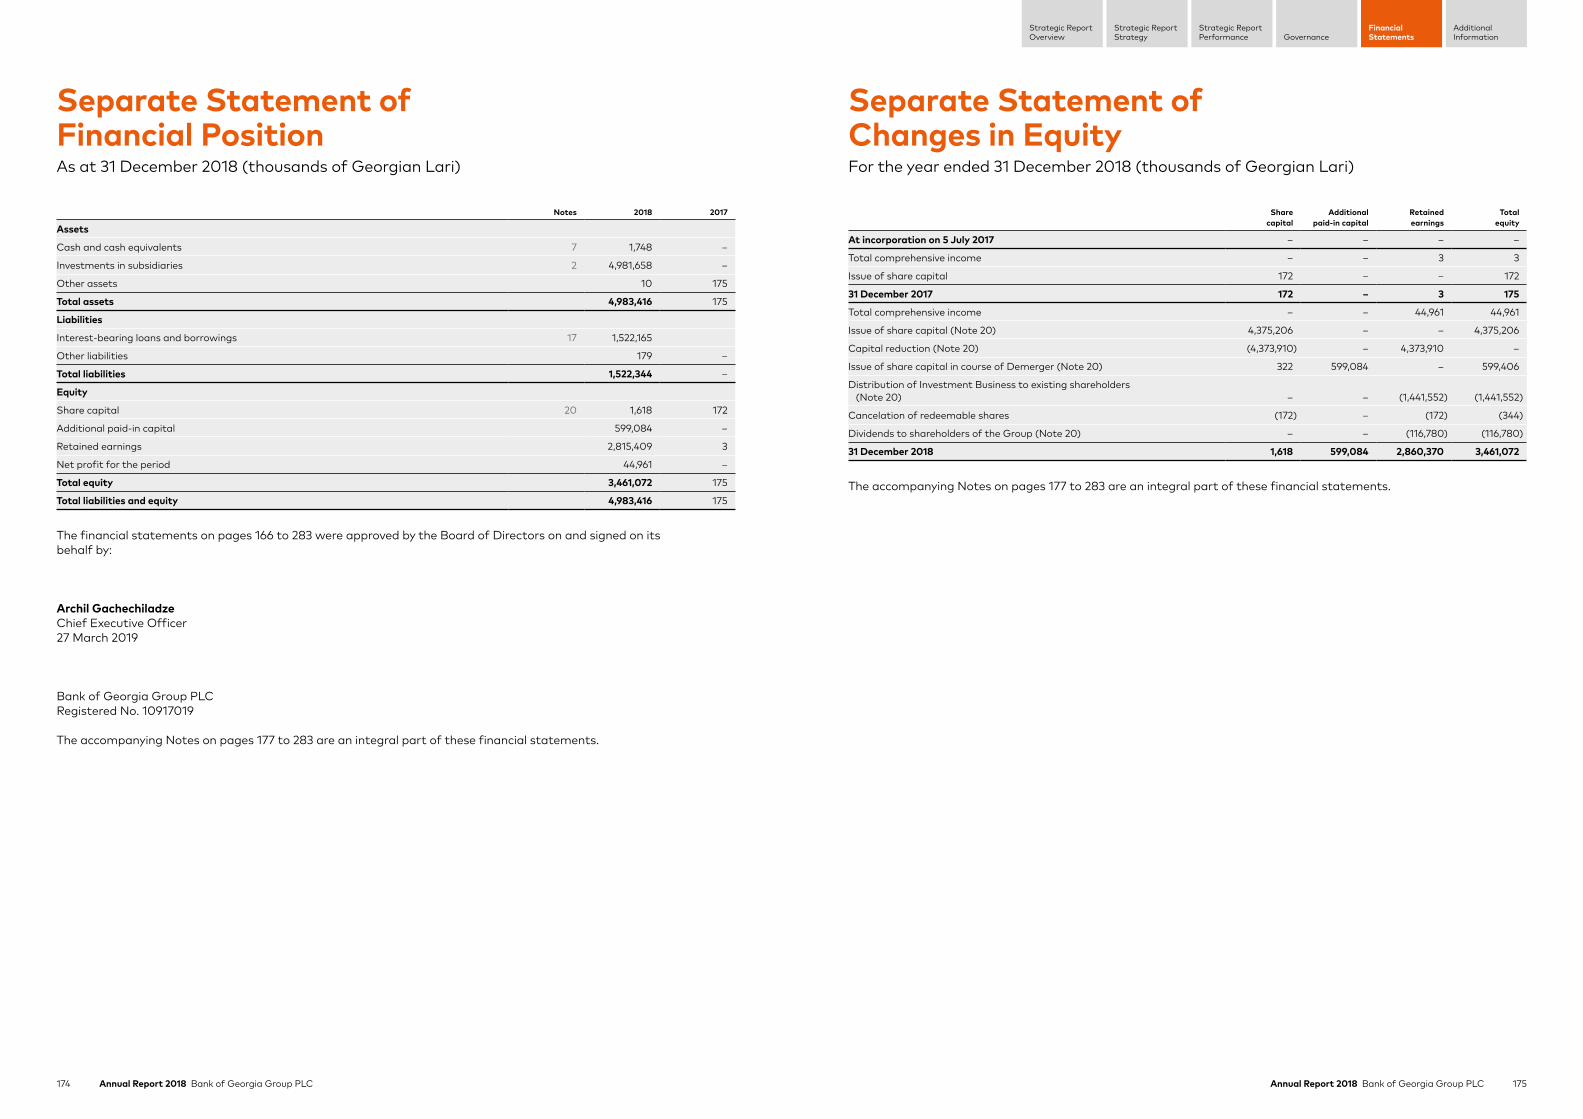
174 Annual Report 2018 Bank of Georgia Group PLC 175Annual Report 2018 Bank of Georgia Group PLC
Strategic ReportStrategy
Strategic ReportPerformance Governance
FinancialStatements
AdditionalInformation
Strategic ReportOverview
Separate Statement of Financial PositionAs at 31 December 2018 (thousands of Georgian Lari)
Notes 2018 2017
Assets
Cash and cash equivalents 7 1,748 –
Investments in subsidiaries 2 4,981,658 –
Other assets 10 175
Total assets 4,983,416 175
Liabilities
Interest-bearing loans and borrowings 17 1,522,165
Other liabilities 179 –
Total liabilities 1,522,344 –
Equity
Share capital 20 1,618 172
Additional paid-in capital 599,084 –
Retained earnings 2,815,409 3
Net profit for the period 44,961 –
Total equity 3,461,072 175
Total liabilities and equity 4,983,416 175
The financial statements on pages 166 to 283 were approved by the Board of Directors on and signed on its behalf by:
Archil GachechiladzeChief Executive Officer27 March 2019
Bank of Georgia Group PLCRegistered No. 10917019
The accompanying Notes on pages 177 to 283 are an integral part of these financial statements.
Separate Statement of Changes in EquityFor the year ended 31 December 2018 (thousands of Georgian Lari)
Sharecapital
Additionalpaid-in capital
Retained earnings
Totalequity
At incorporation on 5 July 2017 – – – –
Total comprehensive income – – 3 3
Issue of share capital 172 – – 172
31 December 2017 172 – 3 175
Total comprehensive income – – 44,961 44,961
Issue of share capital (Note 20) 4,375,206 – – 4,375,206
Capital reduction (Note 20) (4,373,910) – 4,373,910 –
Issue of share capital in course of Demerger (Note 20) 322 599,084 – 599,406
Distribution of Investment Business to existing shareholders (Note 20) – – (1,441,552) (1,441,552)
Cancelation of redeemable shares (172) – (172) (344)
Dividends to shareholders of the Group (Note 20) – – (116,780) (116,780)
31 December 2018 1,618 599,084 2,860,370 3,461,072
The accompanying Notes on pages 177 to 283 are an integral part of these financial statements.
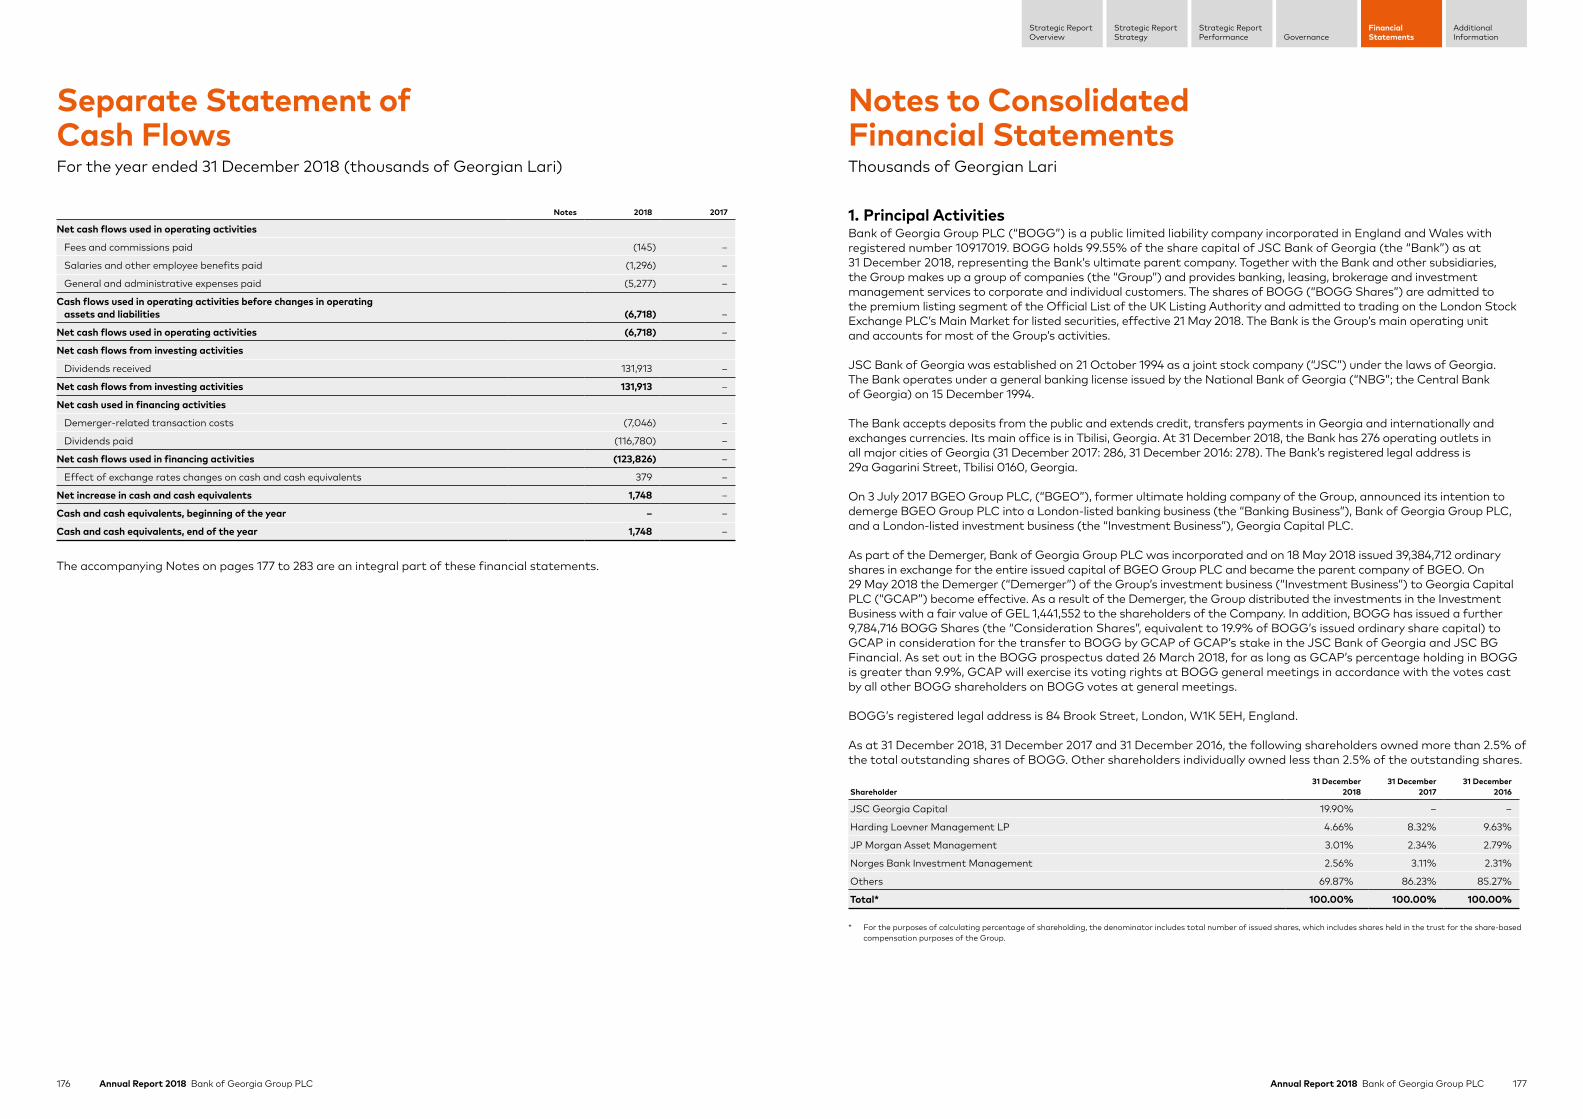
176 Annual Report 2018 Bank of Georgia Group PLC 177Annual Report 2018 Bank of Georgia Group PLC
Strategic ReportStrategy
Strategic ReportPerformance Governance
FinancialStatements
AdditionalInformation
Strategic ReportOverview
Separate Statement of Cash FlowsFor the year ended 31 December 2018 (thousands of Georgian Lari)
Notes 2018 2017
Net cash flows used in operating activities
Fees and commissions paid (145) –
Salaries and other employee benefits paid (1,296) –
General and administrative expenses paid (5,277) –
Cash flows used in operating activities before changes in operating assets and liabilities (6,718) –
Net cash flows used in operating activities (6,718) –
Net cash flows from investing activities
Dividends received 131,913 –
Net cash flows from investing activities 131,913 –
Net cash used in financing activities
Demerger-related transaction costs (7,046) –
Dividends paid (116,780) –
Net cash flows used in financing activities (123,826) –
Effect of exchange rates changes on cash and cash equivalents 379 –
Net increase in cash and cash equivalents 1,748 –
Cash and cash equivalents, beginning of the year – –
Cash and cash equivalents, end of the year 1,748 –
The accompanying Notes on pages 177 to 283 are an integral part of these financial statements.
Notes to Consolidated Financial StatementsThousands of Georgian Lari
1. Principal ActivitiesBank of Georgia Group PLC (“BOGG”) is a public limited liability company incorporated in England and Wales with registered number 10917019. BOGG holds 99.55% of the share capital of JSC Bank of Georgia (the “Bank”) as at 31 December 2018, representing the Bank’s ultimate parent company. Together with the Bank and other subsidiaries, the Group makes up a group of companies (the “Group”) and provides banking, leasing, brokerage and investment management services to corporate and individual customers. The shares of BOGG (“BOGG Shares”) are admitted to the premium listing segment of the Official List of the UK Listing Authority and admitted to trading on the London Stock Exchange PLC’s Main Market for listed securities, effective 21 May 2018. The Bank is the Group’s main operating unit and accounts for most of the Group’s activities.
JSC Bank of Georgia was established on 21 October 1994 as a joint stock company (“JSC”) under the laws of Georgia. The Bank operates under a general banking license issued by the National Bank of Georgia (“NBG”; the Central Bank of Georgia) on 15 December 1994.
The Bank accepts deposits from the public and extends credit, transfers payments in Georgia and internationally and exchanges currencies. Its main office is in Tbilisi, Georgia. At 31 December 2018, the Bank has 276 operating outlets in all major cities of Georgia (31 December 2017: 286, 31 December 2016: 278). The Bank’s registered legal address is 29a Gagarini Street, Tbilisi 0160, Georgia.
On 3 July 2017 BGEO Group PLC, (“BGEO”), former ultimate holding company of the Group, announced its intention to demerge BGEO Group PLC into a London-listed banking business (the “Banking Business”), Bank of Georgia Group PLC, and a London-listed investment business (the “Investment Business”), Georgia Capital PLC.
As part of the Demerger, Bank of Georgia Group PLC was incorporated and on 18 May 2018 issued 39,384,712 ordinary shares in exchange for the entire issued capital of BGEO Group PLC and became the parent company of BGEO. On 29 May 2018 the Demerger (“Demerger”) of the Group’s investment business (“Investment Business”) to Georgia Capital PLC (“GCAP”) become effective. As a result of the Demerger, the Group distributed the investments in the Investment Business with a fair value of GEL 1,441,552 to the shareholders of the Company. In addition, BOGG has issued a further 9,784,716 BOGG Shares (the “Consideration Shares”, equivalent to 19.9% of BOGG’s issued ordinary share capital) to GCAP in consideration for the transfer to BOGG by GCAP of GCAP’s stake in the JSC Bank of Georgia and JSC BG Financial. As set out in the BOGG prospectus dated 26 March 2018, for as long as GCAP’s percentage holding in BOGG is greater than 9.9%, GCAP will exercise its voting rights at BOGG general meetings in accordance with the votes cast by all other BOGG shareholders on BOGG votes at general meetings.
BOGG’s registered legal address is 84 Brook Street, London, W1K 5EH, England.
As at 31 December 2018, 31 December 2017 and 31 December 2016, the following shareholders owned more than 2.5% of the total outstanding shares of BOGG. Other shareholders individually owned less than 2.5% of the outstanding shares.
Shareholder31 December
201831 December
201731 December
2016
JSC Georgia Capital 19.90% – –
Harding Loevner Management LP 4.66% 8.32% 9.63%
JP Morgan Asset Management 3.01% 2.34% 2.79%
Norges Bank Investment Management 2.56% 3.11% 2.31%
Others 69.87% 86.23% 85.27%
Total* 100.00% 100.00% 100.00%
* For the purposes of calculating percentage of shareholding, the denominator includes total number of issued shares, which includes shares held in the trust for the share-based compensation purposes of the Group.
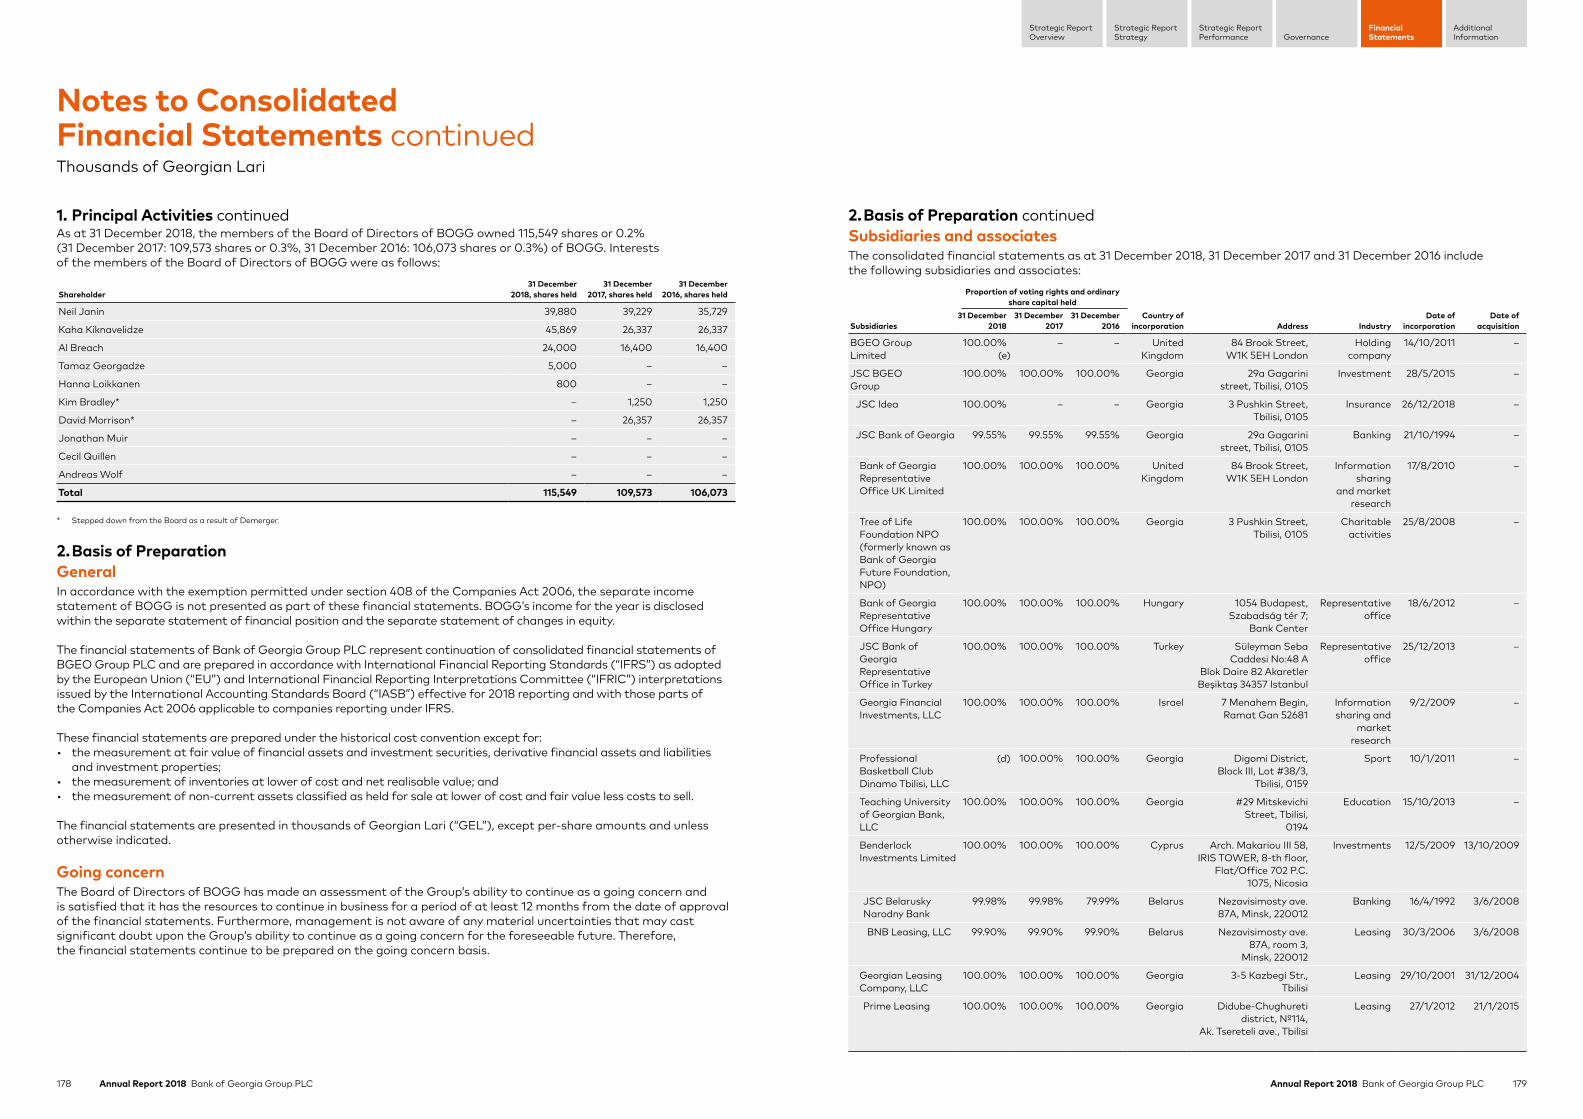
178 Annual Report 2018 Bank of Georgia Group PLC 179Annual Report 2018 Bank of Georgia Group PLC
Strategic ReportStrategy
Strategic ReportPerformance Governance
FinancialStatements
AdditionalInformation
Strategic ReportOverview
1. Principal Activities continuedAs at 31 December 2018, the members of the Board of Directors of BOGG owned 115,549 shares or 0.2% (31 December 2017: 109,573 shares or 0.3%, 31 December 2016: 106,073 shares or 0.3%) of BOGG. Interests of the members of the Board of Directors of BOGG were as follows:
Shareholder31 December
2018, shares held31 December
2017, shares held31 December
2016, shares held
Neil Janin 39,880 39,229 35,729
Kaha Kiknavelidze 45,869 26,337 26,337
Al Breach 24,000 16,400 16,400
Tamaz Georgadze 5,000 – –
Hanna Loikkanen 800 – –
Kim Bradley* – 1,250 1,250
David Morrison* – 26,357 26,357
Jonathan Muir – – –
Cecil Quillen – – –
Andreas Wolf – – –
Total 115,549 109,573 106,073
* Stepped down from the Board as a result of Demerger.
2. Basis of PreparationGeneralIn accordance with the exemption permitted under section 408 of the Companies Act 2006, the separate income statement of BOGG is not presented as part of these financial statements. BOGG’s income for the year is disclosed within the separate statement of financial position and the separate statement of changes in equity.
The financial statements of Bank of Georgia Group PLC represent continuation of consolidated financial statements of BGEO Group PLC and are prepared in accordance with International Financial Reporting Standards (“IFRS”) as adopted by the European Union (“EU”) and International Financial Reporting Interpretations Committee (“IFRIC”) interpretations issued by the International Accounting Standards Board (“IASB”) effective for 2018 reporting and with those parts of the Companies Act 2006 applicable to companies reporting under IFRS.
These financial statements are prepared under the historical cost convention except for:• the measurement at fair value of financial assets and investment securities, derivative financial assets and liabilities
and investment properties;• the measurement of inventories at lower of cost and net realisable value; and• the measurement of non-current assets classified as held for sale at lower of cost and fair value less costs to sell.
The financial statements are presented in thousands of Georgian Lari (“GEL”), except per-share amounts and unless otherwise indicated.
Going concernThe Board of Directors of BOGG has made an assessment of the Group’s ability to continue as a going concern and is satisfied that it has the resources to continue in business for a period of at least 12 months from the date of approval of the financial statements. Furthermore, management is not aware of any material uncertainties that may cast significant doubt upon the Group’s ability to continue as a going concern for the foreseeable future. Therefore, the financial statements continue to be prepared on the going concern basis.
Notes to Consolidated Financial Statements continuedThousands of Georgian Lari
2. Basis of Preparation continuedSubsidiaries and associatesThe consolidated financial statements as at 31 December 2018, 31 December 2017 and 31 December 2016 include the following subsidiaries and associates:
Subsidiaries
Proportion of voting rights and ordinary share capital held
Country of incorporation Address Industry
Date of incorporation
Date of acquisition
31 December 2018
31 December 2017
31 December 2016
BGEO GroupLimited
100.00%(e)
– – UnitedKingdom
84 Brook Street,W1K 5EH London
Holdingcompany
14/10/2011 –
JSC BGEOGroup
100.00% 100.00% 100.00% Georgia 29a Gagarinistreet, Tbilisi, 0105
Investment 28/5/2015 –
JSC Idea 100.00% – – Georgia 3 Pushkin Street,Tbilisi, 0105
Insurance 26/12/2018 –
JSC Bank of Georgia 99.55% 99.55% 99.55% Georgia 29a Gagarinistreet, Tbilisi, 0105
Banking 21/10/1994 –
Bank of Georgia Representative Office UK Limited
100.00% 100.00% 100.00% UnitedKingdom
84 Brook Street,W1K 5EH London
Informationsharing
and marketresearch
17/8/2010 –
Tree of Life Foundation NPO (formerly known as Bank of Georgia Future Foundation, NPO)
100.00% 100.00% 100.00% Georgia 3 Pushkin Street,Tbilisi, 0105
Charitableactivities
25/8/2008 –
Bank of Georgia Representative Office Hungary
100.00% 100.00% 100.00% Hungary 1054 Budapest,Szabadság tér 7;
Bank Center
Representativeoffice
18/6/2012 –
JSC Bank of Georgia Representative Office in Turkey
100.00% 100.00% 100.00% Turkey Süleyman SebaCaddesi No:48 A
Blok Daire 82 AkaretlerBeşiktaş 34357 Istanbul
Representativeoffice
25/12/2013 –
Georgia Financial Investments, LLC
100.00% 100.00% 100.00% Israel 7 Menahem Begin,Ramat Gan 52681
Informationsharing and
marketresearch
9/2/2009 –
Professional Basketball Club Dinamo Tbilisi, LLC
(d) 100.00% 100.00% Georgia Digomi District,Block III, Lot #38/3,
Tbilisi, 0159
Sport 10/1/2011 –
Teaching University of Georgian Bank, LLC
100.00% 100.00% 100.00% Georgia #29 MitskevichiStreet, Tbilisi,
0194
Education 15/10/2013 –
Benderlock Investments Limited
100.00% 100.00% 100.00% Cyprus Arch. Makariou III 58,IRIS TOWER, 8-th floor,
Flat/Office 702 P.C.1075, Nicosia
Investments 12/5/2009 13/10/2009
JSC Belarusky Narodny Bank
99.98% 99.98% 79.99% Belarus Nezavisimosty ave.87A, Minsk, 220012
Banking 16/4/1992 3/6/2008
BNB Leasing, LLC 99.90% 99.90% 99.90% Belarus Nezavisimosty ave.87A, room 3,
Minsk, 220012
Leasing 30/3/2006 3/6/2008
Georgian Leasing Company, LLC
100.00% 100.00% 100.00% Georgia 3-5 Kazbegi Str.,Tbilisi
Leasing 29/10/2001 31/12/2004
Prime Leasing 100.00% 100.00% 100.00% Georgia Didube-Chughuretidistrict, №114,
Ak. Tsereteli ave., Tbilisi
Leasing 27/1/2012 21/1/2015
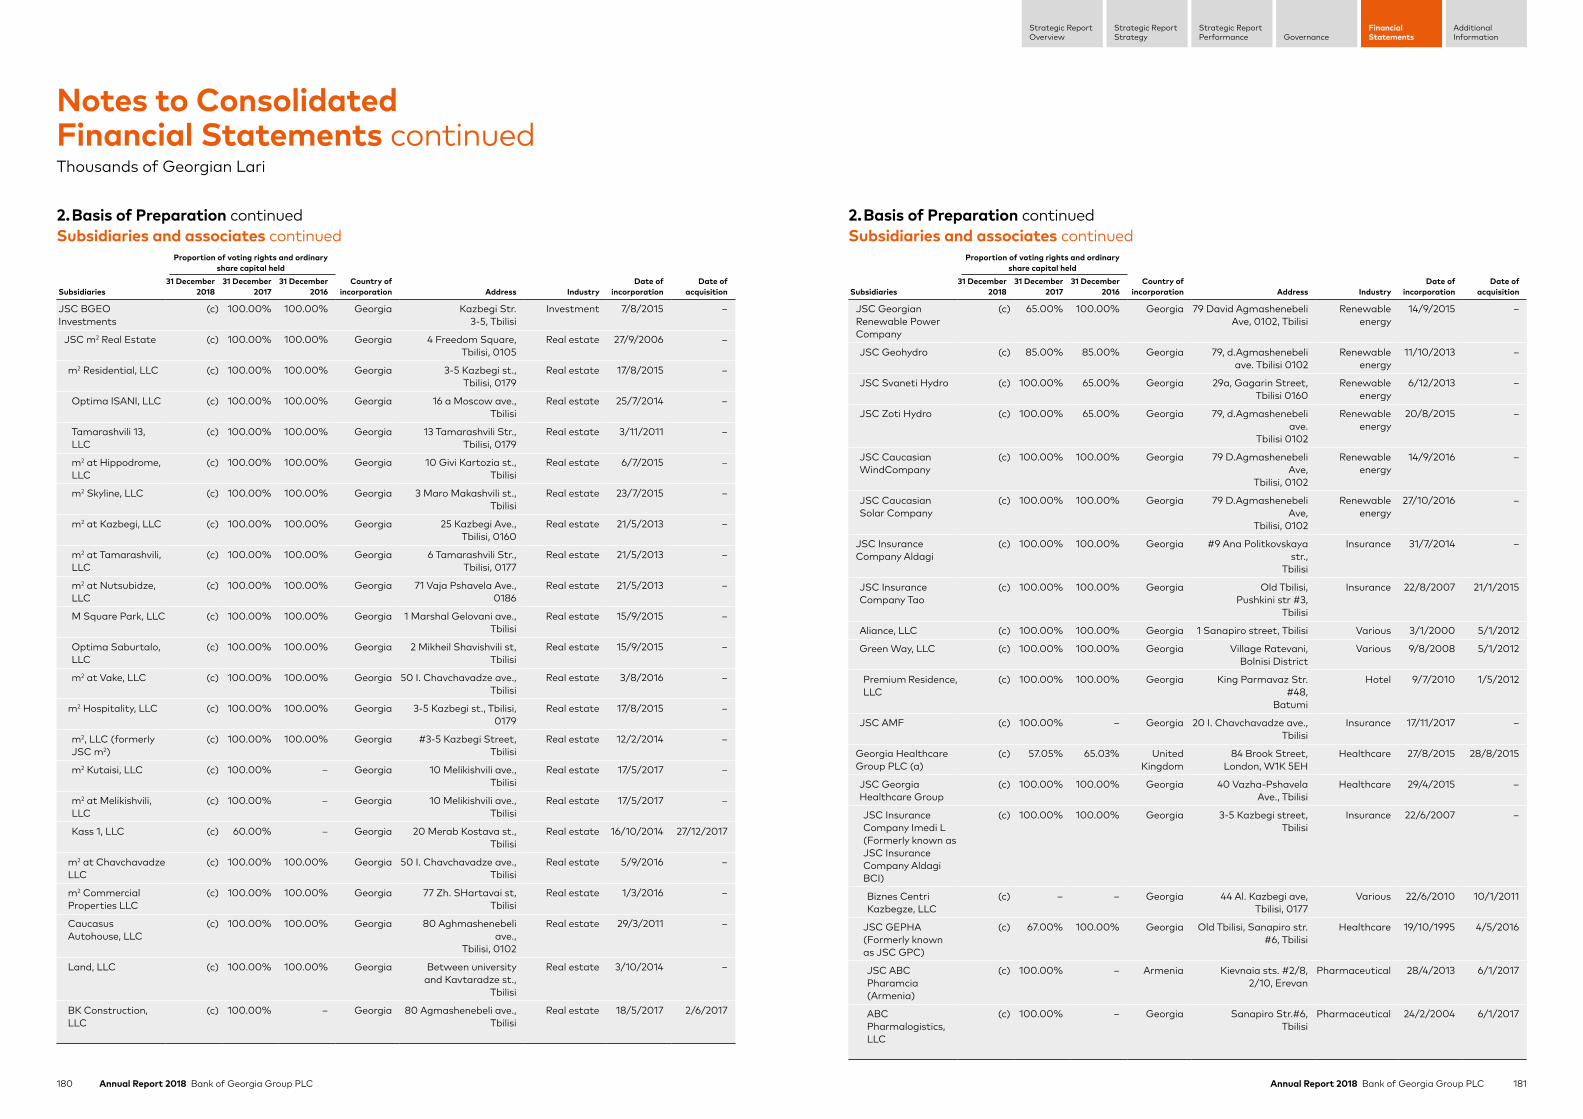
180 Annual Report 2018 Bank of Georgia Group PLC 181Annual Report 2018 Bank of Georgia Group PLC
Strategic ReportStrategy
Strategic ReportPerformance Governance
FinancialStatements
AdditionalInformation
Strategic ReportOverview
Subsidiaries
Proportion of voting rights and ordinary share capital held
Country of incorporation Address Industry
Date of incorporation
Date of acquisition
31 December 2018
31 December 2017
31 December 2016
JSC BGEO Investments
(c) 100.00% 100.00% Georgia Kazbegi Str.3-5, Tbilisi
Investment 7/8/2015 –
JSC m2 Real Estate (c) 100.00% 100.00% Georgia 4 Freedom Square,Tbilisi, 0105
Real estate 27/9/2006 –
m2 Residential, LLC (c) 100.00% 100.00% Georgia 3-5 Kazbegi st.,Tbilisi, 0179
Real estate 17/8/2015 –
Optima ISANI, LLC (c) 100.00% 100.00% Georgia 16 a Moscow ave.,Tbilisi
Real estate 25/7/2014 –
Tamarashvili 13, LLC
(c) 100.00% 100.00% Georgia 13 Tamarashvili Str.,Tbilisi, 0179
Real estate 3/11/2011 –
m2 at Hippodrome, LLC
(c) 100.00% 100.00% Georgia 10 Givi Kartozia st.,Tbilisi
Real estate 6/7/2015 –
m2 Skyline, LLC (c) 100.00% 100.00% Georgia 3 Maro Makashvili st.,Tbilisi
Real estate 23/7/2015 –
m2 at Kazbegi, LLC (c) 100.00% 100.00% Georgia 25 Kazbegi Ave.,Tbilisi, 0160
Real estate 21/5/2013 –
m2 at Tamarashvili, LLC
(c) 100.00% 100.00% Georgia 6 Tamarashvili Str.,Tbilisi, 0177
Real estate 21/5/2013 –
m2 at Nutsubidze, LLC
(c) 100.00% 100.00% Georgia 71 Vaja Pshavela Ave.,0186
Real estate 21/5/2013 –
M Square Park, LLC (c) 100.00% 100.00% Georgia 1 Marshal Gelovani ave.,Tbilisi
Real estate 15/9/2015 –
Optima Saburtalo, LLC
(c) 100.00% 100.00% Georgia 2 Mikheil Shavishvili st,Tbilisi
Real estate 15/9/2015 –
m2 at Vake, LLC (c) 100.00% 100.00% Georgia 50 I. Chavchavadze ave.,Tbilisi
Real estate 3/8/2016 –
m2 Hospitality, LLC (c) 100.00% 100.00% Georgia 3-5 Kazbegi st., Tbilisi,0179
Real estate 17/8/2015 –
m2, LLC (formerly JSC m2)
(c) 100.00% 100.00% Georgia #3-5 Kazbegi Street,Tbilisi
Real estate 12/2/2014 –
m2 Kutaisi, LLC (c) 100.00% – Georgia 10 Melikishvili ave.,Tbilisi
Real estate 17/5/2017 –
m2 at Melikishvili, LLC
(c) 100.00% – Georgia 10 Melikishvili ave.,Tbilisi
Real estate 17/5/2017 –
Kass 1, LLC (c) 60.00% – Georgia 20 Merab Kostava st.,Tbilisi
Real estate 16/10/2014 27/12/2017
m2 at Chavchavadze LLC
(c) 100.00% 100.00% Georgia 50 I. Chavchavadze ave.,Tbilisi
Real estate 5/9/2016 –
m2 Commercial Properties LLC
(c) 100.00% 100.00% Georgia 77 Zh. SHartavai st,Tbilisi
Real estate 1/3/2016 –
Caucasus Autohouse, LLC
(c) 100.00% 100.00% Georgia 80 Aghmashenebeli ave.,
Tbilisi, 0102
Real estate 29/3/2011 –
Land, LLC (c) 100.00% 100.00% Georgia Between universityand Kavtaradze st.,
Tbilisi
Real estate 3/10/2014 –
BK Construction, LLC
(c) 100.00% – Georgia 80 Agmashenebeli ave.,Tbilisi
Real estate 18/5/2017 2/6/2017
2. Basis of Preparation continuedSubsidiaries and associates continued
Notes to Consolidated Financial Statements continuedThousands of Georgian Lari
Subsidiaries
Proportion of voting rights and ordinary share capital held
Country of incorporation Address Industry
Date of incorporation
Date of acquisition
31 December 2018
31 December 2017
31 December 2016
JSC Georgian Renewable Power Company
(c) 65.00% 100.00% Georgia 79 David AgmashenebeliAve, 0102, Tbilisi
Renewableenergy
14/9/2015 –
JSC Geohydro (c) 85.00% 85.00% Georgia 79, d.Agmashenebeliave. Tbilisi 0102
Renewableenergy
11/10/2013 –
JSC Svaneti Hydro (c) 100.00% 65.00% Georgia 29a, Gagarin Street,Tbilisi 0160
Renewableenergy
6/12/2013 –
JSC Zoti Hydro (c) 100.00% 65.00% Georgia 79, d.Agmashenebeli ave.
Tbilisi 0102
Renewableenergy
20/8/2015 –
JSC Caucasian WindCompany
(c) 100.00% 100.00% Georgia 79 D.Agmashenebeli Ave,
Tbilisi, 0102
Renewableenergy
14/9/2016 –
JSC Caucasian Solar Company
(c) 100.00% 100.00% Georgia 79 D.Agmashenebeli Ave,
Tbilisi, 0102
Renewableenergy
27/10/2016 –
JSC Insurance Company Aldagi
(c) 100.00% 100.00% Georgia #9 Ana Politkovskaya str.,
Tbilisi
Insurance 31/7/2014 –
JSC Insurance Company Tao
(c) 100.00% 100.00% Georgia Old Tbilisi,Pushkini str #3,
Tbilisi
Insurance 22/8/2007 21/1/2015
Aliance, LLC (c) 100.00% 100.00% Georgia 1 Sanapiro street, Tbilisi Various 3/1/2000 5/1/2012
Green Way, LLC (c) 100.00% 100.00% Georgia Village Ratevani,Bolnisi District
Various 9/8/2008 5/1/2012
Premium Residence, LLC
(c) 100.00% 100.00% Georgia King Parmavaz Str. #48,
Batumi
Hotel 9/7/2010 1/5/2012
JSC AMF (c) 100.00% – Georgia 20 I. Chavchavadze ave.,Tbilisi
Insurance 17/11/2017 –
Georgia Healthcare Group PLC (a)
(c) 57.05% 65.03% UnitedKingdom
84 Brook Street,London, W1K 5EH
Healthcare 27/8/2015 28/8/2015
JSC Georgia Healthcare Group
(c) 100.00% 100.00% Georgia 40 Vazha-PshavelaAve., Tbilisi
Healthcare 29/4/2015 –
JSC Insurance Company Imedi L (Formerly known as JSC Insurance Company Aldagi BCI)
(c) 100.00% 100.00% Georgia 3-5 Kazbegi street,Tbilisi
Insurance 22/6/2007 –
Biznes Centri Kazbegze, LLC
(c) – – Georgia 44 Al. Kazbegi ave,Tbilisi, 0177
Various 22/6/2010 10/1/2011
JSC GEPHA (Formerly known as JSC GPC)
(c) 67.00% 100.00% Georgia Old Tbilisi, Sanapiro str.#6, Tbilisi
Healthcare 19/10/1995 4/5/2016
JSC ABC Pharamcia (Armenia)
(c) 100.00% – Armenia Kievnaia sts. #2/8,2/10, Erevan
Pharmaceutical 28/4/2013 6/1/2017
ABC Pharmalogistics, LLC
(c) 100.00% – Georgia Sanapiro Str.#6,Tbilisi
Pharmaceutical 24/2/2004 6/1/2017
2. Basis of Preparation continuedSubsidiaries and associates continued
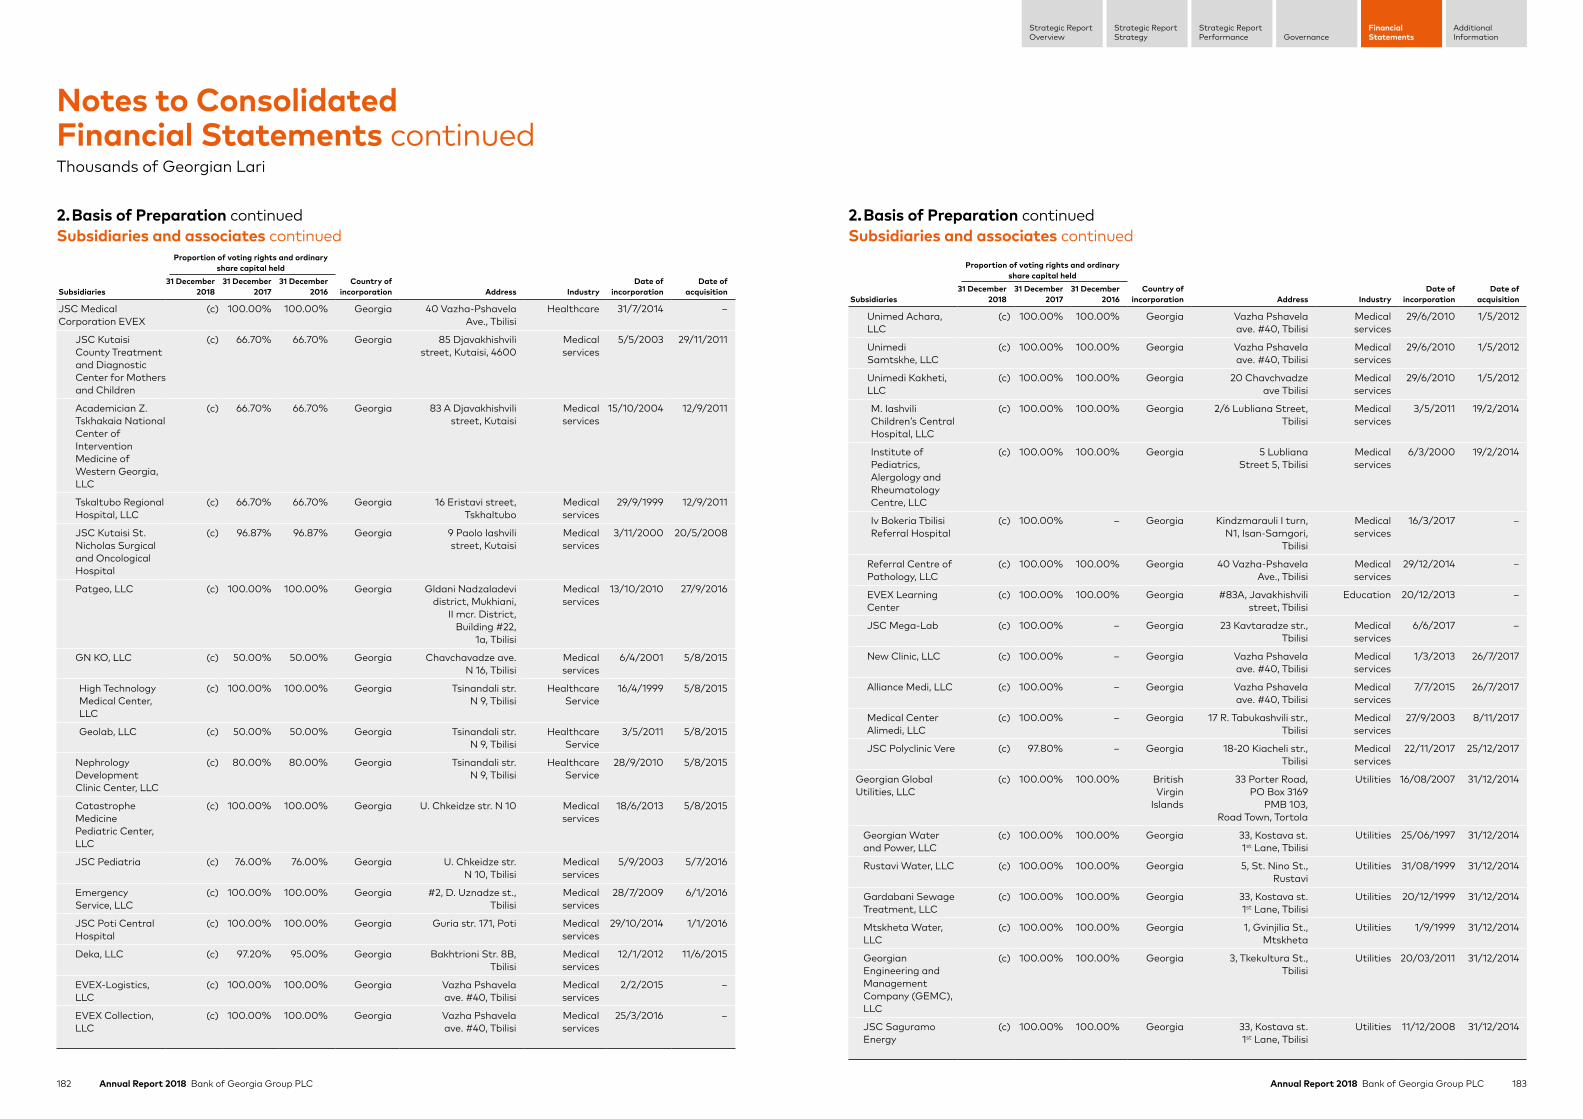
182 Annual Report 2018 Bank of Georgia Group PLC 183Annual Report 2018 Bank of Georgia Group PLC
Strategic ReportStrategy
Strategic ReportPerformance Governance
FinancialStatements
AdditionalInformation
Strategic ReportOverview
Subsidiaries
Proportion of voting rights and ordinary share capital held
Country of incorporation Address Industry
Date of incorporation
Date of acquisition
31 December 2018
31 December 2017
31 December 2016
JSC Medical Corporation EVEX
(c) 100.00% 100.00% Georgia 40 Vazha-PshavelaAve., Tbilisi
Healthcare 31/7/2014 –
JSC Kutaisi County Treatment and Diagnostic Center for Mothers and Children
(c) 66.70% 66.70% Georgia 85 Djavakhishvilistreet, Kutaisi, 4600
Medicalservices
5/5/2003 29/11/2011
Academician Z. Tskhakaia National Center of Intervention Medicine of Western Georgia, LLC
(c) 66.70% 66.70% Georgia 83 A Djavakhishvilistreet, Kutaisi
Medicalservices
15/10/2004 12/9/2011
Tskaltubo Regional Hospital, LLC
(c) 66.70% 66.70% Georgia 16 Eristavi street,Tskhaltubo
Medicalservices
29/9/1999 12/9/2011
JSC Kutaisi St. Nicholas Surgical and Oncological Hospital
(c) 96.87% 96.87% Georgia 9 Paolo Iashvilistreet, Kutaisi
Medicalservices
3/11/2000 20/5/2008
Patgeo, LLC (c) 100.00% 100.00% Georgia Gldani Nadzaladevidistrict, Mukhiani,
II mcr. District,Building #22,
1a, Tbilisi
Medicalservices
13/10/2010 27/9/2016
GN KO, LLC (c) 50.00% 50.00% Georgia Chavchavadze ave.N 16, Tbilisi
Medicalservices
6/4/2001 5/8/2015
High Technology Medical Center, LLC
(c) 100.00% 100.00% Georgia Tsinandali str.N 9, Tbilisi
HealthcareService
16/4/1999 5/8/2015
Geolab, LLC (c) 50.00% 50.00% Georgia Tsinandali str.N 9, Tbilisi
HealthcareService
3/5/2011 5/8/2015
Nephrology Development Clinic Center, LLC
(c) 80.00% 80.00% Georgia Tsinandali str.N 9, Tbilisi
HealthcareService
28/9/2010 5/8/2015
Catastrophe MedicinePediatric Center, LLC
(c) 100.00% 100.00% Georgia U. Chkeidze str. N 10 Medicalservices
18/6/2013 5/8/2015
JSC Pediatria (c) 76.00% 76.00% Georgia U. Chkeidze str.N 10, Tbilisi
Medicalservices
5/9/2003 5/7/2016
Emergency Service, LLC
(c) 100.00% 100.00% Georgia #2, D. Uznadze st.,Tbilisi
Medicalservices
28/7/2009 6/1/2016
JSC Poti Central Hospital
(c) 100.00% 100.00% Georgia Guria str. 171, Poti Medicalservices
29/10/2014 1/1/2016
Deka, LLC (c) 97.20% 95.00% Georgia Bakhtrioni Str. 8B,Tbilisi
Medicalservices
12/1/2012 11/6/2015
EVEX-Logistics, LLC
(c) 100.00% 100.00% Georgia Vazha Pshavelaave. #40, Tbilisi
Medicalservices
2/2/2015 –
EVEX Collection, LLC
(c) 100.00% 100.00% Georgia Vazha Pshavelaave. #40, Tbilisi
Medicalservices
25/3/2016 –
2. Basis of Preparation continuedSubsidiaries and associates continued
Notes to Consolidated Financial Statements continuedThousands of Georgian Lari
Subsidiaries
Proportion of voting rights and ordinary share capital held
Country of incorporation Address Industry
Date of incorporation
Date of acquisition
31 December 2018
31 December 2017
31 December 2016
Unimed Achara, LLC
(c) 100.00% 100.00% Georgia Vazha Pshavelaave. #40, Tbilisi
Medicalservices
29/6/2010 1/5/2012
Unimedi Samtskhe, LLC
(c) 100.00% 100.00% Georgia Vazha Pshavelaave. #40, Tbilisi
Medicalservices
29/6/2010 1/5/2012
Unimedi Kakheti, LLC
(c) 100.00% 100.00% Georgia 20 Chavchvadzeave Tbilisi
Medicalservices
29/6/2010 1/5/2012
M. Iashvili Children’s Central Hospital, LLC
(c) 100.00% 100.00% Georgia 2/6 Lubliana Street,Tbilisi
Medicalservices
3/5/2011 19/2/2014
Institute of Pediatrics, Alergology and Rheumatology Centre, LLC
(c) 100.00% 100.00% Georgia 5 LublianaStreet 5, Tbilisi
Medicalservices
6/3/2000 19/2/2014
Iv Bokeria Tbilisi Referral Hospital
(c) 100.00% – Georgia Kindzmarauli I turn,N1, Isan-Samgori,
Tbilisi
Medicalservices
16/3/2017 –
Referral Centre of Pathology, LLC
(c) 100.00% 100.00% Georgia 40 Vazha-PshavelaAve., Tbilisi
Medicalservices
29/12/2014 –
EVEX Learning Center
(c) 100.00% 100.00% Georgia #83A, Javakhishvilistreet, Tbilisi
Education 20/12/2013 –
JSC Mega-Lab (c) 100.00% – Georgia 23 Kavtaradze str.,Tbilisi
Medicalservices
6/6/2017 –
New Clinic, LLC (c) 100.00% – Georgia Vazha Pshavelaave. #40, Tbilisi
Medicalservices
1/3/2013 26/7/2017
Alliance Medi, LLC (c) 100.00% – Georgia Vazha Pshavelaave. #40, Tbilisi
Medicalservices
7/7/2015 26/7/2017
Medical Center Alimedi, LLC
(c) 100.00% – Georgia 17 R. Tabukashvili str.,Tbilisi
Medical services
27/9/2003 8/11/2017
JSC Polyclinic Vere (c) 97.80% – Georgia 18-20 Kiacheli str.,Tbilisi
Medical services
22/11/2017 25/12/2017
Georgian Global Utilities, LLC
(c) 100.00% 100.00% British Virgin
Islands
33 Porter Road,PO Box 3169
PMB 103,Road Town, Tortola
Utilities 16/08/2007 31/12/2014
Georgian Water and Power, LLC
(c) 100.00% 100.00% Georgia 33, Kostava st.1st Lane, Tbilisi
Utilities 25/06/1997 31/12/2014
Rustavi Water, LLC (c) 100.00% 100.00% Georgia 5, St. Nino St.,Rustavi
Utilities 31/08/1999 31/12/2014
Gardabani Sewage Treatment, LLC
(c) 100.00% 100.00% Georgia 33, Kostava st.1st Lane, Tbilisi
Utilities 20/12/1999 31/12/2014
Mtskheta Water, LLC
(c) 100.00% 100.00% Georgia 1, Gvinjilia St.,Mtskheta
Utilities 1/9/1999 31/12/2014
Georgian Engineering and Management Company (GEMC), LLC
(c) 100.00% 100.00% Georgia 3, Tkekultura St.,Tbilisi
Utilities 20/03/2011 31/12/2014
JSC Saguramo Energy
(c) 100.00% 100.00% Georgia 33, Kostava st.1st Lane, Tbilisi
Utilities 11/12/2008 31/12/2014
2. Basis of Preparation continuedSubsidiaries and associates continued
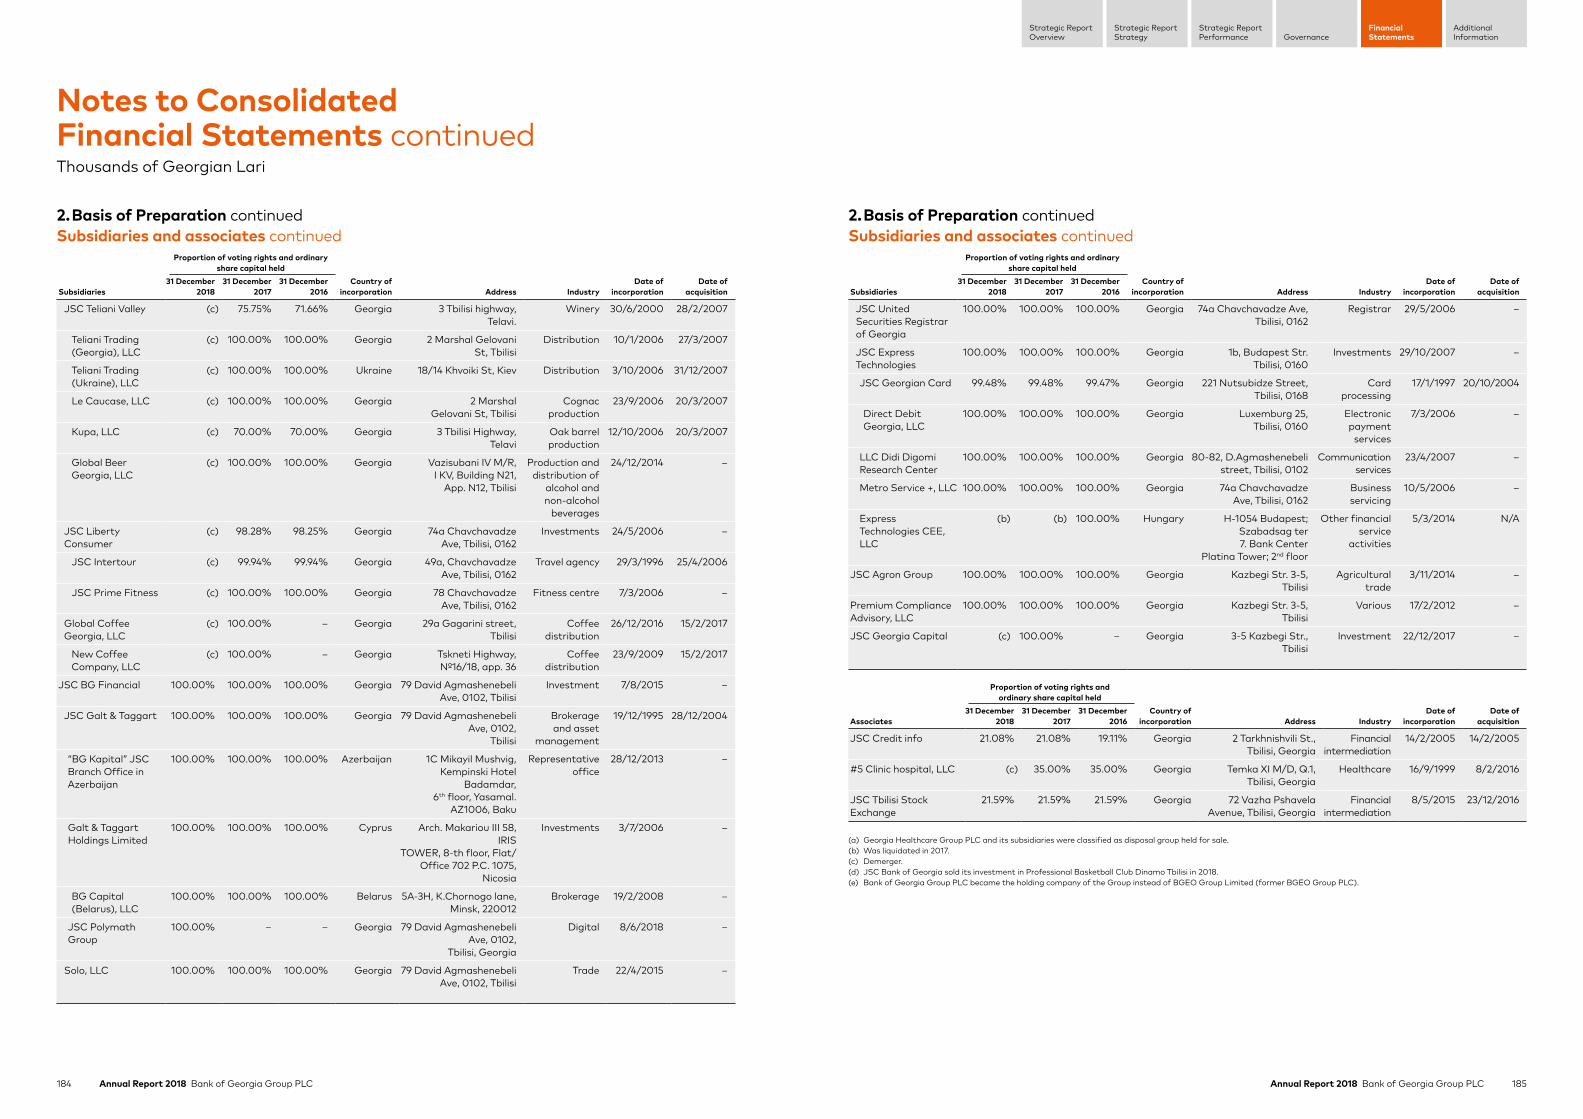
184 Annual Report 2018 Bank of Georgia Group PLC 185Annual Report 2018 Bank of Georgia Group PLC
Strategic ReportStrategy
Strategic ReportPerformance Governance
FinancialStatements
AdditionalInformation
Strategic ReportOverview
Subsidiaries
Proportion of voting rights and ordinary share capital held
Country of incorporation Address Industry
Date of incorporation
Date of acquisition
31 December 2018
31 December 2017
31 December 2016
JSC Teliani Valley (c) 75.75% 71.66% Georgia 3 Tbilisi highway,Telavi.
Winery 30/6/2000 28/2/2007
Teliani Trading (Georgia), LLC
(c) 100.00% 100.00% Georgia 2 Marshal GelovaniSt, Tbilisi
Distribution 10/1/2006 27/3/2007
Teliani Trading (Ukraine), LLC
(c) 100.00% 100.00% Ukraine 18/14 Khvoiki St, Kiev Distribution 3/10/2006 31/12/2007
Le Caucase, LLC (c) 100.00% 100.00% Georgia 2 MarshalGelovani St, Tbilisi
Cognacproduction
23/9/2006 20/3/2007
Kupa, LLC (c) 70.00% 70.00% Georgia 3 Tbilisi Highway,Telavi
Oak barrelproduction
12/10/2006 20/3/2007
Global Beer Georgia, LLC
(c) 100.00% 100.00% Georgia Vazisubani IV M/R,I KV, Building N21,
App. N12, Tbilisi
Production anddistribution of
alcohol andnon-alcohol
beverages
24/12/2014 –
JSC Liberty Consumer
(c) 98.28% 98.25% Georgia 74a ChavchavadzeAve, Tbilisi, 0162
Investments 24/5/2006 –
JSC Intertour (c) 99.94% 99.94% Georgia 49a, ChavchavadzeAve, Tbilisi, 0162
Travel agency 29/3/1996 25/4/2006
JSC Prime Fitness (c) 100.00% 100.00% Georgia 78 ChavchavadzeAve, Tbilisi, 0162
Fitness centre 7/3/2006 –
Global Coffee Georgia, LLC
(c) 100.00% – Georgia 29a Gagarini street,Tbilisi
Coffeedistribution
26/12/2016 15/2/2017
New Coffee Company, LLC
(c) 100.00% – Georgia Tskneti Highway,№16/18, app. 36
Coffeedistribution
23/9/2009 15/2/2017
JSC BG Financial 100.00% 100.00% 100.00% Georgia 79 David AgmashenebeliAve, 0102, Tbilisi
Investment 7/8/2015 –
JSC Galt & Taggart 100.00% 100.00% 100.00% Georgia 79 David AgmashenebeliAve, 0102,
Tbilisi
Brokerageand asset
management
19/12/1995 28/12/2004
“BG Kapital” JSC Branch Office in Azerbaijan
100.00% 100.00% 100.00% Azerbaijan 1C Mikayil Mushvig,Kempinski Hotel
Badamdar,6th floor, Yasamal.
AZ1006, Baku
Representativeoffice
28/12/2013 –
Galt & Taggart Holdings Limited
100.00% 100.00% 100.00% Cyprus Arch. Makariou III 58, IRIS
TOWER, 8-th floor, Flat/Office 702 P.C. 1075,
Nicosia
Investments 3/7/2006 –
BG Capital (Belarus), LLC
100.00% 100.00% 100.00% Belarus 5A-3H, K.Chornogo lane,Minsk, 220012
Brokerage 19/2/2008 –
JSC Polymath Group
100.00% – – Georgia 79 David AgmashenebeliAve, 0102,
Tbilisi, Georgia
Digital 8/6/2018 –
Solo, LLC 100.00% 100.00% 100.00% Georgia 79 David AgmashenebeliAve, 0102, Tbilisi
Trade 22/4/2015 –
2. Basis of Preparation continuedSubsidiaries and associates continued
Notes to Consolidated Financial Statements continuedThousands of Georgian Lari
Subsidiaries
Proportion of voting rights and ordinary share capital held
Country of incorporation Address Industry
Date of incorporation
Date of acquisition
31 December 2018
31 December 2017
31 December 2016
JSC United Securities Registrar of Georgia
100.00% 100.00% 100.00% Georgia 74a Chavchavadze Ave,Tbilisi, 0162
Registrar 29/5/2006 –
JSC Express Technologies
100.00% 100.00% 100.00% Georgia 1b, Budapest Str.Tbilisi, 0160
Investments 29/10/2007 –
JSC Georgian Card 99.48% 99.48% 99.47% Georgia 221 Nutsubidze Street,Tbilisi, 0168
Cardprocessing
17/1/1997 20/10/2004
Direct Debit Georgia, LLC
100.00% 100.00% 100.00% Georgia Luxemburg 25,Tbilisi, 0160
Electronicpayment
services
7/3/2006 –
LLC Didi Digomi Research Center
100.00% 100.00% 100.00% Georgia 80-82, D.Agmashenebelistreet, Tbilisi, 0102
Communicationservices
23/4/2007 –
Metro Service +, LLC 100.00% 100.00% 100.00% Georgia 74a ChavchavadzeAve, Tbilisi, 0162
Businessservicing
10/5/2006 –
Express Technologies CEE, LLC
(b) (b) 100.00% Hungary H-1054 Budapest;Szabadsag ter7. Bank Center
Platina Tower; 2nd floor
Other financialservice
activities
5/3/2014 N/A
JSC Agron Group 100.00% 100.00% 100.00% Georgia Kazbegi Str. 3-5,Tbilisi
Agricultural trade
3/11/2014 –
Premium Compliance Advisory, LLC
100.00% 100.00% 100.00% Georgia Kazbegi Str. 3-5,Tbilisi
Various 17/2/2012 –
JSC Georgia Capital (c) 100.00% – Georgia 3-5 Kazbegi Str.,Tbilisi
Investment 22/12/2017 –
Associates
Proportion of voting rights and ordinary share capital held
Country of incorporation Address Industry
Date of incorporation
Date of acquisition
31 December 2018
31 December 2017
31 December 2016
JSC Credit info 21.08% 21.08% 19.11% Georgia 2 Tarkhnishvili St.,Tbilisi, Georgia
Financialintermediation
14/2/2005 14/2/2005
#5 Clinic hospital, LLC (c) 35.00% 35.00% Georgia Temka XI M/D, Q.1,Tbilisi, Georgia
Healthcare 16/9/1999 8/2/2016
JSC Tbilisi Stock Exchange
21.59% 21.59% 21.59% Georgia 72 Vazha PshavelaAvenue, Tbilisi, Georgia
Financialintermediation
8/5/2015 23/12/2016
(a) Georgia Healthcare Group PLC and its subsidiaries were classified as disposal group held for sale.(b) Was liquidated in 2017.(c) Demerger.(d) JSC Bank of Georgia sold its investment in Professional Basketball Club Dinamo Tbilisi in 2018.(e) Bank of Georgia Group PLC became the holding company of the Group instead of BGEO Group Limited (former BGEO Group PLC).
2. Basis of Preparation continuedSubsidiaries and associates continued
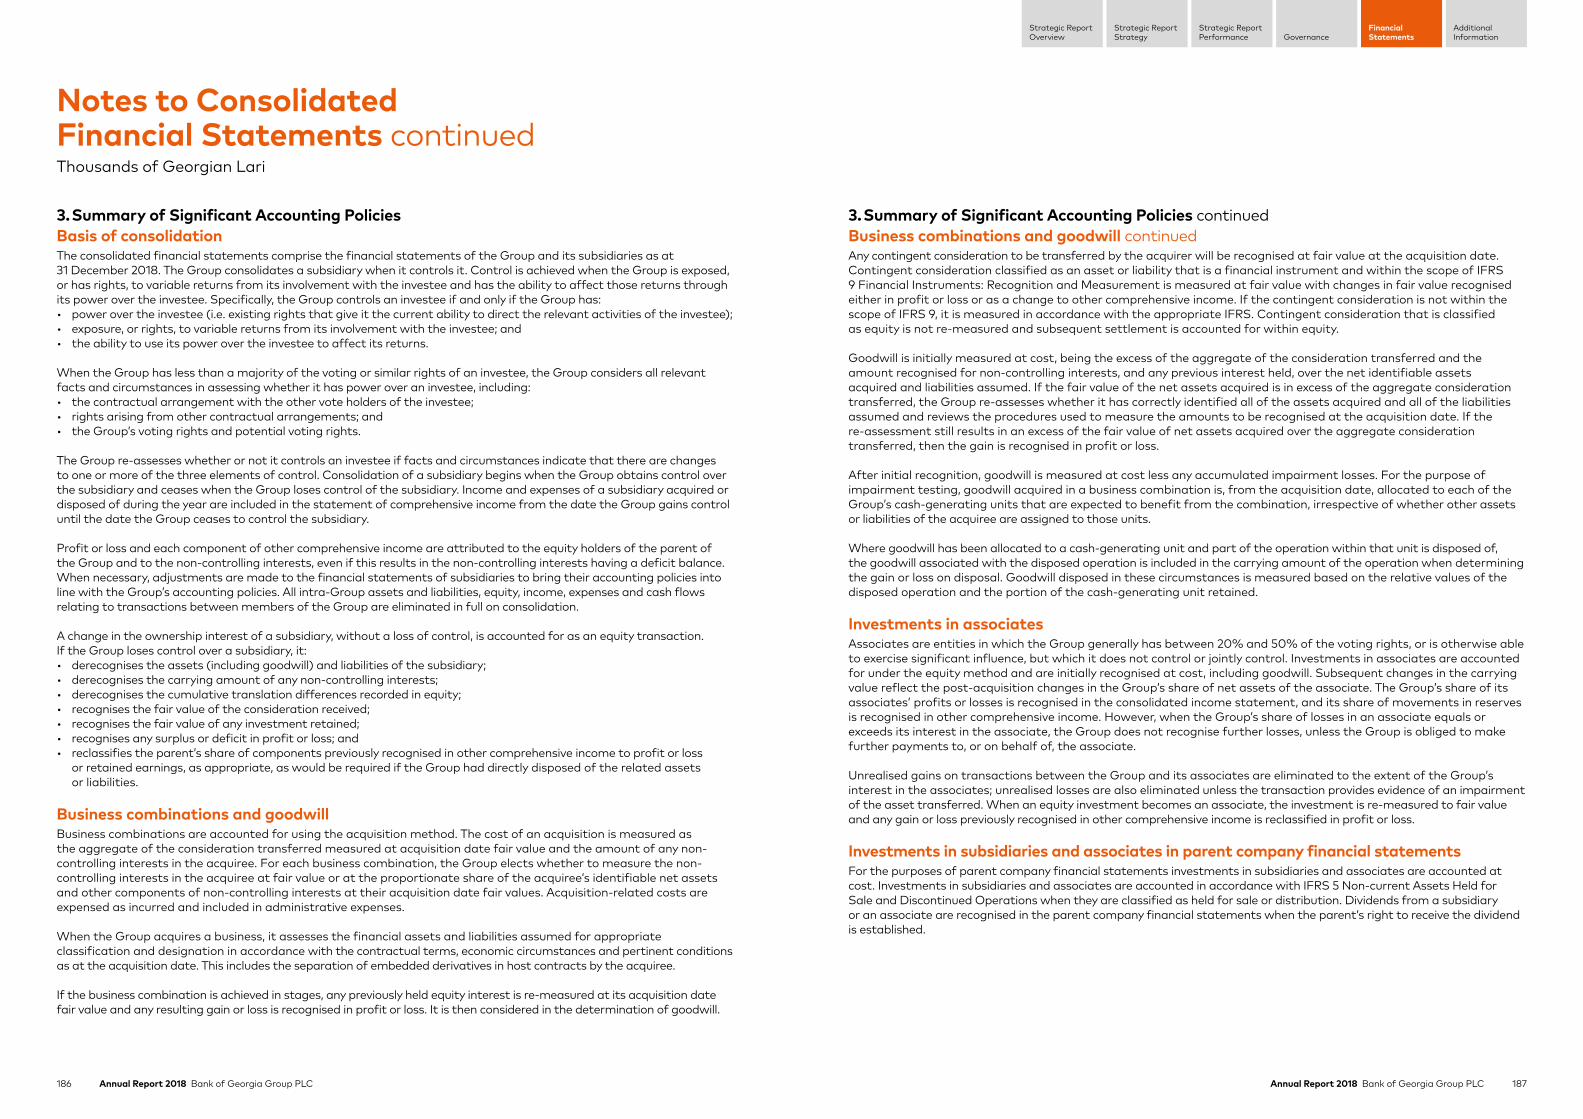
186 Annual Report 2018 Bank of Georgia Group PLC 187Annual Report 2018 Bank of Georgia Group PLC
Strategic ReportStrategy
Strategic ReportPerformance Governance
FinancialStatements
AdditionalInformation
Strategic ReportOverview
3. Summary of Significant Accounting PoliciesBasis of consolidationThe consolidated financial statements comprise the financial statements of the Group and its subsidiaries as at 31 December 2018. The Group consolidates a subsidiary when it controls it. Control is achieved when the Group is exposed, or has rights, to variable returns from its involvement with the investee and has the ability to affect those returns through its power over the investee. Specifically, the Group controls an investee if and only if the Group has:• power over the investee (i.e. existing rights that give it the current ability to direct the relevant activities of the investee);• exposure, or rights, to variable returns from its involvement with the investee; and• the ability to use its power over the investee to affect its returns.
When the Group has less than a majority of the voting or similar rights of an investee, the Group considers all relevant facts and circumstances in assessing whether it has power over an investee, including:• the contractual arrangement with the other vote holders of the investee;• rights arising from other contractual arrangements; and• the Group’s voting rights and potential voting rights.
The Group re-assesses whether or not it controls an investee if facts and circumstances indicate that there are changes to one or more of the three elements of control. Consolidation of a subsidiary begins when the Group obtains control over the subsidiary and ceases when the Group loses control of the subsidiary. Income and expenses of a subsidiary acquired or disposed of during the year are included in the statement of comprehensive income from the date the Group gains control until the date the Group ceases to control the subsidiary.
Profit or loss and each component of other comprehensive income are attributed to the equity holders of the parent of the Group and to the non-controlling interests, even if this results in the non-controlling interests having a deficit balance. When necessary, adjustments are made to the financial statements of subsidiaries to bring their accounting policies into line with the Group’s accounting policies. All intra-Group assets and liabilities, equity, income, expenses and cash flows relating to transactions between members of the Group are eliminated in full on consolidation.
A change in the ownership interest of a subsidiary, without a loss of control, is accounted for as an equity transaction. If the Group loses control over a subsidiary, it:• derecognises the assets (including goodwill) and liabilities of the subsidiary;• derecognises the carrying amount of any non-controlling interests;• derecognises the cumulative translation differences recorded in equity;• recognises the fair value of the consideration received;• recognises the fair value of any investment retained;• recognises any surplus or deficit in profit or loss; and• reclassifies the parent’s share of components previously recognised in other comprehensive income to profit or loss
or retained earnings, as appropriate, as would be required if the Group had directly disposed of the related assets or liabilities.
Business combinations and goodwillBusiness combinations are accounted for using the acquisition method. The cost of an acquisition is measured as the aggregate of the consideration transferred measured at acquisition date fair value and the amount of any non-controlling interests in the acquiree. For each business combination, the Group elects whether to measure the non-controlling interests in the acquiree at fair value or at the proportionate share of the acquiree’s identifiable net assets and other components of non-controlling interests at their acquisition date fair values. Acquisition-related costs are expensed as incurred and included in administrative expenses.
When the Group acquires a business, it assesses the financial assets and liabilities assumed for appropriate classification and designation in accordance with the contractual terms, economic circumstances and pertinent conditions as at the acquisition date. This includes the separation of embedded derivatives in host contracts by the acquiree.
If the business combination is achieved in stages, any previously held equity interest is re-measured at its acquisition date fair value and any resulting gain or loss is recognised in profit or loss. It is then considered in the determination of goodwill.
3. Summary of Significant Accounting Policies continuedBusiness combinations and goodwill continuedAny contingent consideration to be transferred by the acquirer will be recognised at fair value at the acquisition date. Contingent consideration classified as an asset or liability that is a financial instrument and within the scope of IFRS 9 Financial Instruments: Recognition and Measurement is measured at fair value with changes in fair value recognised either in profit or loss or as a change to other comprehensive income. If the contingent consideration is not within the scope of IFRS 9, it is measured in accordance with the appropriate IFRS. Contingent consideration that is classified as equity is not re-measured and subsequent settlement is accounted for within equity.
Goodwill is initially measured at cost, being the excess of the aggregate of the consideration transferred and the amount recognised for non-controlling interests, and any previous interest held, over the net identifiable assets acquired and liabilities assumed. If the fair value of the net assets acquired is in excess of the aggregate consideration transferred, the Group re-assesses whether it has correctly identified all of the assets acquired and all of the liabilities assumed and reviews the procedures used to measure the amounts to be recognised at the acquisition date. If the re-assessment still results in an excess of the fair value of net assets acquired over the aggregate consideration transferred, then the gain is recognised in profit or loss.
After initial recognition, goodwill is measured at cost less any accumulated impairment losses. For the purpose of impairment testing, goodwill acquired in a business combination is, from the acquisition date, allocated to each of the Group’s cash-generating units that are expected to benefit from the combination, irrespective of whether other assets or liabilities of the acquiree are assigned to those units.
Where goodwill has been allocated to a cash-generating unit and part of the operation within that unit is disposed of, the goodwill associated with the disposed operation is included in the carrying amount of the operation when determining the gain or loss on disposal. Goodwill disposed in these circumstances is measured based on the relative values of the disposed operation and the portion of the cash-generating unit retained.
Investments in associatesAssociates are entities in which the Group generally has between 20% and 50% of the voting rights, or is otherwise able to exercise significant influence, but which it does not control or jointly control. Investments in associates are accounted for under the equity method and are initially recognised at cost, including goodwill. Subsequent changes in the carrying value reflect the post-acquisition changes in the Group’s share of net assets of the associate. The Group’s share of its associates’ profits or losses is recognised in the consolidated income statement, and its share of movements in reserves is recognised in other comprehensive income. However, when the Group’s share of losses in an associate equals or exceeds its interest in the associate, the Group does not recognise further losses, unless the Group is obliged to make further payments to, or on behalf of, the associate.
Unrealised gains on transactions between the Group and its associates are eliminated to the extent of the Group’s interest in the associates; unrealised losses are also eliminated unless the transaction provides evidence of an impairment of the asset transferred. When an equity investment becomes an associate, the investment is re-measured to fair value and any gain or loss previously recognised in other comprehensive income is reclassified in profit or loss.
Investments in subsidiaries and associates in parent company financial statementsFor the purposes of parent company financial statements investments in subsidiaries and associates are accounted at cost. Investments in subsidiaries and associates are accounted in accordance with IFRS 5 Non-current Assets Held for Sale and Discontinued Operations when they are classified as held for sale or distribution. Dividends from a subsidiary or an associate are recognised in the parent company financial statements when the parent’s right to receive the dividend is established.
Notes to Consolidated Financial Statements continuedThousands of Georgian Lari
188 Annual Report 2018 Bank of Georgia Group PLC 189Annual Report 2018 Bank of Georgia Group PLC
Strategic ReportStrategy
Strategic ReportPerformance Governance
FinancialStatements
AdditionalInformation
Strategic ReportOverview
3. Summary of Significant Accounting Policies continuedFair value measurementThe Group measures financial instruments, such as trading and investment securities, certain loans to customers, derivatives and non-financial assets such as investment properties, at fair value at each balance sheet date. Also, fair values of financial instruments measured at amortised cost are disclosed in Note 28.
Fair value is the price that would be received to sell an asset or paid to transfer a liability in an orderly transaction between market participants at the measurement date. The fair value measurement is based on the presumption that the transaction to sell the asset or transfer the liability takes place either:• in the principal market for the asset or liability; or• in the absence of a principal market, in the most advantageous market for the asset or liability.
The principal or the most advantageous market must be accessible by the Group. The fair value of an asset or a liability is measured using the assumptions that market participants would use when pricing the asset or liability, assuming that market participants act in their economic best interest. A fair value measurement of a non-financial asset takes into account a market participant’s ability to generate economic benefits by using the asset in its highest and best use or by selling it to another market participant that would use the asset in its highest and best use.
The Group uses valuation techniques that are appropriate in the circumstances and for which sufficient data are available to measure fair value, maximising the use of relevant observable inputs and minimising the use of unobservable inputs.
All assets and liabilities for which fair value is measured or disclosed in the financial statements are categorised within the fair value hierarchy, described as follows, based on the lowest level input that is significant to the fair value measurement as a whole:• Level 1 − Quoted (unadjusted) market prices in active markets for identical assets or liabilities;• Level 2 − Valuation techniques for which the lowest level input that is significant to the fair value measurement
is directly or indirectly observable;• Level 3 − Valuation techniques for which the lowest level input that is significant to the fair value measurement
is unobservable.
For assets and liabilities that are recognised in the financial statements on a recurring basis, the Group determines whether transfers have occurred between Levels in the hierarchy by re-assessing categorisation (based on the lowest level input that is significant to the fair value measurement as a whole) at the end of each reporting period.
Financial assets and liabilitiesIFRS 9 replaces IAS 39 for annual periods commencing on or after 1 January 2018. The Group has not restated comparative information for 2017 for financial instruments in the scope of IFRS 9. Therefore, the comparative information for 2017 is reported under IAS 39 and is not comparable to the information presented for 2018. Differences arising from the adoption of IFRS 9 have been recognised directly in retained earnings as of 1 January 2018 and are disclosed below. Accounting policies under IAS 39 relating to 2017 and 2016 financial years can be found in the previous year Consolidated and Separate company Financial Statements.
IFRS 9 does not have any impact on regulatory capital and capital adequacy ratios.
3. Summary of Significant Accounting Policies continuedFinancial assets and liabilities continuedChanges to classification and measurementIFRS 9 requires all financial assets, except equity instruments and derivatives, to be assessed based on a combination of the Group’s business model for managing the assets and the instruments’ contractual cash flow characteristics. The IAS 39 measurement categories are replaced by:• fair value through profit or loss (FVPL);• fair value through other comprehensive income (FVOCI) with recycling to profit or loss upon disposal for debt
instruments;• fair value through other comprehensive income (FVOCI) without recycling to profit or loss for equity instruments; and• amortised cost.
The accounting treatment for financial liabilities is largely the same as the requirements of IAS 39.
Under IFRS 9, embedded derivatives are no longer separated from a host financial asset. Instead, financial assets are classified based on the business model and their contractual terms as explained below. The accounting for derivatives embedded in financial liabilities and in non-financial host contracts has not changed.
Classification and measurement implementationFrom 1 January 2018, the Group classifies all of its financial assets based on the business model for managing the assets and the assets’ contractual terms.
Measurement of financial instruments at initial recognitionWhen financial instruments are recognised initially, they are measured at fair value, adjusted, in the case of instruments not at fair value through profit or loss, for directly attributable fees and costs.
The best evidence of the fair value of a financial instrument at initial recognition is normally the transaction price. If the Group determines that the fair value at initial recognition differs from the transaction price, then:• if the fair value is evidenced by a quoted price in an active market for an identical asset or liability (i.e., a Level 1 input)
or based on a valuation technique that uses only data from observable markets, the Group recognises the difference between the fair value at initial recognition and the transaction price as a gain or loss; and
• in all other cases, the initial measurement of the financial instrument is adjusted to defer the difference between the fair value at initial recognition and the transaction price. After initial recognition, the Group recognises that deferred difference as a gain or loss only when the inputs become observable, or when the instrument is derecognised.
Subsequent measurement of financial instrumentsFinancial instruments measured at amortised costFrom 1 January 2018 the Group measures due from credit institutions, loans to customers and other financial assets at amortised cost if both of the following conditions are met:• The financial asset is held within a business model with the objective to hold financial assets in order to collect
contractual cash flows; and• The contractual terms of the financial asset give rise on specified dates to cash flows that are solely payment
of principal and interest (SPPI) on the principal amount outstanding.
The details of these conditions are outlined below.
Business modelThere are three business models available under IFRS 9:• Held to collect: it is intended to hold the asset to maturity to earn interest, collecting repayments of principal and
interest form the counterparty.• Hold to collect and sell: this model is similar to the hold to collect model, except that the entity may elect to sell
some or all of the assets before maturity as circumstances change or to hold the assets for liquidity purposes.• Other: all those models that do not meet the ‘hold to collect’ or ‘hold to collect and sell’ qualifying criteria.
Notes to Consolidated Financial Statements continuedThousands of Georgian Lari
190 Annual Report 2018 Bank of Georgia Group PLC 191Annual Report 2018 Bank of Georgia Group PLC
Strategic ReportStrategy
Strategic ReportPerformance Governance
FinancialStatements
AdditionalInformation
Strategic ReportOverview
3. Summary of Significant Accounting Policies continuedSubsequent measurement of financial instruments continuedThe assessment of business model requires judgement based on facts and circumstances at the date of the assessment. The business model is not assessed on an instrument by instrument basis, but at a higher level of aggregated portfolios per instrument type and is based on observable factors. The Group has considered quantitative factors (e.g. the expected frequency and volume of sales) and qualitative factors such as how the performance of the business model and the financial assets held within that business model are evaluated and reported to the key management personnel; the risks that affect the performance of the business model and, in particular, the way those risks are managed; and how managers of the business are compensated.
Solely Payments of Principal and Interest (SPPI)If a financial asset is held in either a Hold to Collect or a Hold to Collect and Sell business model, then assessment to determine whether contractual cash flows are solely payments of principal and interest on the principal amount outstanding at initial recognition is required to determine the classification. The SPPI test is performed on an individual instrument basis.
Contractual cash flows that represent solely payments of principal and interest on the principal amount outstanding are consistent with basic lending arrangements. Interest is consideration for the time value of money and the credit risk associated with the principal amount outstanding during a particular period of time. It can also include consideration for other basic lending risks (e.g. liquidity risk) and costs (e.g. administrative costs) associated with holding the financial asset for a particular period of time, and a profit margin that is consistent with a basic lending arrangement.
In assessing whether the contractual cash flows are SPPI, the Group considers whether the contractual terms of the financial asset contain a term that could change the timing or amount of contractual cash flows arising over the life of the instrument which could affect whether the instrument is considered to meet the SPPI test.
If the SPPI test is failed, such financial assets are measured at FVTPL with interest earned recognised in other interest income.
Interest income recognitionFor Financial Instruments in Stage 1 and Stage 2, the Group calculates interest income by applying the Effective Interest Rate (EIR) to the gross carrying amount. Interest income for financial assets in Stage 3 is calculated by applying the EIR to the amortised cost (i.e. the gross carrying amount less credit loss allowance). For Financial Instruments classified as POCI only, interest income is calculated by applying a credit adjusted EIR to the amortised cost of these POCI assets. As a result of the amendments to International Accounting Standard 1: “Presentation of Financial Statements” (IAS1) following IFRS 9, the Group will present interest revenue calculated using the EIR method separately in the income statement.
Debt instruments at FVOCIFrom 1 January 2018 the Group measures debt investment securities at FVOCI when both of the following categories are met:• The instrument is held within a business model, the objective of which is achieved by both collecting contractual
cash flows, selling financial assets and holding such financial instruments for liquidity management purposes; and• The contractual terms of the financial asset meet the SPPI test.
These instruments comprise assets that had previously been classified as investment securities available-for-sale under IAS 39.
FVOCI debt investment securities are subsequently measured at fair value with gains and losses arising due to changes in fair value recognised in OCI. Interest income and foreign exchange gains and losses are recognised in profit or loss in the same manner as for financial assets measured at amortised cost. On derecognition, cumulative gains or losses previously recognised in OCI are reclassified from OCI to profit or loss.
3. Summary of Significant Accounting Policies continuedSubsequent measurement of financial instruments continuedEquity instruments at FVOCI – optionUpon initial recognition, the Group elects to classify irrevocably its equity instruments as equity instruments at FVOCI when they meet the definition of equity under IAS 32 Financial Instruments: Presentation and are not held for trading. Such classification is determined on an instrument by instrument basis.
Gains and losses on these equity instruments are never recycled to profit or loss. Dividends are recognised in profit or loss. Equity instruments at FVOCI are not subject to impairment assessment.
Financial assets at FVTPLGroups of financial assets for which the business model is other than held to collect and held to collect and sell are measured at FVTPL from the date of initial application of IFRS 9.
Derivatives recorded at fair value through profit or lossThe Group enters into derivative transactions with various counterparties. These include interest rate swaps, Forwards and other similar instruments. Derivatives are recorded at fair value and carried as assets when their fair value is positive and as liabilities when their fair value is negative. Net changes in the fair value of derivatives are included in net gain/loss from financial instruments measured at FVTPL, excluding gain/loss on foreign exchange derivatives which are presented in net foreign currency gain.
Financial guarantees, letter of credits and other financial commitmentsFinancial guarantees, letter of credits and other financial commitments are initially recognised in the financial statements at fair value, being the premium received. Subsequent to initial recognition, the Group’s liability under each guarantee is measured at the higher of the amount initially recognised less cumulative amortisation recognised in the income statement and an ECL provision.
OffsettingFinancial assets and liabilities are offset and the net amount is reported in the consolidated statement of financial position when there is a legally enforceable right to set off the recognised amounts and there is an intention to settle on a net basis, or to realise the asset and settle the liability simultaneously.
Cash and cash equivalentsCash and cash equivalents consist of cash on hand, amounts due from central banks, excluding obligatory reserves with central banks, and amounts due from credit institutions that mature within 90 days of the date of origination and are free from contractual encumbrances and readily convertible to known amounts of cash.
BorrowingsIssued financial instruments or their components are classified as liabilities, where the substance of the contractual arrangement results in the Group having an obligation either to deliver cash or another financial asset to the holder, or to satisfy the obligation other than by the exchange of a fixed amount of cash or another financial asset for a fixed number of own equity instruments. Such instruments include amounts due to credit institutions and amounts due to customers (including promissory notes issued). These are initially recognised at the fair value of the consideration received less directly attributable transaction costs. After initial recognition, borrowings are subsequently measured at amortised cost using the effective interest method. Gains and losses are recognised in the consolidated income statement when the borrowings are derecognised as well as through the amortisation process.
If the Group purchases its own debt, it is removed from the statement of financial position and the difference between the carrying amount of the liability and the consideration paid is recognised in the consolidated income statement.
Borrowing costs directly attributable to the acquisition, construction or production of an asset that necessarily takes a substantial period of time to get ready for its intended use or sale are capitalised as part of the cost of the asset. All other borrowing costs are expensed in the period in which they occur. Borrowing costs consist of interest and other costs that an entity incurs in connection with the borrowing of funds.
Notes to Consolidated Financial Statements continuedThousands of Georgian Lari

192 Annual Report 2018 Bank of Georgia Group PLC 193Annual Report 2018 Bank of Georgia Group PLC
Strategic ReportStrategy
Strategic ReportPerformance Governance
FinancialStatements
AdditionalInformation
Strategic ReportOverview
3. Summary of Significant Accounting Policies continuedSubordinated debtSubordinated debt represents long-term funds attracted by the Bank on international financial markets or domestic market. The holders of subordinated debt would be subordinate to all other creditors to receive repayment of debt in case of the Bank’s liquidation. Subordinated debt is carried at amortised cost.
Leasesi. Finance – Group as lessorLeases that transfer substantially all the risks and benefits incidental to ownership of the lease item to the lessee are classified as finance leases. The Group recognises finance lease receivables in the consolidated statement of financial position at a value equal to the net investment in the lease, starting from the date of commencement of the lease term. In calculating the present value of the minimum lease payments, the discount factor used is the interest rate implicit in the lease. Initial direct costs are included in the initial measurement of the finance lease receivables. Lease payments received are apportioned between the finance income and the reduction of the outstanding lease receivable. Finance income is based on a pattern reflecting a constant periodic rate of return on the net investment outstanding.
ii. Operating – Group as lesseeLeases of assets under which the risks and rewards of ownership are effectively retained by the lessor are classified as operating leases. Lease payments under an operating lease are recognised as expenses on a straight-line basis over the lease term and included in other administrative and operating expenses.
iii. Operating – Group as lessorThe Group presents assets subject to operating leases in the consolidated statement of financial position according to the nature of the asset. Lease income from operating leases is recognised in the consolidated income statement on a straight-line basis over the lease term as other income. The aggregate cost of incentives provided to lessees is recognised as a reduction of rental income over the lease term on a straight-line basis. Initial direct costs incurred specifically to earn revenues from an operating lease are added to the carrying amount of the leased asset.
Impairment of financial assetsChanges to the impairment estimationThe adoption of IFRS 9 has fundamentally changed the Group’s accounting for loan loss impairment by replacing IAS 39’s incurred loss approach with the forward-looking expected credit loss (ECL) approach. IFRS 9 requires the Group to record ECL on all of its debt financial assets at amortised cost or FVOCI, finance lease receivables, as well as loan commitments and financial guarantees. The allowance is based on the ECL associated with the probability of default in the next 12 months unless there has been a significant increase in credit risk since origination, in which case the allowance is based on the ECL over the life of the asset. If the financial asset meets the definition of purchased or originated credit impaired, the allowance is based on the change in the lifetime ECL.
Details of the Group’s impairment method and quantitative impact of applying IFRS 9 as at 1 January 2018 are disclosed below.
From 1 January 2018 the Group recorded the allowance for expected credit loss for all debt instruments that are measured at amortised cost, debt instruments at FVOCI and for financial guarantees, letter of credits and other financial commitments (hereafter collectively referred to as “financial instruments”). This contrasts to the IAS 39 impairment model which was not applicable to off balance sheet financial commitments, as these were instead covered by IAS 37: Provisions, Contingent Liabilities and Contingent Assets. The Group applies the simplified approach for trade, lease and other receivables and contract assets and records lifetime expected losses on them.
The determination of impairment losses and allowance moves from an incurred credit loss model whereby credit losses are recognised when a defined loss event occurs under IAS 39, to an expected credit loss model under IFRS 9, where provisions are taken upon initial recognition of the financial instruments. Under IFRS 9, the Group first evaluates individually whether objective evidence of impairment exists for loans that are individually significant. It then collectively assesses loans that are not individually significant and loans which are significant but for which there is no objective evidence of impairment available under the individual assessment.
3. Summary of Significant Accounting Policies continuedStaged approach to the determination of expected credit lossesIFRS 9 introduces a three-stage approach to impairment for Financial Instruments that are performing at the date of origination or purchase. This approach is summarised as follows:• Stage 1: The Group recognises a credit loss allowance at an amount equal to 12-month expected credit losses.
This represents the portion of lifetime expected credit losses from default events that are expected within 12 months of the reporting date, assuming that credit risk has not increased significantly after initial recognition. For those financial assets with a remaining maturity of less than 12 months, a PD is used that corresponds to the remaining maturity.
• Stage 2: The Group recognises a credit loss allowance at an amount equal to lifetime expected credit losses (LTECL) for those Financial Instruments which are considered to have experienced a significant increase in credit risk since initial recognition. This requires the computation of ECL based on lifetime probability of default (LTPD) that represents the probability of default occurring over the remaining lifetime of the Financial Instrument. Allowance for credit losses are higher in this stage because of an increase in credit risk and the impact of a longer time horizon being considered compared to 12 months in Stage 1. Financial Instruments in stage 2 are not yet deemed to be credit-impaired.
• Stage 3: If the Financial Instrument is credit-impaired, it is then moved to Stage 3. The Group recognises a loss allowance at an amount equal to lifetime expected credit losses, reflecting a Probability of Default (PD) of 100% for those Financial Instruments that are credit-impaired.
Financial instruments within the scope of the impairment requirements of IFRS 9 are classified into one of the above three stages. Unless purchased or originated credit impaired, newly originated assets are classified as Stage 1 and remain in that stage unless there is considered to have been a significant increase in credit risk since initial recognition, at which point the asset is reclassified to Stage 2.
Purchased or originated credit-impaired (POCI) assets are Financial Instruments that are credit-impaired on initial recognition. POCI assets are recorded at fair value at original recognition and interest income is subsequently recognised based on a credit adjusted EIR (CAEIR). CAEIR takes into account all contractual terms of the financial asset and expected credit losses. ECLs are only recognised or released to the extent that there is a subsequent change in the expected credit losses where ECLs are calculated based on lifetime expected credit loss. Once the Financial Asset is recognised as POCI, it retains this status until derecognised.
Key judgements and estimates used under IFRS 9 are disclosed in Note 4.
Derecognition of financial assets and liabilitiesDerecognition of Financial AssetsA financial asset (or, where applicable, a part of a financial asset or part of a group of similar financial assets) is derecognised where:• the rights to receive cash flows from the asset have expired; or• the Group has transferred its rights to receive cash flows from the asset, or retained the right to receive cash flows
from the asset, but has assumed an obligation to pay them in full without material delay to a third party under a ‘pass-through’ arrangement; and
• the Group either (a) has transferred substantially all the risks and rewards of the asset, or (b) has neither transferred nor retained substantially all the risks and rewards of the asset, but has transferred control of the asset.
Where the Group has transferred its rights to receive cash flows from an asset and has neither transferred nor retained substantially all the risks and rewards of the asset nor transferred control of the asset, the asset is recognised to the extent of the Group’s continuing involvement in the asset. Continuing involvement that takes the form of a guarantee over the transferred asset is measured at the lower of the original carrying amount of the asset and the maximum amount of consideration that the Group could be required to repay.
Notes to Consolidated Financial Statements continuedThousands of Georgian Lari
194 Annual Report 2018 Bank of Georgia Group PLC 195Annual Report 2018 Bank of Georgia Group PLC
Strategic ReportStrategy
Strategic ReportPerformance Governance
FinancialStatements
AdditionalInformation
Strategic ReportOverview
3. Summary of Significant Accounting Policies continuedDerecognition of financial assets and liabilities continuedWhere continuing involvement takes the form of a written and/or purchased option (including a cash-settled option or similar provision) on the transferred asset, the extent of the Group’s continuing involvement is the amount of the transferred asset that the Group may repurchase, except that in the case of a written put option (including a cash-settled option or similar provision) on an asset measured at fair value, the extent of the Group’s continuing involvement is limited to the lower of the fair value of the transferred asset and the option exercise price.
De-recognition and modification of financial assetsThe Group sometimes renegotiates or otherwise modifies the contractual cash flows of financial assets. When this happens, the Group assesses whether or not the new terms are substantially different to the original terms based on qualitative and quantitative criteria. Once the financial asset is derecognised, the difference is recognised as a derecognition gain or loss, to the extent that an impairment loss has not already been recorded. The newly recognised loans are classified as Stage 1 for ECL measurement purposes, unless the new loan is deemed to be POCI.
When assessing whether or not to derecognise a financial instrument the Group considers the following factors:• Change in currency of the loan• Change in interest rate type• Introduction of an equity feature• Change in counterparty• If the modification is such that the instrument would no longer meet the SPPI criterion.
If the terms are not substantially different, the renegotiation or modification does not result in de-recognition, and the Group recalculates the gross carrying amount based on the revised cash flows of the Financial Asset and recognises a modification gain or loss in interest income. The new gross carrying amount is calculated by discounting the modified cash flows at the original effective interest rate.
Forbearance and modified loansThe Group sometimes makes concessions or modifications to the original terms of the loans as a response to the borrower’s financial difficulties, rather than taking possession or otherwise enforcing collection of collateral. The Group considers a loan forborne when such concessions or modifications are provided as a result of the borrower’s present or expected financial difficulties and the Group would not have agreed to them if the borrower had been financially healthy. Forbearance may involve extending the payment arrangements and the agreement of new loan conditions. Once the terms have been renegotiated, any impairment is measured using the original EIR as calculated before the modification of terms. Once the asset has been identified as forborne the assets are classified in Stage 3. The decision as to how long the asset remains in the forborne category is determined on a case-by-case basis for commercial and SME loans, when a minimum six consecutive payments are required for the rest of the loans to exit from the forbearance category and transfer to Stage 2. Once the loan is transferred to Stage 2, the Group continues to reassess whether there has been a significant increase in credit risk, however, such assets remain in Stage 2 for a minimum 12-month probation period before being transferred to Stage 1.
Derecognition of financial liabilitiesA financial liability is derecognised when the obligation under the liability is discharged or cancelled or expires.
Where an existing financial liability is replaced by another from the same lender on substantially different terms, or the terms of an existing liability are substantially modified, such an exchange or modification is treated as a derecognition of the original liability and the recognition of a new liability, and the difference in the respective carrying amounts is recognised in the consolidated income statement.
3. Summary of Significant Accounting Policies continuedInventoriesInventories are valued at the lower of cost and net realisable value. Net realisable value is the estimated selling price in the ordinary course of business, less estimated costs of completion and the estimated costs necessary to make the sale.
Non-current assets held for sale and discontinued operationsThe Group classifies non-current assets and disposal groups as held for sale if their carrying amounts will be recovered principally through a sale transaction rather than through continuing use. Non-current assets and disposal groups classified as held for sale are measured at the lower of their carrying amount and fair value less costs to sell. Costs to sell are the incremental costs directly attributable to the disposal of an asset (disposal group), excluding finance costs and income tax expense.
The criteria for held for sale classification is regarded as met only when the sale is highly probable and the asset or disposal group is available for immediate sale in its present condition. Actions required to complete the sale should indicate that it is unlikely that significant changes to the sale will be made or that the decision to sell will be withdrawn. Management must be committed to the plan to sell the asset and the sale expected to be completed within one year from the date of the classification.
Immediately before the initial classification of the asset as held for sale, the carrying amount of the asset is measured in accordance with applicable IFRSs.
Property, plant and equipment and intangible assets are not depreciated or amortised once classified as held for sale.Assets and liabilities classified as held for sale are presented separately from other assets and liabilities in the statement of financial position.
A disposal group qualifies as discontinued operation if it is a component of an entity that either has been disposed of, or is classified as held for sale, and:• represents a separate major line of business or geographical area of operations;• is part of a single coordinated plan to dispose of a separate major line of business or geographical area of operations;
or• is a subsidiary acquired exclusively with a view to resale.
Discontinued operations are excluded from the results of continuing operations and are presented as a single amount as profit or loss after tax from discontinued operations in the statement of profit or loss. Net cash flows attributable to the operating, investing and financing activities of discontinued operations are presented separately in the consolidated statement of cash flows.
TaxationThe current income tax expense is calculated in accordance with the regulations in force in the respective territories in which BOGG and its subsidiaries operate.
Deferred tax assets and liabilities are calculated in respect of temporary differences using the liability method. Deferred income taxes are provided for all temporary differences arising between the tax bases of assets and liabilities and their carrying values for financial reporting purposes, except where the deferred income tax arises from the initial recognition of goodwill or of an asset or liability in a transaction that is not a business combination and, at the time of the transaction, affects neither the accounting profit nor taxable profit or loss.
A deferred tax asset is recorded only to the extent that it is probable that taxable profit will be available against which the deductible temporary differences can be utilised. Deferred tax assets and liabilities are measured at tax rates that are expected to apply to the period when the asset is realised or the liability is settled, based on tax rates that have been enacted or substantively enacted at the reporting date.
Notes to Consolidated Financial Statements continuedThousands of Georgian Lari
196 Annual Report 2018 Bank of Georgia Group PLC 197Annual Report 2018 Bank of Georgia Group PLC
Strategic ReportStrategy
Strategic ReportPerformance Governance
FinancialStatements
AdditionalInformation
Strategic ReportOverview
3. Summary of Significant Accounting Policies continuedTaxation continuedDeferred tax liabilities are provided on temporary differences arising on investments in subsidiaries, associates and joint ventures, except where the timing of the reversal of the temporary difference can be controlled and it is probable that the temporary difference will not reverse in the foreseeable future.
Georgia and Belarus also have various operating taxes that are assessed on the Group’s activities. These taxes are included as a component of other operating expenses.
Investment propertiesInvestment property is land or building or a part of a building held to earn rental income or for capital appreciation and which is not used by the Group.
Investment property is initially recognised at cost, including transaction costs, and subsequently remeasured at fair value reflecting market conditions at the end of the reporting period. Fair value of the Group’s investment property is determined on the basis of various sources including reports of independent appraisers, who hold a recognised and relevant professional qualifications and who have recent experience in valuation of property of similar location and category.
Gains and losses resulting from changes in the fair value of investment property as well as earned rental income are recorded in the income statement within net other income.
If an investment property becomes owner-occupied, it is reclassified to property and equipment, and its carrying amount at the date of reclassification becomes its deemed cost to be subsequently depreciated. If an investment property satisfies asset held for sale criteria, it is reclassified to the assets held for sale category.
Property and equipmentProperty and equipment, is carried at cost less accumulated depreciation and any accumulated impairment in value. Such cost includes the cost of replacing part of the equipment when that cost is incurred if the recognition criteria are met.
The carrying values of property and equipment are reviewed for impairment when events or changes in circumstances indicate that the carrying value may not be recoverable.
Depreciation of an asset commences from the date the asset is ready and available for use. Depreciation is calculated on a straight-line basis over the following estimated useful lives:
Years
Office buildings and service centres Up to 100
Furniture and fixtures 10
Computers and equipment 5-10
Motor vehicles 5
The assets’ residual values, useful lives and methods are reviewed, and adjusted as appropriate, at each financial year-end.
Assets under construction are stated at cost and are not depreciated until the time they are available for use and reclassified to their respective group of property and equipment.
Leasehold improvements are depreciated over the life of the related leased asset or the expected lease term if lower.
Costs related to repairs and renewals are charged when incurred and included in other operating expenses, unless they qualify for capitalisation.
3. Summary of Significant Accounting Policies continuedGoodwill impairmentGoodwill is reviewed for impairment, annually or more frequently if events or changes in circumstances indicate that the carrying amount may be impaired.
For the purpose of impairment testing, goodwill acquired in a business combination is, from the acquisition date, allocated to each of the Group’s cash-generating units, or groups of cash-generating units, that are expected to benefit from the synergies of the combination, irrespective of whether other assets or liabilities of the Group are assigned to those units or groups of units. Each unit or group of units to which the goodwill is so allocated:• represents the lowest level within the Group at which the goodwill is monitored for internal management
purposes; and• is not larger than a segment as defined in IFRS 8 “Operating Segments”.
Impairment is determined by assessing the recoverable amount of the cash-generating unit (group of cash-generating units), to which the goodwill relates. Where the recoverable amount of the cash-generating unit (group of cash-generating units) is less than the carrying amount, an impairment loss is recognised. Impairment losses cannot be reversed in future periods.
Intangible assetsThe Group’s intangible assets include computer software and licences.
Intangible assets acquired separately are measured on initial recognition at cost. The cost of intangible assets acquired in a business combination is fair value as at the date of acquisition. Following initial recognition, intangible assets are carried at cost less any accumulated amortisation and any accumulated impairment losses. The economic lives of intangible assets are assessed to be finite and amortised over four to 15 years and assessed for impairment whenever there is an indication that the intangible asset may be impaired. Amortisation periods and methods for intangible assets are reviewed at least at each financial year-end.
Costs associated with maintaining computer software programmes are recorded as an expense as incurred. Software development costs (relating to the design and testing of new or substantially improved software) are recognised as intangible assets only when the Group can demonstrate the technical feasibility of completing the software so that it will be available for use or sale, its intention to complete the asset and its ability to use or sell the asset, how the asset will generate future economic benefits, the availability of resources to complete the asset and the ability to measure reliably the expenditure during the development. Other software development costs are recognised as an expense as incurred.
ProvisionsProvisions are recognised when the Group has a present legal or constructive obligation as a result of past events, and it is probable that an outflow of resources embodying economic benefits will be required to settle the obligation and a reliable estimate of the amount of obligation can be made.
Share-based payment transactionsEmployees (including senior executives) of the Group receive share-based remuneration, whereby they render services and receive equity instruments of the Group (‘equity-settled transactions’) as consideration for the services provided.
Equity-settled transactionsThe cost of equity-settled transactions with employees is measured by reference to the fair value at the date on which they are granted.
Notes to Consolidated Financial Statements continuedThousands of Georgian Lari
198 Annual Report 2018 Bank of Georgia Group PLC 199Annual Report 2018 Bank of Georgia Group PLC
Strategic ReportStrategy
Strategic ReportPerformance Governance
FinancialStatements
AdditionalInformation
Strategic ReportOverview
3. Summary of Significant Accounting Policies continuedShare-based payment transactions continuedThe cost of equity-settled transactions is recognised together with the corresponding increase in equity, over the period in which the performance and/or service conditions are fulfilled, ending on the date when the relevant employee is fully entitled to the award (‘the vesting date’). The cumulative expense recognised for equity-settled transactions at each reporting date until the vesting date reflects the extent to which the vesting period has expired and the Group’s best estimate of the number of equity instruments that will ultimately vest. The consolidated income statement charge or credit for the period represents the movement in cumulative expense recognised as at the beginning and end of that period.
No expense is recognised for the awards that do not ultimately vest except for the awards where vesting is conditional upon market conditions which are treated as vesting irrespective of whether the market condition is satisfied, provided that all other performance conditions are satisfied.
Where the terms of an equity-settled award are modified, the minimum expense is recognised as if the terms had not been modified. An additional expense is recognised for any modification which increases the total fair value of the share-based payment arrangement, or is otherwise beneficial to the employee as measured at the date of the modification.
Where a new equity-settled award is designated as a replacement of a cancelled equity-settled award, the replacement of equity instruments are accounted for as a modification.
Where an equity-settled award is cancelled, it is treated as if it has vested on the date of cancellation, and any expense not yet recognised for the award is recognised immediately. However, if a new award is substituted for the cancelled award, and designated as the replacement award on the date that it is granted, the cancelled and the new awards are treated as if they were a modification of the original award, as described in the previous paragraph.
EquityShare capitalOrdinary shares are classified as equity. External costs directly attributable to the issue of new shares, other than on a business combination, are shown as a deduction from the proceeds in equity. Any excess of the fair value of consideration received over the par value of shares issued is recognised as additional paid-in capital.
Treasury sharesWhere BOGG or its subsidiaries purchase BOGG’s shares, the consideration paid, including any attributable transaction costs, net of income taxes, is deducted from total equity as treasury shares until they are cancelled or reissued. Where such shares are subsequently sold or reissued, any consideration received is included in equity. Treasury shares are stated at par value, with adjustment of premiums against additional paid-in capital.
DividendsDividends are recognised as a liability and deducted from equity at the reporting date only if they are declared before or on the reporting date. Dividends are disclosed when they are proposed before the reporting date or proposed or declared after the reporting date but before the consolidated financial statements are authorised for issue. All expenses associated with dividend distribution are added to dividend amount and recorded directly through equity.
ContingenciesContingent liabilities are not recognised in the consolidated statement of financial position but are disclosed unless the possibility of any outflow in settlement is remote. A contingent asset is not recognised in the consolidated statement of financial position but disclosed when an inflow of economic benefits is probable.
3. Summary of Significant Accounting Policies continuedIncome and expense recognitionRevenue is recognised to the extent that it is probable that the economic benefits will flow to the Group and the revenue can be reliably measured. The following specific recognition criteria must also be met before revenue and expense are recognised:
Interest and similar income and expenseFor all financial instruments measured at amortised cost and interest bearing securities interest income or expense is recorded at the effective interest rate, which is the rate that exactly discounts estimated future cash payments or receipts through the expected life of the financial instrument or a shorter period, where appropriate, to the net carrying amount of the financial asset or financial liability. The calculation takes into account all contractual terms of the financial instrument (for example, prepayment options) and includes any fees or incremental costs that are directly attributable to the instrument and are an integral part of the effective interest rate, but not future credit losses. The carrying amount of the financial asset or financial liability is adjusted if the Group revises its estimates of payments or receipts. The adjusted carrying amount is calculated based on the original effective interest rate and the change in carrying amount is recorded as interest income or expense.
Fee and commission incomeThe Group earns fee and commission income from a diverse range of services it provides to its customers. Fee and commission income is recognised when the Group satisfies a performance obligation. Fee income can be divided into the following categories:
Fee income earned from services that are provided over a certain period of timeFees earned for the provision of services over a period of time are accrued over that period. These fees include commission incomes and asset management, custody, package services on bundled products and other management and advisory fees. Loan commitment fees for loans that are likely to be drawn down and other credit-related fees are deferred (together with any incremental costs) and recognised as an adjustment to the effective interest rate on the loan.
Customer loyalty programmeCustomer loyalty program points accumulated in the business are treated as deferred revenue and recognised in revenues gradually as they are earned. The Group recognises gross revenue earned from customer loyalty programme when the performance obligation is satisfied, i.e. when the customer redeems the points or the points expire, where the Group acts as a principal. Conversely, the Group measures its revenue as the net amount retained on its account representing the difference between the consideration allocated to the award credits and the amount payable to the third party for supplying the awards as soon as the award credits are granted, where the Group acts as an agent. At each reporting date the Group estimates the portion of accumulated points that is expected to be utilised by customers based on statistical data. These points are treated as a liability in the statement of financial position and are only recognised in revenue when points are earned or expired.
Fee income from providing transaction servicesFees arising from negotiating or participating in the negotiation of a transaction for a third party – such as the arrangement of the acquisition of shares or other securities or the purchase or sale of businesses – are recognised upon satisfaction of the performance obligations on completion of the underlying transaction. Fees or components of fees that are linked to a certain performance obligation are recognised after fulfilling the corresponding criteria.
Dividend incomeDividend revenue is recognised when the Group’s right to receive the payment is established.
Non-recurring itemsThe Group separately classifies and discloses those income and expenses that are non-recurring by nature. The Group defines non-recurring income or expense as an income or expense triggered by or originated from an economic, business or financial event that is not inherent to the regular and ordinary business course of the Group and is caused by uncertain or unpredictable external factors that cannot be reasonably expected to occur in the future and, thus they should not be taken into account when making projections of future results.
Notes to Consolidated Financial Statements continuedThousands of Georgian Lari
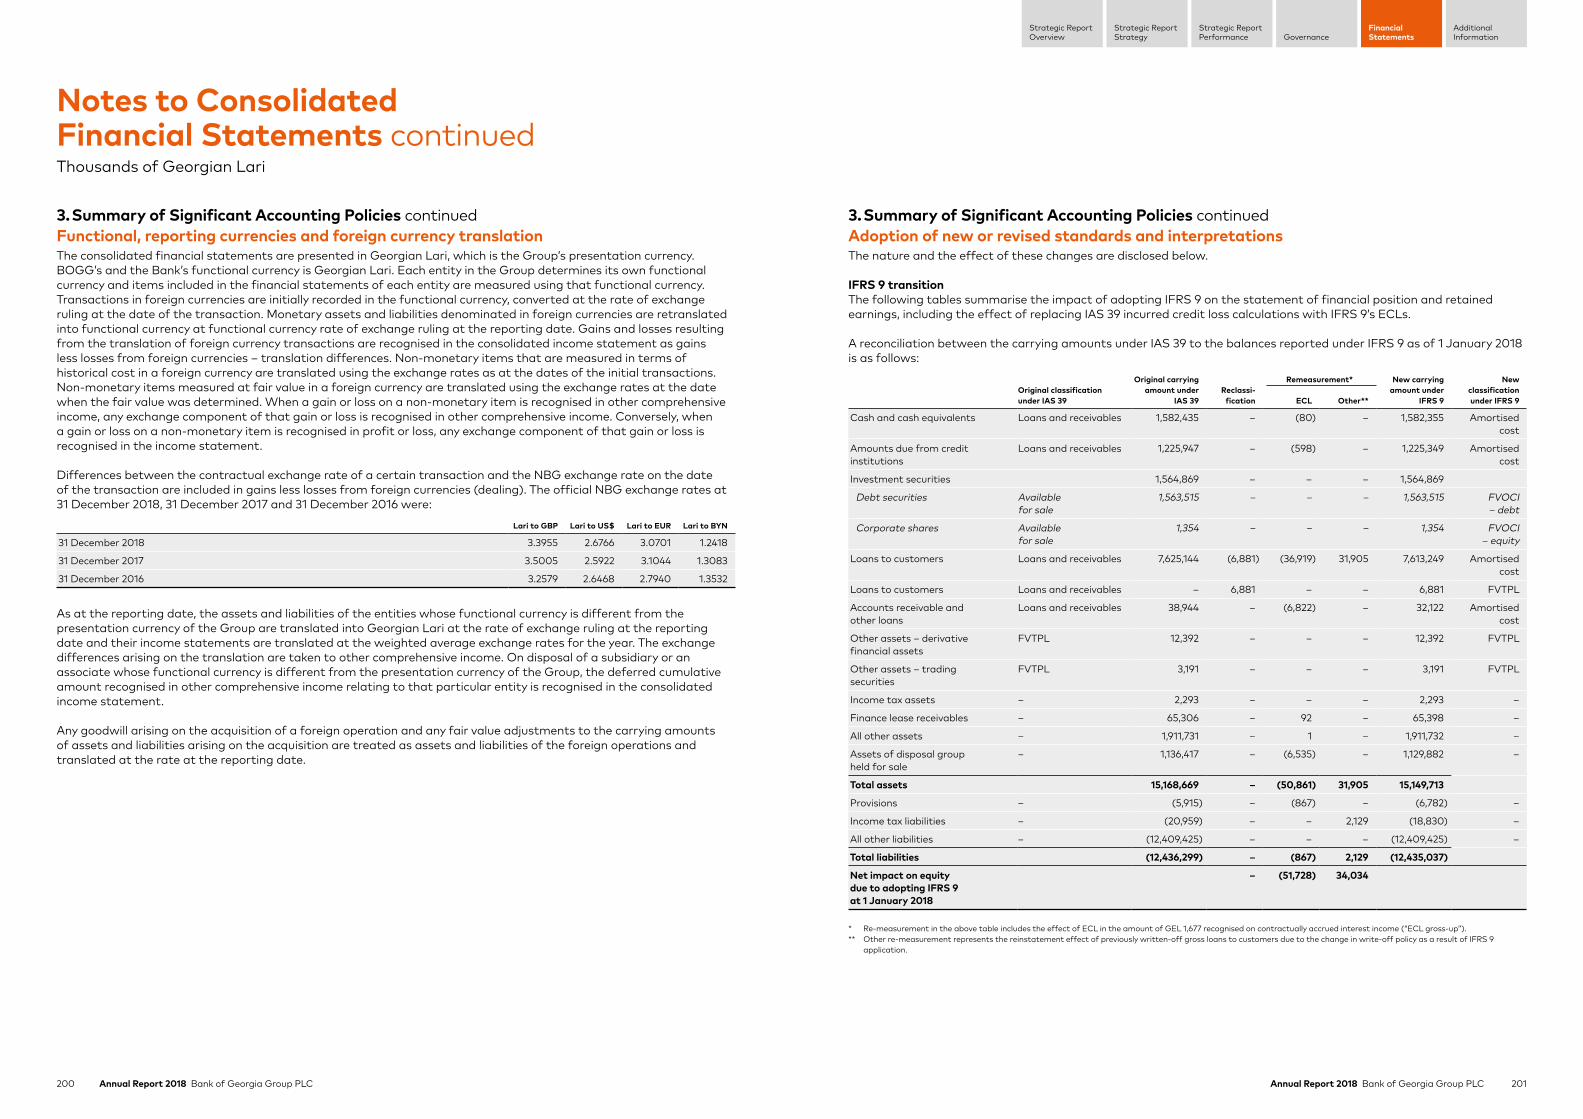
200 Annual Report 2018 Bank of Georgia Group PLC 201Annual Report 2018 Bank of Georgia Group PLC
Strategic ReportStrategy
Strategic ReportPerformance Governance
FinancialStatements
AdditionalInformation
Strategic ReportOverview
3. Summary of Significant Accounting Policies continuedFunctional, reporting currencies and foreign currency translationThe consolidated financial statements are presented in Georgian Lari, which is the Group’s presentation currency. BOGG’s and the Bank’s functional currency is Georgian Lari. Each entity in the Group determines its own functional currency and items included in the financial statements of each entity are measured using that functional currency. Transactions in foreign currencies are initially recorded in the functional currency, converted at the rate of exchange ruling at the date of the transaction. Monetary assets and liabilities denominated in foreign currencies are retranslated into functional currency at functional currency rate of exchange ruling at the reporting date. Gains and losses resulting from the translation of foreign currency transactions are recognised in the consolidated income statement as gains less losses from foreign currencies – translation differences. Non-monetary items that are measured in terms of historical cost in a foreign currency are translated using the exchange rates as at the dates of the initial transactions. Non-monetary items measured at fair value in a foreign currency are translated using the exchange rates at the date when the fair value was determined. When a gain or loss on a non-monetary item is recognised in other comprehensive income, any exchange component of that gain or loss is recognised in other comprehensive income. Conversely, when a gain or loss on a non-monetary item is recognised in profit or loss, any exchange component of that gain or loss is recognised in the income statement.
Differences between the contractual exchange rate of a certain transaction and the NBG exchange rate on the date of the transaction are included in gains less losses from foreign currencies (dealing). The official NBG exchange rates at 31 December 2018, 31 December 2017 and 31 December 2016 were:
Lari to GBP Lari to US$ Lari to EUR Lari to BYN
31 December 2018 3.3955 2.6766 3.0701 1.2418
31 December 2017 3.5005 2.5922 3.1044 1.3083
31 December 2016 3.2579 2.6468 2.7940 1.3532
As at the reporting date, the assets and liabilities of the entities whose functional currency is different from the presentation currency of the Group are translated into Georgian Lari at the rate of exchange ruling at the reporting date and their income statements are translated at the weighted average exchange rates for the year. The exchange differences arising on the translation are taken to other comprehensive income. On disposal of a subsidiary or an associate whose functional currency is different from the presentation currency of the Group, the deferred cumulative amount recognised in other comprehensive income relating to that particular entity is recognised in the consolidated income statement.
Any goodwill arising on the acquisition of a foreign operation and any fair value adjustments to the carrying amounts of assets and liabilities arising on the acquisition are treated as assets and liabilities of the foreign operations and translated at the rate at the reporting date.
3. Summary of Significant Accounting Policies continuedAdoption of new or revised standards and interpretationsThe nature and the effect of these changes are disclosed below.
IFRS 9 transitionThe following tables summarise the impact of adopting IFRS 9 on the statement of financial position and retained earnings, including the effect of replacing IAS 39 incurred credit loss calculations with IFRS 9’s ECLs.
A reconciliation between the carrying amounts under IAS 39 to the balances reported under IFRS 9 as of 1 January 2018 is as follows:
Original classification under IAS 39
Original carrying amount under
IAS 39Reclassi-
fication
Remeasurement* New carrying amount under
IFRS 9
New classification under IFRS 9ECL Other**
Cash and cash equivalents Loans and receivables 1,582,435 – (80) – 1,582,355 Amortisedcost
Amounts due from credit institutions
Loans and receivables 1,225,947 – (598) – 1,225,349 Amortisedcost
Investment securities 1,564,869 – – – 1,564,869
Debt securities Availablefor sale
1,563,515 – – – 1,563,515 FVOCI– debt
Corporate shares Availablefor sale
1,354 – – – 1,354 FVOCI– equity
Loans to customers Loans and receivables 7,625,144 (6,881) (36,919) 31,905 7,613,249 Amortisedcost
Loans to customers Loans and receivables – 6,881 – – 6,881 FVTPL
Accounts receivable and other loans
Loans and receivables 38,944 – (6,822) – 32,122 Amortisedcost
Other assets – derivative financial assets
FVTPL 12,392 – – – 12,392 FVTPL
Other assets – trading securities
FVTPL 3,191 – – – 3,191 FVTPL
Income tax assets – 2,293 – – – 2,293 –
Finance lease receivables – 65,306 – 92 – 65,398 –
All other assets – 1,911,731 – 1 – 1,911,732 –
Assets of disposal group held for sale
– 1,136,417 – (6,535) – 1,129,882 –
Total assets 15,168,669 – (50,861) 31,905 15,149,713
Provisions – (5,915) – (867) – (6,782) –
Income tax liabilities – (20,959) – – 2,129 (18,830) –
All other liabilities – (12,409,425) – – – (12,409,425) –
Total liabilities (12,436,299) – (867) 2,129 (12,435,037)
Net impact on equity due to adopting IFRS 9 at 1 January 2018
– (51,728) 34,034
* Re-measurement in the above table includes the effect of ECL in the amount of GEL 1,677 recognised on contractually accrued interest income (“ECL gross-up”).** Other re-measurement represents the reinstatement effect of previously written-off gross loans to customers due to the change in write-off policy as a result of IFRS 9
application.
Notes to Consolidated Financial Statements continuedThousands of Georgian Lari
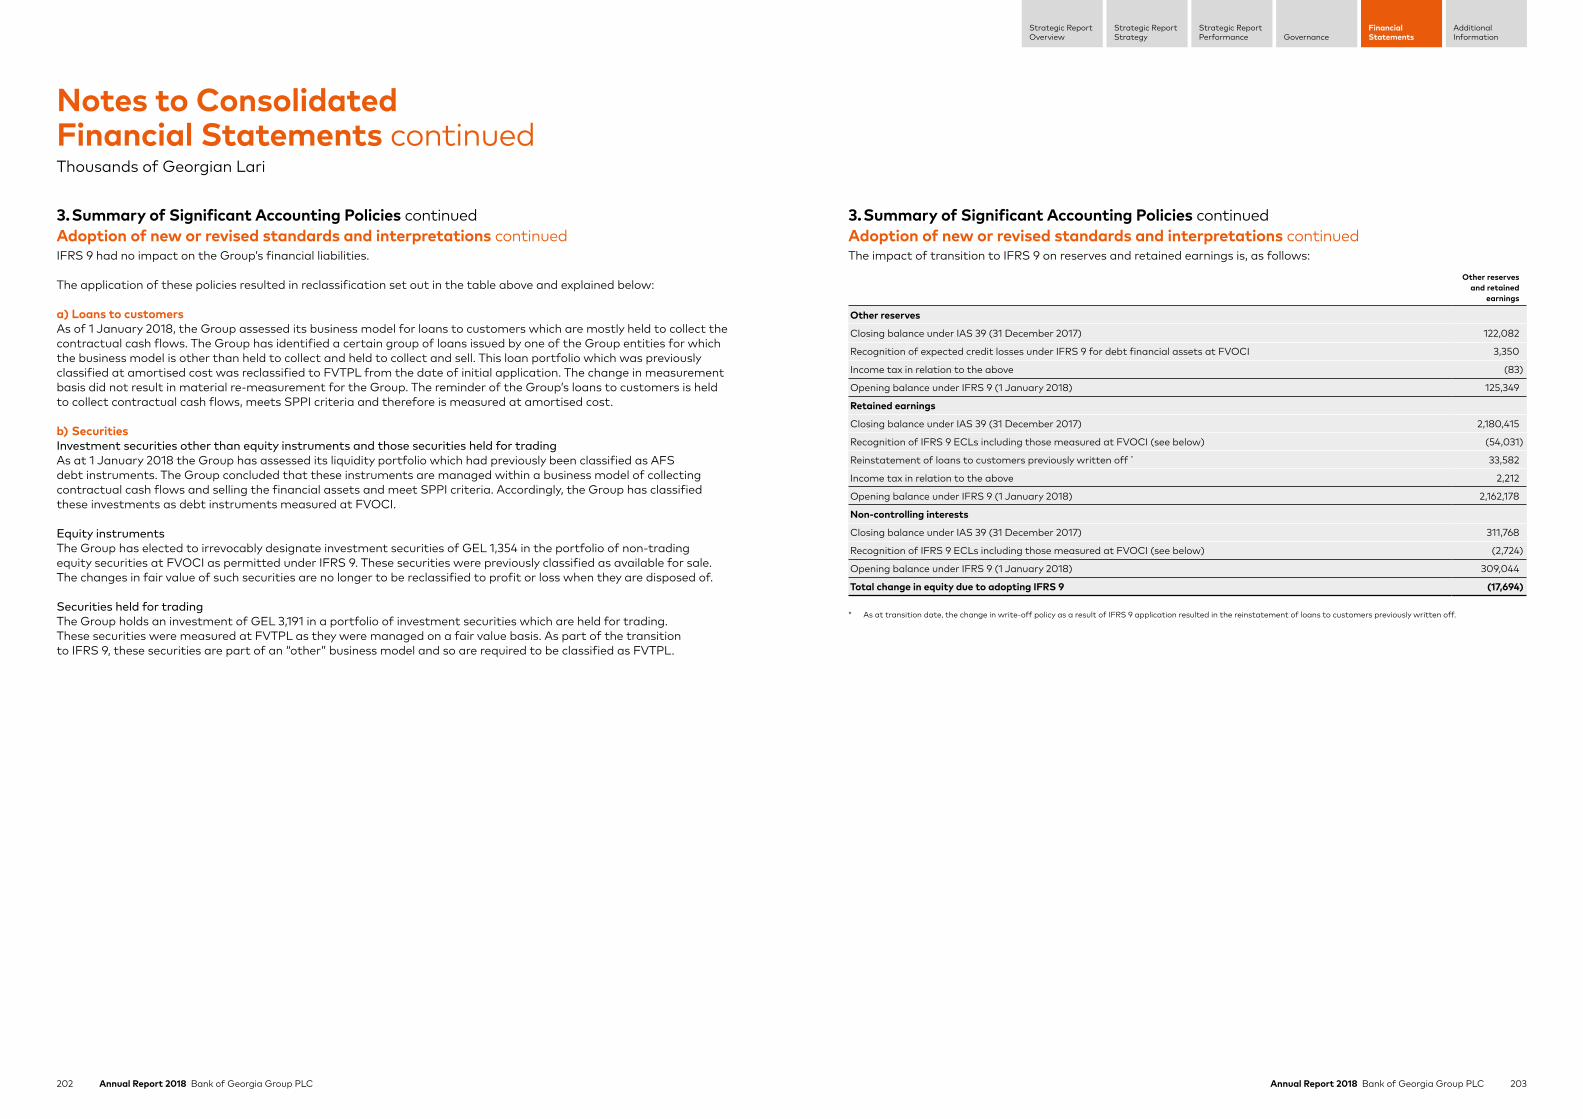
202 Annual Report 2018 Bank of Georgia Group PLC 203Annual Report 2018 Bank of Georgia Group PLC
Strategic ReportStrategy
Strategic ReportPerformance Governance
FinancialStatements
AdditionalInformation
Strategic ReportOverview
3. Summary of Significant Accounting Policies continuedAdoption of new or revised standards and interpretations continuedIFRS 9 had no impact on the Group’s financial liabilities.
The application of these policies resulted in reclassification set out in the table above and explained below:
a) Loans to customersAs of 1 January 2018, the Group assessed its business model for loans to customers which are mostly held to collect the contractual cash flows. The Group has identified a certain group of loans issued by one of the Group entities for which the business model is other than held to collect and held to collect and sell. This loan portfolio which was previously classified at amortised cost was reclassified to FVTPL from the date of initial application. The change in measurement basis did not result in material re-measurement for the Group. The reminder of the Group’s loans to customers is held to collect contractual cash flows, meets SPPI criteria and therefore is measured at amortised cost.
b) SecuritiesInvestment securities other than equity instruments and those securities held for tradingAs at 1 January 2018 the Group has assessed its liquidity portfolio which had previously been classified as AFS debt instruments. The Group concluded that these instruments are managed within a business model of collecting contractual cash flows and selling the financial assets and meet SPPI criteria. Accordingly, the Group has classified these investments as debt instruments measured at FVOCI.
Equity instrumentsThe Group has elected to irrevocably designate investment securities of GEL 1,354 in the portfolio of non-trading equity securities at FVOCI as permitted under IFRS 9. These securities were previously classified as available for sale. The changes in fair value of such securities are no longer to be reclassified to profit or loss when they are disposed of.
Securities held for tradingThe Group holds an investment of GEL 3,191 in a portfolio of investment securities which are held for trading. These securities were measured at FVTPL as they were managed on a fair value basis. As part of the transition to IFRS 9, these securities are part of an “other” business model and so are required to be classified as FVTPL.
3. Summary of Significant Accounting Policies continuedAdoption of new or revised standards and interpretations continuedThe impact of transition to IFRS 9 on reserves and retained earnings is, as follows:
Other reserves and retained
earnings
Other reserves
Closing balance under IAS 39 (31 December 2017) 122,082
Recognition of expected credit losses under IFRS 9 for debt financial assets at FVOCI 3,350
Income tax in relation to the above (83)
Opening balance under IFRS 9 (1 January 2018) 125,349
Retained earnings
Closing balance under IAS 39 (31 December 2017) 2,180,415
Recognition of IFRS 9 ECLs including those measured at FVOCI (see below) (54,031)
Reinstatement of loans to customers previously written off * 33,582
Income tax in relation to the above 2,212
Opening balance under IFRS 9 (1 January 2018) 2,162,178
Non-controlling interests
Closing balance under IAS 39 (31 December 2017) 311,768
Recognition of IFRS 9 ECLs including those measured at FVOCI (see below) (2,724)
Opening balance under IFRS 9 (1 January 2018) 309,044
Total change in equity due to adopting IFRS 9 (17,694)
* As at transition date, the change in write-off policy as a result of IFRS 9 application resulted in the reinstatement of loans to customers previously written off.
Notes to Consolidated Financial Statements continuedThousands of Georgian Lari
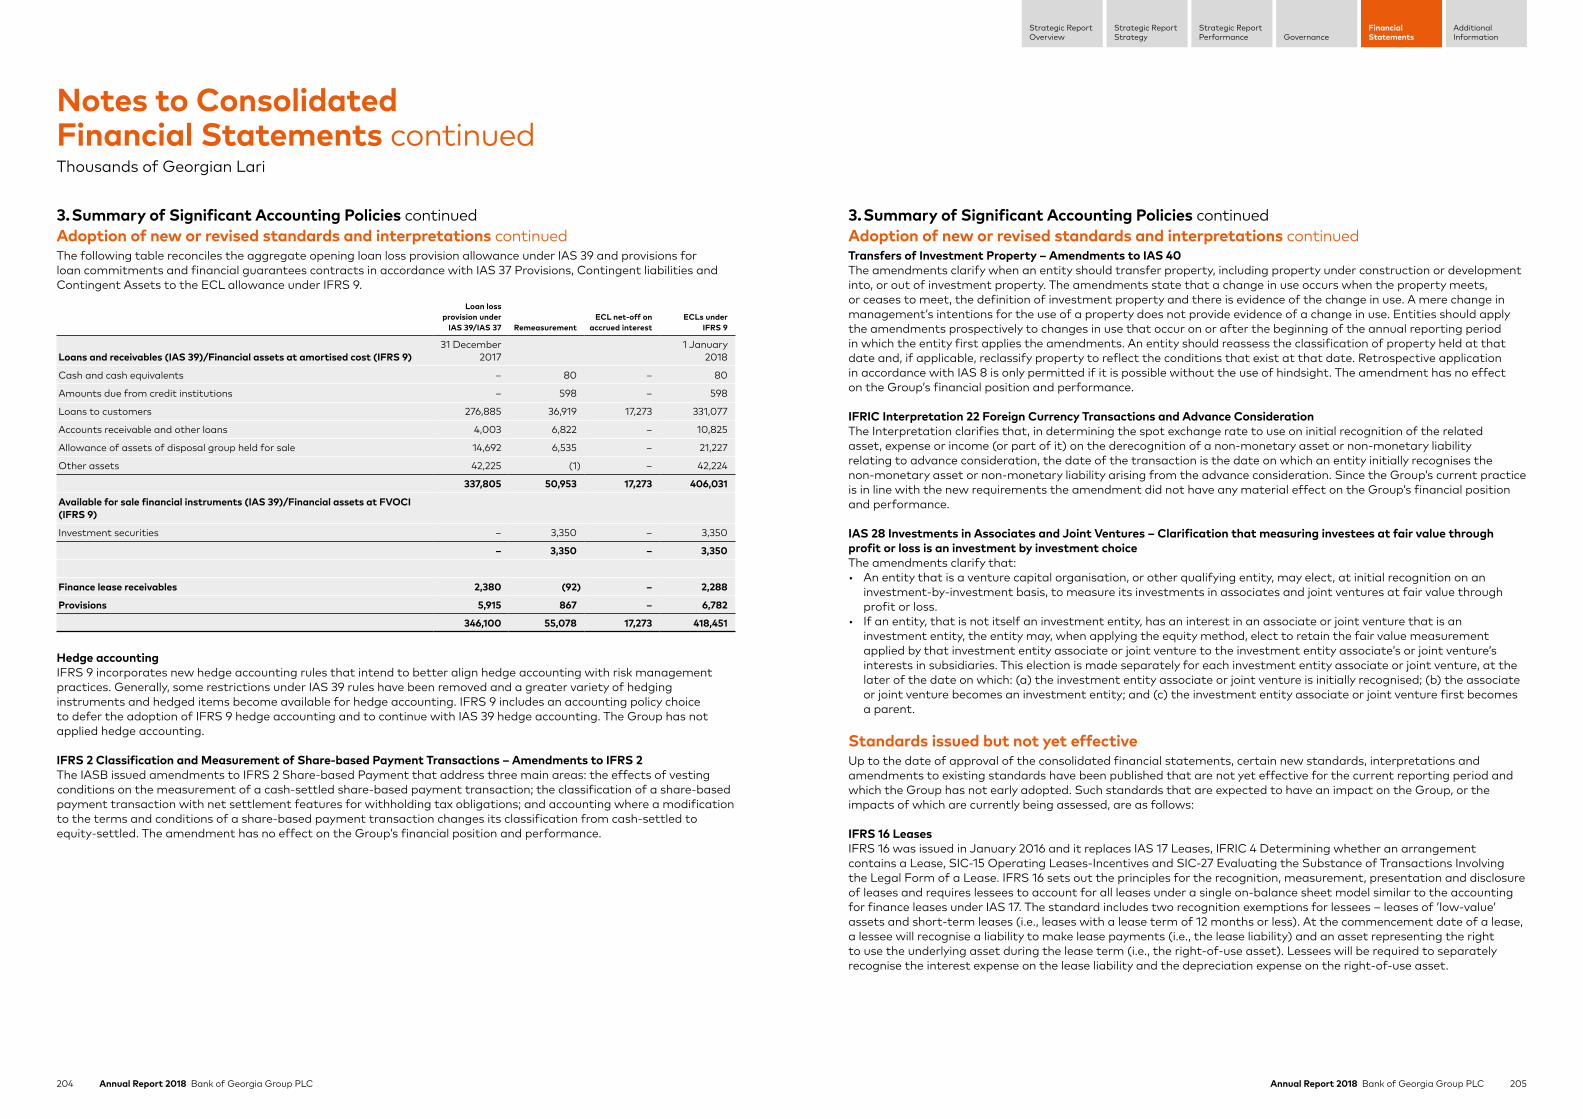
204 Annual Report 2018 Bank of Georgia Group PLC 205Annual Report 2018 Bank of Georgia Group PLC
Strategic ReportStrategy
Strategic ReportPerformance Governance
FinancialStatements
AdditionalInformation
Strategic ReportOverview
3. Summary of Significant Accounting Policies continuedAdoption of new or revised standards and interpretations continuedThe following table reconciles the aggregate opening loan loss provision allowance under IAS 39 and provisions for loan commitments and financial guarantees contracts in accordance with IAS 37 Provisions, Contingent liabilities and Contingent Assets to the ECL allowance under IFRS 9.
Loan loss provision under
IAS 39/IAS 37 RemeasurementECL net-off on
accrued interestECLs under
IFRS 9
Loans and receivables (IAS 39)/Financial assets at amortised cost (IFRS 9)31 December
20171 January
2018
Cash and cash equivalents – 80 – 80
Amounts due from credit institutions – 598 – 598
Loans to customers 276,885 36,919 17,273 331,077
Accounts receivable and other loans 4,003 6,822 – 10,825
Allowance of assets of disposal group held for sale 14,692 6,535 – 21,227
Other assets 42,225 (1) – 42,224
337,805 50,953 17,273 406,031
Available for sale financial instruments (IAS 39)/Financial assets at FVOCI (IFRS 9)
Investment securities – 3,350 – 3,350
– 3,350 – 3,350
Finance lease receivables 2,380 (92) – 2,288
Provisions 5,915 867 – 6,782
346,100 55,078 17,273 418,451
Hedge accountingIFRS 9 incorporates new hedge accounting rules that intend to better align hedge accounting with risk management practices. Generally, some restrictions under IAS 39 rules have been removed and a greater variety of hedging instruments and hedged items become available for hedge accounting. IFRS 9 includes an accounting policy choice to defer the adoption of IFRS 9 hedge accounting and to continue with IAS 39 hedge accounting. The Group has not applied hedge accounting.
IFRS 2 Classification and Measurement of Share-based Payment Transactions – Amendments to IFRS 2The IASB issued amendments to IFRS 2 Share-based Payment that address three main areas: the effects of vesting conditions on the measurement of a cash-settled share-based payment transaction; the classification of a share-based payment transaction with net settlement features for withholding tax obligations; and accounting where a modification to the terms and conditions of a share-based payment transaction changes its classification from cash-settled to equity-settled. The amendment has no effect on the Group’s financial position and performance.
3. Summary of Significant Accounting Policies continuedAdoption of new or revised standards and interpretations continuedTransfers of Investment Property – Amendments to IAS 40The amendments clarify when an entity should transfer property, including property under construction or development into, or out of investment property. The amendments state that a change in use occurs when the property meets, or ceases to meet, the definition of investment property and there is evidence of the change in use. A mere change in management’s intentions for the use of a property does not provide evidence of a change in use. Entities should apply the amendments prospectively to changes in use that occur on or after the beginning of the annual reporting period in which the entity first applies the amendments. An entity should reassess the classification of property held at that date and, if applicable, reclassify property to reflect the conditions that exist at that date. Retrospective application in accordance with IAS 8 is only permitted if it is possible without the use of hindsight. The amendment has no effect on the Group’s financial position and performance.
IFRIC Interpretation 22 Foreign Currency Transactions and Advance ConsiderationThe Interpretation clarifies that, in determining the spot exchange rate to use on initial recognition of the related asset, expense or income (or part of it) on the derecognition of a non-monetary asset or non-monetary liability relating to advance consideration, the date of the transaction is the date on which an entity initially recognises the non-monetary asset or non-monetary liability arising from the advance consideration. Since the Group’s current practice is in line with the new requirements the amendment did not have any material effect on the Group’s financial position and performance.
IAS 28 Investments in Associates and Joint Ventures – Clarification that measuring investees at fair value through profit or loss is an investment by investment choiceThe amendments clarify that:• An entity that is a venture capital organisation, or other qualifying entity, may elect, at initial recognition on an
investment-by-investment basis, to measure its investments in associates and joint ventures at fair value through profit or loss.
• If an entity, that is not itself an investment entity, has an interest in an associate or joint venture that is an investment entity, the entity may, when applying the equity method, elect to retain the fair value measurement applied by that investment entity associate or joint venture to the investment entity associate’s or joint venture’s interests in subsidiaries. This election is made separately for each investment entity associate or joint venture, at the later of the date on which: (a) the investment entity associate or joint venture is initially recognised; (b) the associate or joint venture becomes an investment entity; and (c) the investment entity associate or joint venture first becomes a parent.
Standards issued but not yet effectiveUp to the date of approval of the consolidated financial statements, certain new standards, interpretations and amendments to existing standards have been published that are not yet effective for the current reporting period and which the Group has not early adopted. Such standards that are expected to have an impact on the Group, or the impacts of which are currently being assessed, are as follows:
IFRS 16 LeasesIFRS 16 was issued in January 2016 and it replaces IAS 17 Leases, IFRIC 4 Determining whether an arrangement contains a Lease, SIC-15 Operating Leases-Incentives and SIC-27 Evaluating the Substance of Transactions Involving the Legal Form of a Lease. IFRS 16 sets out the principles for the recognition, measurement, presentation and disclosure of leases and requires lessees to account for all leases under a single on-balance sheet model similar to the accounting for finance leases under IAS 17. The standard includes two recognition exemptions for lessees – leases of ’low-value’ assets and short-term leases (i.e., leases with a lease term of 12 months or less). At the commencement date of a lease, a lessee will recognise a liability to make lease payments (i.e., the lease liability) and an asset representing the right to use the underlying asset during the lease term (i.e., the right-of-use asset). Lessees will be required to separately recognise the interest expense on the lease liability and the depreciation expense on the right-of-use asset.
Notes to Consolidated Financial Statements continuedThousands of Georgian Lari
206 Annual Report 2018 Bank of Georgia Group PLC 207Annual Report 2018 Bank of Georgia Group PLC
Strategic ReportStrategy
Strategic ReportPerformance Governance
FinancialStatements
AdditionalInformation
Strategic ReportOverview
3. Summary of Significant Accounting Policies continuedStandards issued but not yet effective continuedLessees will be also required to remeasure the lease liability upon the occurrence of certain events (e.g., a change in the lease term, a change in future lease payments resulting from a change in an index or rate used to determine those payments). The lessee will generally recognise the amount of the remeasurement of the lease liability as an adjustment to the right-of-use asset.
Lessor accounting under IFRS 16 is substantially unchanged from today’s accounting under IAS 17. Lessors will continue to classify all leases using the same classification principle as in IAS 17 and distinguish between two types of leases: operating and finance leases.
IFRS 16 also requires lessees and lessors to make more extensive disclosures than under IAS 17.
Transition to IFRS 16The Group will apply the standard from its mandatory adoption date of 1 January 2019. The Group plans to apply the standard using a modified retrospective approach and will not restate comparative amounts for the year prior to first adoption. The Standard will be applied to contracts that were previously identified as leases in accordance with IAS 17 and IFRIC 4. The Group will apply the recognition exemptions on lease contracts for which the lease term ends within 12 months as of the date of initial application, and lease contracts for which the underlying asset is of low value. A lease liability will be measured at the present value of the remaining lease payments, discounted using the lessee’s incremental borrowing rate at the date of initial application. Right-of-use assets will be measured on transition at an amount equal to the lease liability, adjusted by the amount of any prepaid amounts recognised immediately before the date of initial application.
The Group has completed an initial assessment of the potential impact of transition to IFRS 16 on its consolidated financial statements. Based on the data as at 1 January 2019, the Group estimates that the adoption of the new standard will result in an increase in the Group’s liabilities by GEL 75,517 and recognition of right-of-use assets of GEL 89,869, of which GEL 14,352 is expected to be reclassified from prepayments to right-of-use assets.
Annual improvements 2015-2017 cycleIAS 12, Income TaxesThe amendment to IAS 12 clarifies that the income tax consequences (if any) of dividends as defined in IFRS 9 (i.e. distributions of profits to holders of equity instruments in proportion to their holdings) must be recognised:• at the same time as the liability to pay those dividends is recognised; and• in profit or loss, other comprehensive income, or the statement of changes in equity according to where the entity
originally recognised the past transactions or events that generated the distributable profits from which the dividends are being paid.
The amendment to IAS 12 is effective for periods beginning on or after 1 January 2019, although earlier application is permitted. Entities must apply the amendment to income tax consequences of dividends recognised on or after the beginning of the earliest comparative period presented. The Group is currently assessing the impact.
4. Significant Accounting Judgements and EstimatesIn the process of applying the Group’s accounting policies, the Board of Directors and management use their judgement and make estimates in determining the amounts recognised in the consolidated financial statements. The most significant judgements and estimates are as follows:
Fair value of financial instrumentsWhere the fair values of financial assets and financial liabilities recorded in the consolidated statement of financial position cannot be derived from active markets, they are determined using a variety of valuation techniques that include the use of mathematical models. The input to these models is taken from observable markets where possible, but where this is not feasible, a degree of judgement is required in establishing fair values (Note 28).
Measurement of fair value of investment propertiesThe fair value of investment properties is determined by independent professionally qualified appraisers. Fair value is determined using a combination of the internal capitalisation method (also known as discounted future cash flow method) and the sales comparison method.
The Group performs valuation of its investment properties with a sufficient regularity to ensure that the carrying amount does not differ materially from that which would be determined using fair value at the end of the reporting period. Results of this valuation are presented in Note 11, while valuation inputs and techniques are presented in Note 28. The Group’s properties are spread across the different parts of the country. While the secondary market in Georgia provides adequate market information for fair value measurements for small and medium sized properties, valuation of large properties involves application of various observable and unobservable inputs to determine adjustments to the available comparable sale prices. These estimates and assumptions are based on the best available information, however, actual results could be different.
Allowance for financial assetsIFRS 9 requires management to make a number of judgements, assumptions and estimates that affect the allowance for ECL. Estimates and judgements are based on management’s knowledge and historical experience. A summary of the key judgements made by management is set out below.
Definition of default, credit-impaired and cure (Note 27)The Group’s definition of default is based on quantitative and qualitative criteria. The definition may differ across products. The definition is consistent with the definition used for internal credit risk management purposes and it corresponds with internal financial instrument risk classification rules. A counterparty is classified as defaulted at the latest when payments of interest, principal or fees are overdue for more than 90 days or when bankruptcy, fraud, insolvency proceedings of enforced liquidation have commenced or there is other evidence that payment obligations will not be fully met. The determination of whether a Financial Instrument is credit-impaired focuses on default risk, without taking into consideration the effects of credit risk mitigations such as collateral or guarantees.
An instrument is classified as credit-impaired if the counterparty is defaulted and/or the instrument is POCI.
Once the financial asset is classified as credit-impaired (except for POCIs) it remains as such unless all past due amounts have been rectified or there is general evidence of credit recovery. A minimum period of six consecutive months’ payment is applied as exit criteria to Financial Assets restructured due to credit risk other than corporate loan portfolio and debt instruments measured at FVOCI where exit criteria are determined as exit from bankruptcy or insolvency status, disappearance of liquidity problems or existence of other general evidence of credit recovery assessed on individual basis. For other credit-impaired Financial Instruments, exit criteria is determined as repayment of the entire overdue amount other than through refinancing or foreclosure.
Once a credit-impaired financial asset meets default exit criteria, it remains in Stage 2 at least for the next 12 consecutive months. After 12 consecutive payments it is transferred to Stage 1 if its credit risk is not significantly higher than at origination date.
Notes to Consolidated Financial Statements continuedThousands of Georgian Lari
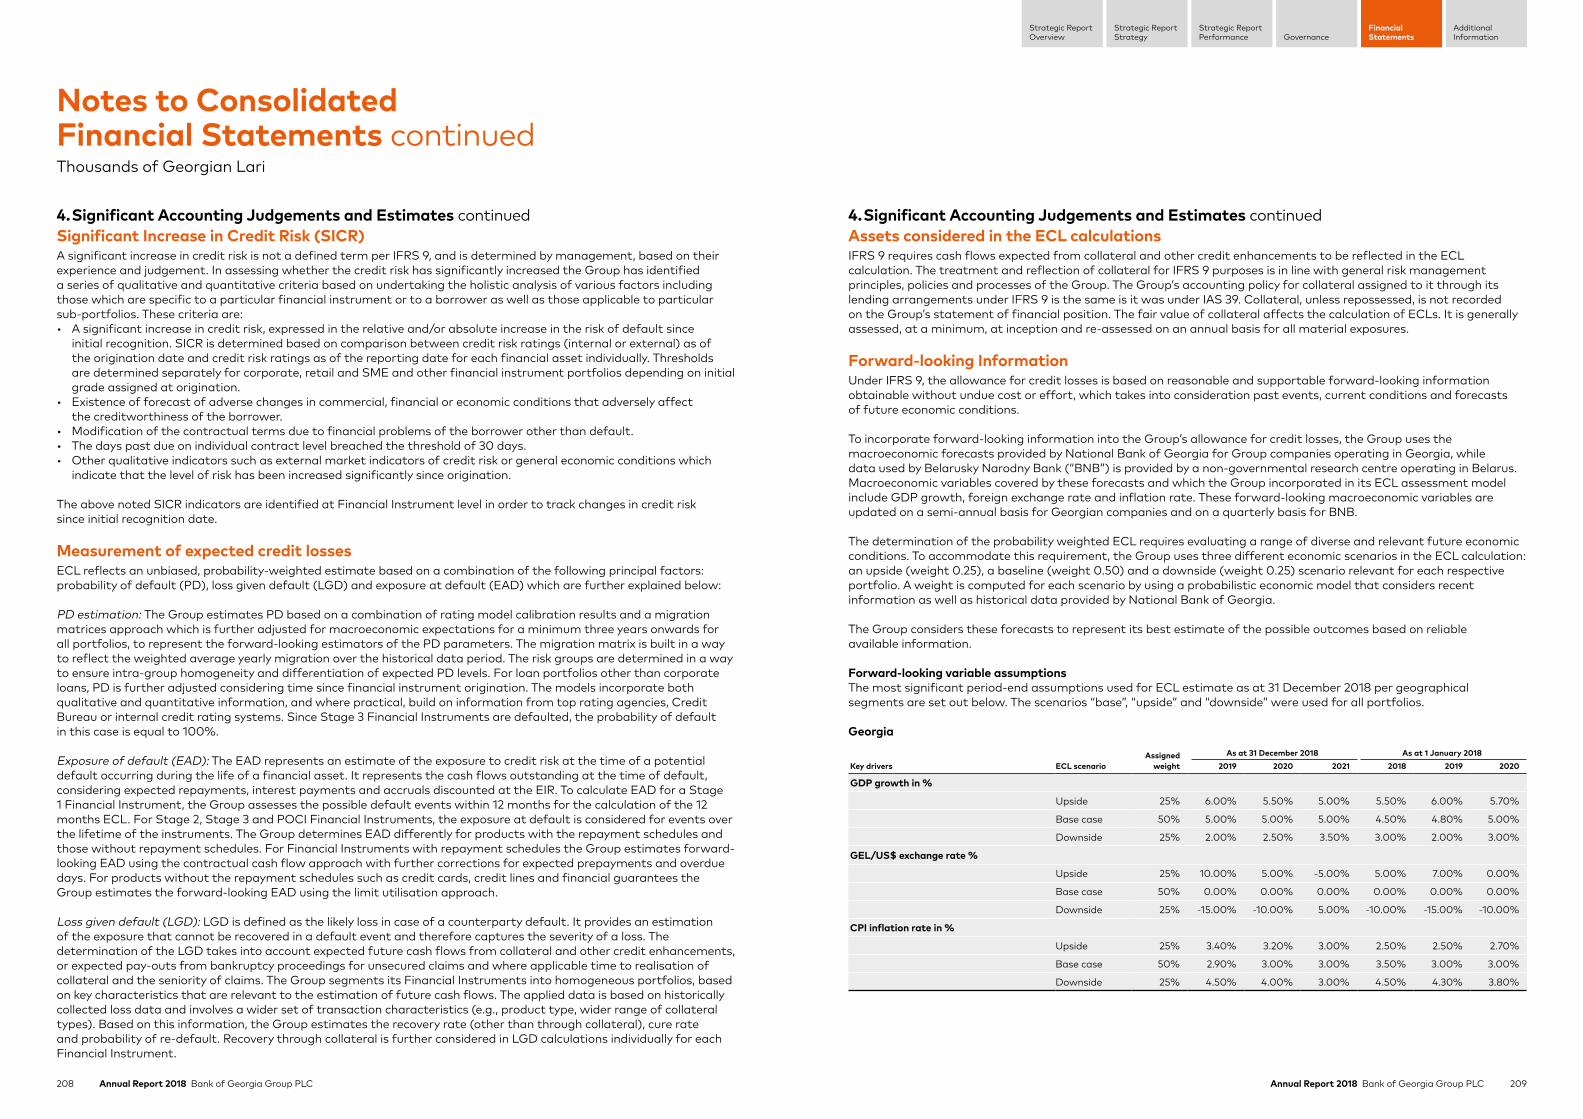
208 Annual Report 2018 Bank of Georgia Group PLC 209Annual Report 2018 Bank of Georgia Group PLC
Strategic ReportStrategy
Strategic ReportPerformance Governance
FinancialStatements
AdditionalInformation
Strategic ReportOverview
4. Significant Accounting Judgements and Estimates continuedSignificant Increase in Credit Risk (SICR)A significant increase in credit risk is not a defined term per IFRS 9, and is determined by management, based on their experience and judgement. In assessing whether the credit risk has significantly increased the Group has identified a series of qualitative and quantitative criteria based on undertaking the holistic analysis of various factors including those which are specific to a particular financial instrument or to a borrower as well as those applicable to particular sub-portfolios. These criteria are:• A significant increase in credit risk, expressed in the relative and/or absolute increase in the risk of default since
initial recognition. SICR is determined based on comparison between credit risk ratings (internal or external) as of the origination date and credit risk ratings as of the reporting date for each financial asset individually. Thresholds are determined separately for corporate, retail and SME and other financial instrument portfolios depending on initial grade assigned at origination.
• Existence of forecast of adverse changes in commercial, financial or economic conditions that adversely affect the creditworthiness of the borrower.
• Modification of the contractual terms due to financial problems of the borrower other than default.• The days past due on individual contract level breached the threshold of 30 days.• Other qualitative indicators such as external market indicators of credit risk or general economic conditions which
indicate that the level of risk has been increased significantly since origination.
The above noted SICR indicators are identified at Financial Instrument level in order to track changes in credit risk since initial recognition date.
Measurement of expected credit lossesECL reflects an unbiased, probability-weighted estimate based on a combination of the following principal factors: probability of default (PD), loss given default (LGD) and exposure at default (EAD) which are further explained below:
PD estimation: The Group estimates PD based on a combination of rating model calibration results and a migration matrices approach which is further adjusted for macroeconomic expectations for a minimum three years onwards for all portfolios, to represent the forward-looking estimators of the PD parameters. The migration matrix is built in a way to reflect the weighted average yearly migration over the historical data period. The risk groups are determined in a way to ensure intra-group homogeneity and differentiation of expected PD levels. For loan portfolios other than corporate loans, PD is further adjusted considering time since financial instrument origination. The models incorporate both qualitative and quantitative information, and where practical, build on information from top rating agencies, Credit Bureau or internal credit rating systems. Since Stage 3 Financial Instruments are defaulted, the probability of default in this case is equal to 100%.
Exposure of default (EAD): The EAD represents an estimate of the exposure to credit risk at the time of a potential default occurring during the life of a financial asset. It represents the cash flows outstanding at the time of default, considering expected repayments, interest payments and accruals discounted at the EIR. To calculate EAD for a Stage 1 Financial Instrument, the Group assesses the possible default events within 12 months for the calculation of the 12 months ECL. For Stage 2, Stage 3 and POCI Financial Instruments, the exposure at default is considered for events over the lifetime of the instruments. The Group determines EAD differently for products with the repayment schedules and those without repayment schedules. For Financial Instruments with repayment schedules the Group estimates forward-looking EAD using the contractual cash flow approach with further corrections for expected prepayments and overdue days. For products without the repayment schedules such as credit cards, credit lines and financial guarantees the Group estimates the forward-looking EAD using the limit utilisation approach.
Loss given default (LGD): LGD is defined as the likely loss in case of a counterparty default. It provides an estimation of the exposure that cannot be recovered in a default event and therefore captures the severity of a loss. The determination of the LGD takes into account expected future cash flows from collateral and other credit enhancements, or expected pay-outs from bankruptcy proceedings for unsecured claims and where applicable time to realisation of collateral and the seniority of claims. The Group segments its Financial Instruments into homogeneous portfolios, based on key characteristics that are relevant to the estimation of future cash flows. The applied data is based on historically collected loss data and involves a wider set of transaction characteristics (e.g., product type, wider range of collateral types). Based on this information, the Group estimates the recovery rate (other than through collateral), cure rate and probability of re-default. Recovery through collateral is further considered in LGD calculations individually for each Financial Instrument.
4. Significant Accounting Judgements and Estimates continuedAssets considered in the ECL calculationsIFRS 9 requires cash flows expected from collateral and other credit enhancements to be reflected in the ECL calculation. The treatment and reflection of collateral for IFRS 9 purposes is in line with general risk management principles, policies and processes of the Group. The Group’s accounting policy for collateral assigned to it through its lending arrangements under IFRS 9 is the same is it was under IAS 39. Collateral, unless repossessed, is not recorded on the Group’s statement of financial position. The fair value of collateral affects the calculation of ECLs. It is generally assessed, at a minimum, at inception and re-assessed on an annual basis for all material exposures.
Forward-looking InformationUnder IFRS 9, the allowance for credit losses is based on reasonable and supportable forward-looking information obtainable without undue cost or effort, which takes into consideration past events, current conditions and forecasts of future economic conditions.
To incorporate forward-looking information into the Group’s allowance for credit losses, the Group uses the macroeconomic forecasts provided by National Bank of Georgia for Group companies operating in Georgia, while data used by Belarusky Narodny Bank (“BNB”) is provided by a non-governmental research centre operating in Belarus. Macroeconomic variables covered by these forecasts and which the Group incorporated in its ECL assessment model include GDP growth, foreign exchange rate and inflation rate. These forward-looking macroeconomic variables are updated on a semi-annual basis for Georgian companies and on a quarterly basis for BNB.
The determination of the probability weighted ECL requires evaluating a range of diverse and relevant future economic conditions. To accommodate this requirement, the Group uses three different economic scenarios in the ECL calculation: an upside (weight 0.25), a baseline (weight 0.50) and a downside (weight 0.25) scenario relevant for each respective portfolio. A weight is computed for each scenario by using a probabilistic economic model that considers recent information as well as historical data provided by National Bank of Georgia.
The Group considers these forecasts to represent its best estimate of the possible outcomes based on reliable available information.
Forward-looking variable assumptionsThe most significant period-end assumptions used for ECL estimate as at 31 December 2018 per geographical segments are set out below. The scenarios “base”, “upside” and “downside” were used for all portfolios.
Georgia
Key drivers ECL scenarioAssigned
weightAs at 31 December 2018 As at 1 January 2018
2019 2020 2021 2018 2019 2020
GDP growth in %
Upside 25% 6.00% 5.50% 5.00% 5.50% 6.00% 5.70%
Base case 50% 5.00% 5.00% 5.00% 4.50% 4.80% 5.00%
Downside 25% 2.00% 2.50% 3.50% 3.00% 2.00% 3.00%
GEL/US$ exchange rate %
Upside 25% 10.00% 5.00% -5.00% 5.00% 7.00% 0.00%
Base case 50% 0.00% 0.00% 0.00% 0.00% 0.00% 0.00%
Downside 25% -15.00% -10.00% 5.00% -10.00% -15.00% -10.00%
CPI inflation rate in %
Upside 25% 3.40% 3.20% 3.00% 2.50% 2.50% 2.70%
Base case 50% 2.90% 3.00% 3.00% 3.50% 3.00% 3.00%
Downside 25% 4.50% 4.00% 3.00% 4.50% 4.30% 3.80%
Notes to Consolidated Financial Statements continuedThousands of Georgian Lari
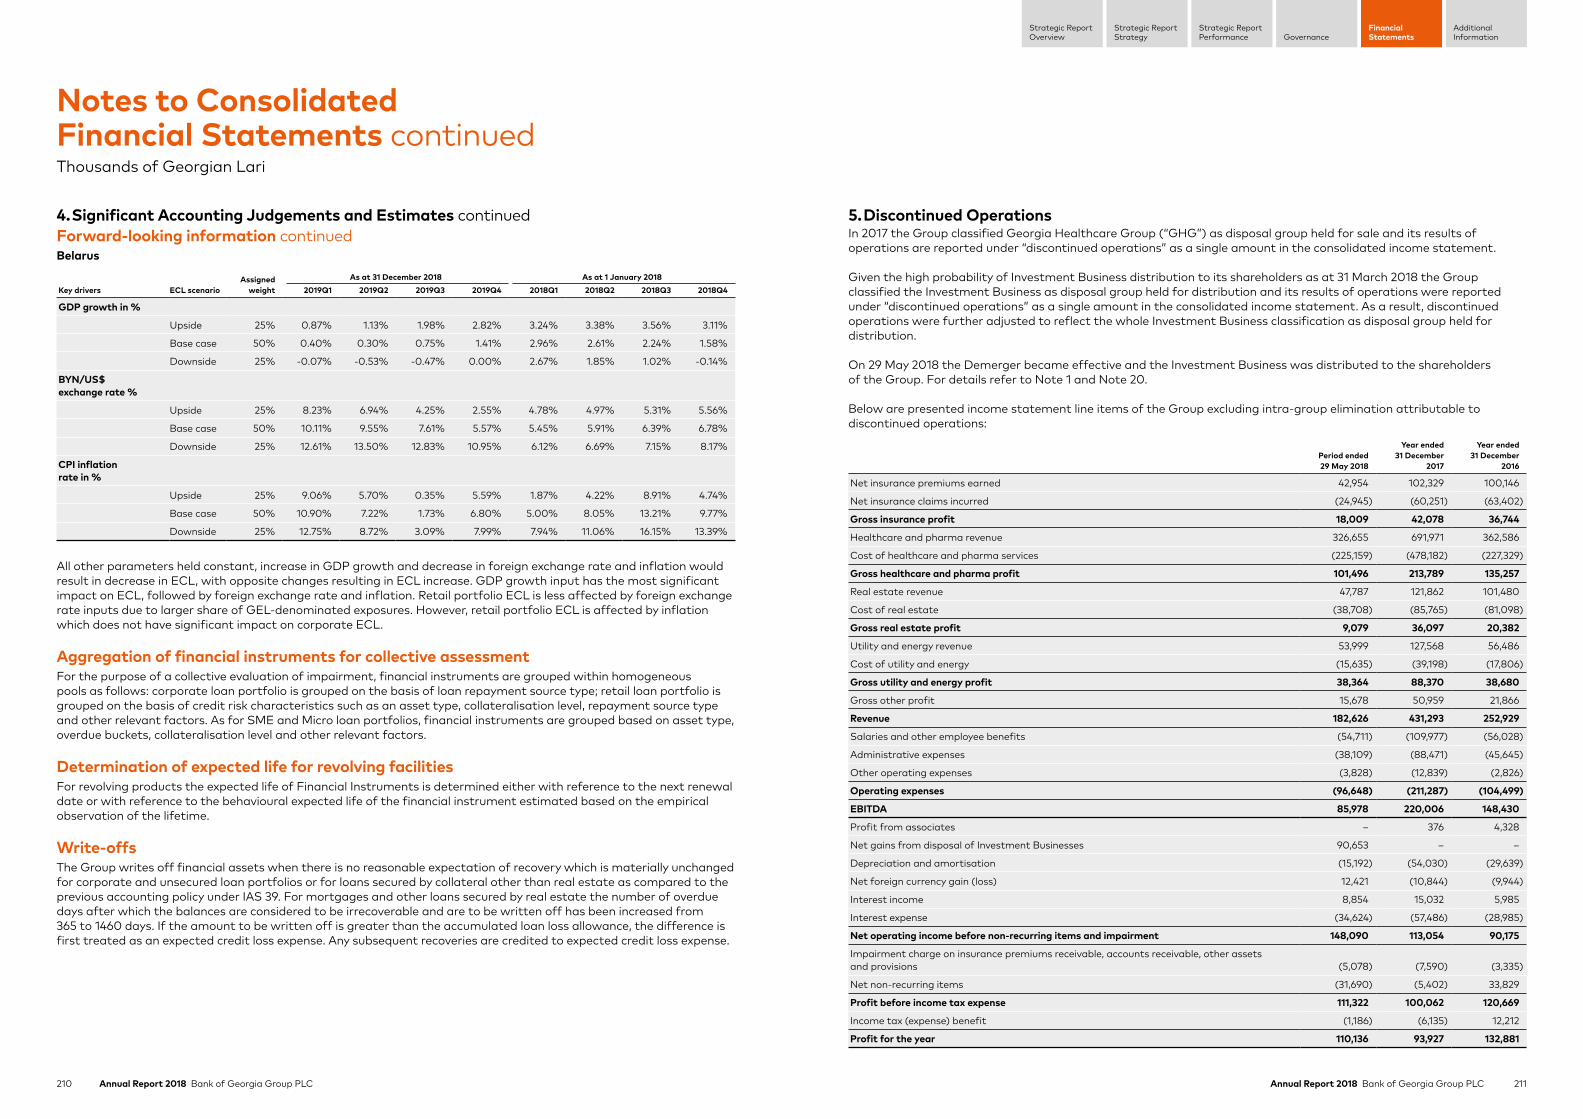
210 Annual Report 2018 Bank of Georgia Group PLC 211Annual Report 2018 Bank of Georgia Group PLC
Strategic ReportStrategy
Strategic ReportPerformance Governance
FinancialStatements
AdditionalInformation
Strategic ReportOverview
4. Significant Accounting Judgements and Estimates continuedForward-looking information continuedBelarus
Key drivers ECL scenarioAssigned
weightAs at 31 December 2018 As at 1 January 2018
2019Q1 2019Q2 2019Q3 2019Q4 2018Q1 2018Q2 2018Q3 2018Q4
GDP growth in %
Upside 25% 0.87% 1.13% 1.98% 2.82% 3.24% 3.38% 3.56% 3.11%
Base case 50% 0.40% 0.30% 0.75% 1.41% 2.96% 2.61% 2.24% 1.58%
Downside 25% -0.07% -0.53% -0.47% 0.00% 2.67% 1.85% 1.02% -0.14%
BYN/US$ exchange rate %
Upside 25% 8.23% 6.94% 4.25% 2.55% 4.78% 4.97% 5.31% 5.56%
Base case 50% 10.11% 9.55% 7.61% 5.57% 5.45% 5.91% 6.39% 6.78%
Downside 25% 12.61% 13.50% 12.83% 10.95% 6.12% 6.69% 7.15% 8.17%
CPI inflation rate in %
Upside 25% 9.06% 5.70% 0.35% 5.59% 1.87% 4.22% 8.91% 4.74%
Base case 50% 10.90% 7.22% 1.73% 6.80% 5.00% 8.05% 13.21% 9.77%
Downside 25% 12.75% 8.72% 3.09% 7.99% 7.94% 11.06% 16.15% 13.39%
All other parameters held constant, increase in GDP growth and decrease in foreign exchange rate and inflation would result in decrease in ECL, with opposite changes resulting in ECL increase. GDP growth input has the most significant impact on ECL, followed by foreign exchange rate and inflation. Retail portfolio ECL is less affected by foreign exchange rate inputs due to larger share of GEL-denominated exposures. However, retail portfolio ECL is affected by inflation which does not have significant impact on corporate ECL.
Aggregation of financial instruments for collective assessmentFor the purpose of a collective evaluation of impairment, financial instruments are grouped within homogeneous pools as follows: corporate loan portfolio is grouped on the basis of loan repayment source type; retail loan portfolio is grouped on the basis of credit risk characteristics such as an asset type, collateralisation level, repayment source type and other relevant factors. As for SME and Micro loan portfolios, financial instruments are grouped based on asset type, overdue buckets, collateralisation level and other relevant factors.
Determination of expected life for revolving facilitiesFor revolving products the expected life of Financial Instruments is determined either with reference to the next renewal date or with reference to the behavioural expected life of the financial instrument estimated based on the empirical observation of the lifetime.
Write-offsThe Group writes off financial assets when there is no reasonable expectation of recovery which is materially unchanged for corporate and unsecured loan portfolios or for loans secured by collateral other than real estate as compared to the previous accounting policy under IAS 39. For mortgages and other loans secured by real estate the number of overdue days after which the balances are considered to be irrecoverable and are to be written off has been increased from 365 to 1460 days. If the amount to be written off is greater than the accumulated loan loss allowance, the difference is first treated as an expected credit loss expense. Any subsequent recoveries are credited to expected credit loss expense.
5. Discontinued OperationsIn 2017 the Group classified Georgia Healthcare Group (“GHG”) as disposal group held for sale and its results of operations are reported under “discontinued operations” as a single amount in the consolidated income statement.
Given the high probability of Investment Business distribution to its shareholders as at 31 March 2018 the Group classified the Investment Business as disposal group held for distribution and its results of operations were reported under “discontinued operations” as a single amount in the consolidated income statement. As a result, discontinued operations were further adjusted to reflect the whole Investment Business classification as disposal group held for distribution.
On 29 May 2018 the Demerger became effective and the Investment Business was distributed to the shareholders of the Group. For details refer to Note 1 and Note 20.
Below are presented income statement line items of the Group excluding intra-group elimination attributable to discontinued operations:
Period ended 29 May 2018
Year ended 31 December
2017
Year ended 31 December
2016
Net insurance premiums earned 42,954 102,329 100,146
Net insurance claims incurred (24,945) (60,251) (63,402)
Gross insurance profit 18,009 42,078 36,744
Healthcare and pharma revenue 326,655 691,971 362,586
Cost of healthcare and pharma services (225,159) (478,182) (227,329)
Gross healthcare and pharma profit 101,496 213,789 135,257
Real estate revenue 47,787 121,862 101,480
Cost of real estate (38,708) (85,765) (81,098)
Gross real estate profit 9,079 36,097 20,382
Utility and energy revenue 53,999 127,568 56,486
Cost of utility and energy (15,635) (39,198) (17,806)
Gross utility and energy profit 38,364 88,370 38,680
Gross other profit 15,678 50,959 21,866
Revenue 182,626 431,293 252,929
Salaries and other employee benefits (54,711) (109,977) (56,028)
Administrative expenses (38,109) (88,471) (45,645)
Other operating expenses (3,828) (12,839) (2,826)
Operating expenses (96,648) (211,287) (104,499)
EBITDA 85,978 220,006 148,430
Profit from associates – 376 4,328
Net gains from disposal of Investment Businesses 90,653 – –
Depreciation and amortisation (15,192) (54,030) (29,639)
Net foreign currency gain (loss) 12,421 (10,844) (9,944)
Interest income 8,854 15,032 5,985
Interest expense (34,624) (57,486) (28,985)
Net operating income before non-recurring items and impairment 148,090 113,054 90,175
Impairment charge on insurance premiums receivable, accounts receivable, other assets and provisions (5,078) (7,590) (3,335)
Net non-recurring items (31,690) (5,402) 33,829
Profit before income tax expense 111,322 100,062 120,669
Income tax (expense) benefit (1,186) (6,135) 12,212
Profit for the year 110,136 93,927 132,881
Notes to Consolidated Financial Statements continuedThousands of Georgian Lari
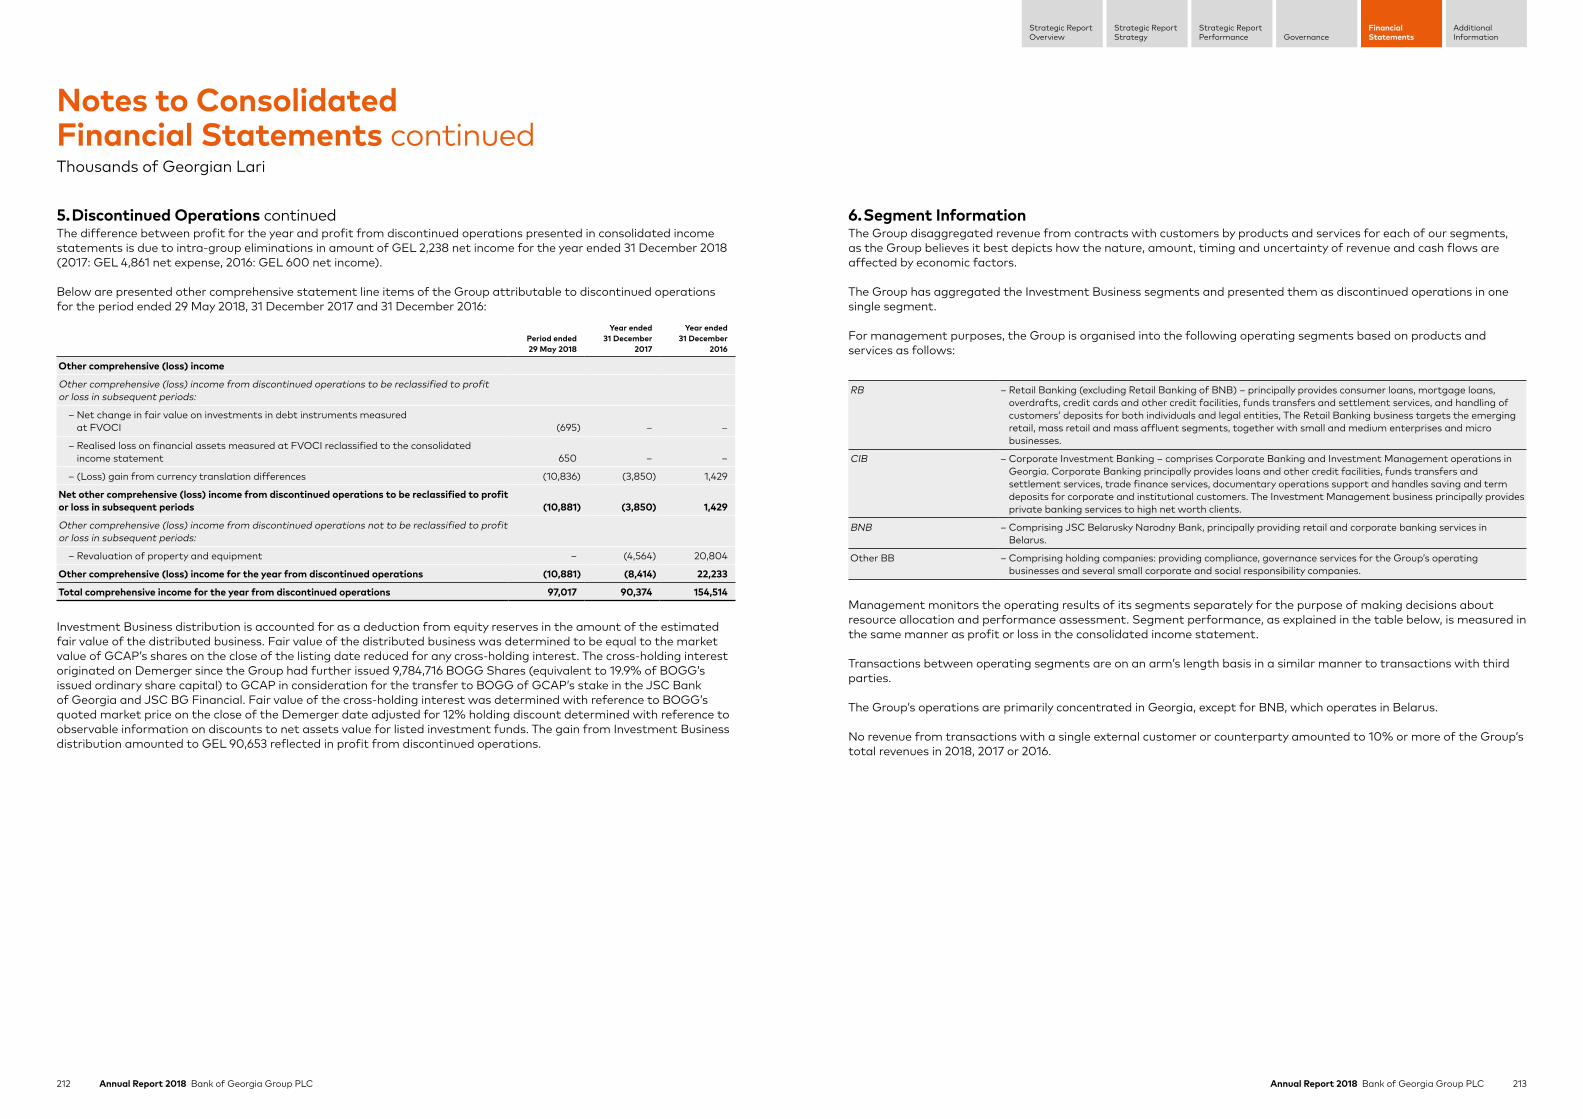
212 Annual Report 2018 Bank of Georgia Group PLC 213Annual Report 2018 Bank of Georgia Group PLC
Strategic ReportStrategy
Strategic ReportPerformance Governance
FinancialStatements
AdditionalInformation
Strategic ReportOverview
5. Discontinued Operations continuedThe difference between profit for the year and profit from discontinued operations presented in consolidated income statements is due to intra-group eliminations in amount of GEL 2,238 net income for the year ended 31 December 2018 (2017: GEL 4,861 net expense, 2016: GEL 600 net income).
Below are presented other comprehensive statement line items of the Group attributable to discontinued operations for the period ended 29 May 2018, 31 December 2017 and 31 December 2016:
Period ended 29 May 2018
Year ended 31 December
2017
Year ended 31 December
2016
Other comprehensive (loss) income
Other comprehensive (loss) income from discontinued operations to be reclassified to profit or loss in subsequent periods:
– Net change in fair value on investments in debt instruments measured at FVOCI (695) – –
– Realised loss on financial assets measured at FVOCI reclassified to the consolidated income statement 650 – –
– (Loss) gain from currency translation differences (10,836) (3,850) 1,429
Net other comprehensive (loss) income from discontinued operations to be reclassified to profit or loss in subsequent periods (10,881) (3,850) 1,429
Other comprehensive (loss) income from discontinued operations not to be reclassified to profit or loss in subsequent periods:
– Revaluation of property and equipment – (4,564) 20,804
Other comprehensive (loss) income for the year from discontinued operations (10,881) (8,414) 22,233
Total comprehensive income for the year from discontinued operations 97,017 90,374 154,514
Investment Business distribution is accounted for as a deduction from equity reserves in the amount of the estimated fair value of the distributed business. Fair value of the distributed business was determined to be equal to the market value of GCAP’s shares on the close of the listing date reduced for any cross-holding interest. The cross-holding interest originated on Demerger since the Group had further issued 9,784,716 BOGG Shares (equivalent to 19.9% of BOGG’s issued ordinary share capital) to GCAP in consideration for the transfer to BOGG of GCAP’s stake in the JSC Bank of Georgia and JSC BG Financial. Fair value of the cross-holding interest was determined with reference to BOGG’s quoted market price on the close of the Demerger date adjusted for 12% holding discount determined with reference to observable information on discounts to net assets value for listed investment funds. The gain from Investment Business distribution amounted to GEL 90,653 reflected in profit from discontinued operations.
6. Segment InformationThe Group disaggregated revenue from contracts with customers by products and services for each of our segments, as the Group believes it best depicts how the nature, amount, timing and uncertainty of revenue and cash flows are affected by economic factors.
The Group has aggregated the Investment Business segments and presented them as discontinued operations in one single segment.
For management purposes, the Group is organised into the following operating segments based on products and services as follows:
RB – Retail Banking (excluding Retail Banking of BNB) – principally provides consumer loans, mortgage loans, overdrafts, credit cards and other credit facilities, funds transfers and settlement services, and handling of customers’ deposits for both individuals and legal entities, The Retail Banking business targets the emerging retail, mass retail and mass affluent segments, together with small and medium enterprises and micro businesses.
CIB – Corporate Investment Banking – comprises Corporate Banking and Investment Management operations in Georgia. Corporate Banking principally provides loans and other credit facilities, funds transfers and settlement services, trade finance services, documentary operations support and handles saving and term deposits for corporate and institutional customers. The Investment Management business principally provides private banking services to high net worth clients.
BNB – Comprising JSC Belarusky Narodny Bank, principally providing retail and corporate banking services in Belarus.
Other BB – Comprising holding companies: providing compliance, governance services for the Group’s operating businesses and several small corporate and social responsibility companies.
Management monitors the operating results of its segments separately for the purpose of making decisions about resource allocation and performance assessment. Segment performance, as explained in the table below, is measured in the same manner as profit or loss in the consolidated income statement.
Transactions between operating segments are on an arm’s length basis in a similar manner to transactions with third parties.
The Group’s operations are primarily concentrated in Georgia, except for BNB, which operates in Belarus.
No revenue from transactions with a single external customer or counterparty amounted to 10% or more of the Group’s total revenues in 2018, 2017 or 2016.
Notes to Consolidated Financial Statements continuedThousands of Georgian Lari
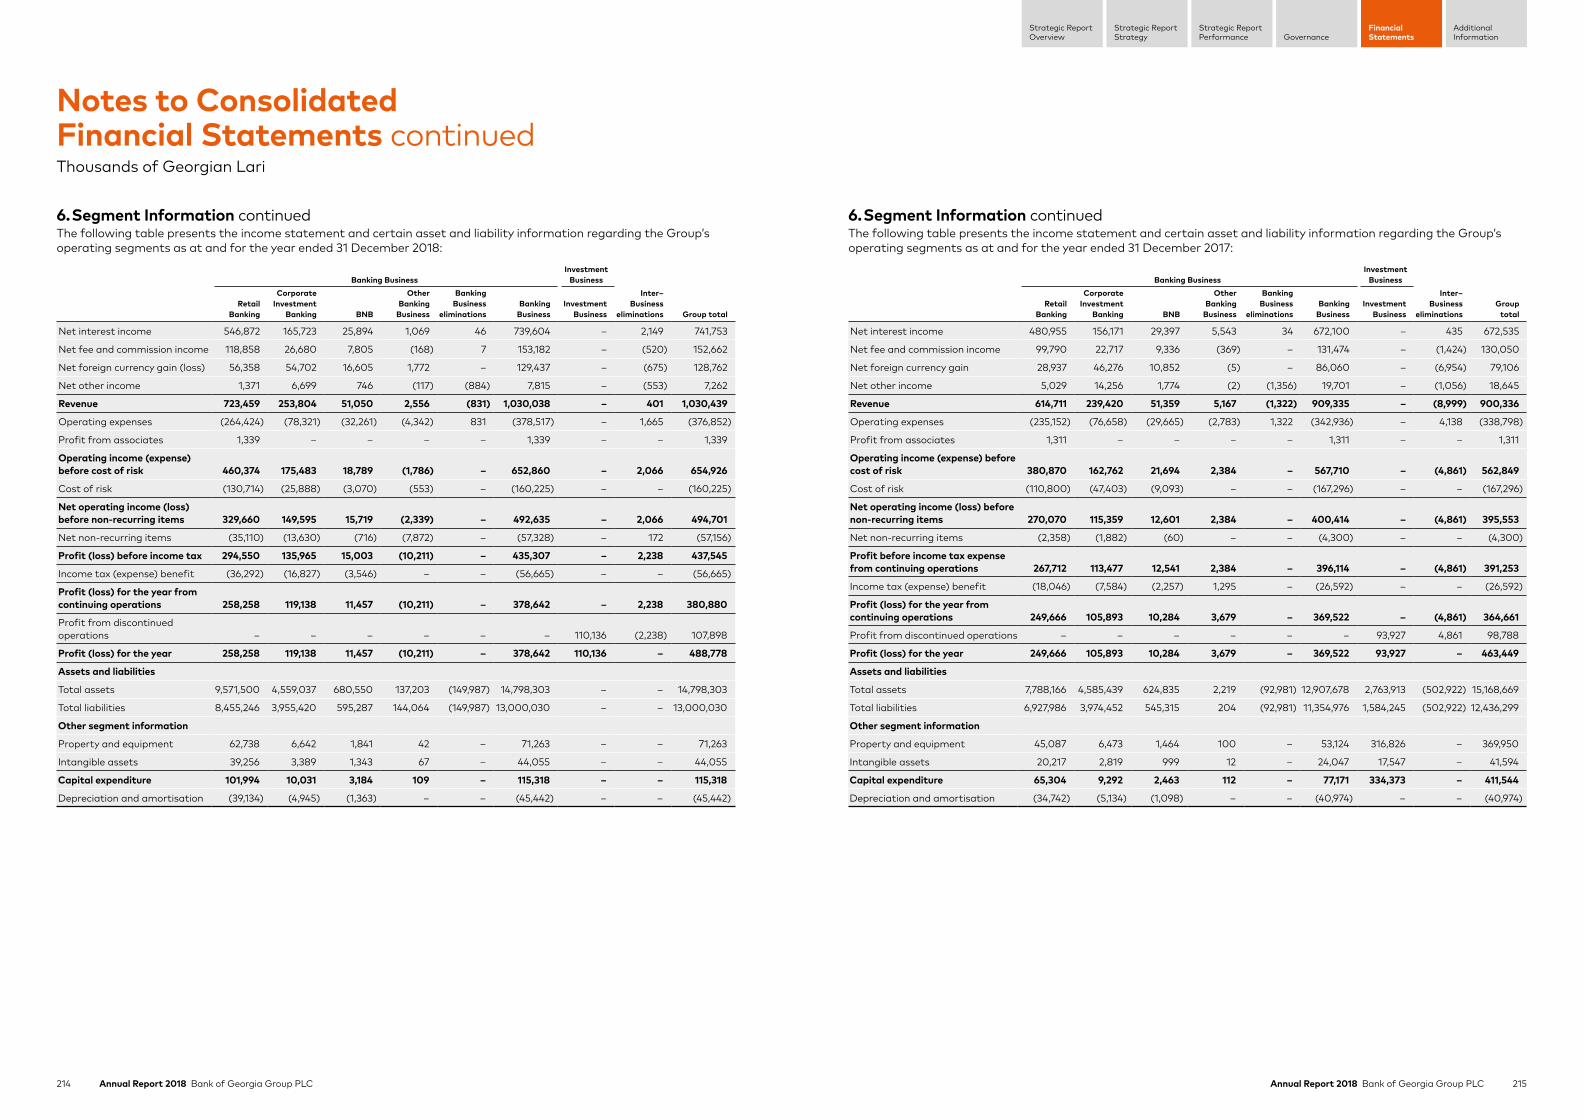
214 Annual Report 2018 Bank of Georgia Group PLC 215Annual Report 2018 Bank of Georgia Group PLC
Strategic ReportStrategy
Strategic ReportPerformance Governance
FinancialStatements
AdditionalInformation
Strategic ReportOverview
6. Segment Information continuedThe following table presents the income statement and certain asset and liability information regarding the Group’s operating segments as at and for the year ended 31 December 2018:
Banking BusinessInvestment
BusinessInter–
Business eliminations Group total
Retail Banking
Corporate Investment
Banking BNB
OtherBanking
Business
Banking Business
eliminationsBanking
BusinessInvestment
Business
Net interest income 546,872 165,723 25,894 1,069 46 739,604 – 2,149 741,753
Net fee and commission income 118,858 26,680 7,805 (168) 7 153,182 – (520) 152,662
Net foreign currency gain (loss) 56,358 54,702 16,605 1,772 – 129,437 – (675) 128,762
Net other income 1,371 6,699 746 (117) (884) 7,815 – (553) 7,262
Revenue 723,459 253,804 51,050 2,556 (831) 1,030,038 – 401 1,030,439
Operating expenses (264,424) (78,321) (32,261) (4,342) 831 (378,517) – 1,665 (376,852)
Profit from associates 1,339 – – – – 1,339 – – 1,339
Operating income (expense) before cost of risk 460,374 175,483 18,789 (1,786) – 652,860 – 2,066 654,926
Cost of risk (130,714) (25,888) (3,070) (553) – (160,225) – – (160,225)
Net operating income (loss) before non-recurring items 329,660 149,595 15,719 (2,339) – 492,635 – 2,066 494,701
Net non-recurring items (35,110) (13,630) (716) (7,872) – (57,328) – 172 (57,156)
Profit (loss) before income tax 294,550 135,965 15,003 (10,211) – 435,307 – 2,238 437,545
Income tax (expense) benefit (36,292) (16,827) (3,546) – – (56,665) – – (56,665)
Profit (loss) for the year from continuing operations 258,258 119,138 11,457 (10,211) – 378,642 – 2,238 380,880
Profit from discontinued operations – – – – – – 110,136 (2,238) 107,898
Profit (loss) for the year 258,258 119,138 11,457 (10,211) – 378,642 110,136 – 488,778
Assets and liabilities
Total assets 9,571,500 4,559,037 680,550 137,203 (149,987) 14,798,303 – – 14,798,303
Total liabilities 8,455,246 3,955,420 595,287 144,064 (149,987) 13,000,030 – – 13,000,030
Other segment information
Property and equipment 62,738 6,642 1,841 42 – 71,263 – – 71,263
Intangible assets 39,256 3,389 1,343 67 – 44,055 – – 44,055
Capital expenditure 101,994 10,031 3,184 109 – 115,318 – – 115,318
Depreciation and amortisation (39,134) (4,945) (1,363) – – (45,442) – – (45,442)
6. Segment Information continuedThe following table presents the income statement and certain asset and liability information regarding the Group’s operating segments as at and for the year ended 31 December 2017:
Banking BusinessInvestment
BusinessInter–
Business eliminations
Grouptotal
Retail Banking
Corporate Investment
Banking BNB
Other Banking
Business
Banking Business
eliminationsBanking
BusinessInvestment
Business
Net interest income 480,955 156,171 29,397 5,543 34 672,100 – 435 672,535
Net fee and commission income 99,790 22,717 9,336 (369) – 131,474 – (1,424) 130,050
Net foreign currency gain 28,937 46,276 10,852 (5) – 86,060 – (6,954) 79,106
Net other income 5,029 14,256 1,774 (2) (1,356) 19,701 – (1,056) 18,645
Revenue 614,711 239,420 51,359 5,167 (1,322) 909,335 – (8,999) 900,336
Operating expenses (235,152) (76,658) (29,665) (2,783) 1,322 (342,936) – 4,138 (338,798)
Profit from associates 1,311 – – – – 1,311 – – 1,311
Operating income (expense) before cost of risk 380,870 162,762 21,694 2,384 – 567,710 – (4,861) 562,849
Cost of risk (110,800) (47,403) (9,093) – – (167,296) – – (167,296)
Net operating income (loss) before non-recurring items 270,070 115,359 12,601 2,384 – 400,414 – (4,861) 395,553
Net non-recurring items (2,358) (1,882) (60) – – (4,300) – – (4,300)
Profit before income tax expense from continuing operations 267,712 113,477 12,541 2,384 – 396,114 – (4,861) 391,253
Income tax (expense) benefit (18,046) (7,584) (2,257) 1,295 – (26,592) – – (26,592)
Profit (loss) for the year from continuing operations 249,666 105,893 10,284 3,679 – 369,522 – (4,861) 364,661
Profit from discontinued operations – – – – – – 93,927 4,861 98,788
Profit (loss) for the year 249,666 105,893 10,284 3,679 – 369,522 93,927 – 463,449
Assets and liabilities
Total assets 7,788,166 4,585,439 624,835 2,219 (92,981) 12,907,678 2,763,913 (502,922) 15,168,669
Total liabilities 6,927,986 3,974,452 545,315 204 (92,981) 11,354,976 1,584,245 (502,922) 12,436,299
Other segment information
Property and equipment 45,087 6,473 1,464 100 – 53,124 316,826 – 369,950
Intangible assets 20,217 2,819 999 12 – 24,047 17,547 – 41,594
Capital expenditure 65,304 9,292 2,463 112 – 77,171 334,373 – 411,544
Depreciation and amortisation (34,742) (5,134) (1,098) – – (40,974) – – (40,974)
Notes to Consolidated Financial Statements continuedThousands of Georgian Lari
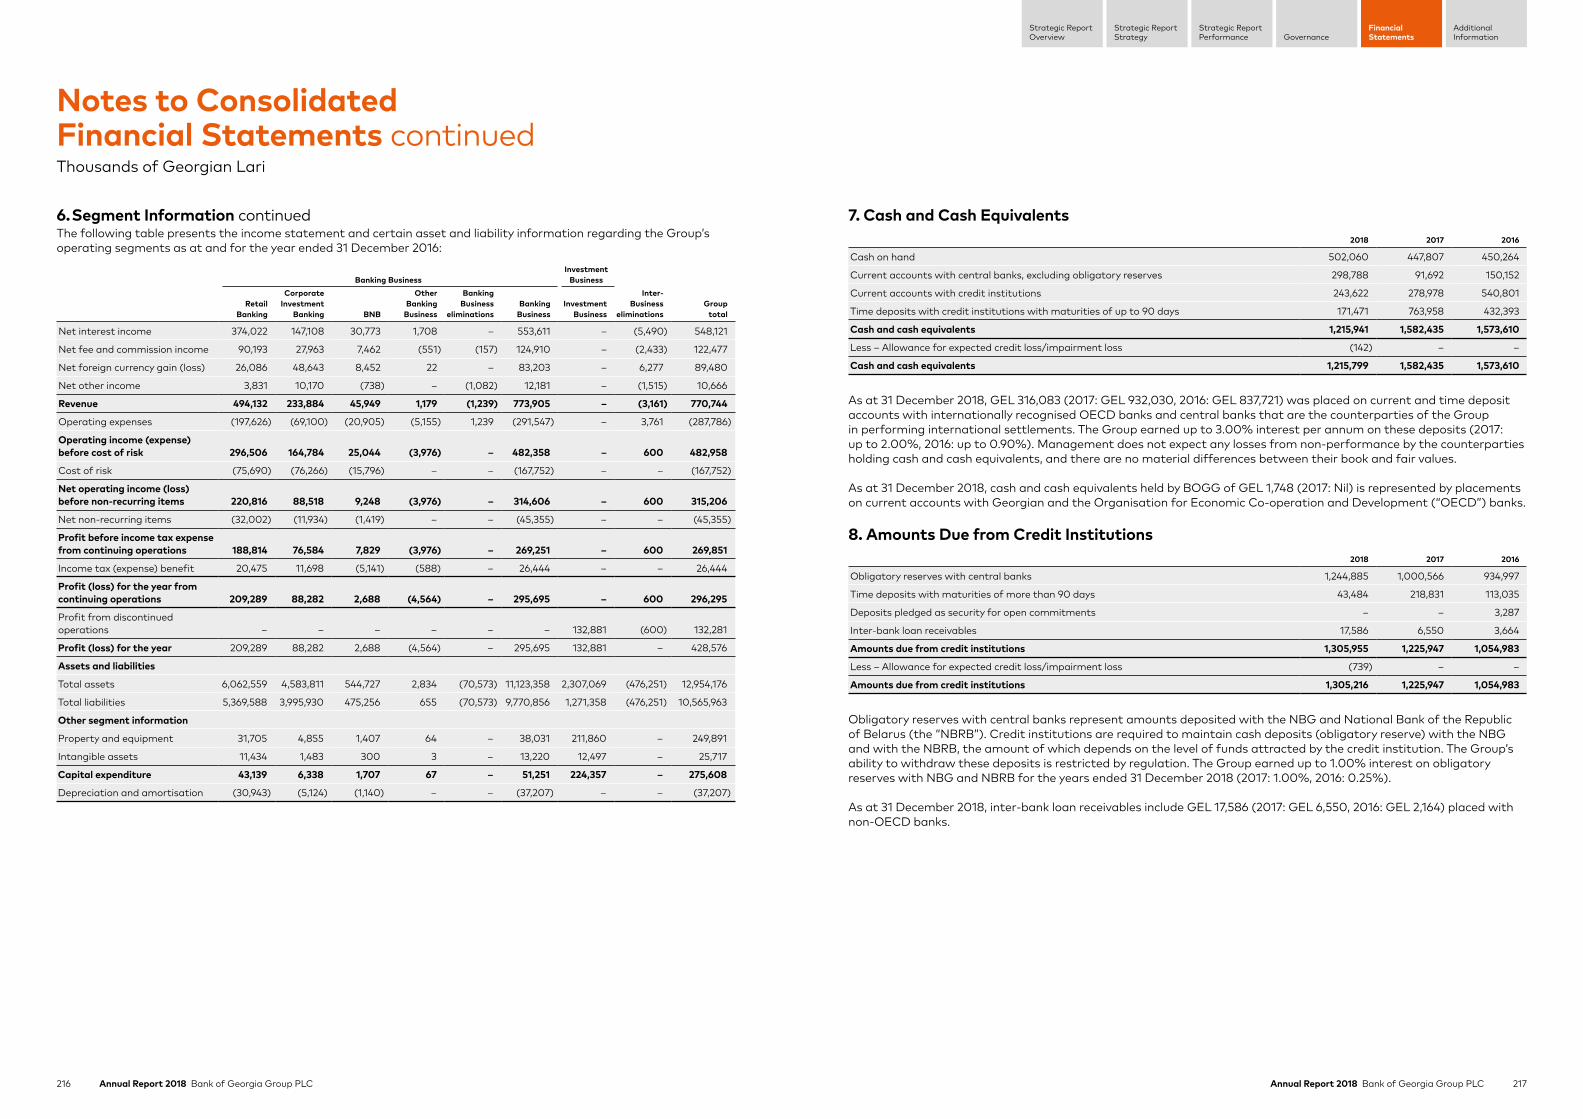
216 Annual Report 2018 Bank of Georgia Group PLC 217Annual Report 2018 Bank of Georgia Group PLC
Strategic ReportStrategy
Strategic ReportPerformance Governance
FinancialStatements
AdditionalInformation
Strategic ReportOverview
6. Segment Information continuedThe following table presents the income statement and certain asset and liability information regarding the Group’s operating segments as at and for the year ended 31 December 2016:
Banking BusinessInvestment
Business
Retail Banking
Corporate Investment
Banking BNB
Other Banking
Business
Banking Business
eliminationsBanking
BusinessInvestment
Business
Inter-Business
eliminationsGroup
total
Net interest income 374,022 147,108 30,773 1,708 – 553,611 – (5,490) 548,121
Net fee and commission income 90,193 27,963 7,462 (551) (157) 124,910 – (2,433) 122,477
Net foreign currency gain (loss) 26,086 48,643 8,452 22 – 83,203 – 6,277 89,480
Net other income 3,831 10,170 (738) – (1,082) 12,181 – (1,515) 10,666
Revenue 494,132 233,884 45,949 1,179 (1,239) 773,905 – (3,161) 770,744
Operating expenses (197,626) (69,100) (20,905) (5,155) 1,239 (291,547) – 3,761 (287,786)
Operating income (expense) before cost of risk 296,506 164,784 25,044 (3,976) – 482,358 – 600 482,958
Cost of risk (75,690) (76,266) (15,796) – – (167,752) – – (167,752)
Net operating income (loss) before non-recurring items 220,816 88,518 9,248 (3,976) – 314,606 – 600 315,206
Net non-recurring items (32,002) (11,934) (1,419) – – (45,355) – – (45,355)
Profit before income tax expense from continuing operations 188,814 76,584 7,829 (3,976) – 269,251 – 600 269,851
Income tax (expense) benefit 20,475 11,698 (5,141) (588) – 26,444 – – 26,444
Profit (loss) for the year from continuing operations 209,289 88,282 2,688 (4,564) – 295,695 – 600 296,295
Profit from discontinued operations – – – – – – 132,881 (600) 132,281
Profit (loss) for the year 209,289 88,282 2,688 (4,564) – 295,695 132,881 – 428,576
Assets and liabilities
Total assets 6,062,559 4,583,811 544,727 2,834 (70,573) 11,123,358 2,307,069 (476,251) 12,954,176
Total liabilities 5,369,588 3,995,930 475,256 655 (70,573) 9,770,856 1,271,358 (476,251) 10,565,963
Other segment information
Property and equipment 31,705 4,855 1,407 64 – 38,031 211,860 – 249,891
Intangible assets 11,434 1,483 300 3 – 13,220 12,497 – 25,717
Capital expenditure 43,139 6,338 1,707 67 – 51,251 224,357 – 275,608
Depreciation and amortisation (30,943) (5,124) (1,140) – – (37,207) – – (37,207)
7. Cash and Cash Equivalents2018 2017 2016
Cash on hand 502,060 447,807 450,264
Current accounts with central banks, excluding obligatory reserves 298,788 91,692 150,152
Current accounts with credit institutions 243,622 278,978 540,801
Time deposits with credit institutions with maturities of up to 90 days 171,471 763,958 432,393
Cash and cash equivalents 1,215,941 1,582,435 1,573,610
Less – Allowance for expected credit loss/impairment loss (142) – –
Cash and cash equivalents 1,215,799 1,582,435 1,573,610
As at 31 December 2018, GEL 316,083 (2017: GEL 932,030, 2016: GEL 837,721) was placed on current and time deposit accounts with internationally recognised OECD banks and central banks that are the counterparties of the Group in performing international settlements. The Group earned up to 3.00% interest per annum on these deposits (2017: up to 2.00%, 2016: up to 0.90%). Management does not expect any losses from non-performance by the counterparties holding cash and cash equivalents, and there are no material differences between their book and fair values.
As at 31 December 2018, cash and cash equivalents held by BOGG of GEL 1,748 (2017: Nil) is represented by placements on current accounts with Georgian and the Organisation for Economic Co-operation and Development (“OECD”) banks.
8. Amounts Due from Credit Institutions2018 2017 2016
Obligatory reserves with central banks 1,244,885 1,000,566 934,997
Time deposits with maturities of more than 90 days 43,484 218,831 113,035
Deposits pledged as security for open commitments – – 3,287
Inter-bank loan receivables 17,586 6,550 3,664
Amounts due from credit institutions 1,305,955 1,225,947 1,054,983
Less – Allowance for expected credit loss/impairment loss (739) – –
Amounts due from credit institutions 1,305,216 1,225,947 1,054,983
Obligatory reserves with central banks represent amounts deposited with the NBG and National Bank of the Republic of Belarus (the “NBRB”). Credit institutions are required to maintain cash deposits (obligatory reserve) with the NBG and with the NBRB, the amount of which depends on the level of funds attracted by the credit institution. The Group’s ability to withdraw these deposits is restricted by regulation. The Group earned up to 1.00% interest on obligatory reserves with NBG and NBRB for the years ended 31 December 2018 (2017: 1.00%, 2016: 0.25%).
As at 31 December 2018, inter-bank loan receivables include GEL 17,586 (2017: GEL 6,550, 2016: GEL 2,164) placed with non-OECD banks.
Notes to Consolidated Financial Statements continuedThousands of Georgian Lari
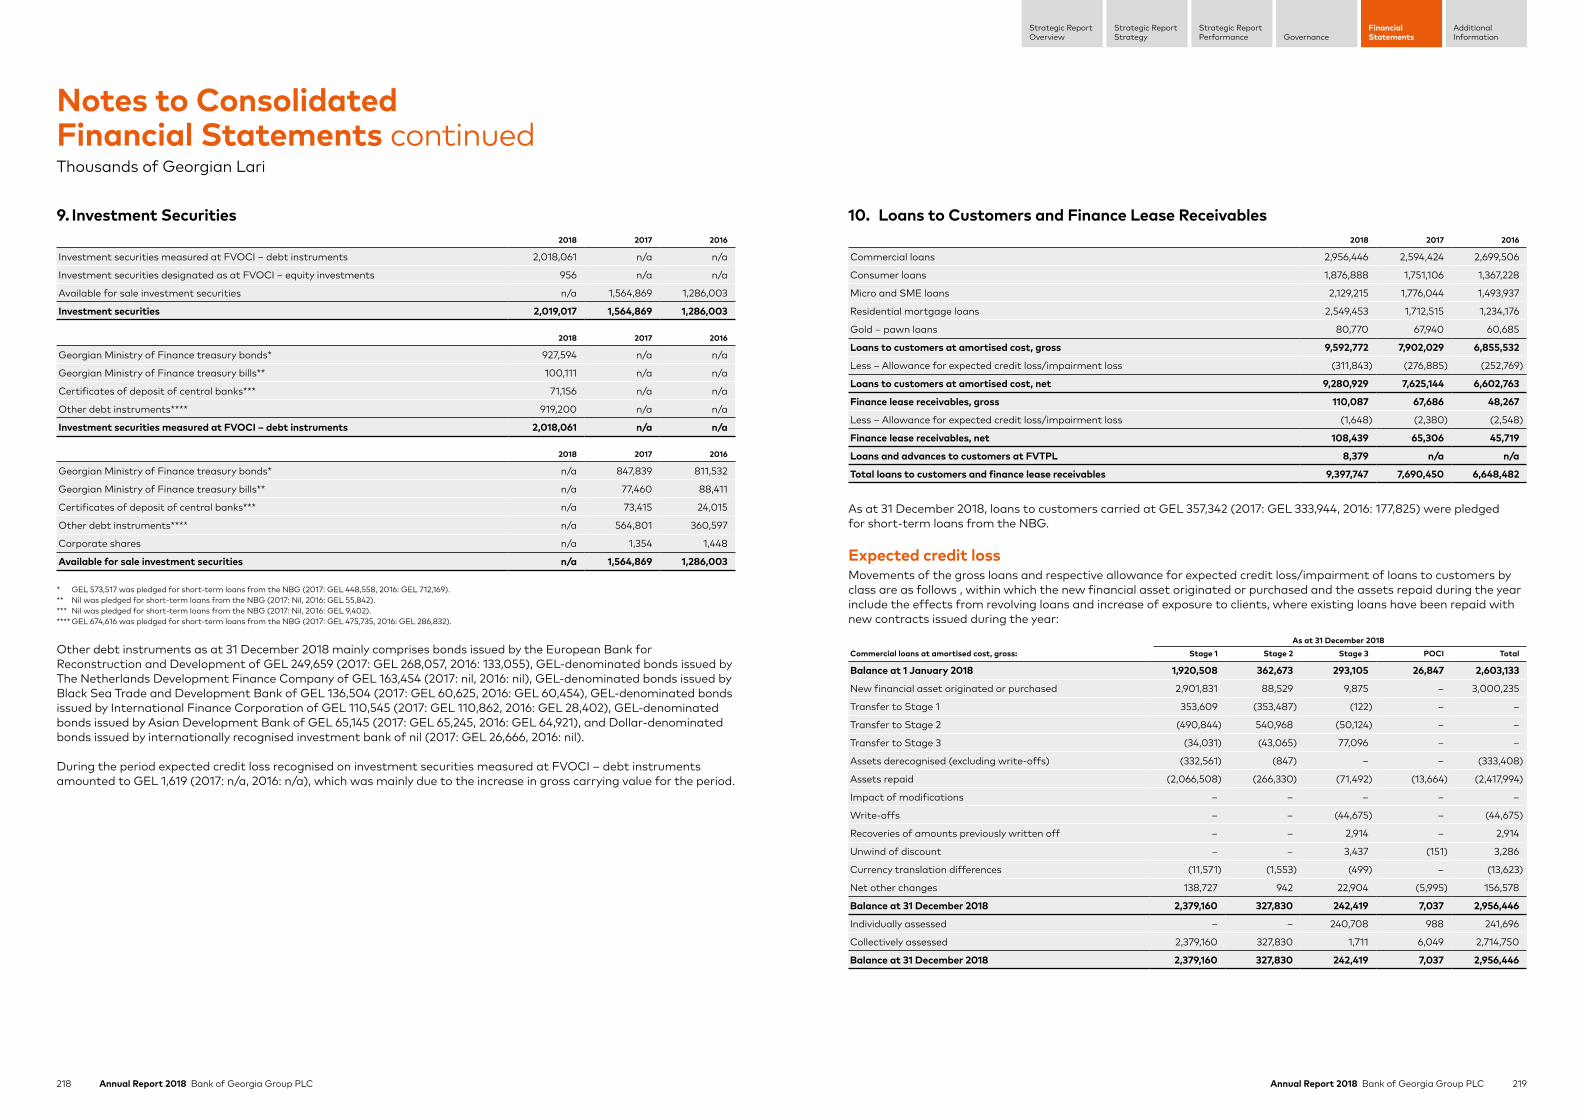
218 Annual Report 2018 Bank of Georgia Group PLC 219Annual Report 2018 Bank of Georgia Group PLC
Strategic ReportStrategy
Strategic ReportPerformance Governance
FinancialStatements
AdditionalInformation
Strategic ReportOverview
9. Investment Securities2018 2017 2016
Investment securities measured at FVOCI – debt instruments 2,018,061 n/a n/a
Investment securities designated as at FVOCI – equity investments 956 n/a n/a
Available for sale investment securities n/a 1,564,869 1,286,003
Investment securities 2,019,017 1,564,869 1,286,003
2018 2017 2016
Georgian Ministry of Finance treasury bonds* 927,594 n/a n/a
Georgian Ministry of Finance treasury bills** 100,111 n/a n/a
Certificates of deposit of central banks*** 71,156 n/a n/a
Other debt instruments**** 919,200 n/a n/a
Investment securities measured at FVOCI – debt instruments 2,018,061 n/a n/a
2018 2017 2016
Georgian Ministry of Finance treasury bonds* n/a 847,839 811,532
Georgian Ministry of Finance treasury bills** n/a 77,460 88,411
Certificates of deposit of central banks*** n/a 73,415 24,015
Other debt instruments**** n/a 564,801 360,597
Corporate shares n/a 1,354 1,448
Available for sale investment securities n/a 1,564,869 1,286,003
* GEL 573,517 was pledged for short-term loans from the NBG (2017: GEL 448,558, 2016: GEL 712,169).** Nil was pledged for short-term loans from the NBG (2017: Nil, 2016: GEL 55,842).*** Nil was pledged for short-term loans from the NBG (2017: Nil, 2016: GEL 9,402).**** GEL 674,616 was pledged for short-term loans from the NBG (2017: GEL 475,735, 2016: GEL 286,832).
Other debt instruments as at 31 December 2018 mainly comprises bonds issued by the European Bank for Reconstruction and Development of GEL 249,659 (2017: GEL 268,057, 2016: 133,055), GEL-denominated bonds issued by The Netherlands Development Finance Company of GEL 163,454 (2017: nil, 2016: nil), GEL-denominated bonds issued by Black Sea Trade and Development Bank of GEL 136,504 (2017: GEL 60,625, 2016: GEL 60,454), GEL-denominated bonds issued by International Finance Corporation of GEL 110,545 (2017: GEL 110,862, 2016: GEL 28,402), GEL-denominated bonds issued by Asian Development Bank of GEL 65,145 (2017: GEL 65,245, 2016: GEL 64,921), and Dollar-denominated bonds issued by internationally recognised investment bank of nil (2017: GEL 26,666, 2016: nil).
During the period expected credit loss recognised on investment securities measured at FVOCI – debt instruments amounted to GEL 1,619 (2017: n/a, 2016: n/a), which was mainly due to the increase in gross carrying value for the period.
10. Loans to Customers and Finance Lease Receivables2018 2017 2016
Commercial loans 2,956,446 2,594,424 2,699,506
Consumer loans 1,876,888 1,751,106 1,367,228
Micro and SME loans 2,129,215 1,776,044 1,493,937
Residential mortgage loans 2,549,453 1,712,515 1,234,176
Gold – pawn loans 80,770 67,940 60,685
Loans to customers at amortised cost, gross 9,592,772 7,902,029 6,855,532
Less – Allowance for expected credit loss/impairment loss (311,843) (276,885) (252,769)
Loans to customers at amortised cost, net 9,280,929 7,625,144 6,602,763
Finance lease receivables, gross 110,087 67,686 48,267
Less – Allowance for expected credit loss/impairment loss (1,648) (2,380) (2,548)
Finance lease receivables, net 108,439 65,306 45,719
Loans and advances to customers at FVTPL 8,379 n/a n/a
Total loans to customers and finance lease receivables 9,397,747 7,690,450 6,648,482
As at 31 December 2018, loans to customers carried at GEL 357,342 (2017: GEL 333,944, 2016: 177,825) were pledged for short-term loans from the NBG.
Expected credit lossMovements of the gross loans and respective allowance for expected credit loss/impairment of loans to customers by class are as follows , within which the new financial asset originated or purchased and the assets repaid during the year include the effects from revolving loans and increase of exposure to clients, where existing loans have been repaid with new contracts issued during the year:
As at 31 December 2018Commercial loans at amortised cost, gross: Stage 1 Stage 2 Stage 3 POCI Total
Balance at 1 January 2018 1,920,508 362,673 293,105 26,847 2,603,133
New financial asset originated or purchased 2,901,831 88,529 9,875 – 3,000,235
Transfer to Stage 1 353,609 (353,487) (122) – –
Transfer to Stage 2 (490,844) 540,968 (50,124) – –
Transfer to Stage 3 (34,031) (43,065) 77,096 – –
Assets derecognised (excluding write-offs) (332,561) (847) – – (333,408)
Assets repaid (2,066,508) (266,330) (71,492) (13,664) (2,417,994)
Impact of modifications – – – – –
Write-offs – – (44,675) – (44,675)
Recoveries of amounts previously written off – – 2,914 – 2,914
Unwind of discount – – 3,437 (151) 3,286
Currency translation differences (11,571) (1,553) (499) – (13,623)
Net other changes 138,727 942 22,904 (5,995) 156,578
Balance at 31 December 2018 2,379,160 327,830 242,419 7,037 2,956,446
Individually assessed – – 240,708 988 241,696
Collectively assessed 2,379,160 327,830 1,711 6,049 2,714,750
Balance at 31 December 2018 2,379,160 327,830 242,419 7,037 2,956,446
Notes to Consolidated Financial Statements continuedThousands of Georgian Lari
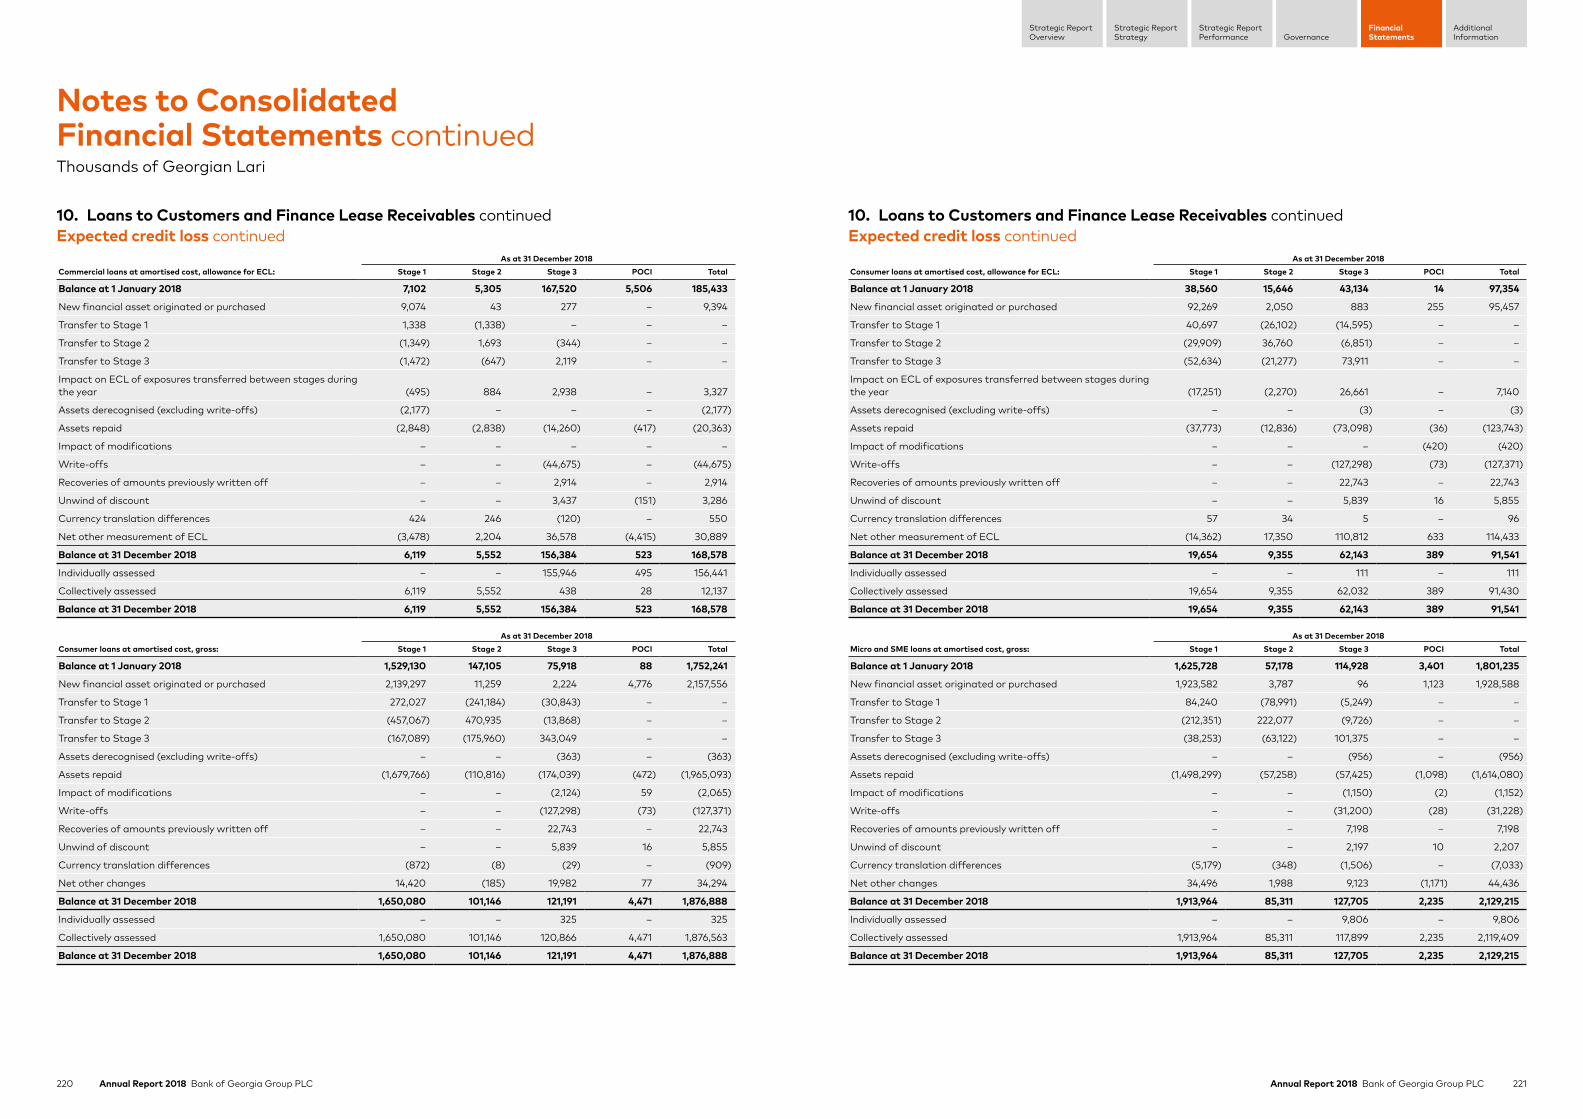
220 Annual Report 2018 Bank of Georgia Group PLC 221Annual Report 2018 Bank of Georgia Group PLC
Strategic ReportStrategy
Strategic ReportPerformance Governance
FinancialStatements
AdditionalInformation
Strategic ReportOverview
10. Loans to Customers and Finance Lease Receivables continuedExpected credit loss continued
As at 31 December 2018Commercial loans at amortised cost, allowance for ECL: Stage 1 Stage 2 Stage 3 POCI Total
Balance at 1 January 2018 7,102 5,305 167,520 5,506 185,433
New financial asset originated or purchased 9,074 43 277 – 9,394
Transfer to Stage 1 1,338 (1,338) – – –
Transfer to Stage 2 (1,349) 1,693 (344) – –
Transfer to Stage 3 (1,472) (647) 2,119 – –
Impact on ECL of exposures transferred between stages during the year (495) 884 2,938 – 3,327
Assets derecognised (excluding write-offs) (2,177) – – – (2,177)
Assets repaid (2,848) (2,838) (14,260) (417) (20,363)
Impact of modifications – – – – –
Write-offs – – (44,675) – (44,675)
Recoveries of amounts previously written off – – 2,914 – 2,914
Unwind of discount – – 3,437 (151) 3,286
Currency translation differences 424 246 (120) – 550
Net other measurement of ECL (3,478) 2,204 36,578 (4,415) 30,889
Balance at 31 December 2018 6,119 5,552 156,384 523 168,578
Individually assessed – – 155,946 495 156,441
Collectively assessed 6,119 5,552 438 28 12,137
Balance at 31 December 2018 6,119 5,552 156,384 523 168,578
As at 31 December 2018Consumer loans at amortised cost, gross: Stage 1 Stage 2 Stage 3 POCI Total
Balance at 1 January 2018 1,529,130 147,105 75,918 88 1,752,241
New financial asset originated or purchased 2,139,297 11,259 2,224 4,776 2,157,556
Transfer to Stage 1 272,027 (241,184) (30,843) – –
Transfer to Stage 2 (457,067) 470,935 (13,868) – –
Transfer to Stage 3 (167,089) (175,960) 343,049 – –
Assets derecognised (excluding write-offs) – – (363) – (363)
Assets repaid (1,679,766) (110,816) (174,039) (472) (1,965,093)
Impact of modifications – – (2,124) 59 (2,065)
Write-offs – – (127,298) (73) (127,371)
Recoveries of amounts previously written off – – 22,743 – 22,743
Unwind of discount – – 5,839 16 5,855
Currency translation differences (872) (8) (29) – (909)
Net other changes 14,420 (185) 19,982 77 34,294
Balance at 31 December 2018 1,650,080 101,146 121,191 4,471 1,876,888
Individually assessed – – 325 – 325
Collectively assessed 1,650,080 101,146 120,866 4,471 1,876,563
Balance at 31 December 2018 1,650,080 101,146 121,191 4,471 1,876,888
10. Loans to Customers and Finance Lease Receivables continuedExpected credit loss continued
As at 31 December 2018Consumer loans at amortised cost, allowance for ECL: Stage 1 Stage 2 Stage 3 POCI Total
Balance at 1 January 2018 38,560 15,646 43,134 14 97,354
New financial asset originated or purchased 92,269 2,050 883 255 95,457
Transfer to Stage 1 40,697 (26,102) (14,595) – –
Transfer to Stage 2 (29,909) 36,760 (6,851) – –
Transfer to Stage 3 (52,634) (21,277) 73,911 – –
Impact on ECL of exposures transferred between stages during the year (17,251) (2,270) 26,661 – 7,140
Assets derecognised (excluding write-offs) – – (3) – (3)
Assets repaid (37,773) (12,836) (73,098) (36) (123,743)
Impact of modifications – – – (420) (420)
Write-offs – – (127,298) (73) (127,371)
Recoveries of amounts previously written off – – 22,743 – 22,743
Unwind of discount – – 5,839 16 5,855
Currency translation differences 57 34 5 – 96
Net other measurement of ECL (14,362) 17,350 110,812 633 114,433
Balance at 31 December 2018 19,654 9,355 62,143 389 91,541
Individually assessed – – 111 – 111
Collectively assessed 19,654 9,355 62,032 389 91,430
Balance at 31 December 2018 19,654 9,355 62,143 389 91,541
As at 31 December 2018Micro and SME loans at amortised cost, gross: Stage 1 Stage 2 Stage 3 POCI Total
Balance at 1 January 2018 1,625,728 57,178 114,928 3,401 1,801,235
New financial asset originated or purchased 1,923,582 3,787 96 1,123 1,928,588
Transfer to Stage 1 84,240 (78,991) (5,249) – –
Transfer to Stage 2 (212,351) 222,077 (9,726) – –
Transfer to Stage 3 (38,253) (63,122) 101,375 – –
Assets derecognised (excluding write-offs) – – (956) – (956)
Assets repaid (1,498,299) (57,258) (57,425) (1,098) (1,614,080)
Impact of modifications – – (1,150) (2) (1,152)
Write-offs – – (31,200) (28) (31,228)
Recoveries of amounts previously written off – – 7,198 – 7,198
Unwind of discount – – 2,197 10 2,207
Currency translation differences (5,179) (348) (1,506) – (7,033)
Net other changes 34,496 1,988 9,123 (1,171) 44,436
Balance at 31 December 2018 1,913,964 85,311 127,705 2,235 2,129,215
Individually assessed – – 9,806 – 9,806
Collectively assessed 1,913,964 85,311 117,899 2,235 2,119,409
Balance at 31 December 2018 1,913,964 85,311 127,705 2,235 2,129,215
Notes to Consolidated Financial Statements continuedThousands of Georgian Lari
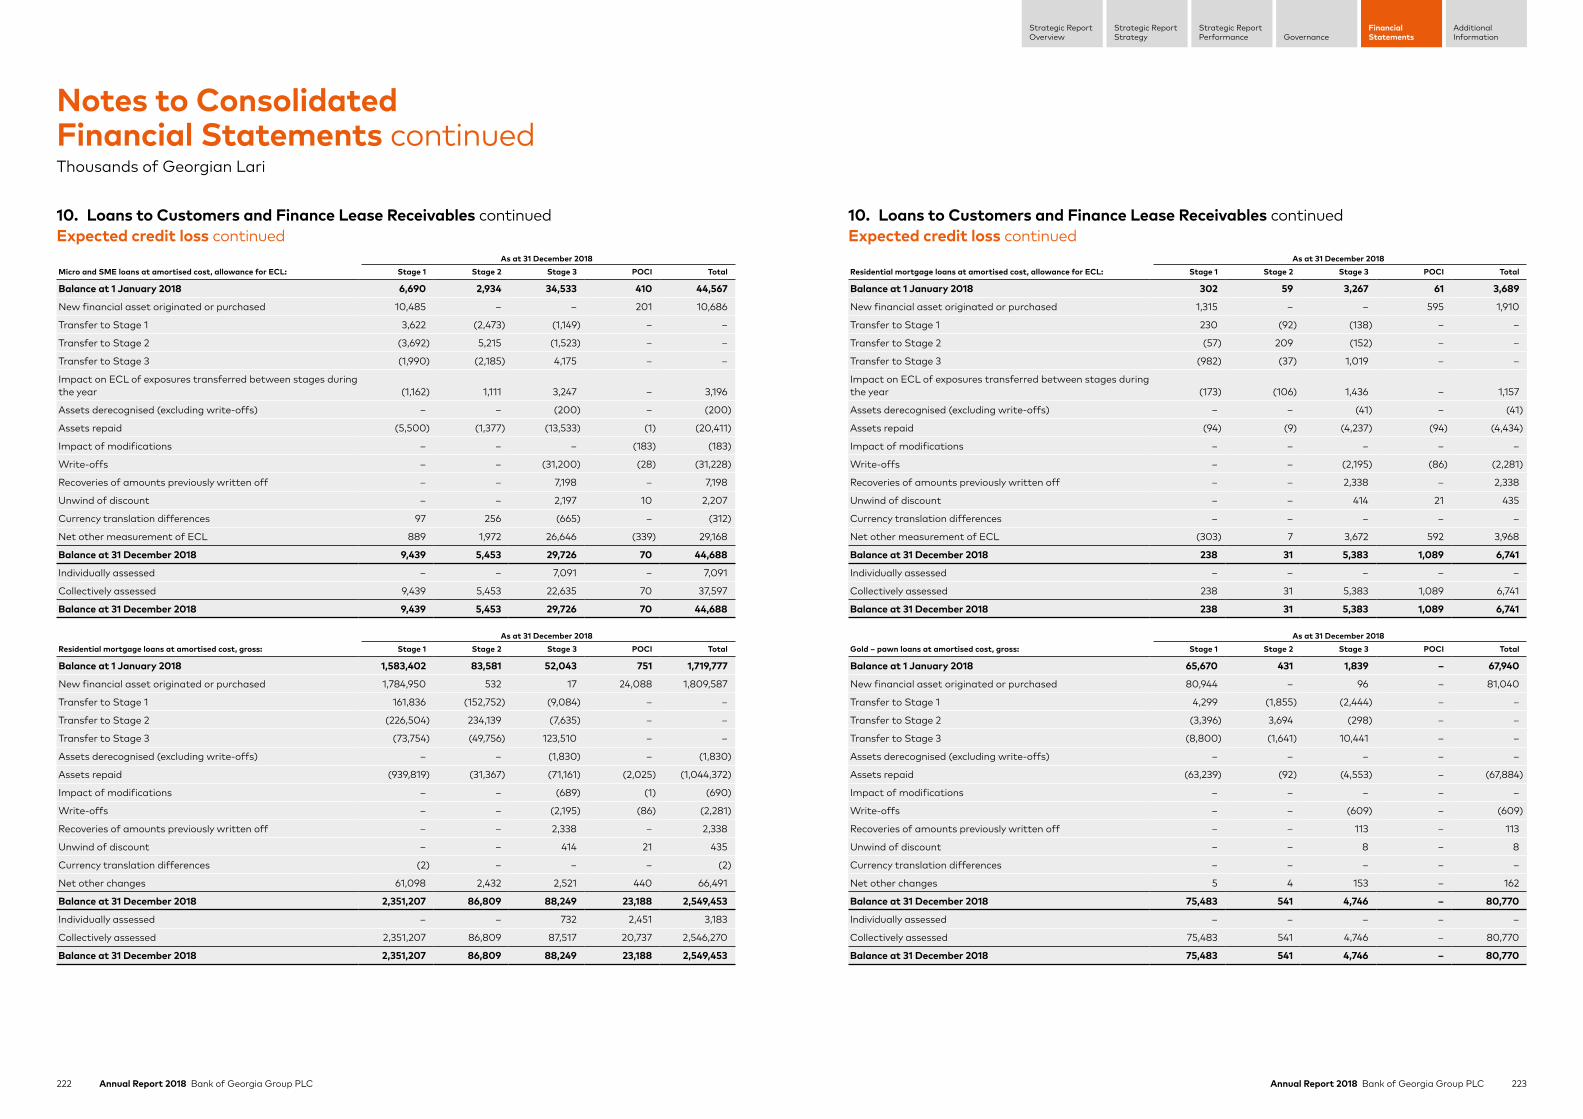
222 Annual Report 2018 Bank of Georgia Group PLC 223Annual Report 2018 Bank of Georgia Group PLC
Strategic ReportStrategy
Strategic ReportPerformance Governance
FinancialStatements
AdditionalInformation
Strategic ReportOverview
10. Loans to Customers and Finance Lease Receivables continuedExpected credit loss continued
As at 31 December 2018Micro and SME loans at amortised cost, allowance for ECL: Stage 1 Stage 2 Stage 3 POCI Total
Balance at 1 January 2018 6,690 2,934 34,533 410 44,567
New financial asset originated or purchased 10,485 – – 201 10,686
Transfer to Stage 1 3,622 (2,473) (1,149) – –
Transfer to Stage 2 (3,692) 5,215 (1,523) – –
Transfer to Stage 3 (1,990) (2,185) 4,175 – –
Impact on ECL of exposures transferred between stages during the year (1,162) 1,111 3,247 – 3,196
Assets derecognised (excluding write-offs) – – (200) – (200)
Assets repaid (5,500) (1,377) (13,533) (1) (20,411)
Impact of modifications – – – (183) (183)
Write-offs – – (31,200) (28) (31,228)
Recoveries of amounts previously written off – – 7,198 – 7,198
Unwind of discount – – 2,197 10 2,207
Currency translation differences 97 256 (665) – (312)
Net other measurement of ECL 889 1,972 26,646 (339) 29,168
Balance at 31 December 2018 9,439 5,453 29,726 70 44,688
Individually assessed – – 7,091 – 7,091
Collectively assessed 9,439 5,453 22,635 70 37,597
Balance at 31 December 2018 9,439 5,453 29,726 70 44,688
As at 31 December 2018Residential mortgage loans at amortised cost, gross: Stage 1 Stage 2 Stage 3 POCI Total
Balance at 1 January 2018 1,583,402 83,581 52,043 751 1,719,777
New financial asset originated or purchased 1,784,950 532 17 24,088 1,809,587
Transfer to Stage 1 161,836 (152,752) (9,084) – –
Transfer to Stage 2 (226,504) 234,139 (7,635) – –
Transfer to Stage 3 (73,754) (49,756) 123,510 – –
Assets derecognised (excluding write-offs) – – (1,830) – (1,830)
Assets repaid (939,819) (31,367) (71,161) (2,025) (1,044,372)
Impact of modifications – – (689) (1) (690)
Write-offs – – (2,195) (86) (2,281)
Recoveries of amounts previously written off – – 2,338 – 2,338
Unwind of discount – – 414 21 435
Currency translation differences (2) – – – (2)
Net other changes 61,098 2,432 2,521 440 66,491
Balance at 31 December 2018 2,351,207 86,809 88,249 23,188 2,549,453
Individually assessed – – 732 2,451 3,183
Collectively assessed 2,351,207 86,809 87,517 20,737 2,546,270
Balance at 31 December 2018 2,351,207 86,809 88,249 23,188 2,549,453
10. Loans to Customers and Finance Lease Receivables continuedExpected credit loss continued
As at 31 December 2018Residential mortgage loans at amortised cost, allowance for ECL: Stage 1 Stage 2 Stage 3 POCI Total
Balance at 1 January 2018 302 59 3,267 61 3,689
New financial asset originated or purchased 1,315 – – 595 1,910
Transfer to Stage 1 230 (92) (138) – –
Transfer to Stage 2 (57) 209 (152) – –
Transfer to Stage 3 (982) (37) 1,019 – –
Impact on ECL of exposures transferred between stages during the year (173) (106) 1,436 – 1,157
Assets derecognised (excluding write-offs) – – (41) – (41)
Assets repaid (94) (9) (4,237) (94) (4,434)
Impact of modifications – – – – –
Write-offs – – (2,195) (86) (2,281)
Recoveries of amounts previously written off – – 2,338 – 2,338
Unwind of discount – – 414 21 435
Currency translation differences – – – – –
Net other measurement of ECL (303) 7 3,672 592 3,968
Balance at 31 December 2018 238 31 5,383 1,089 6,741
Individually assessed – – – – –
Collectively assessed 238 31 5,383 1,089 6,741
Balance at 31 December 2018 238 31 5,383 1,089 6,741
As at 31 December 2018Gold – pawn loans at amortised cost, gross: Stage 1 Stage 2 Stage 3 POCI Total
Balance at 1 January 2018 65,670 431 1,839 – 67,940
New financial asset originated or purchased 80,944 – 96 – 81,040
Transfer to Stage 1 4,299 (1,855) (2,444) – –
Transfer to Stage 2 (3,396) 3,694 (298) – –
Transfer to Stage 3 (8,800) (1,641) 10,441 – –
Assets derecognised (excluding write-offs) – – – – –
Assets repaid (63,239) (92) (4,553) – (67,884)
Impact of modifications – – – – –
Write-offs – – (609) – (609)
Recoveries of amounts previously written off – – 113 – 113
Unwind of discount – – 8 – 8
Currency translation differences – – – – –
Net other changes 5 4 153 – 162
Balance at 31 December 2018 75,483 541 4,746 – 80,770
Individually assessed – – – – –
Collectively assessed 75,483 541 4,746 – 80,770
Balance at 31 December 2018 75,483 541 4,746 – 80,770
Notes to Consolidated Financial Statements continuedThousands of Georgian Lari
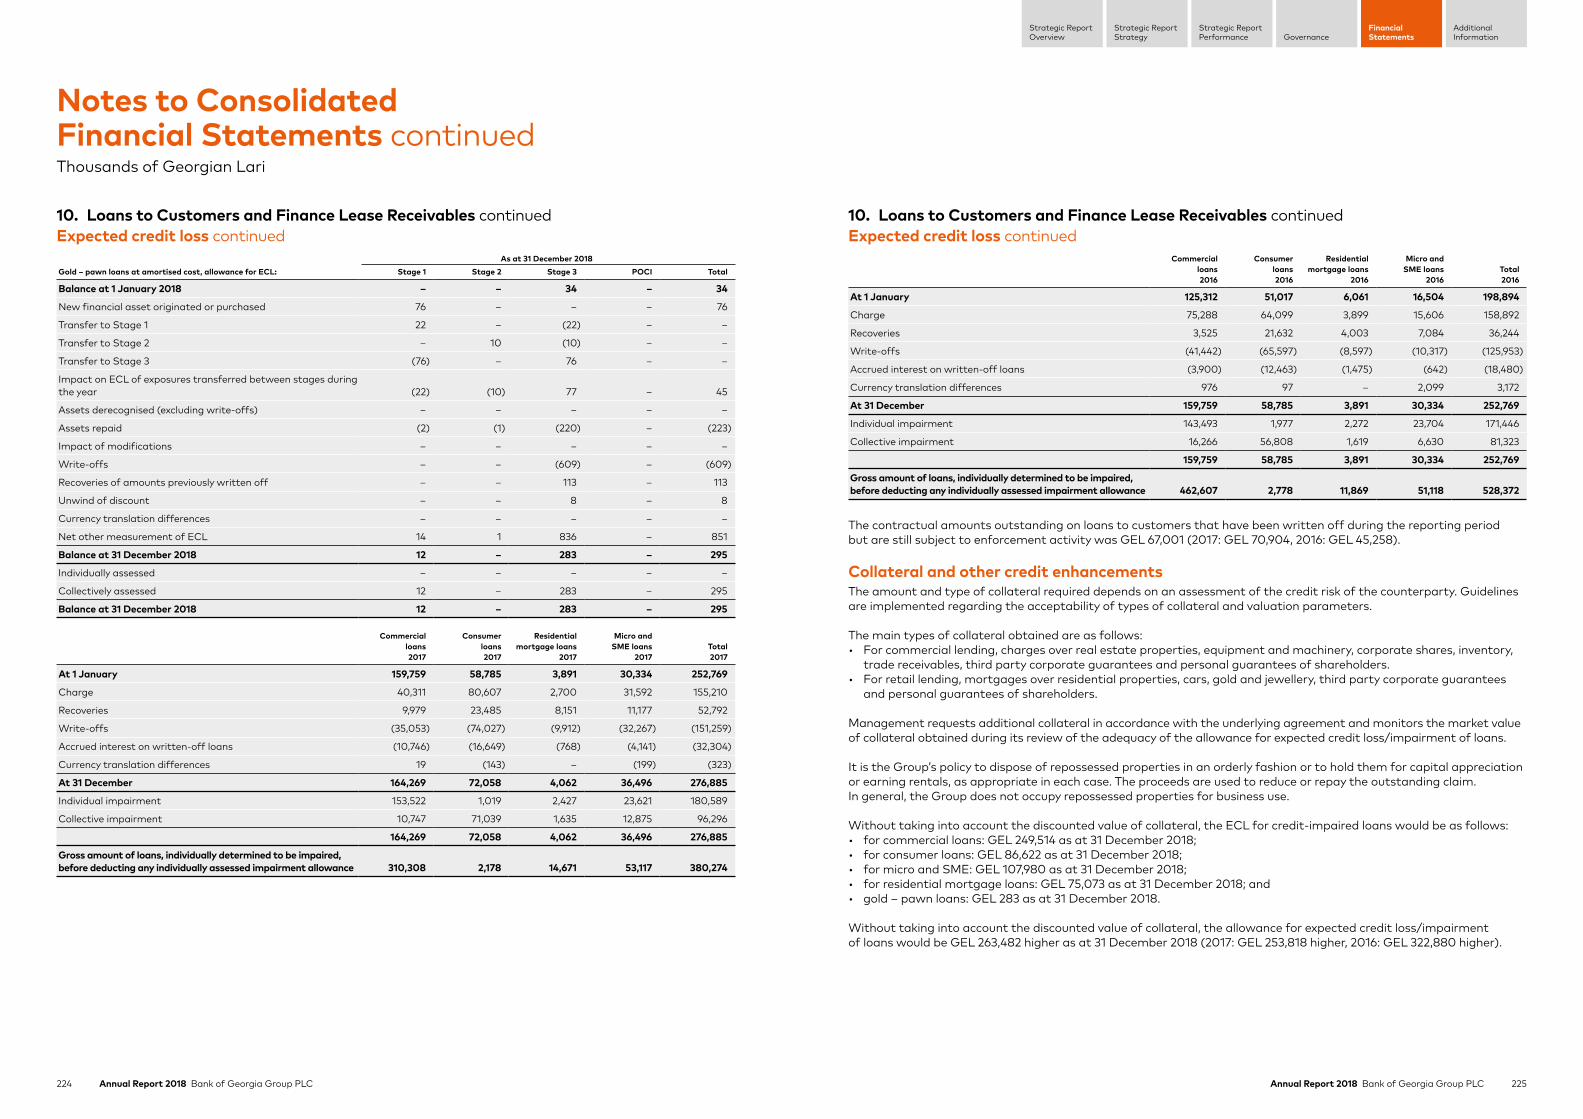
224 Annual Report 2018 Bank of Georgia Group PLC 225Annual Report 2018 Bank of Georgia Group PLC
Strategic ReportStrategy
Strategic ReportPerformance Governance
FinancialStatements
AdditionalInformation
Strategic ReportOverview
10. Loans to Customers and Finance Lease Receivables continuedExpected credit loss continued
As at 31 December 2018Gold – pawn loans at amortised cost, allowance for ECL: Stage 1 Stage 2 Stage 3 POCI Total
Balance at 1 January 2018 – – 34 – 34
New financial asset originated or purchased 76 – – – 76
Transfer to Stage 1 22 – (22) – –
Transfer to Stage 2 – 10 (10) – –
Transfer to Stage 3 (76) – 76 – –
Impact on ECL of exposures transferred between stages during the year (22) (10) 77 – 45
Assets derecognised (excluding write-offs) – – – – –
Assets repaid (2) (1) (220) – (223)
Impact of modifications – – – – –
Write-offs – – (609) – (609)
Recoveries of amounts previously written off – – 113 – 113
Unwind of discount – – 8 – 8
Currency translation differences – – – – –
Net other measurement of ECL 14 1 836 – 851
Balance at 31 December 2018 12 – 283 – 295
Individually assessed – – – – –
Collectively assessed 12 – 283 – 295
Balance at 31 December 2018 12 – 283 – 295
Commercial loans2017
Consumerloans2017
Residential mortgage loans
2017
Micro andSME loans
2017Total2017
At 1 January 159,759 58,785 3,891 30,334 252,769
Charge 40,311 80,607 2,700 31,592 155,210
Recoveries 9,979 23,485 8,151 11,177 52,792
Write-offs (35,053) (74,027) (9,912) (32,267) (151,259)
Accrued interest on written-off loans (10,746) (16,649) (768) (4,141) (32,304)
Currency translation differences 19 (143) – (199) (323)
At 31 December 164,269 72,058 4,062 36,496 276,885
Individual impairment 153,522 1,019 2,427 23,621 180,589
Collective impairment 10,747 71,039 1,635 12,875 96,296
164,269 72,058 4,062 36,496 276,885
Gross amount of loans, individually determined to be impaired, before deducting any individually assessed impairment allowance 310,308 2,178 14,671 53,117 380,274
10. Loans to Customers and Finance Lease Receivables continuedExpected credit loss continued
Commercialloans2016
Consumerloans2016
Residential mortgage loans
2016
Micro andSME loans
2016Total2016
At 1 January 125,312 51,017 6,061 16,504 198,894
Charge 75,288 64,099 3,899 15,606 158,892
Recoveries 3,525 21,632 4,003 7,084 36,244
Write-offs (41,442) (65,597) (8,597) (10,317) (125,953)
Accrued interest on written-off loans (3,900) (12,463) (1,475) (642) (18,480)
Currency translation differences 976 97 – 2,099 3,172
At 31 December 159,759 58,785 3,891 30,334 252,769
Individual impairment 143,493 1,977 2,272 23,704 171,446
Collective impairment 16,266 56,808 1,619 6,630 81,323
159,759 58,785 3,891 30,334 252,769
Gross amount of loans, individually determined to be impaired, before deducting any individually assessed impairment allowance 462,607 2,778 11,869 51,118 528,372
The contractual amounts outstanding on loans to customers that have been written off during the reporting period but are still subject to enforcement activity was GEL 67,001 (2017: GEL 70,904, 2016: GEL 45,258).
Collateral and other credit enhancementsThe amount and type of collateral required depends on an assessment of the credit risk of the counterparty. Guidelines are implemented regarding the acceptability of types of collateral and valuation parameters.
The main types of collateral obtained are as follows:• For commercial lending, charges over real estate properties, equipment and machinery, corporate shares, inventory,
trade receivables, third party corporate guarantees and personal guarantees of shareholders.• For retail lending, mortgages over residential properties, cars, gold and jewellery, third party corporate guarantees
and personal guarantees of shareholders.
Management requests additional collateral in accordance with the underlying agreement and monitors the market value of collateral obtained during its review of the adequacy of the allowance for expected credit loss/impairment of loans.
It is the Group’s policy to dispose of repossessed properties in an orderly fashion or to hold them for capital appreciation or earning rentals, as appropriate in each case. The proceeds are used to reduce or repay the outstanding claim. In general, the Group does not occupy repossessed properties for business use.
Without taking into account the discounted value of collateral, the ECL for credit-impaired loans would be as follows:• for commercial loans: GEL 249,514 as at 31 December 2018;• for consumer loans: GEL 86,622 as at 31 December 2018;• for micro and SME: GEL 107,980 as at 31 December 2018;• for residential mortgage loans: GEL 75,073 as at 31 December 2018; and• gold – pawn loans: GEL 283 as at 31 December 2018.
Without taking into account the discounted value of collateral, the allowance for expected credit loss/impairment of loans would be GEL 263,482 higher as at 31 December 2018 (2017: GEL 253,818 higher, 2016: GEL 322,880 higher).
Notes to Consolidated Financial Statements continuedThousands of Georgian Lari
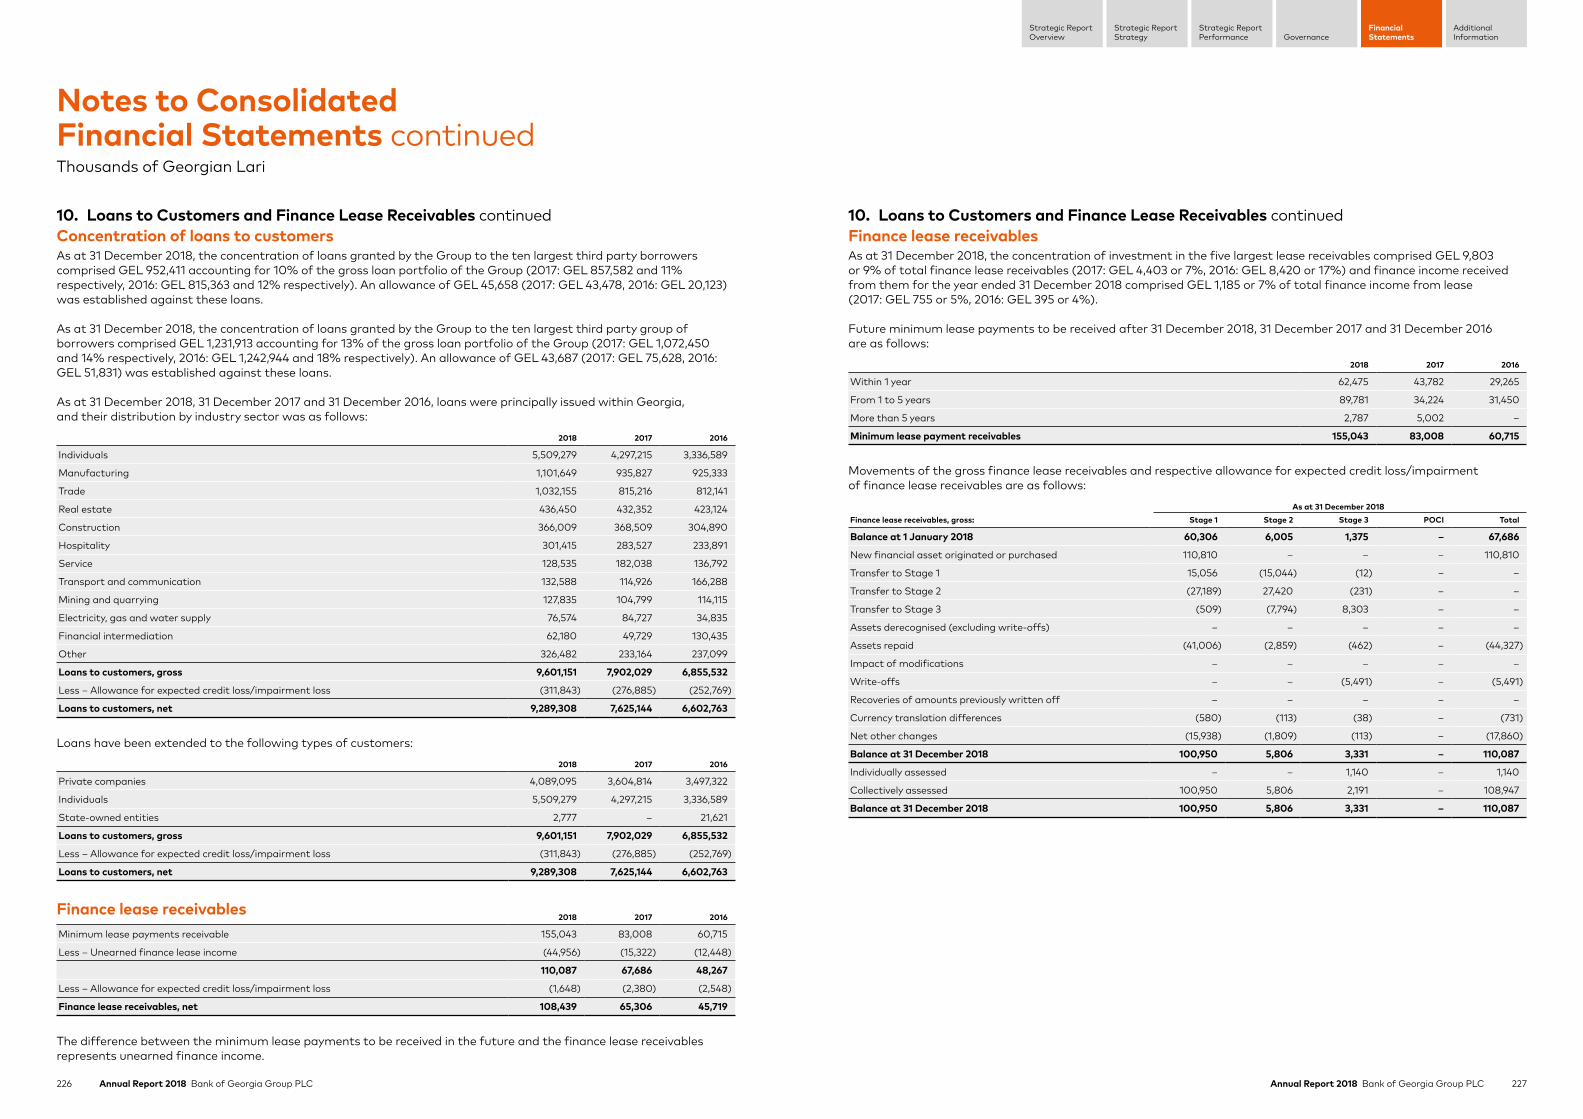
226 Annual Report 2018 Bank of Georgia Group PLC 227Annual Report 2018 Bank of Georgia Group PLC
Strategic ReportStrategy
Strategic ReportPerformance Governance
FinancialStatements
AdditionalInformation
Strategic ReportOverview
10. Loans to Customers and Finance Lease Receivables continuedConcentration of loans to customersAs at 31 December 2018, the concentration of loans granted by the Group to the ten largest third party borrowers comprised GEL 952,411 accounting for 10% of the gross loan portfolio of the Group (2017: GEL 857,582 and 11% respectively, 2016: GEL 815,363 and 12% respectively). An allowance of GEL 45,658 (2017: GEL 43,478, 2016: GEL 20,123) was established against these loans.
As at 31 December 2018, the concentration of loans granted by the Group to the ten largest third party group of borrowers comprised GEL 1,231,913 accounting for 13% of the gross loan portfolio of the Group (2017: GEL 1,072,450 and 14% respectively, 2016: GEL 1,242,944 and 18% respectively). An allowance of GEL 43,687 (2017: GEL 75,628, 2016: GEL 51,831) was established against these loans.
As at 31 December 2018, 31 December 2017 and 31 December 2016, loans were principally issued within Georgia, and their distribution by industry sector was as follows:
2018 2017 2016
Individuals 5,509,279 4,297,215 3,336,589
Manufacturing 1,101,649 935,827 925,333
Trade 1,032,155 815,216 812,141
Real estate 436,450 432,352 423,124
Construction 366,009 368,509 304,890
Hospitality 301,415 283,527 233,891
Service 128,535 182,038 136,792
Transport and communication 132,588 114,926 166,288
Mining and quarrying 127,835 104,799 114,115
Electricity, gas and water supply 76,574 84,727 34,835
Financial intermediation 62,180 49,729 130,435
Other 326,482 233,164 237,099
Loans to customers, gross 9,601,151 7,902,029 6,855,532
Less – Allowance for expected credit loss/impairment loss (311,843) (276,885) (252,769)
Loans to customers, net 9,289,308 7,625,144 6,602,763
Loans have been extended to the following types of customers:
2018 2017 2016
Private companies 4,089,095 3,604,814 3,497,322
Individuals 5,509,279 4,297,215 3,336,589
State-owned entities 2,777 – 21,621
Loans to customers, gross 9,601,151 7,902,029 6,855,532
Less – Allowance for expected credit loss/impairment loss (311,843) (276,885) (252,769)
Loans to customers, net 9,289,308 7,625,144 6,602,763
Finance lease receivables2018 2017 2016
Minimum lease payments receivable 155,043 83,008 60,715
Less – Unearned finance lease income (44,956) (15,322) (12,448)
110,087 67,686 48,267
Less – Allowance for expected credit loss/impairment loss (1,648) (2,380) (2,548)
Finance lease receivables, net 108,439 65,306 45,719
The difference between the minimum lease payments to be received in the future and the finance lease receivables represents unearned finance income.
10. Loans to Customers and Finance Lease Receivables continuedFinance lease receivablesAs at 31 December 2018, the concentration of investment in the five largest lease receivables comprised GEL 9,803 or 9% of total finance lease receivables (2017: GEL 4,403 or 7%, 2016: GEL 8,420 or 17%) and finance income received from them for the year ended 31 December 2018 comprised GEL 1,185 or 7% of total finance income from lease (2017: GEL 755 or 5%, 2016: GEL 395 or 4%).
Future minimum lease payments to be received after 31 December 2018, 31 December 2017 and 31 December 2016 are as follows:
2018 2017 2016
Within 1 year 62,475 43,782 29,265
From 1 to 5 years 89,781 34,224 31,450
More than 5 years 2,787 5,002 –
Minimum lease payment receivables 155,043 83,008 60,715
Movements of the gross finance lease receivables and respective allowance for expected credit loss/impairment of finance lease receivables are as follows:
As at 31 December 2018Finance lease receivables, gross: Stage 1 Stage 2 Stage 3 POCI Total
Balance at 1 January 2018 60,306 6,005 1,375 – 67,686
New financial asset originated or purchased 110,810 – – – 110,810
Transfer to Stage 1 15,056 (15,044) (12) – –
Transfer to Stage 2 (27,189) 27,420 (231) – –
Transfer to Stage 3 (509) (7,794) 8,303 – –
Assets derecognised (excluding write-offs) – – – – –
Assets repaid (41,006) (2,859) (462) – (44,327)
Impact of modifications – – – – –
Write-offs – – (5,491) – (5,491)
Recoveries of amounts previously written off – – – – –
Currency translation differences (580) (113) (38) – (731)
Net other changes (15,938) (1,809) (113) – (17,860)
Balance at 31 December 2018 100,950 5,806 3,331 – 110,087
Individually assessed – – 1,140 – 1,140
Collectively assessed 100,950 5,806 2,191 – 108,947
Balance at 31 December 2018 100,950 5,806 3,331 – 110,087
Notes to Consolidated Financial Statements continuedThousands of Georgian Lari
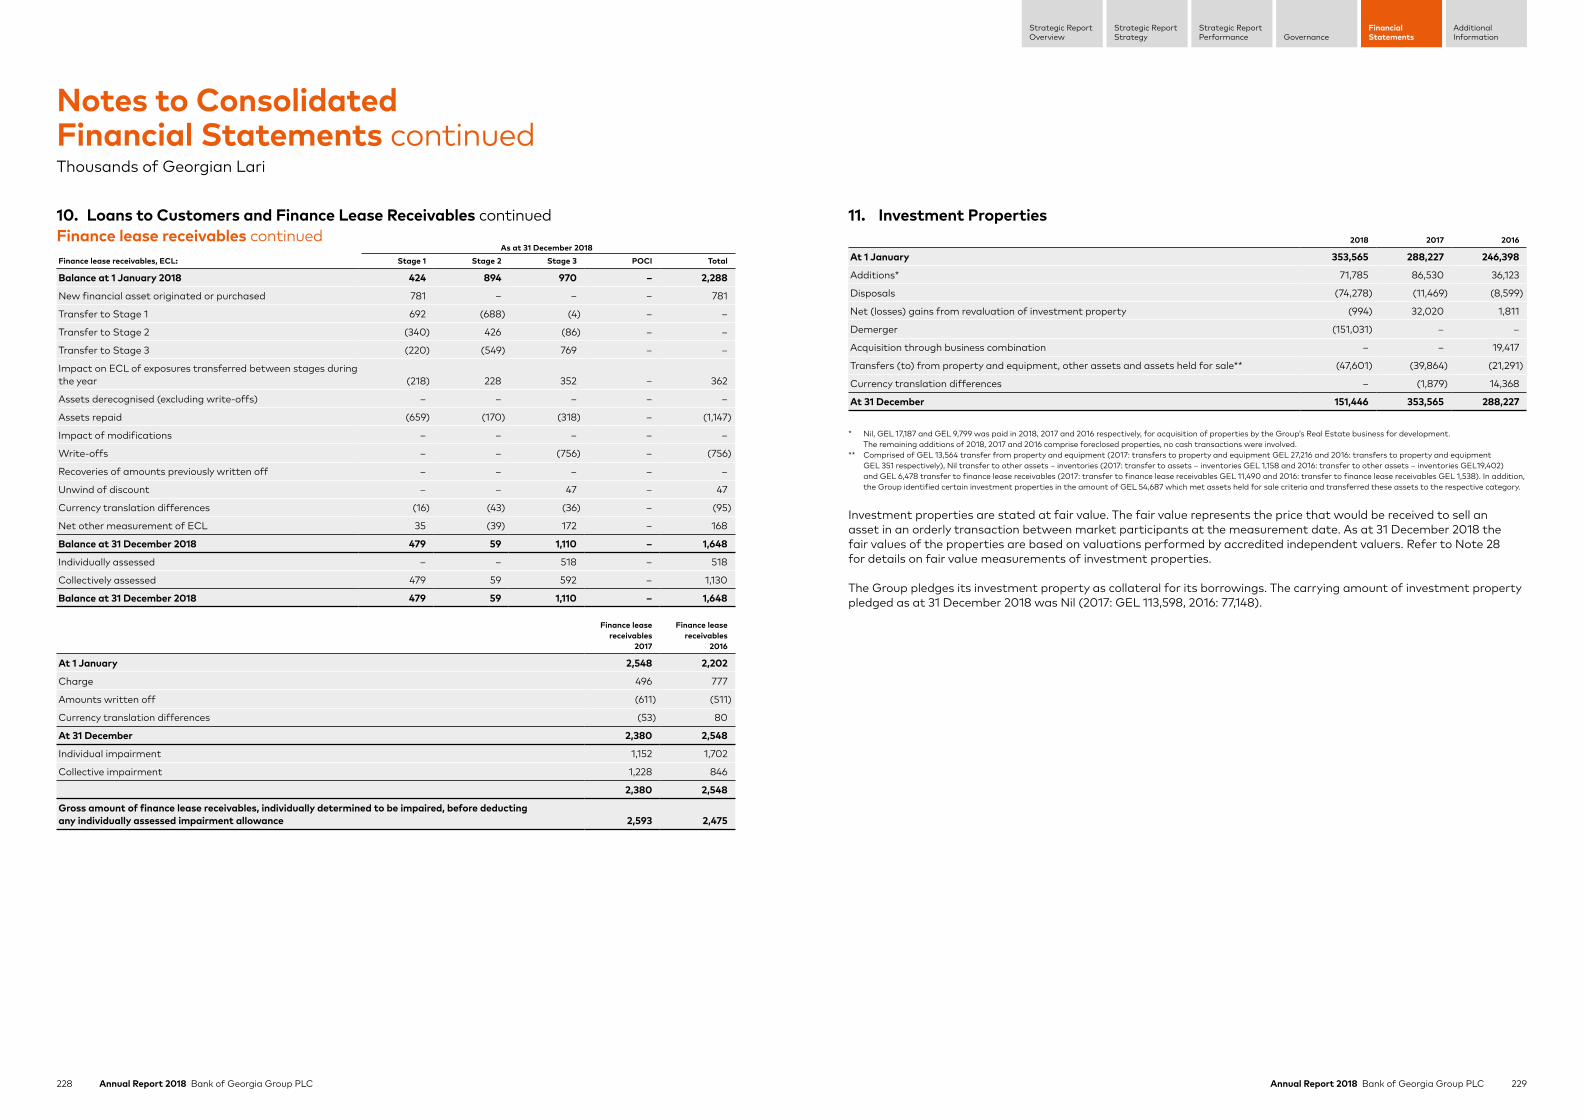
228 Annual Report 2018 Bank of Georgia Group PLC 229Annual Report 2018 Bank of Georgia Group PLC
Strategic ReportStrategy
Strategic ReportPerformance Governance
FinancialStatements
AdditionalInformation
Strategic ReportOverview
10. Loans to Customers and Finance Lease Receivables continuedFinance lease receivables continued
As at 31 December 2018Finance lease receivables, ECL: Stage 1 Stage 2 Stage 3 POCI Total
Balance at 1 January 2018 424 894 970 – 2,288
New financial asset originated or purchased 781 – – – 781
Transfer to Stage 1 692 (688) (4) – –
Transfer to Stage 2 (340) 426 (86) – –
Transfer to Stage 3 (220) (549) 769 – –
Impact on ECL of exposures transferred between stages during the year (218) 228 352 – 362
Assets derecognised (excluding write-offs) – – – – –
Assets repaid (659) (170) (318) – (1,147)
Impact of modifications – – – – –
Write-offs – – (756) – (756)
Recoveries of amounts previously written off – – – – –
Unwind of discount – – 47 – 47
Currency translation differences (16) (43) (36) – (95)
Net other measurement of ECL 35 (39) 172 – 168
Balance at 31 December 2018 479 59 1,110 – 1,648
Individually assessed – – 518 – 518
Collectively assessed 479 59 592 – 1,130
Balance at 31 December 2018 479 59 1,110 – 1,648
Finance lease receivables
2017
Finance lease receivables
2016
At 1 January 2,548 2,202
Charge 496 777
Amounts written off (611) (511)
Currency translation differences (53) 80
At 31 December 2,380 2,548
Individual impairment 1,152 1,702
Collective impairment 1,228 846
2,380 2,548
Gross amount of finance lease receivables, individually determined to be impaired, before deducting any individually assessed impairment allowance 2,593 2,475
11. Investment Properties2018 2017 2016
At 1 January 353,565 288,227 246,398
Additions* 71,785 86,530 36,123
Disposals (74,278) (11,469) (8,599)
Net (losses) gains from revaluation of investment property (994) 32,020 1,811
Demerger (151,031) – –
Acquisition through business combination – – 19,417
Transfers (to) from property and equipment, other assets and assets held for sale** (47,601) (39,864) (21,291)
Currency translation differences – (1,879) 14,368
At 31 December 151,446 353,565 288,227
* Nil, GEL 17,187 and GEL 9,799 was paid in 2018, 2017 and 2016 respectively, for acquisition of properties by the Group’s Real Estate business for development. The remaining additions of 2018, 2017 and 2016 comprise foreclosed properties, no cash transactions were involved.
** Comprised of GEL 13,564 transfer from property and equipment (2017: transfers to property and equipment GEL 27,216 and 2016: transfers to property and equipment GEL 351 respectively), Nil transfer to other assets – inventories (2017: transfer to assets – inventories GEL 1,158 and 2016: transfer to other assets – inventories GEL19,402) and GEL 6,478 transfer to finance lease receivables (2017: transfer to finance lease receivables GEL 11,490 and 2016: transfer to finance lease receivables GEL 1,538). In addition, the Group identified certain investment properties in the amount of GEL 54,687 which met assets held for sale criteria and transferred these assets to the respective category.
Investment properties are stated at fair value. The fair value represents the price that would be received to sell an asset in an orderly transaction between market participants at the measurement date. As at 31 December 2018 the fair values of the properties are based on valuations performed by accredited independent valuers. Refer to Note 28 for details on fair value measurements of investment properties.
The Group pledges its investment property as collateral for its borrowings. The carrying amount of investment property pledged as at 31 December 2018 was Nil (2017: GEL 113,598, 2016: 77,148).
Notes to Consolidated Financial Statements continuedThousands of Georgian Lari
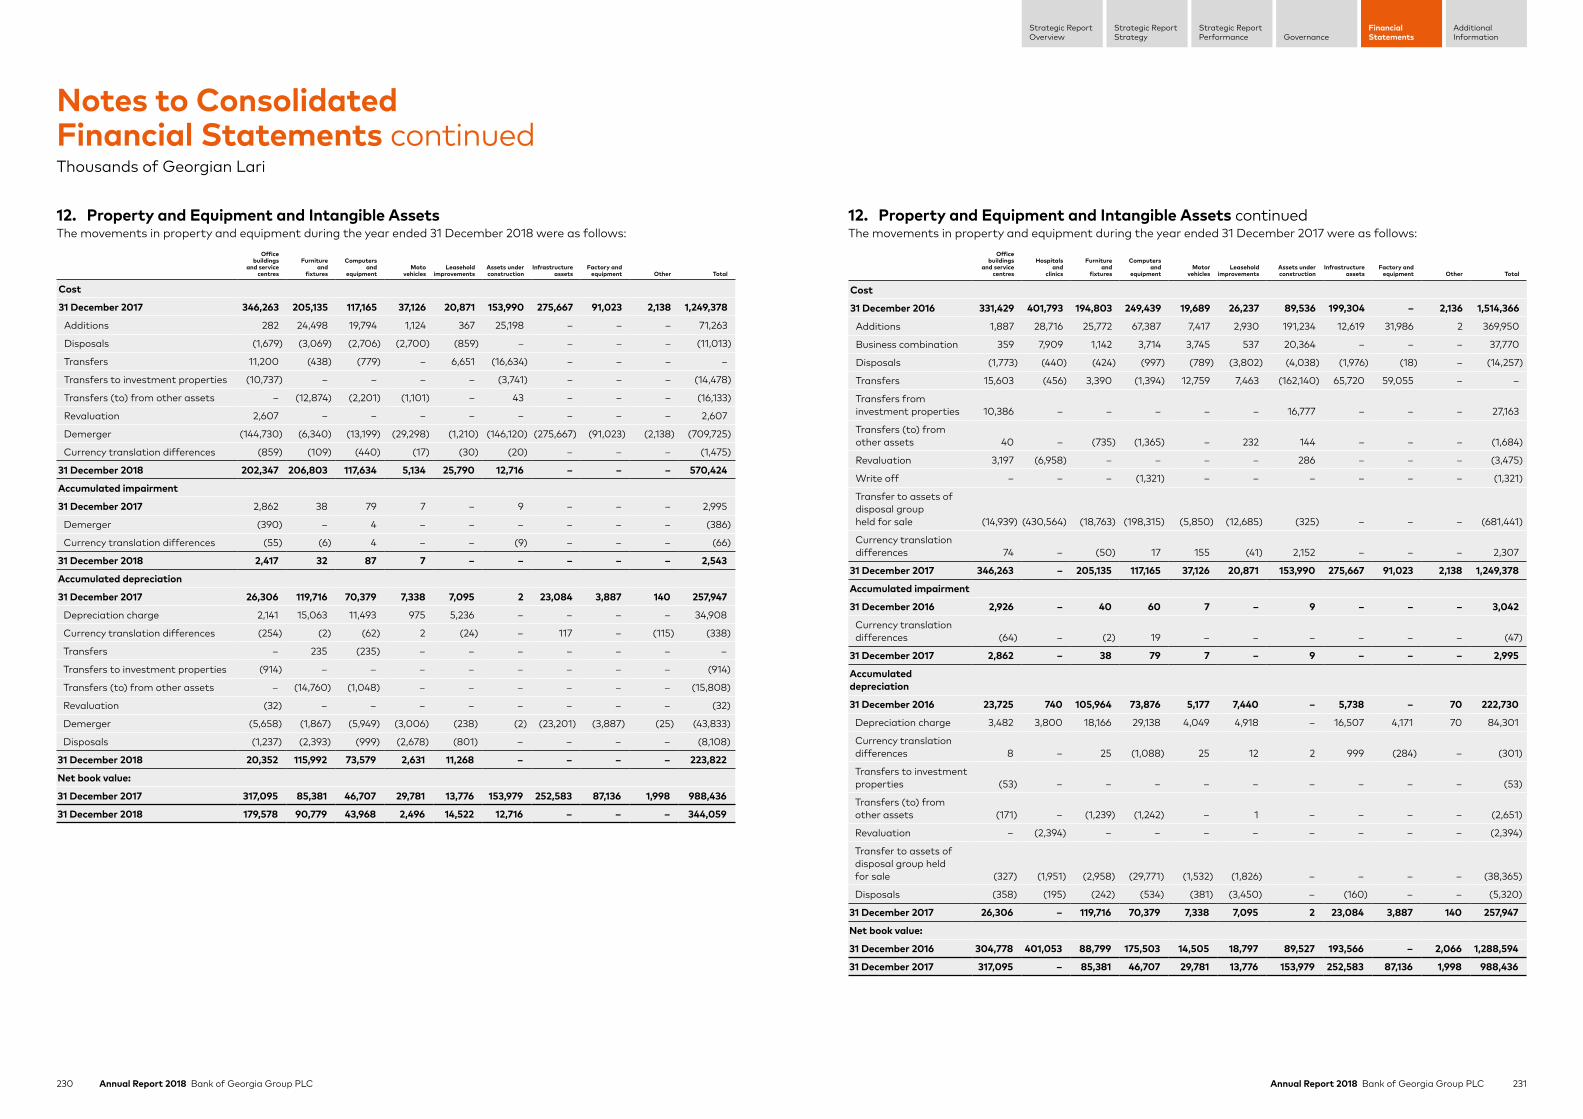
230 Annual Report 2018 Bank of Georgia Group PLC 231Annual Report 2018 Bank of Georgia Group PLC
Strategic ReportStrategy
Strategic ReportPerformance Governance
FinancialStatements
AdditionalInformation
Strategic ReportOverview
12. Property and Equipment and Intangible AssetsThe movements in property and equipment during the year ended 31 December 2018 were as follows:
Office buildings
and service centres
Furniture and
fixtures
Computers and
equipmentMoto
vehiclesLeasehold
improvementsAssets under construction
Infrastructure assets
Factory and equipment Other Total
Cost
31 December 2017 346,263 205,135 117,165 37,126 20,871 153,990 275,667 91,023 2,138 1,249,378
Additions 282 24,498 19,794 1,124 367 25,198 – – – 71,263
Disposals (1,679) (3,069) (2,706) (2,700) (859) – – – – (11,013)
Transfers 11,200 (438) (779) – 6,651 (16,634) – – – –
Transfers to investment properties (10,737) – – – – (3,741) – – – (14,478)
Transfers (to) from other assets – (12,874) (2,201) (1,101) – 43 – – – (16,133)
Revaluation 2,607 – – – – – – – – 2,607
Demerger (144,730) (6,340) (13,199) (29,298) (1,210) (146,120) (275,667) (91,023) (2,138) (709,725)
Currency translation differences (859) (109) (440) (17) (30) (20) – – – (1,475)
31 December 2018 202,347 206,803 117,634 5,134 25,790 12,716 – – – 570,424
Accumulated impairment
31 December 2017 2,862 38 79 7 – 9 – – – 2,995
Demerger (390) – 4 – – – – – – (386)
Currency translation differences (55) (6) 4 – – (9) – – – (66)
31 December 2018 2,417 32 87 7 – – – – – 2,543
Accumulated depreciation
31 December 2017 26,306 119,716 70,379 7,338 7,095 2 23,084 3,887 140 257,947
Depreciation charge 2,141 15,063 11,493 975 5,236 – – – – 34,908
Currency translation differences (254) (2) (62) 2 (24) – 117 – (115) (338)
Transfers – 235 (235) – – – – – – –
Transfers to investment properties (914) – – – – – – – – (914)
Transfers (to) from other assets – (14,760) (1,048) – – – – – – (15,808)
Revaluation (32) – – – – – – – – (32)
Demerger (5,658) (1,867) (5,949) (3,006) (238) (2) (23,201) (3,887) (25) (43,833)
Disposals (1,237) (2,393) (999) (2,678) (801) – – – – (8,108)
31 December 2018 20,352 115,992 73,579 2,631 11,268 – – – – 223,822
Net book value:
31 December 2017 317,095 85,381 46,707 29,781 13,776 153,979 252,583 87,136 1,998 988,436
31 December 2018 179,578 90,779 43,968 2,496 14,522 12,716 – – – 344,059
12. Property and Equipment and Intangible Assets continuedThe movements in property and equipment during the year ended 31 December 2017 were as follows:
Office buildings
and service centres
Hospitals and
clinics
Furniture and
fixtures
Computers and
equipmentMotor
vehiclesLeasehold
improvementsAssets under construction
Infrastructure assets
Factory and equipment Other Total
Cost
31 December 2016 331,429 401,793 194,803 249,439 19,689 26,237 89,536 199,304 – 2,136 1,514,366
Additions 1,887 28,716 25,772 67,387 7,417 2,930 191,234 12,619 31,986 2 369,950
Business combination 359 7,909 1,142 3,714 3,745 537 20,364 – – – 37,770
Disposals (1,773) (440) (424) (997) (789) (3,802) (4,038) (1,976) (18) – (14,257)
Transfers 15,603 (456) 3,390 (1,394) 12,759 7,463 (162,140) 65,720 59,055 – –
Transfers from investment properties 10,386 – – – – – 16,777 – – – 27,163
Transfers (to) from other assets 40 – (735) (1,365) – 232 144 – – – (1,684)
Revaluation 3,197 (6,958) – – – – 286 – – – (3,475)
Write off – – – (1,321) – – – – – – (1,321)
Transfer to assets of disposal group held for sale (14,939) (430,564) (18,763) (198,315) (5,850) (12,685) (325) – – – (681,441)
Currency translation differences 74 – (50) 17 155 (41) 2,152 – – – 2,307
31 December 2017 346,263 – 205,135 117,165 37,126 20,871 153,990 275,667 91,023 2,138 1,249,378
Accumulated impairment
31 December 2016 2,926 – 40 60 7 – 9 – – – 3,042
Currency translation differences (64) – (2) 19 – – – – – – (47)
31 December 2017 2,862 – 38 79 7 – 9 – – – 2,995
Accumulated depreciation
31 December 2016 23,725 740 105,964 73,876 5,177 7,440 – 5,738 – 70 222,730
Depreciation charge 3,482 3,800 18,166 29,138 4,049 4,918 – 16,507 4,171 70 84,301
Currency translation differences 8 – 25 (1,088) 25 12 2 999 (284) – (301)
Transfers to investment properties (53) – – – – – – – – – (53)
Transfers (to) from other assets (171) – (1,239) (1,242) – 1 – – – – (2,651)
Revaluation – (2,394) – – – – – – – – (2,394)
Transfer to assets of disposal group held for sale (327) (1,951) (2,958) (29,771) (1,532) (1,826) – – – – (38,365)
Disposals (358) (195) (242) (534) (381) (3,450) – (160) – – (5,320)
31 December 2017 26,306 – 119,716 70,379 7,338 7,095 2 23,084 3,887 140 257,947
Net book value:
31 December 2016 304,778 401,053 88,799 175,503 14,505 18,797 89,527 193,566 – 2,066 1,288,594
31 December 2017 317,095 – 85,381 46,707 29,781 13,776 153,979 252,583 87,136 1,998 988,436
Notes to Consolidated Financial Statements continuedThousands of Georgian Lari
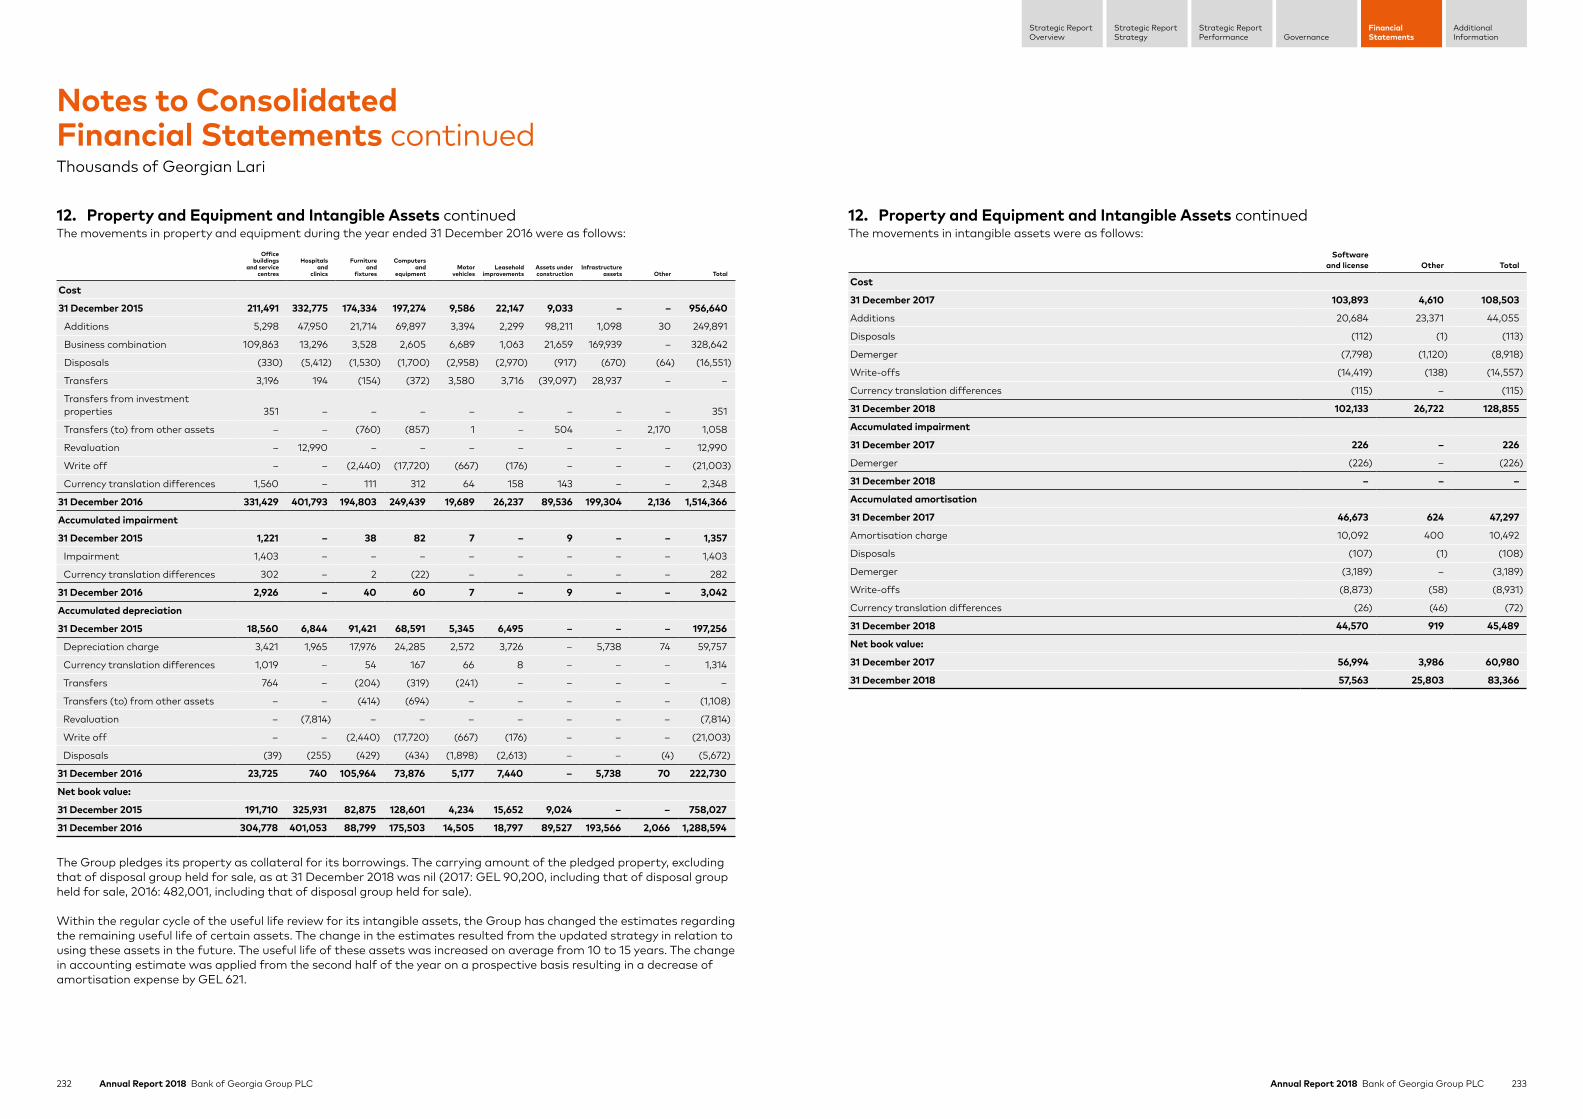
232 Annual Report 2018 Bank of Georgia Group PLC 233Annual Report 2018 Bank of Georgia Group PLC
Strategic ReportStrategy
Strategic ReportPerformance Governance
FinancialStatements
AdditionalInformation
Strategic ReportOverview
12. Property and Equipment and Intangible Assets continuedThe movements in property and equipment during the year ended 31 December 2016 were as follows:
Office buildings
and service centres
Hospitals and
clinics
Furniture and
fixtures
Computers and
equipmentMotor
vehiclesLeasehold
improvementsAssets under construction
Infrastructure assets Other Total
Cost
31 December 2015 211,491 332,775 174,334 197,274 9,586 22,147 9,033 – – 956,640
Additions 5,298 47,950 21,714 69,897 3,394 2,299 98,211 1,098 30 249,891
Business combination 109,863 13,296 3,528 2,605 6,689 1,063 21,659 169,939 – 328,642
Disposals (330) (5,412) (1,530) (1,700) (2,958) (2,970) (917) (670) (64) (16,551)
Transfers 3,196 194 (154) (372) 3,580 3,716 (39,097) 28,937 – –
Transfers from investment properties 351 – – – – – – – – 351
Transfers (to) from other assets – – (760) (857) 1 – 504 – 2,170 1,058
Revaluation – 12,990 – – – – – – – 12,990
Write off – – (2,440) (17,720) (667) (176) – – – (21,003)
Currency translation differences 1,560 – 111 312 64 158 143 – – 2,348
31 December 2016 331,429 401,793 194,803 249,439 19,689 26,237 89,536 199,304 2,136 1,514,366
Accumulated impairment
31 December 2015 1,221 – 38 82 7 – 9 – – 1,357
Impairment 1,403 – – – – – – – – 1,403
Currency translation differences 302 – 2 (22) – – – – – 282
31 December 2016 2,926 – 40 60 7 – 9 – – 3,042
Accumulated depreciation
31 December 2015 18,560 6,844 91,421 68,591 5,345 6,495 – – – 197,256
Depreciation charge 3,421 1,965 17,976 24,285 2,572 3,726 – 5,738 74 59,757
Currency translation differences 1,019 – 54 167 66 8 – – – 1,314
Transfers 764 – (204) (319) (241) – – – – –
Transfers (to) from other assets – – (414) (694) – – – – – (1,108)
Revaluation – (7,814) – – – – – – – (7,814)
Write off – – (2,440) (17,720) (667) (176) – – – (21,003)
Disposals (39) (255) (429) (434) (1,898) (2,613) – – (4) (5,672)
31 December 2016 23,725 740 105,964 73,876 5,177 7,440 – 5,738 70 222,730
Net book value:
31 December 2015 191,710 325,931 82,875 128,601 4,234 15,652 9,024 – – 758,027
31 December 2016 304,778 401,053 88,799 175,503 14,505 18,797 89,527 193,566 2,066 1,288,594
The Group pledges its property as collateral for its borrowings. The carrying amount of the pledged property, excluding that of disposal group held for sale, as at 31 December 2018 was nil (2017: GEL 90,200, including that of disposal group held for sale, 2016: 482,001, including that of disposal group held for sale).
Within the regular cycle of the useful life review for its intangible assets, the Group has changed the estimates regarding the remaining useful life of certain assets. The change in the estimates resulted from the updated strategy in relation to using these assets in the future. The useful life of these assets was increased on average from 10 to 15 years. The change in accounting estimate was applied from the second half of the year on a prospective basis resulting in a decrease of amortisation expense by GEL 621.
12. Property and Equipment and Intangible Assets continuedThe movements in intangible assets were as follows:
Software and license Other Total
Cost
31 December 2017 103,893 4,610 108,503
Additions 20,684 23,371 44,055
Disposals (112) (1) (113)
Demerger (7,798) (1,120) (8,918)
Write-offs (14,419) (138) (14,557)
Currency translation differences (115) – (115)
31 December 2018 102,133 26,722 128,855
Accumulated impairment
31 December 2017 226 – 226
Demerger (226) – (226)
31 December 2018 – – –
Accumulated amortisation
31 December 2017 46,673 624 47,297
Amortisation charge 10,092 400 10,492
Disposals (107) (1) (108)
Demerger (3,189) – (3,189)
Write-offs (8,873) (58) (8,931)
Currency translation differences (26) (46) (72)
31 December 2018 44,570 919 45,489
Net book value:
31 December 2017 56,994 3,986 60,980
31 December 2018 57,563 25,803 83,366
Notes to Consolidated Financial Statements continuedThousands of Georgian Lari
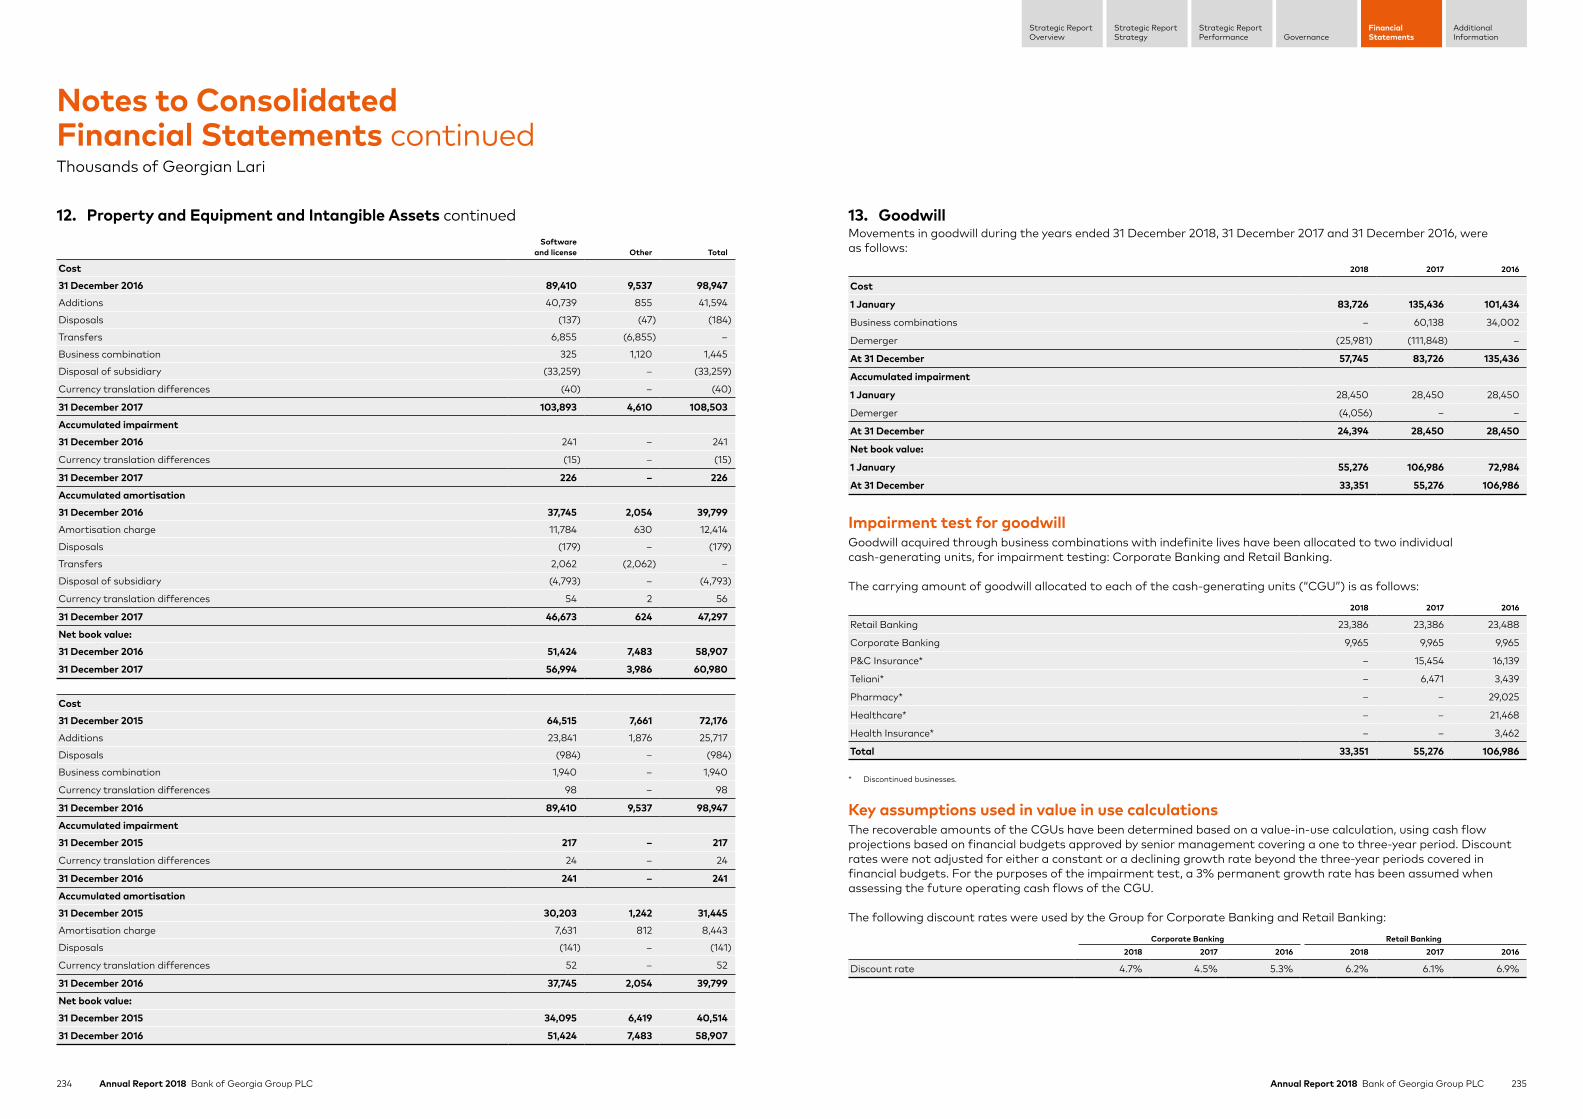
234 Annual Report 2018 Bank of Georgia Group PLC 235Annual Report 2018 Bank of Georgia Group PLC
Strategic ReportStrategy
Strategic ReportPerformance Governance
FinancialStatements
AdditionalInformation
Strategic ReportOverview
Software and license Other Total
Cost
31 December 2016 89,410 9,537 98,947
Additions 40,739 855 41,594
Disposals (137) (47) (184)
Transfers 6,855 (6,855) –
Business combination 325 1,120 1,445
Disposal of subsidiary (33,259) – (33,259)
Currency translation differences (40) – (40)
31 December 2017 103,893 4,610 108,503
Accumulated impairment
31 December 2016 241 – 241
Currency translation differences (15) – (15)
31 December 2017 226 – 226
Accumulated amortisation
31 December 2016 37,745 2,054 39,799
Amortisation charge 11,784 630 12,414
Disposals (179) – (179)
Transfers 2,062 (2,062) –
Disposal of subsidiary (4,793) – (4,793)
Currency translation differences 54 2 56
31 December 2017 46,673 624 47,297
Net book value:
31 December 2016 51,424 7,483 58,907
31 December 2017 56,994 3,986 60,980
Cost
31 December 2015 64,515 7,661 72,176
Additions 23,841 1,876 25,717
Disposals (984) – (984)
Business combination 1,940 – 1,940
Currency translation differences 98 – 98
31 December 2016 89,410 9,537 98,947
Accumulated impairment
31 December 2015 217 – 217
Currency translation differences 24 – 24
31 December 2016 241 – 241
Accumulated amortisation
31 December 2015 30,203 1,242 31,445
Amortisation charge 7,631 812 8,443
Disposals (141) – (141)
Currency translation differences 52 – 52
31 December 2016 37,745 2,054 39,799
Net book value:
31 December 2015 34,095 6,419 40,514
31 December 2016 51,424 7,483 58,907
13. GoodwillMovements in goodwill during the years ended 31 December 2018, 31 December 2017 and 31 December 2016, were as follows:
2018 2017 2016
Cost
1 January 83,726 135,436 101,434
Business combinations – 60,138 34,002
Demerger (25,981) (111,848) –
At 31 December 57,745 83,726 135,436
Accumulated impairment
1 January 28,450 28,450 28,450
Demerger (4,056) – –
At 31 December 24,394 28,450 28,450
Net book value:
1 January 55,276 106,986 72,984
At 31 December 33,351 55,276 106,986
Impairment test for goodwillGoodwill acquired through business combinations with indefinite lives have been allocated to two individual cash-generating units, for impairment testing: Corporate Banking and Retail Banking.
The carrying amount of goodwill allocated to each of the cash-generating units (“CGU”) is as follows:
2018 2017 2016
Retail Banking 23,386 23,386 23,488
Corporate Banking 9,965 9,965 9,965
P&C Insurance* – 15,454 16,139
Teliani* – 6,471 3,439
Pharmacy* – – 29,025
Healthcare* – – 21,468
Health Insurance* – – 3,462
Total 33,351 55,276 106,986
* Discontinued businesses.
Key assumptions used in value in use calculationsThe recoverable amounts of the CGUs have been determined based on a value-in-use calculation, using cash flow projections based on financial budgets approved by senior management covering a one to three-year period. Discount rates were not adjusted for either a constant or a declining growth rate beyond the three-year periods covered in financial budgets. For the purposes of the impairment test, a 3% permanent growth rate has been assumed when assessing the future operating cash flows of the CGU.
The following discount rates were used by the Group for Corporate Banking and Retail Banking:
Corporate Banking Retail Banking2018 2017 2016 2018 2017 2016
Discount rate 4.7% 4.5% 5.3% 6.2% 6.1% 6.9%
Notes to Consolidated Financial Statements continuedThousands of Georgian Lari
12. Property and Equipment and Intangible Assets continued
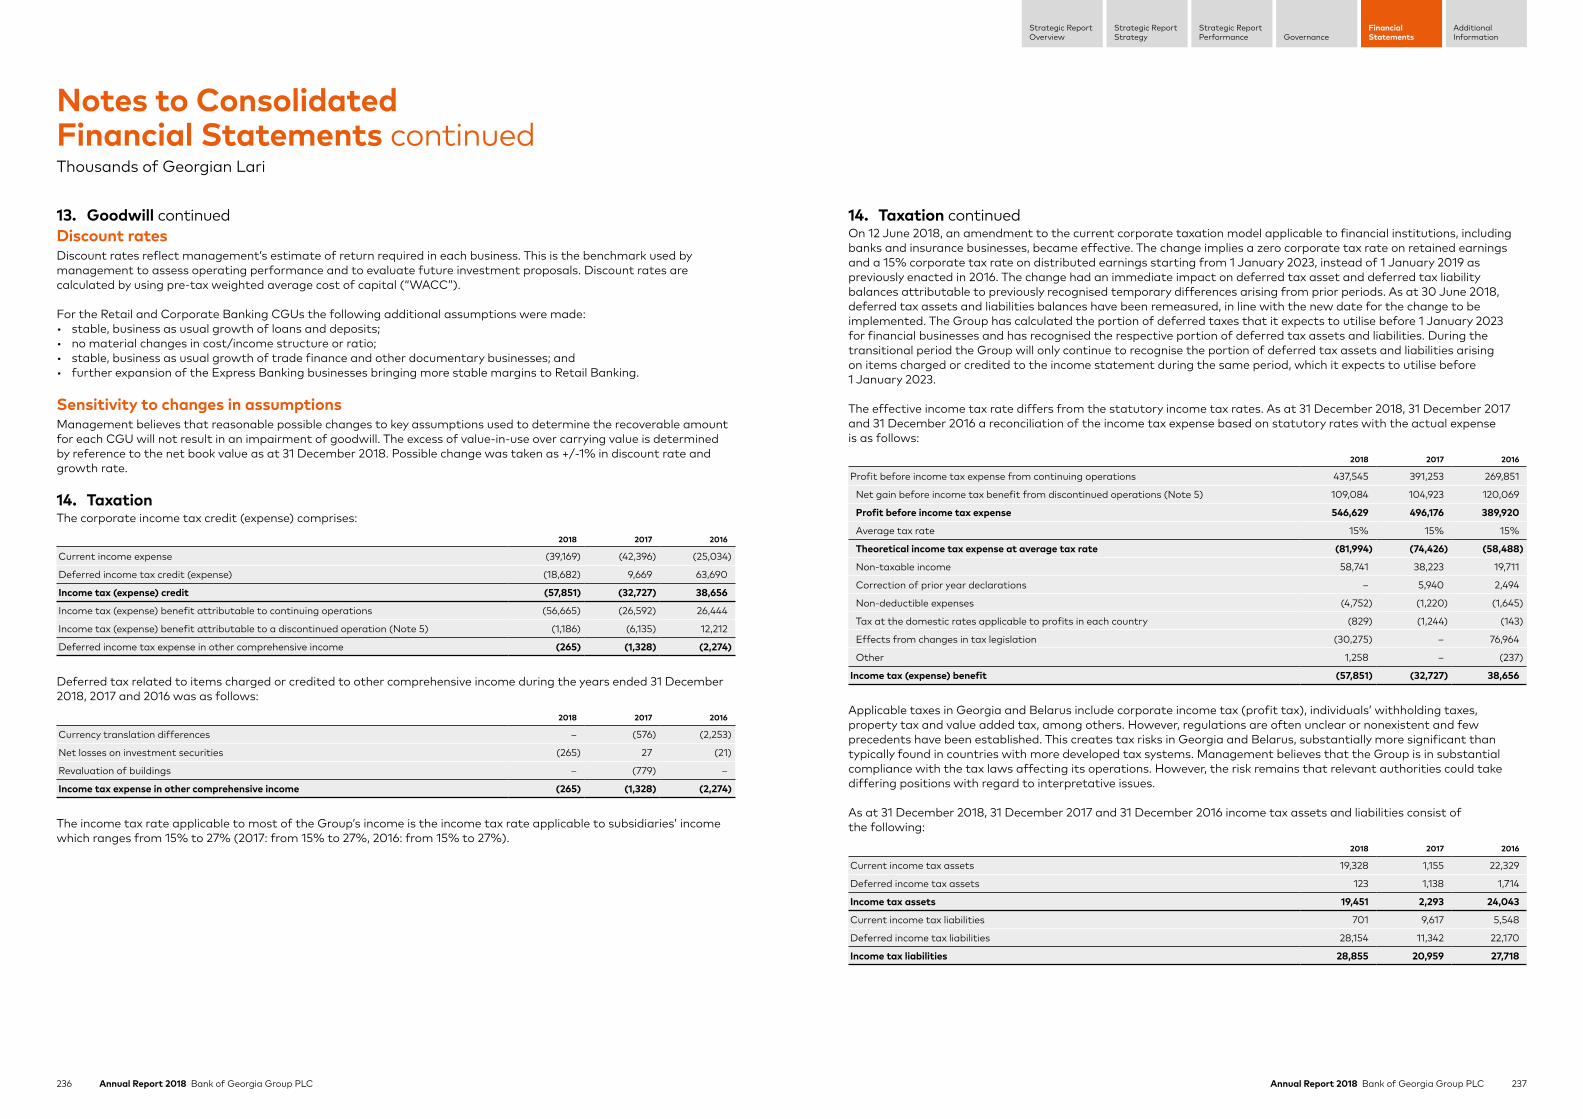
236 Annual Report 2018 Bank of Georgia Group PLC 237Annual Report 2018 Bank of Georgia Group PLC
Strategic ReportStrategy
Strategic ReportPerformance Governance
FinancialStatements
AdditionalInformation
Strategic ReportOverview
13. Goodwill continuedDiscount ratesDiscount rates reflect management’s estimate of return required in each business. This is the benchmark used by management to assess operating performance and to evaluate future investment proposals. Discount rates are calculated by using pre-tax weighted average cost of capital (“WACC”).
For the Retail and Corporate Banking CGUs the following additional assumptions were made:• stable, business as usual growth of loans and deposits;• no material changes in cost/income structure or ratio;• stable, business as usual growth of trade finance and other documentary businesses; and• further expansion of the Express Banking businesses bringing more stable margins to Retail Banking.
Sensitivity to changes in assumptionsManagement believes that reasonable possible changes to key assumptions used to determine the recoverable amount for each CGU will not result in an impairment of goodwill. The excess of value-in-use over carrying value is determined by reference to the net book value as at 31 December 2018. Possible change was taken as +/-1% in discount rate and growth rate.
14. TaxationThe corporate income tax credit (expense) comprises:
2018 2017 2016
Current income expense (39,169) (42,396) (25,034)
Deferred income tax credit (expense) (18,682) 9,669 63,690
Income tax (expense) credit (57,851) (32,727) 38,656
Income tax (expense) benefit attributable to continuing operations (56,665) (26,592) 26,444
Income tax (expense) benefit attributable to a discontinued operation (Note 5) (1,186) (6,135) 12,212
Deferred income tax expense in other comprehensive income (265) (1,328) (2,274)
Deferred tax related to items charged or credited to other comprehensive income during the years ended 31 December 2018, 2017 and 2016 was as follows:
2018 2017 2016
Currency translation differences – (576) (2,253)
Net losses on investment securities (265) 27 (21)
Revaluation of buildings – (779) –
Income tax expense in other comprehensive income (265) (1,328) (2,274)
The income tax rate applicable to most of the Group’s income is the income tax rate applicable to subsidiaries’ income which ranges from 15% to 27% (2017: from 15% to 27%, 2016: from 15% to 27%).
14. Taxation continuedOn 12 June 2018, an amendment to the current corporate taxation model applicable to financial institutions, including banks and insurance businesses, became effective. The change implies a zero corporate tax rate on retained earnings and a 15% corporate tax rate on distributed earnings starting from 1 January 2023, instead of 1 January 2019 as previously enacted in 2016. The change had an immediate impact on deferred tax asset and deferred tax liability balances attributable to previously recognised temporary differences arising from prior periods. As at 30 June 2018, deferred tax assets and liabilities balances have been remeasured, in line with the new date for the change to be implemented. The Group has calculated the portion of deferred taxes that it expects to utilise before 1 January 2023 for financial businesses and has recognised the respective portion of deferred tax assets and liabilities. During the transitional period the Group will only continue to recognise the portion of deferred tax assets and liabilities arising on items charged or credited to the income statement during the same period, which it expects to utilise before 1 January 2023.
The effective income tax rate differs from the statutory income tax rates. As at 31 December 2018, 31 December 2017 and 31 December 2016 a reconciliation of the income tax expense based on statutory rates with the actual expense is as follows:
2018 2017 2016
Profit before income tax expense from continuing operations 437,545 391,253 269,851
Net gain before income tax benefit from discontinued operations (Note 5) 109,084 104,923 120,069
Profit before income tax expense 546,629 496,176 389,920
Average tax rate 15% 15% 15%
Theoretical income tax expense at average tax rate (81,994) (74,426) (58,488)
Non-taxable income 58,741 38,223 19,711
Correction of prior year declarations – 5,940 2,494
Non-deductible expenses (4,752) (1,220) (1,645)
Tax at the domestic rates applicable to profits in each country (829) (1,244) (143)
Effects from changes in tax legislation (30,275) – 76,964
Other 1,258 – (237)
Income tax (expense) benefit (57,851) (32,727) 38,656
Applicable taxes in Georgia and Belarus include corporate income tax (profit tax), individuals’ withholding taxes, property tax and value added tax, among others. However, regulations are often unclear or nonexistent and few precedents have been established. This creates tax risks in Georgia and Belarus, substantially more significant than typically found in countries with more developed tax systems. Management believes that the Group is in substantial compliance with the tax laws affecting its operations. However, the risk remains that relevant authorities could take differing positions with regard to interpretative issues.
As at 31 December 2018, 31 December 2017 and 31 December 2016 income tax assets and liabilities consist of the following:
2018 2017 2016
Current income tax assets 19,328 1,155 22,329
Deferred income tax assets 123 1,138 1,714
Income tax assets 19,451 2,293 24,043
Current income tax liabilities 701 9,617 5,548
Deferred income tax liabilities 28,154 11,342 22,170
Income tax liabilities 28,855 20,959 27,718
Notes to Consolidated Financial Statements continuedThousands of Georgian Lari

238 Annual Report 2018 Bank of Georgia Group PLC 239Annual Report 2018 Bank of Georgia Group PLC
Strategic ReportStrategy
Strategic ReportPerformance Governance
FinancialStatements
AdditionalInformation
Strategic ReportOverview
14. Taxation continuedDeferred tax assets and liabilities as at 31 December 2018, 31 December 2017 and 31 December 2016 and their movements for the respective years are as follows:
Origination and reversal of temporary differences Origination and reversal of temporary differences Origination and reversal of temporary differences
2015In the income
statementBusiness
combination
In other comprehensive
income 2016In the income
statementIFRS 15
adoption
In other comprehensive
income 2017In the income
statementIFRS 9
adoption Demerger
In other comprehensive
income 2018
Tax effect of deductible temporary differences:
Amounts due to credit institutions 482 (482) – – – – – – – 26 77 – – 103
Investment properties 980 431 – (921) 490 (284) – (18) 188 17 – – – 205
Insurance premiums receivables 2,160 (952) – – 1,208 (721) – – 487 – – (487) – –
Allowances for impairment and provisions for other losses 4,866 1,090 – 535 6,491 1,490 – (205) 7,776 (7,159) – – – 617
Tax losses carried forward 17,160 (13,095) – (4,065) – – – – – 8 10 – – 18
Property and equipment 937 (44) – (73) 820 87 – (179) 728 1,249 – – – 1,977
Other assets and liabilities 4,447 (3,053) 1,497 168 3,059 1,277 – (16) 4,320 3,828 (87) (522) – 7,539
Deferred tax assets 31,032 (16,105) 1,497 (4,356) 12,068 1,849 – (418) 13,499 (2,031) – (1,009) – 10,459
Tax effect of taxable temporary differences:
Amounts due to credit institutions 68 1,162 – – 1,230 (469) – – 761 1,824 – – – 2,585
Debt securities issued – – – – – – – – – 2,722 – – – 2,722
Cash and cash equivalents – – – – – – – – – 2,669 – – – 2,669
Investment securities – – – – – – – – – (26) 83 – 265 322
Loans to customers 28,956 (11,210) – 720 18,466 (4,423) – (262) 13,781 3,464 (1,974) – – 15,271
Other insurance liabilities and pension fund obligations 222 (222) – – – – – – – – – – – –
Property and equipment 63,716 (57,990) 1,915 (1,062) 6,579 (2,829) – 1,201 4,951 5,469 – – – 10,420
Investment properties 6,511 (4,966) – (1,545) – – – – – 584 – – – 584
Intangible assets 5,403 (5,053) – 102 452 (435) – (1) 16 (4) – – – 12
Other assets and liabilities 7,470 (1,516) 140 (297) 5,797 336 (1,911) (28) 4,194 (51) (238) – – 3,905
Deferred tax liabilities 112,346 (79,795) 2,055 (2,082) 32,524 (7,820) (1,911) 910 23,703 16,651 (2,129) – 265 38,490
Net deferred tax liabilities (81,314) 63,690 (558) (2,274) (20,456) 9,669 1,911 (1,328) (10,204) (18,682) 2,129 (1,009) (265) (28,031)
Notes to Consolidated Financial Statements continuedThousands of Georgian Lari
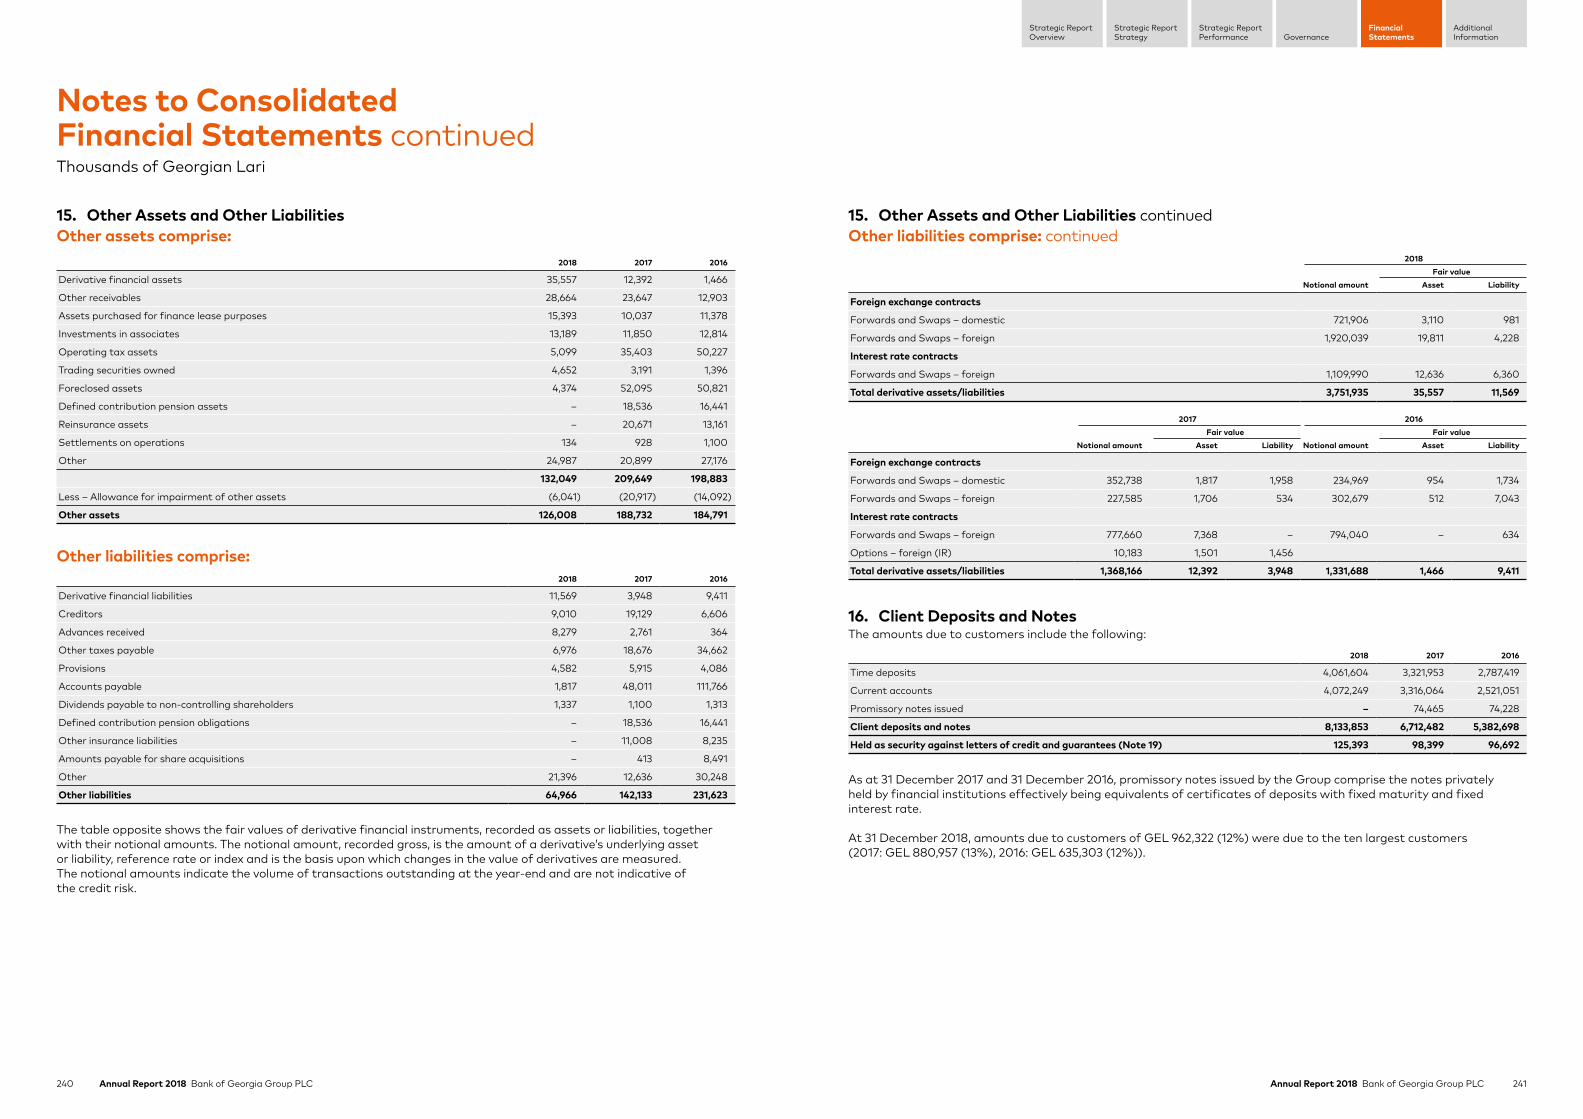
240 Annual Report 2018 Bank of Georgia Group PLC 241Annual Report 2018 Bank of Georgia Group PLC
Strategic ReportStrategy
Strategic ReportPerformance Governance
FinancialStatements
AdditionalInformation
Strategic ReportOverview
15. Other Assets and Other LiabilitiesOther assets comprise:
2018 2017 2016
Derivative financial assets 35,557 12,392 1,466
Other receivables 28,664 23,647 12,903
Assets purchased for finance lease purposes 15,393 10,037 11,378
Investments in associates 13,189 11,850 12,814
Operating tax assets 5,099 35,403 50,227
Trading securities owned 4,652 3,191 1,396
Foreclosed assets 4,374 52,095 50,821
Defined contribution pension assets – 18,536 16,441
Reinsurance assets – 20,671 13,161
Settlements on operations 134 928 1,100
Other 24,987 20,899 27,176
132,049 209,649 198,883
Less – Allowance for impairment of other assets (6,041) (20,917) (14,092)
Other assets 126,008 188,732 184,791
Other liabilities comprise:2018 2017 2016
Derivative financial liabilities 11,569 3,948 9,411
Creditors 9,010 19,129 6,606
Advances received 8,279 2,761 364
Other taxes payable 6,976 18,676 34,662
Provisions 4,582 5,915 4,086
Accounts payable 1,817 48,011 111,766
Dividends payable to non-controlling shareholders 1,337 1,100 1,313
Defined contribution pension obligations – 18,536 16,441
Other insurance liabilities – 11,008 8,235
Amounts payable for share acquisitions – 413 8,491
Other 21,396 12,636 30,248
Other liabilities 64,966 142,133 231,623
The table opposite shows the fair values of derivative financial instruments, recorded as assets or liabilities, together with their notional amounts. The notional amount, recorded gross, is the amount of a derivative’s underlying asset or liability, reference rate or index and is the basis upon which changes in the value of derivatives are measured. The notional amounts indicate the volume of transactions outstanding at the year-end and are not indicative of the credit risk.
Notes to Consolidated Financial Statements continuedThousands of Georgian Lari
15. Other Assets and Other Liabilities continuedOther liabilities comprise: continued
2018Fair value
Notional amount Asset Liability
Foreign exchange contracts
Forwards and Swaps – domestic 721,906 3,110 981
Forwards and Swaps – foreign 1,920,039 19,811 4,228
Interest rate contracts
Forwards and Swaps – foreign 1,109,990 12,636 6,360
Total derivative assets/liabilities 3,751,935 35,557 11,569
2017 2016Fair value Fair value
Notional amount Asset Liability Notional amount Asset Liability
Foreign exchange contracts
Forwards and Swaps – domestic 352,738 1,817 1,958 234,969 954 1,734
Forwards and Swaps – foreign 227,585 1,706 534 302,679 512 7,043
Interest rate contracts
Forwards and Swaps – foreign 777,660 7,368 – 794,040 – 634
Options – foreign (IR) 10,183 1,501 1,456
Total derivative assets/liabilities 1,368,166 12,392 3,948 1,331,688 1,466 9,411
16. Client Deposits and NotesThe amounts due to customers include the following:
2018 2017 2016
Time deposits 4,061,604 3,321,953 2,787,419
Current accounts 4,072,249 3,316,064 2,521,051
Promissory notes issued – 74,465 74,228
Client deposits and notes 8,133,853 6,712,482 5,382,698
Held as security against letters of credit and guarantees (Note 19) 125,393 98,399 96,692
As at 31 December 2017 and 31 December 2016, promissory notes issued by the Group comprise the notes privately held by financial institutions effectively being equivalents of certificates of deposits with fixed maturity and fixed interest rate.
At 31 December 2018, amounts due to customers of GEL 962,322 (12%) were due to the ten largest customers (2017: GEL 880,957 (13%), 2016: GEL 635,303 (12%)).

242 Annual Report 2018 Bank of Georgia Group PLC 243Annual Report 2018 Bank of Georgia Group PLC
Strategic ReportStrategy
Strategic ReportPerformance Governance
FinancialStatements
AdditionalInformation
Strategic ReportOverview
16. Client Deposits and Notes continuedAmounts due to customers include accounts with the following types of customers:
2018 2017 2016
Individuals 4,832,966 3,883,940 3,134,251
Private enterprises 2,760,667 2,364,255 2,110,975
State and state-owned entities 540,220 464,287 137,472
Client deposits and notes 8,133,853 6,712,482 5,382,698
The breakdown of customer accounts by industry sector is as follows:
2018 2017 2016
Individuals 4,832,966 3,883,940 3,134,251
Trade 536,619 576,524 420,402
Government services 508,410 438,492 102,530
Financial intermediation 397,638 314,081 365,515
Service 300,671 297,393 264,609
Transport and communication 342,745 257,818 213,301
Construction 572,628 257,799 272,351
Manufacturing 178,619 224,230 208,145
Real estate 101,020 103,800 66,207
Electricity, gas and water supply 95,987 93,097 95,651
Hospitality 40,216 44,241 22,248
Other 226,334 221,067 217,488
Client deposits and notes 8,133,853 6,712,482 5,382,698
17. Amounts Owed to Credit InstitutionsAmounts due to credit institutions comprise:
2018 2017 2016
Borrowings from international credit institutions 989,740 1,423,840 1,221,070
Short-term loans from the National Bank of Georgia 1,118,957 793,528 1,085,000
Time deposits and inter-bank loans 214,479 305,287 397,506
Correspondent accounts 118,692 204,512 329,609
Other borrowings* 133,830 – –
2,575,698 2,727,167 3,033,185
Non-convertible subordinated debt 419,181 428,672 436,906
Amounts due to credit institutions 2,994,879 3,155,839 3,470,091
* Other borrowings represent borrowings from JSC Georgia Capital on arm’s length terms.
During the year ended 31 December 2018, the Group paid up to 6.10% on US$ borrowings from international credit institutions (2017: up to 6.27%, 2016: up to 5.79%). During the year ended 31 December 2018, the Group paid up to 10.00% on US$ subordinated debt (2017: up to 8.92% and 2016: up to 8.44%).
Some long-term borrowings from international credit institutions are received upon certain conditions (the “Lender Covenants”) that the Group maintains different limits for capital adequacy, liquidity, currency positions, credit exposures, leverage and others. At 31 December 2018, 31 December 2017 and 31 December 2016 the Group complied with all the Lender Covenants of the significant borrowings from international credit institutions.
Notes to Consolidated Financial Statements continuedThousands of Georgian Lari
17. Amounts Owed to Credit Institutions continuedInterest-bearing liabilities and borrowings of BOGG were formed as a result of the Demerger, during which BGEO Group limited, former BGEO Group PLC, contributed the entire issued share capital of JSC Georgia Capital, the Investment Business, in exchange for an interest-bearing loan.
Changes in liabilities arising from financing activitiesAmounts due
to credit institutions
Carrying amount at 31 December 2016 21,692
Foreign currency translation 9
Cash repayments (21,701)
Carrying amount at 31 December 2017 –
Carrying amount at 31 December 2018 –
18. Debt Securities IssuedDebt securities issued comprise:
2018 2017 2016
Eurobonds and notes issued 1,349,853 1,344,334 937,406
Local bonds 57,389 96,266 140,965
Certificates of deposit 323,172 268,552 177,272
Debt securities issued 1,730,414 1,709,152 1,255,643
19. Commitments and ContingenciesLegalSai-investAs at 31 December 2018, the Group was engaged in a litigation proceeding with Sai-Invest LLC in relation to a deposit pledge in the amount of EUR 7 million used to reduce the outstanding loan of LTD Sport Invest towards JSC Bank of Georgia. The management is of the opinion that the probability of incurring material losses on this claim is low, and accordingly no provision has been made in these consolidated financial statements. Rustavi Azoti At 31 December 2018, the Bank was engaged in litigation proceedings in Tbilisi City Court with East-West United Bank S.A., Agrochim S.A. and Systema Holding Limited (claimants) in relation to foreclosure on security (movable and immovable property and intangible assets) through auction on a defaulted loan of Rustavi Azoti LLC. Claimants request reinstatement of the title to the property owned by Rustavi Azoti LLC and compensation of damages in the amount of around US$ 93.6m. No provision has been made as the management believes that the claim is groundless and it is extremely unlikely that any significant loss will eventuate from this claim. At 31 December 2018, BGEO Group Limited (former BGEO Group PLC), was engaged in litigation proceedings in the High Court of Justice of England and Wales (Commercial Court) with Roman Pipia (claimant), who asserts that BGEO Group Limited is liable to the claimant under Georgian law in relation to the loss of the Rustavi Azoti plant, which he alleges he formerly beneficially owned. The Bank had initiated the sale of collateral pledged by Rustavi Azoti LLC and its parent company to secure loans granted by the Bank following default by the borrowers in 2016. Based on the revised claim submitted in December 2018, the claimed amount is around US$ 286.5m (alternatively US$ 291m). No provision has been made as the management believes that the claim is groundless and it is extremely unlikely that any significant loss will eventuate from this claim. In the ordinary course of business, the Group and BOGG are subject to legal actions and complaints. Management believes that the ultimate liability, if any, arising from such actions or complaints will not have a material adverse effect on the financial condition or the results of future operations of the Group or BOGG.
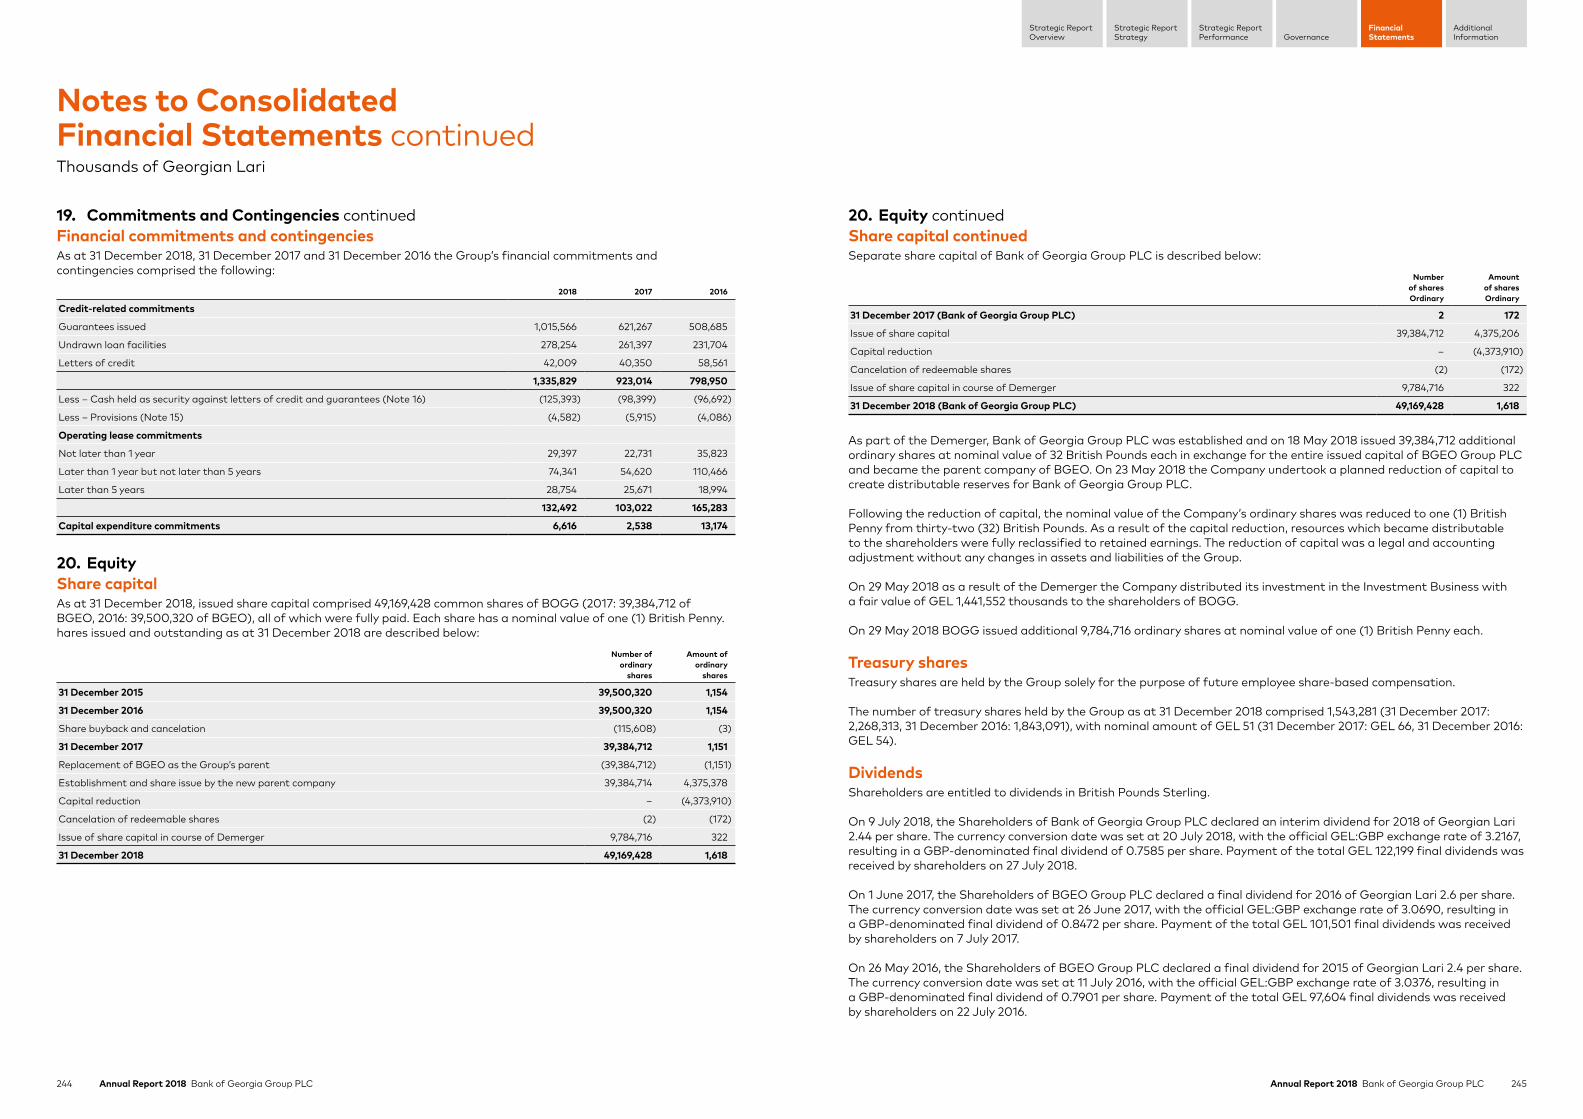
244 Annual Report 2018 Bank of Georgia Group PLC 245Annual Report 2018 Bank of Georgia Group PLC
Strategic ReportStrategy
Strategic ReportPerformance Governance
FinancialStatements
AdditionalInformation
Strategic ReportOverview
19. Commitments and Contingencies continuedFinancial commitments and contingenciesAs at 31 December 2018, 31 December 2017 and 31 December 2016 the Group’s financial commitments and contingencies comprised the following:
2018 2017 2016
Credit-related commitments
Guarantees issued 1,015,566 621,267 508,685
Undrawn loan facilities 278,254 261,397 231,704
Letters of credit 42,009 40,350 58,561
1,335,829 923,014 798,950
Less – Cash held as security against letters of credit and guarantees (Note 16) (125,393) (98,399) (96,692)
Less – Provisions (Note 15) (4,582) (5,915) (4,086)
Operating lease commitments
Not later than 1 year 29,397 22,731 35,823
Later than 1 year but not later than 5 years 74,341 54,620 110,466
Later than 5 years 28,754 25,671 18,994
132,492 103,022 165,283
Capital expenditure commitments 6,616 2,538 13,174
20. EquityShare capitalAs at 31 December 2018, issued share capital comprised 49,169,428 common shares of BOGG (2017: 39,384,712 of BGEO, 2016: 39,500,320 of BGEO), all of which were fully paid. Each share has a nominal value of one (1) British Penny. hares issued and outstanding as at 31 December 2018 are described below:
Number of ordinary
shares
Amount of ordinary
shares
31 December 2015 39,500,320 1,154
31 December 2016 39,500,320 1,154
Share buyback and cancelation (115,608) (3)
31 December 2017 39,384,712 1,151
Replacement of BGEO as the Group’s parent (39,384,712) (1,151)
Establishment and share issue by the new parent company 39,384,714 4,375,378
Capital reduction – (4,373,910)
Cancelation of redeemable shares (2) (172)
Issue of share capital in course of Demerger 9,784,716 322
31 December 2018 49,169,428 1,618
Notes to Consolidated Financial Statements continuedThousands of Georgian Lari
20. Equity continuedShare capital continued Separate share capital of Bank of Georgia Group PLC is described below:
Number of shares Ordinary
Amount of shares Ordinary
31 December 2017 (Bank of Georgia Group PLC) 2 172
Issue of share capital 39,384,712 4,375,206
Capital reduction – (4,373,910)
Cancelation of redeemable shares (2) (172)
Issue of share capital in course of Demerger 9,784,716 322
31 December 2018 (Bank of Georgia Group PLC) 49,169,428 1,618
As part of the Demerger, Bank of Georgia Group PLC was established and on 18 May 2018 issued 39,384,712 additional ordinary shares at nominal value of 32 British Pounds each in exchange for the entire issued capital of BGEO Group PLC and became the parent company of BGEO. On 23 May 2018 the Company undertook a planned reduction of capital to create distributable reserves for Bank of Georgia Group PLC.
Following the reduction of capital, the nominal value of the Company’s ordinary shares was reduced to one (1) British Penny from thirty-two (32) British Pounds. As a result of the capital reduction, resources which became distributable to the shareholders were fully reclassified to retained earnings. The reduction of capital was a legal and accounting adjustment without any changes in assets and liabilities of the Group.
On 29 May 2018 as a result of the Demerger the Company distributed its investment in the Investment Business with a fair value of GEL 1,441,552 thousands to the shareholders of BOGG.
On 29 May 2018 BOGG issued additional 9,784,716 ordinary shares at nominal value of one (1) British Penny each.
Treasury sharesTreasury shares are held by the Group solely for the purpose of future employee share-based compensation.
The number of treasury shares held by the Group as at 31 December 2018 comprised 1,543,281 (31 December 2017: 2,268,313, 31 December 2016: 1,843,091), with nominal amount of GEL 51 (31 December 2017: GEL 66, 31 December 2016: GEL 54).
DividendsShareholders are entitled to dividends in British Pounds Sterling.
On 9 July 2018, the Shareholders of Bank of Georgia Group PLC declared an interim dividend for 2018 of Georgian Lari 2.44 per share. The currency conversion date was set at 20 July 2018, with the official GEL:GBP exchange rate of 3.2167, resulting in a GBP-denominated final dividend of 0.7585 per share. Payment of the total GEL 122,199 final dividends was received by shareholders on 27 July 2018.
On 1 June 2017, the Shareholders of BGEO Group PLC declared a final dividend for 2016 of Georgian Lari 2.6 per share. The currency conversion date was set at 26 June 2017, with the official GEL:GBP exchange rate of 3.0690, resulting in a GBP-denominated final dividend of 0.8472 per share. Payment of the total GEL 101,501 final dividends was received by shareholders on 7 July 2017.
On 26 May 2016, the Shareholders of BGEO Group PLC declared a final dividend for 2015 of Georgian Lari 2.4 per share. The currency conversion date was set at 11 July 2016, with the official GEL:GBP exchange rate of 3.0376, resulting in a GBP-denominated final dividend of 0.7901 per share. Payment of the total GEL 97,604 final dividends was received by shareholders on 22 July 2016.

246 Annual Report 2018 Bank of Georgia Group PLC 247Annual Report 2018 Bank of Georgia Group PLC
Strategic ReportStrategy
Strategic ReportPerformance Governance
FinancialStatements
AdditionalInformation
Strategic ReportOverview
20. Equity continuedNature and purpose of Other ReservesRevaluation reserve for property and equipment reclassified to investment propertyThe revaluation reserve for property and equipment is used to record increases in fair value upon transfers of items from property and equipment to investment property and decreases to the extent that such decrease relates to an increase on the same asset previously recognised in equity.
Unrealised gains (losses) on investment securitiesThis reserve records fair value changes on investment securities.
Unrealised gains (losses) from dilution or sale/acquisition of shares in existing subsidiariesThis reserve records unrealised gains (losses) from dilution or sale/acquisition of shares in existing subsidiaries.
Foreign currency translation reserveThe foreign currency translation reserve is used to record exchange differences arising from the translation of the financial statements of subsidiaries with functional currency other than GEL.
Movements in other reserves during the years ended 31 December 2018, 31 December 2017 and 31 December 2016 are presented in the statements of other comprehensive income.
Earnings per share2018 2017 2016
Basic earnings per share
Profit for the year attributable to ordinary shareholders of the Group 468,996 437,615 398,538
Profit for the year from continuing operations attributable to ordinary shareholders of the Group 379,313 362,971 293,773
Profit for the year from discontinued operations attributable to ordinary shareholders of the Group 89,683 74,644 104,765
Weighted average number of ordinary shares outstanding during the year 43,512,857 37,697,497 38,266,383
Basic earnings per share 10.7783 11.6086 10.4148
Earnings per share from continuing operations 8.7173 9.6285 7.6771
Earnings per share from discontinued operations 2.0610 1.9801 2.7377
2018 2017 2016
Diluted earnings per share
Effect of dilution on weighted average number of ordinary shares:
Dilutive unvested share options 267,419 1,825,434 1,233,937
Weighted average number of ordinary shares adjusted for the effect of dilution 43,780,276 39,522,931 39,500,320
Diluted earnings per share 10.7125 11.0724 10.0895
Diluted earnings per share from continuing operations 8.6640 9.1838 7.4372
Diluted earnings per share from discontinued operations 2.0485 1.8886 2.6523
Notes to Consolidated Financial Statements continuedThousands of Georgian Lari
21. Net Interest Income2018 2017 2016
Interest income calculated using EIR method 1,302,906 1,117,770 915,609
From loans to customers 1,143,123 989,652 817,021
From investment securities 134,952 110,991 90,601
From amounts due from credit institutions 28,738 17,127 7,987
Net loss on modification of financial assets (3,907) – –
Other interest income 19,391 14,144 10,420
From finance lease receivable 17,947 14,144 10,420
From loans and advances to customers measured at FVTPL 1,444 – –
Interest Expense (574,589) (459,379) (377,908)
On client deposits and notes (250,302) (209,374) (188,582)
On amounts owed to credit institutions (206,104) (170,076) (127,843)
On debt securities issued (118,183) (79,929) (61,483)
Deposit insurance fees (5,955) – –
Net Interest Income 741,753 672,535 548,121
22. Net Fee and Commission Income2018 2017 2016
Settlements operations 185,118 153,529 129,792
Guarantees and letters of credit 18,852 17,378 18,893
Cash operations 13,032 13,238 12,965
Currency conversion operations 1,690 446 585
Brokerage service fees 2,639 1,766 1,040
Advisory 3,628 – 1,379
Other 3,810 4,035 4,927
Fee and commission income 228,769 190,392 169,581
Settlements operations (62,923) (48,103) (34,304)
Cash operations (5,145) (5,156) (5,807)
Guarantees and letters of credit (1,630) (2,192) (2,880)
Insurance brokerage service fees (3,667) (3,148) (2,431)
Currency conversion operations (446) (27) (20)
Advisory (55) – –
Other (2,241) (1,716) (1,662)
Fee and commission expense (76,107) (60,342) (47,104)
Net fee and commission income 152,662 130,050 122,477

248 Annual Report 2018 Bank of Georgia Group PLC 249Annual Report 2018 Bank of Georgia Group PLC
Strategic ReportStrategy
Strategic ReportPerformance Governance
FinancialStatements
AdditionalInformation
Strategic ReportOverview
22. Net Fee and Commission Income continuedRevenue from customersThe Group has recognised the following amounts relating to revenue from contracts with customers in the income statement:
2018 2017
Total revenue from contracts with customers from continuing operations 244,884 197,882
Total revenue from contracts with customers from discontinued operations – 942,212
Total revenue from contracts with customers 244,884 1,140,094
Contract assets and liabilitiesThe Group has recognised the following revenue-related contract assets and liabilities:
31 December 2018 31 December 2017
Accruals and deferred income 24,200 89,052
Accounts receivable and other loans* (i) – 116,669
* Includes GEL 82,169 as at 31 December 2017 presented in disposal group held for sale.(i) Accounts receivable have increased as the Group’s beverage business launched its first mainstream beer production in June 2017 and accelerated its expansion into all
of its three main segments.
Accounts receivable are recognised when the right to consideration becomes unconditional. Deferred revenue is recognised as revenue as we perform under the contract.
The Group does not adjust the promised amount of consideration for the effects of a significant financing component if the Group expects, at contract inception, that the period between when the Group transfers a promised good or service to a customer and when the customer pays for that good or service will be one year or less.
The Group recognised GEL 6,873 revenue from continuing operations in the current reporting period (2017: GEL 5,531) that relates to carried-forward contract liabilities and is included in the deferred income.
Transaction price allocated to the remaining performance obligationsThe following table includes revenue expected to be recognised in the future related to performance obligations that are unsatisfied at the reporting date:
In the year ending
31 December 2019
In the year ending
31 December 2020
In the year ending
31 December 2021
In 3 to 5 years
In 5 to 10 years Total
Revenue expected to be recognised on active contracts with customers from continuing operations 21,677 9,427 5,533 2,169 152 38,958
In the year ending
31 December 2018
In the year ending
31 December 2019
In the year ending
31 December 2020
In 3 to 5 years
In 5 to 10 years Total
Revenue expected to be recognised on active contracts with customers from continuing operations 16,534 7,336 3,204 3,618 495 31,187
Revenue expected to be recognised on active contracts with customers from discontinued operations 52,029 13,195 4,061 9,841 7,990 87,116
The Group applies the practical expedient in paragraph 121 of IFRS 15 and does not disclose information about remaining performance obligations that have original expected durations of one year or less.
Notes to Consolidated Financial Statements continuedThousands of Georgian Lari
23. Salaries and Other Employee Benefits, and General and Administrative ExpensesSalaries and other employee benefits
2018 2017 2016
Salaries and bonuses (210,227) (192,124) (163,524)
Social security costs (3,725) (3,034) (2,333)
Pension costs (809) (836) (717)
Salaries and other employee benefits (214,761) (195,994) (166,574)
The average number of staff employed by the Group for the years ended 31 December 2018, 31 December 2017 and 31 December 2016 comprised:
2018 2017 2016
The Bank 5,651 5,248 4,729
BNB 699 655 575
Other 885 819 782
Average total number of staff employed 7,235 6,722 6,086
Salaries and bonuses include GEL 46,619, GEL 48,823 and GEL 40,163 of the Equity Compensation Plan costs for the years ended 31 December 2018, 31 December 2017 and 31 December 2016, respectively, associated with the existing share-based compensation scheme approved in the Group (Notes 26 and 30).
General and administrative expenses2018Total
2017Total
2016Total
Occupancy and rent (27,000) (23,569) (18,776)
Marketing and advertising (15,198) (14,112) (11,833)
Legal and other professional services (13,613) (9,763) (10,226)
Repairs and maintenance (13,422) (12,888) (10,387)
Operating taxes (8,360) (7,404) (6,568)
Office supplies (6,275) (6,017) (4,823)
Corporate hospitality and entertainment (5,883) (5,263) (4,896)
Communication (5,611) (5,565) (4,920)
Personnel training and recruitment (5,974) (3,418) (1,646)
Insurance (2,716) (3,262) (1,529)
Security (2,872) (2,237) (1,562)
Travel expenses (1,887) (1,791) (1,214)
Other (3,843) (3,083) (1,772)
General and administrative expenses (112,654) (98,372) (80,152)
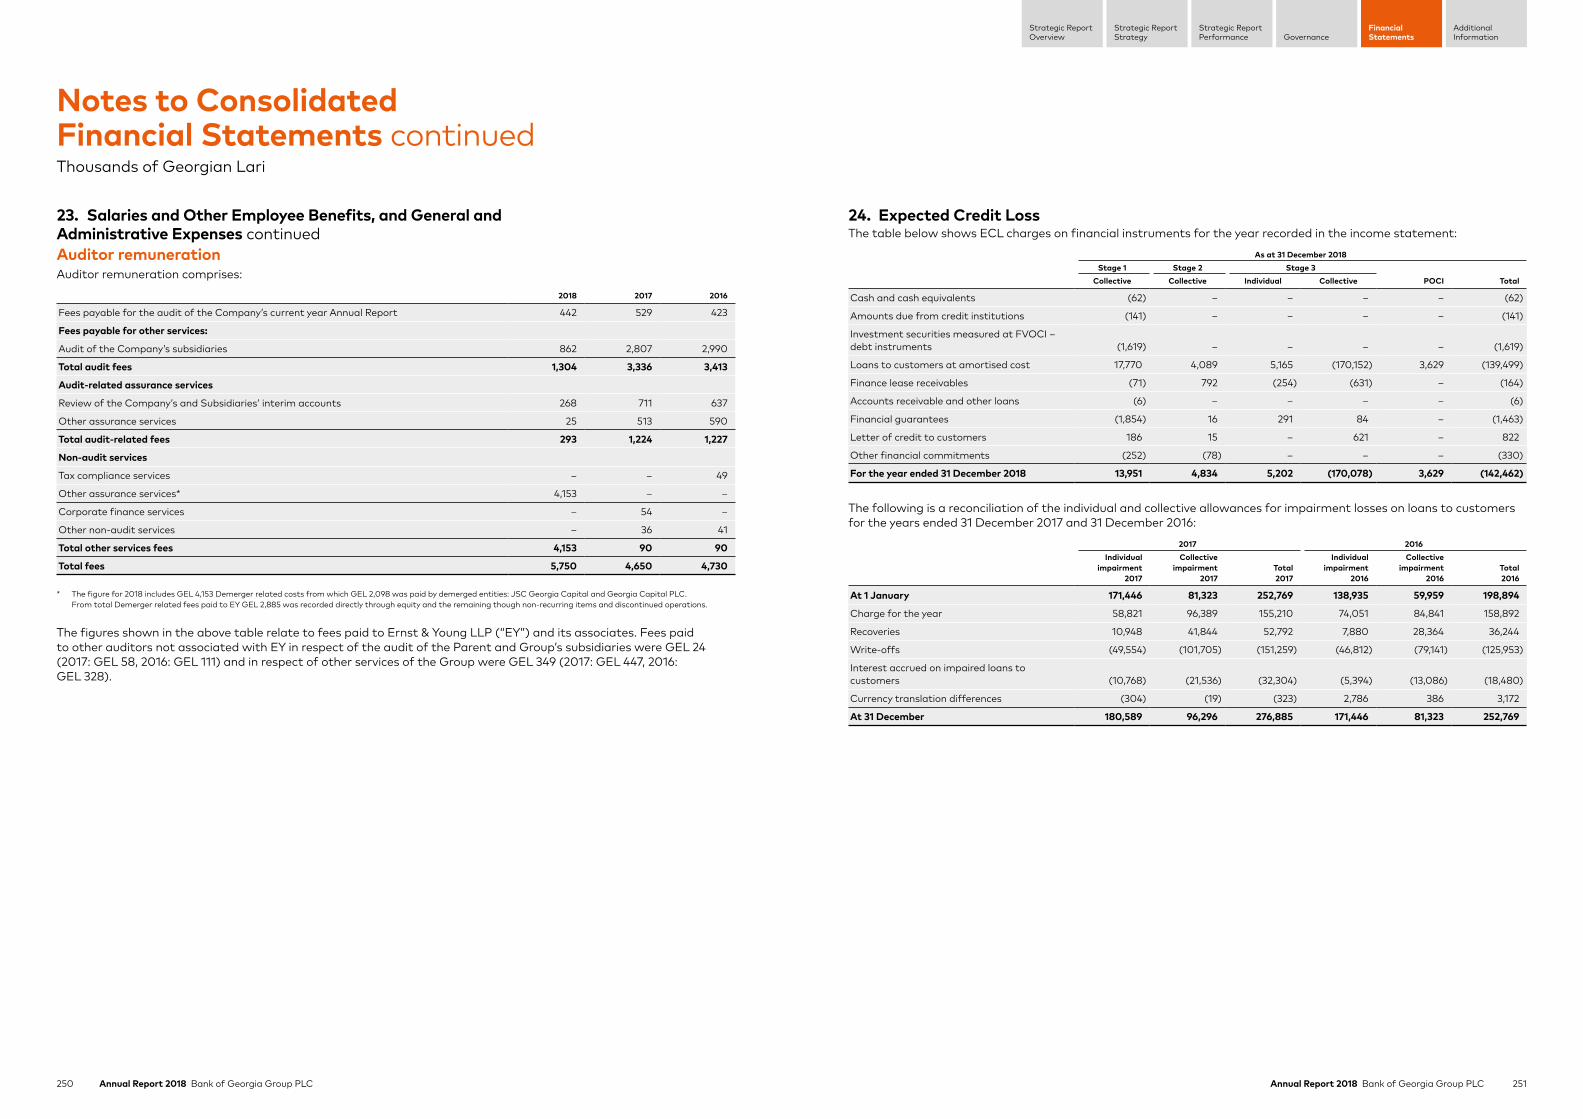
250 Annual Report 2018 Bank of Georgia Group PLC 251Annual Report 2018 Bank of Georgia Group PLC
Strategic ReportStrategy
Strategic ReportPerformance Governance
FinancialStatements
AdditionalInformation
Strategic ReportOverview
23. Salaries and Other Employee Benefits, and General and Administrative Expenses continuedAuditor remunerationAuditor remuneration comprises:
2018 2017 2016
Fees payable for the audit of the Company’s current year Annual Report 442 529 423
Fees payable for other services:
Audit of the Company’s subsidiaries 862 2,807 2,990
Total audit fees 1,304 3,336 3,413
Audit-related assurance services
Review of the Company’s and Subsidiaries’ interim accounts 268 711 637
Other assurance services 25 513 590
Total audit-related fees 293 1,224 1,227
Non-audit services
Tax compliance services – – 49
Other assurance services* 4,153 – –
Corporate finance services – 54 –
Other non-audit services – 36 41
Total other services fees 4,153 90 90
Total fees 5,750 4,650 4,730
* The figure for 2018 includes GEL 4,153 Demerger related costs from which GEL 2,098 was paid by demerged entities: JSC Georgia Capital and Georgia Capital PLC. From total Demerger related fees paid to EY GEL 2,885 was recorded directly through equity and the remaining though non-recurring items and discontinued operations.
The figures shown in the above table relate to fees paid to Ernst & Young LLP (“EY”) and its associates. Fees paid to other auditors not associated with EY in respect of the audit of the Parent and Group’s subsidiaries were GEL 24 (2017: GEL 58, 2016: GEL 111) and in respect of other services of the Group were GEL 349 (2017: GEL 447, 2016: GEL 328).
Notes to Consolidated Financial Statements continuedThousands of Georgian Lari
24. Expected Credit LossThe table below shows ECL charges on financial instruments for the year recorded in the income statement:
As at 31 December 2018Stage 1 Stage 2 Stage 3
POCI TotalCollective Collective Individual Collective
Cash and cash equivalents (62) – – – – (62)
Amounts due from credit institutions (141) – – – – (141)
Investment securities measured at FVOCI – debt instruments (1,619) – – – – (1,619)
Loans to customers at amortised cost 17,770 4,089 5,165 (170,152) 3,629 (139,499)
Finance lease receivables (71) 792 (254) (631) – (164)
Accounts receivable and other loans (6) – – – – (6)
Financial guarantees (1,854) 16 291 84 – (1,463)
Letter of credit to customers 186 15 – 621 – 822
Other financial commitments (252) (78) – – – (330)
For the year ended 31 December 2018 13,951 4,834 5,202 (170,078) 3,629 (142,462)
The following is a reconciliation of the individual and collective allowances for impairment losses on loans to customers for the years ended 31 December 2017 and 31 December 2016:
2017 2016Individual
impairment2017
Collective impairment
2017Total2017
Individual impairment
2016
Collective impairment
2016Total2016
At 1 January 171,446 81,323 252,769 138,935 59,959 198,894
Charge for the year 58,821 96,389 155,210 74,051 84,841 158,892
Recoveries 10,948 41,844 52,792 7,880 28,364 36,244
Write-offs (49,554) (101,705) (151,259) (46,812) (79,141) (125,953)
Interest accrued on impaired loans to customers (10,768) (21,536) (32,304) (5,394) (13,086) (18,480)
Currency translation differences (304) (19) (323) 2,786 386 3,172
At 31 December 180,589 96,296 276,885 171,446 81,323 252,769
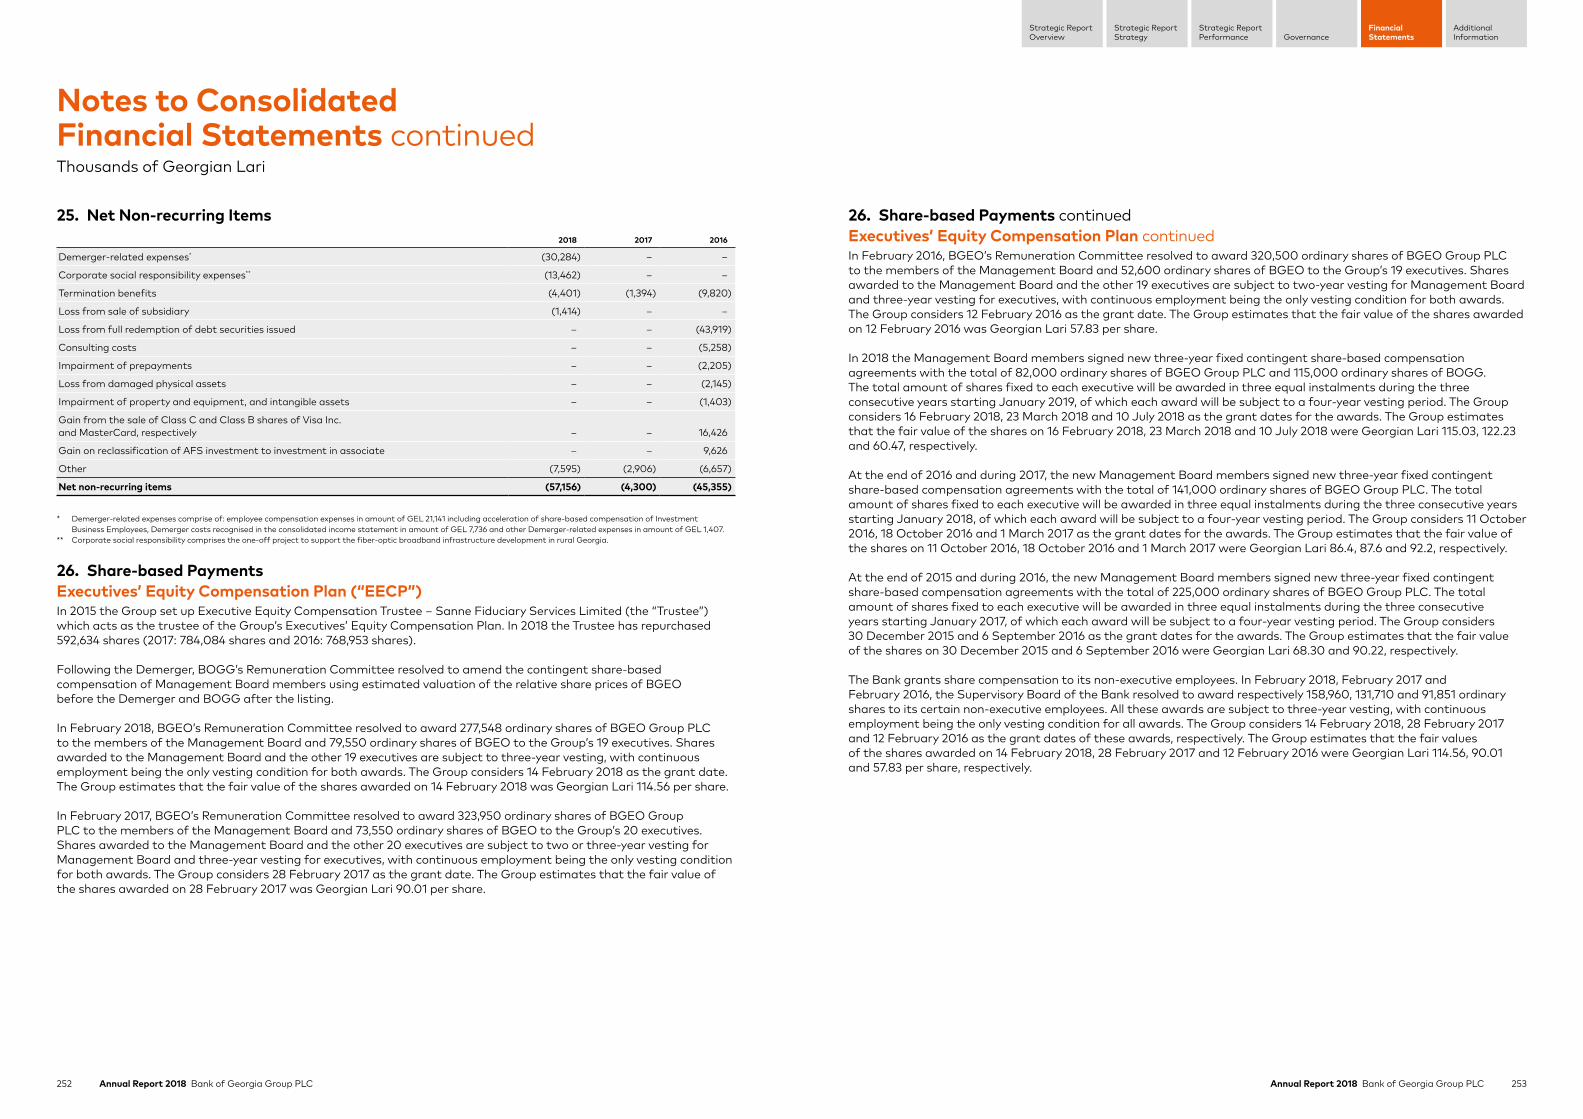
252 Annual Report 2018 Bank of Georgia Group PLC 253Annual Report 2018 Bank of Georgia Group PLC
Strategic ReportStrategy
Strategic ReportPerformance Governance
FinancialStatements
AdditionalInformation
Strategic ReportOverview
25. Net Non-recurring Items2018 2017 2016
Demerger-related expenses* (30,284) – –
Corporate social responsibility expenses** (13,462) – –
Termination benefits (4,401) (1,394) (9,820)
Loss from sale of subsidiary (1,414) – –
Loss from full redemption of debt securities issued – – (43,919)
Consulting costs – – (5,258)
Impairment of prepayments – – (2,205)
Loss from damaged physical assets – – (2,145)
Impairment of property and equipment, and intangible assets – – (1,403)
Gain from the sale of Class C and Class B shares of Visa Inc. and MasterCard, respectively – – 16,426
Gain on reclassification of AFS investment to investment in associate – – 9,626
Other (7,595) (2,906) (6,657)
Net non-recurring items (57,156) (4,300) (45,355)
* Demerger-related expenses comprise of: employee compensation expenses in amount of GEL 21,141 including acceleration of share-based compensation of Investment Business Employees, Demerger costs recognised in the consolidated income statement in amount of GEL 7,736 and other Demerger-related expenses in amount of GEL 1,407.
** Corporate social responsibility comprises the one-off project to support the fiber-optic broadband infrastructure development in rural Georgia.
26. Share-based PaymentsExecutives’ Equity Compensation Plan (“EECP”)In 2015 the Group set up Executive Equity Compensation Trustee – Sanne Fiduciary Services Limited (the “Trustee”) which acts as the trustee of the Group’s Executives’ Equity Compensation Plan. In 2018 the Trustee has repurchased 592,634 shares (2017: 784,084 shares and 2016: 768,953 shares).
Following the Demerger, BOGG’s Remuneration Committee resolved to amend the contingent share-based compensation of Management Board members using estimated valuation of the relative share prices of BGEO before the Demerger and BOGG after the listing.
In February 2018, BGEO’s Remuneration Committee resolved to award 277,548 ordinary shares of BGEO Group PLC to the members of the Management Board and 79,550 ordinary shares of BGEO to the Group’s 19 executives. Shares awarded to the Management Board and the other 19 executives are subject to three-year vesting, with continuous employment being the only vesting condition for both awards. The Group considers 14 February 2018 as the grant date. The Group estimates that the fair value of the shares awarded on 14 February 2018 was Georgian Lari 114.56 per share.
In February 2017, BGEO’s Remuneration Committee resolved to award 323,950 ordinary shares of BGEO Group PLC to the members of the Management Board and 73,550 ordinary shares of BGEO to the Group’s 20 executives. Shares awarded to the Management Board and the other 20 executives are subject to two or three-year vesting for Management Board and three-year vesting for executives, with continuous employment being the only vesting condition for both awards. The Group considers 28 February 2017 as the grant date. The Group estimates that the fair value of the shares awarded on 28 February 2017 was Georgian Lari 90.01 per share.
Notes to Consolidated Financial Statements continuedThousands of Georgian Lari
26. Share-based Payments continuedExecutives’ Equity Compensation Plan continuedIn February 2016, BGEO’s Remuneration Committee resolved to award 320,500 ordinary shares of BGEO Group PLC to the members of the Management Board and 52,600 ordinary shares of BGEO to the Group’s 19 executives. Shares awarded to the Management Board and the other 19 executives are subject to two-year vesting for Management Board and three-year vesting for executives, with continuous employment being the only vesting condition for both awards. The Group considers 12 February 2016 as the grant date. The Group estimates that the fair value of the shares awarded on 12 February 2016 was Georgian Lari 57.83 per share.
In 2018 the Management Board members signed new three-year fixed contingent share-based compensation agreements with the total of 82,000 ordinary shares of BGEO Group PLC and 115,000 ordinary shares of BOGG. The total amount of shares fixed to each executive will be awarded in three equal instalments during the three consecutive years starting January 2019, of which each award will be subject to a four-year vesting period. The Group considers 16 February 2018, 23 March 2018 and 10 July 2018 as the grant dates for the awards. The Group estimates that the fair value of the shares on 16 February 2018, 23 March 2018 and 10 July 2018 were Georgian Lari 115.03, 122.23 and 60.47, respectively.
At the end of 2016 and during 2017, the new Management Board members signed new three-year fixed contingent share-based compensation agreements with the total of 141,000 ordinary shares of BGEO Group PLC. The total amount of shares fixed to each executive will be awarded in three equal instalments during the three consecutive years starting January 2018, of which each award will be subject to a four-year vesting period. The Group considers 11 October 2016, 18 October 2016 and 1 March 2017 as the grant dates for the awards. The Group estimates that the fair value of the shares on 11 October 2016, 18 October 2016 and 1 March 2017 were Georgian Lari 86.4, 87.6 and 92.2, respectively.
At the end of 2015 and during 2016, the new Management Board members signed new three-year fixed contingent share-based compensation agreements with the total of 225,000 ordinary shares of BGEO Group PLC. The total amount of shares fixed to each executive will be awarded in three equal instalments during the three consecutive years starting January 2017, of which each award will be subject to a four-year vesting period. The Group considers 30 December 2015 and 6 September 2016 as the grant dates for the awards. The Group estimates that the fair value of the shares on 30 December 2015 and 6 September 2016 were Georgian Lari 68.30 and 90.22, respectively.
The Bank grants share compensation to its non-executive employees. In February 2018, February 2017 and February 2016, the Supervisory Board of the Bank resolved to award respectively 158,960, 131,710 and 91,851 ordinary shares to its certain non-executive employees. All these awards are subject to three-year vesting, with continuous employment being the only vesting condition for all awards. The Group considers 14 February 2018, 28 February 2017 and 12 February 2016 as the grant dates of these awards, respectively. The Group estimates that the fair values of the shares awarded on 14 February 2018, 28 February 2017 and 12 February 2016 were Georgian Lari 114.56, 90.01 and 57.83 per share, respectively.

254 Annual Report 2018 Bank of Georgia Group PLC 255Annual Report 2018 Bank of Georgia Group PLC
Strategic ReportStrategy
Strategic ReportPerformance Governance
FinancialStatements
AdditionalInformation
Strategic ReportOverview
26. Share-based Payments continuedSummaryFair value of the shares granted at the measurement date is determined based on available market quotations.
The weighted average fair value of share-based awards at the grant date comprised Georgian Lari 106.90 per share in the year ended 31 December 2018 (31 December 2017: Georgian Lari 89.81 per share, 31 December 2016: Georgian Lari 66.19).
The Group’s total share-based payment expenses for the year ended 31 December 2018 comprised GEL 99,335 (31 December 2017: GEL 56,649, 31 December 2016: GEL 45,992) and are included in Salaries and other employee benefits, as Salaries and bonuses.
Below is the summary of the share-based payments-related data:
2018 2017 2016
Total number of equity instruments awarded 713,058 670,210 689,951
– Among them, to top management 474,548 464,950 545,500
Weighted average value at grant date, per share (GEL in full amount) 106.90 89.81 66.19
Value at grant date, total (GEL) 76,225 60,194 45,671
Total expense recognised during the year (GEL)* (99,335) (56,649) (45,992)
* 2018 Expense recognised during the year includes GEL 29,066 recorded in Discontinued operations and GEL 23,650 recorded in Non-recurring expenses.
During 2018, BOGG Directors exercised 131,648 shares (2017: 126,000, 2016: 115,000) with fair value of GEL 15,339 (2017: GEL 12,049, 2016: GEL 10,760). Weighted average share price comprised GEL 116.52 per share (2017: GEL 95.63, 2016: GEL 93.57).
27. Risk ManagementIntroductionRisk is inherent in the Group’s activities but it is managed through a process of ongoing identification, measurement and monitoring, subject to risk limits and other controls. This process of risk management is critical to the Group’s continuing profitability and each individual within the Group is accountable for the risk exposures relating to his or her responsibilities. The Group is exposed to credit risk, liquidity risk and market risk, the latter being subdivided into trading and non-trading risks. It is also subject to operational risks.
The independent risk control process does not include business risks such as changes in the environment, technology and industry. They are monitored through the Group’s strategic planning process.
Risk Management structureAudit CommitteeThe Audit Committee assists the Board in relation to the oversight of the Group’s financial and reporting processes. It monitors the integrity of the financial statements and is responsible for governance around both the Internal Audit function and external auditor, reporting back to the Board. It reviews the effectiveness of the policies, procedures and systems in place related to, among others, operational risks, compliance, IT and Internal Security (including cyber-security) and works closely with the Risk Committee in connection with assessing the effectiveness of the risk management and internal control framework.
Risk CommitteeThe Risk Committee assists the Board in relation to the oversight of risk. It reviews the Group’s risk appetite in line with strategy, identifies and monitors risk exposure and the risk management infrastructure, oversees the implementation of strategy to address risk, and in conjunction with the Audit Committee, assesses the strength and effectiveness of the risk management and internal control framework.
Notes to Consolidated Financial Statements continuedThousands of Georgian Lari
27. Risk Management continuedIntroduction continuedManagement BoardThe Management Board has overall responsibility for the Bank’s asset, liability and Risk Management activities, policies and procedures. In order to effectively implement the Risk Management system, the Management Board delegates individual Risk Management functions to each of the various decision-making and execution bodies within the Bank.
Bank Asset and Liability Management CommitteeThe Bank’s Asset and Liability Management Committee (“ALCO”) is the core Risk Management body that establishes policies and guidelines with respect to capital adequacy, market risks and respective limits, funding liquidity risk and respective limits, interest rate and prepayment risks and respective limits, money market general terms and credit exposure limits, that designs and implements respective Risk Management and stress testing models in practice and regularly monitors compliance with the pre-set risk limits.
Internal AuditThe Internal Audit department is responsible for the annual audit of the Group’s Risk Management, internal control and corporate governance processes, with the aim of reducing the levels of operational and other risks, auditing the Group’s internal control systems and detecting any infringements or errors on the part of the Group’s departments and divisions. It examines both the adequacy of and the Group’s compliance with those procedures. The Group’s Internal Audit department discusses the results of all assessments with management, and reports its findings and recommendations to the Audit Committee.
Risk measurement and reporting systemsThe Group’s risks are measured using a method which reflects the expected loss likely to arise in both normal circumstances and unexpected losses, which are an estimate of the ultimate actual loss based on different forecasting models. The models make use of probabilities derived from historical experience, adjusted to reflect the economic environment. The Group runs three different basic scenarios, of which one is Base Case (forecast under normal business conditions) and the other two are Troubled and Distressed Scenarios, which are worse and worst case scenarios, respectively, that would arise in the event that extreme events which are unlikely to occur do, in fact, occur.
Monitoring and controlling risks is primarily performed based on limits established by the Group. These limits reflect the business strategy and market environment of the Group as well as the level of risk that the Group is willing to accept, with additional emphasis on selected industries. In addition, the Group monitors and measures the overall risk bearing capacity in relation to the aggregate risk exposure across all risks types and activities.
Information compiled from all the businesses is examined and processed in order to analyse, control and identify early risks. This information is presented and explained to the Management Board, and the head of each business division. The reports include aggregate credit exposures and their limits, exceptions to those limits, liquidity ratios and liquidity limits, market risk ratios and their limits, and changes to the risk profile. Senior management assesses the appropriateness of the expected credit loss on a monthly basis. The Management Board receives a comprehensive credit risk report and ALCO report once a month. These reports are designed to provide all the necessary information to assess and conclude on the risks of the Group.
For all levels throughout the Group, specifically tailored risk reports are prepared and distributed in order to ensure that all business divisions have access to extensive, relevant and up-to-date information.
A daily briefing is given to the Management Board and all other relevant employees of the Group on the utilisation of market limits, proprietary investments and liquidity, plus any other risk developments.
Risk mitigationAs part of its overall Risk Management, the Group uses derivatives and other instruments to manage exposures resulting from changes in interest rates, foreign currencies, equity risks, credit risks, and exposures arising from forecast transactions. While these are intended for hedging, they do not qualify for hedge accounting.
The Group actively uses collateral to reduce its credit risks (see on for more detail).
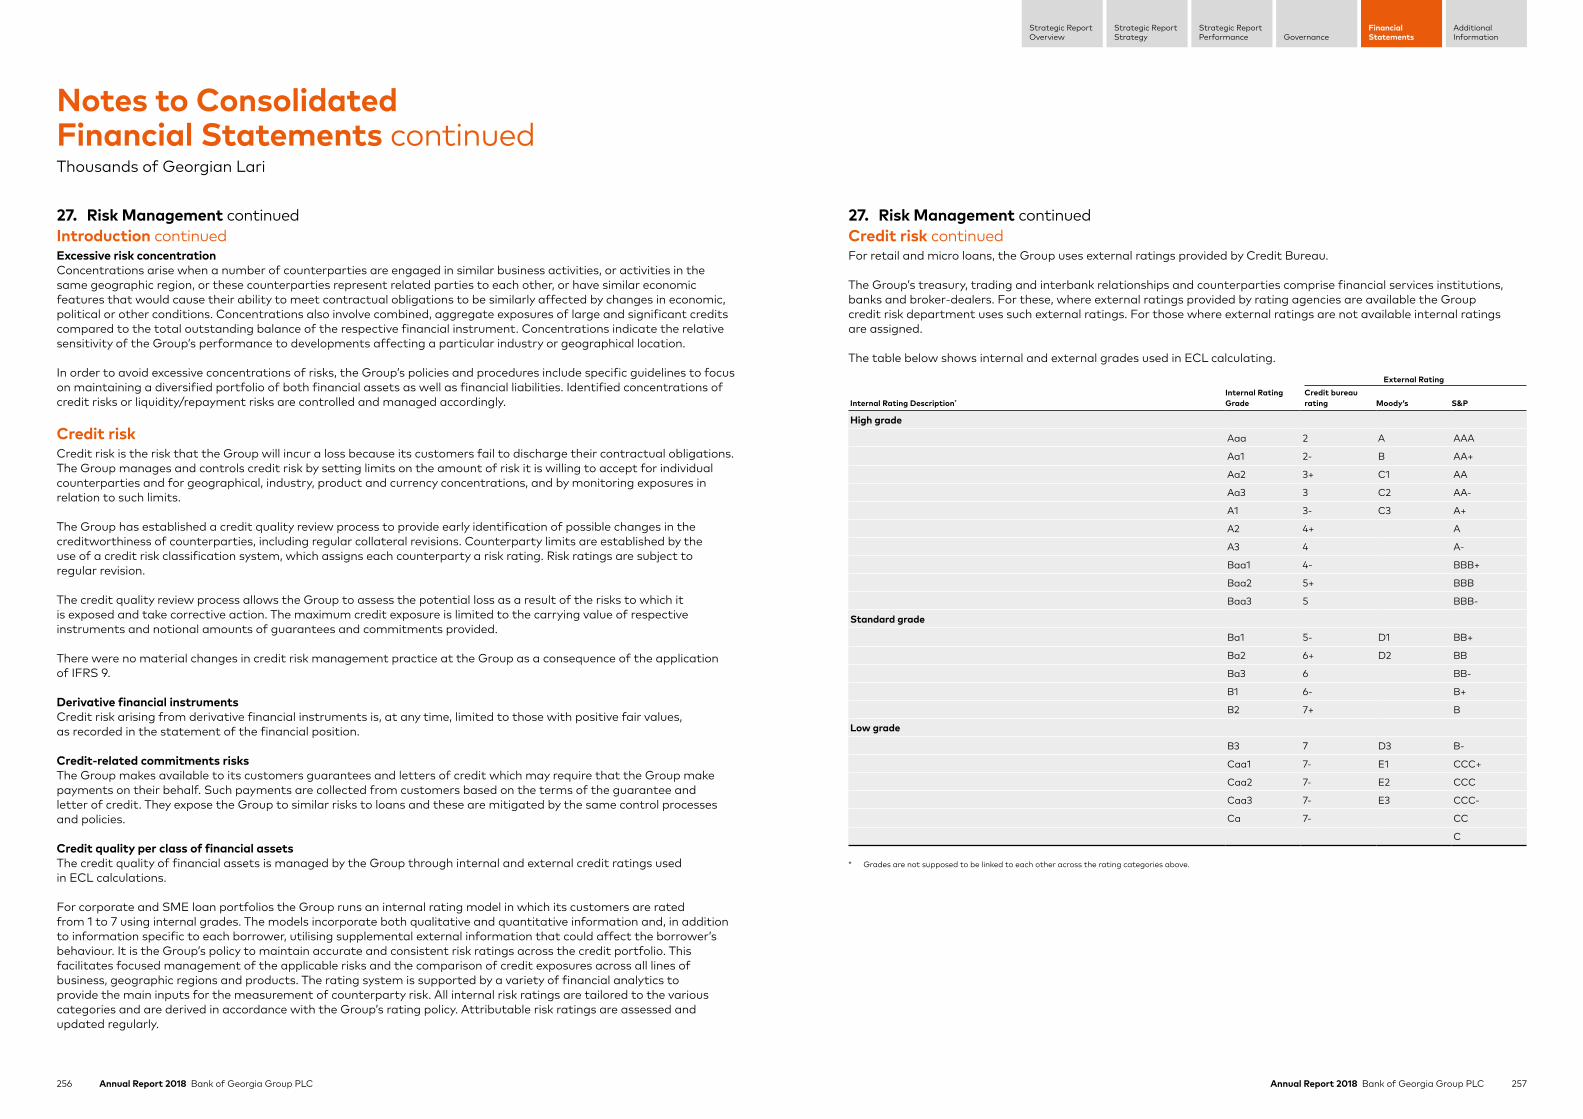
256 Annual Report 2018 Bank of Georgia Group PLC 257Annual Report 2018 Bank of Georgia Group PLC
Strategic ReportStrategy
Strategic ReportPerformance Governance
FinancialStatements
AdditionalInformation
Strategic ReportOverview
27. Risk Management continuedIntroduction continuedExcessive risk concentrationConcentrations arise when a number of counterparties are engaged in similar business activities, or activities in the same geographic region, or these counterparties represent related parties to each other, or have similar economic features that would cause their ability to meet contractual obligations to be similarly affected by changes in economic, political or other conditions. Concentrations also involve combined, aggregate exposures of large and significant credits compared to the total outstanding balance of the respective financial instrument. Concentrations indicate the relative sensitivity of the Group’s performance to developments affecting a particular industry or geographical location.
In order to avoid excessive concentrations of risks, the Group’s policies and procedures include specific guidelines to focus on maintaining a diversified portfolio of both financial assets as well as financial liabilities. Identified concentrations of credit risks or liquidity/repayment risks are controlled and managed accordingly.
Credit riskCredit risk is the risk that the Group will incur a loss because its customers fail to discharge their contractual obligations. The Group manages and controls credit risk by setting limits on the amount of risk it is willing to accept for individual counterparties and for geographical, industry, product and currency concentrations, and by monitoring exposures in relation to such limits.
The Group has established a credit quality review process to provide early identification of possible changes in the creditworthiness of counterparties, including regular collateral revisions. Counterparty limits are established by the use of a credit risk classification system, which assigns each counterparty a risk rating. Risk ratings are subject to regular revision.
The credit quality review process allows the Group to assess the potential loss as a result of the risks to which it is exposed and take corrective action. The maximum credit exposure is limited to the carrying value of respective instruments and notional amounts of guarantees and commitments provided.
There were no material changes in credit risk management practice at the Group as a consequence of the application of IFRS 9.
Derivative financial instrumentsCredit risk arising from derivative financial instruments is, at any time, limited to those with positive fair values, as recorded in the statement of the financial position.
Credit-related commitments risksThe Group makes available to its customers guarantees and letters of credit which may require that the Group make payments on their behalf. Such payments are collected from customers based on the terms of the guarantee and letter of credit. They expose the Group to similar risks to loans and these are mitigated by the same control processes and policies.
Credit quality per class of financial assetsThe credit quality of financial assets is managed by the Group through internal and external credit ratings used in ECL calculations.
For corporate and SME loan portfolios the Group runs an internal rating model in which its customers are rated from 1 to 7 using internal grades. The models incorporate both qualitative and quantitative information and, in addition to information specific to each borrower, utilising supplemental external information that could affect the borrower’s behaviour. It is the Group’s policy to maintain accurate and consistent risk ratings across the credit portfolio. This facilitates focused management of the applicable risks and the comparison of credit exposures across all lines of business, geographic regions and products. The rating system is supported by a variety of financial analytics to provide the main inputs for the measurement of counterparty risk. All internal risk ratings are tailored to the various categories and are derived in accordance with the Group’s rating policy. Attributable risk ratings are assessed and updated regularly.
Notes to Consolidated Financial Statements continuedThousands of Georgian Lari
27. Risk Management continuedCredit risk continuedFor retail and micro loans, the Group uses external ratings provided by Credit Bureau.
The Group’s treasury, trading and interbank relationships and counterparties comprise financial services institutions, banks and broker-dealers. For these, where external ratings provided by rating agencies are available the Group credit risk department uses such external ratings. For those where external ratings are not available internal ratings are assigned.
The table below shows internal and external grades used in ECL calculating.
Internal Rating Description*
Internal Rating Grade
External RatingCredit bureau rating Moody’s S&P
High grade
Aaa 2 A AAA
Aa1 2- B AA+
Aa2 3+ C1 AA
Aa3 3 C2 AA-
A1 3- C3 A+
A2 4+ A
A3 4 A-
Baa1 4- BBB+
Baa2 5+ BBB
Baa3 5 BBB-
Standard grade
Ba1 5- D1 BB+
Ba2 6+ D2 BB
Ba3 6 BB-
B1 6- B+
B2 7+ B
Low grade
B3 7 D3 B-
Caa1 7- E1 CCC+
Caa2 7- E2 CCC
Caa3 7- E3 CCC-
Ca 7- CC
C
* Grades are not supposed to be linked to each other across the rating categories above.
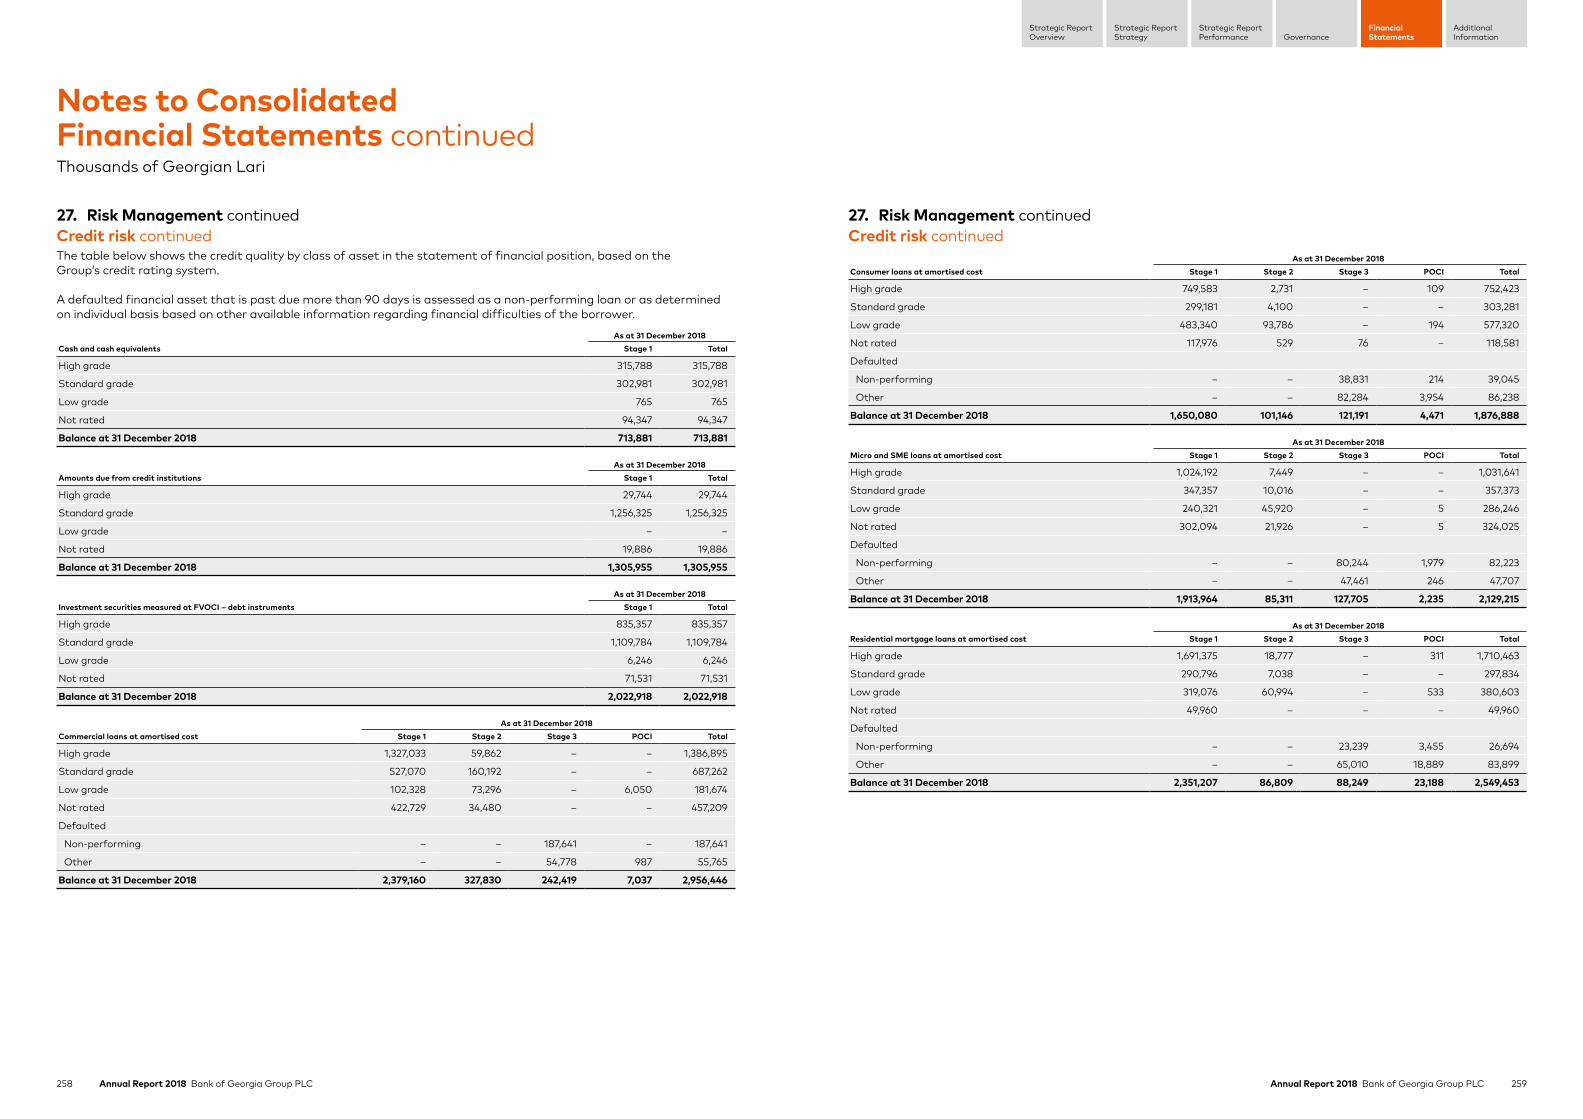
258 Annual Report 2018 Bank of Georgia Group PLC 259Annual Report 2018 Bank of Georgia Group PLC
Strategic ReportStrategy
Strategic ReportPerformance Governance
FinancialStatements
AdditionalInformation
Strategic ReportOverview
27. Risk Management continuedCredit risk continuedThe table below shows the credit quality by class of asset in the statement of financial position, based on the Group’s credit rating system.
A defaulted financial asset that is past due more than 90 days is assessed as a non-performing loan or as determined on individual basis based on other available information regarding financial difficulties of the borrower.
Cash and cash equivalentsAs at 31 December 2018
Stage 1 Total
High grade 315,788 315,788
Standard grade 302,981 302,981
Low grade 765 765
Not rated 94,347 94,347
Balance at 31 December 2018 713,881 713,881
Amounts due from credit institutionsAs at 31 December 2018
Stage 1 Total
High grade 29,744 29,744
Standard grade 1,256,325 1,256,325
Low grade – –
Not rated 19,886 19,886
Balance at 31 December 2018 1,305,955 1,305,955
Investment securities measured at FVOCI – debt instrumentsAs at 31 December 2018
Stage 1 Total
High grade 835,357 835,357
Standard grade 1,109,784 1,109,784
Low grade 6,246 6,246
Not rated 71,531 71,531
Balance at 31 December 2018 2,022,918 2,022,918
Commercial loans at amortised costAs at 31 December 2018
Stage 1 Stage 2 Stage 3 POCI Total
High grade 1,327,033 59,862 – – 1,386,895
Standard grade 527,070 160,192 – – 687,262
Low grade 102,328 73,296 – 6,050 181,674
Not rated 422,729 34,480 – – 457,209
Defaulted
Non-performing – – 187,641 – 187,641
Other – – 54,778 987 55,765
Balance at 31 December 2018 2,379,160 327,830 242,419 7,037 2,956,446
Notes to Consolidated Financial Statements continuedThousands of Georgian Lari
27. Risk Management continuedCredit risk continued
Consumer loans at amortised costAs at 31 December 2018
Stage 1 Stage 2 Stage 3 POCI Total
High grade 749,583 2,731 – 109 752,423
Standard grade 299,181 4,100 – – 303,281
Low grade 483,340 93,786 – 194 577,320
Not rated 117,976 529 76 – 118,581
Defaulted
Non-performing – – 38,831 214 39,045
Other – – 82,284 3,954 86,238
Balance at 31 December 2018 1,650,080 101,146 121,191 4,471 1,876,888
Micro and SME loans at amortised costAs at 31 December 2018
Stage 1 Stage 2 Stage 3 POCI Total
High grade 1,024,192 7,449 – – 1,031,641
Standard grade 347,357 10,016 – – 357,373
Low grade 240,321 45,920 – 5 286,246
Not rated 302,094 21,926 – 5 324,025
Defaulted
Non-performing – – 80,244 1,979 82,223
Other – – 47,461 246 47,707
Balance at 31 December 2018 1,913,964 85,311 127,705 2,235 2,129,215
Residential mortgage loans at amortised costAs at 31 December 2018
Stage 1 Stage 2 Stage 3 POCI Total
High grade 1,691,375 18,777 – 311 1,710,463
Standard grade 290,796 7,038 – – 297,834
Low grade 319,076 60,994 – 533 380,603
Not rated 49,960 – – – 49,960
Defaulted
Non-performing – – 23,239 3,455 26,694
Other – – 65,010 18,889 83,899
Balance at 31 December 2018 2,351,207 86,809 88,249 23,188 2,549,453
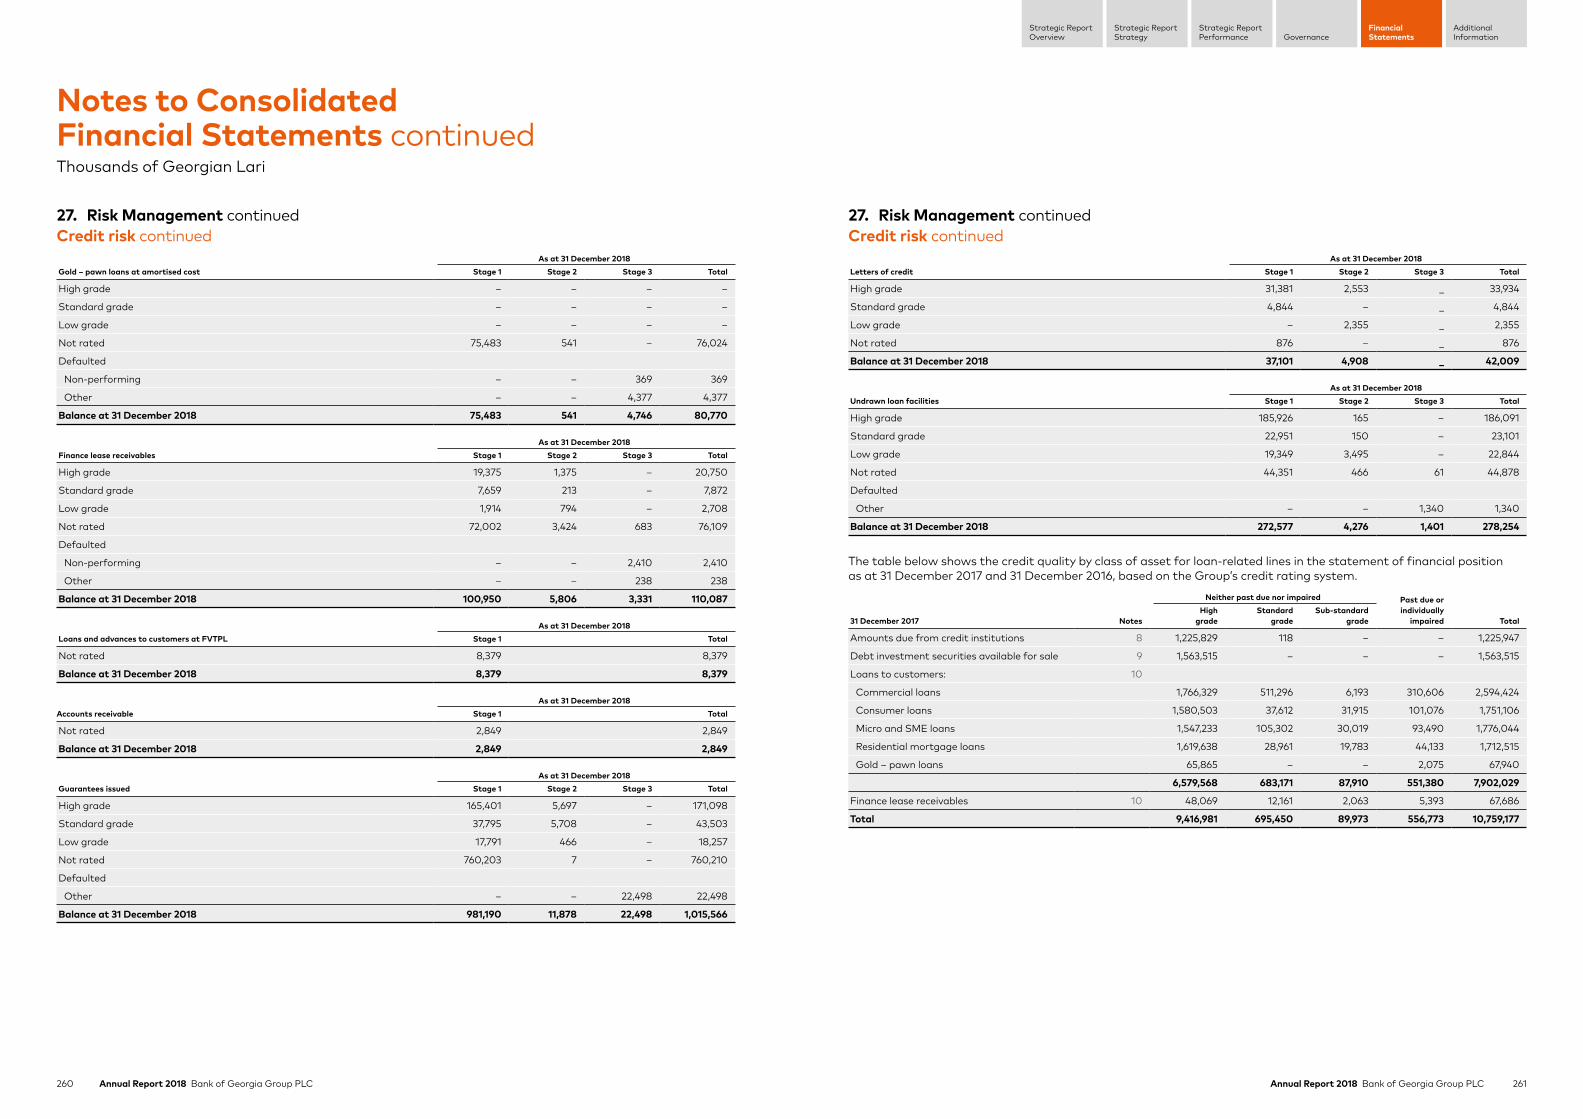
260 Annual Report 2018 Bank of Georgia Group PLC 261Annual Report 2018 Bank of Georgia Group PLC
Strategic ReportStrategy
Strategic ReportPerformance Governance
FinancialStatements
AdditionalInformation
Strategic ReportOverview
27. Risk Management continuedCredit risk continued
Gold – pawn loans at amortised costAs at 31 December 2018
Stage 1 Stage 2 Stage 3 Total
High grade – – – –
Standard grade – – – –
Low grade – – – –
Not rated 75,483 541 – 76,024
Defaulted
Non-performing – – 369 369
Other – – 4,377 4,377
Balance at 31 December 2018 75,483 541 4,746 80,770
Finance lease receivablesAs at 31 December 2018
Stage 1 Stage 2 Stage 3 Total
High grade 19,375 1,375 – 20,750
Standard grade 7,659 213 – 7,872
Low grade 1,914 794 – 2,708
Not rated 72,002 3,424 683 76,109
Defaulted
Non-performing – – 2,410 2,410
Other – – 238 238
Balance at 31 December 2018 100,950 5,806 3,331 110,087
Loans and advances to customers at FVTPLAs at 31 December 2018
Stage 1 Total
Not rated 8,379 8,379
Balance at 31 December 2018 8,379 8,379
Accounts receivableAs at 31 December 2018
Stage 1 Total
Not rated 2,849 2,849
Balance at 31 December 2018 2,849 2,849
Guarantees issuedAs at 31 December 2018
Stage 1 Stage 2 Stage 3 Total
High grade 165,401 5,697 – 171,098
Standard grade 37,795 5,708 – 43,503
Low grade 17,791 466 – 18,257
Not rated 760,203 7 – 760,210
Defaulted
Other – – 22,498 22,498
Balance at 31 December 2018 981,190 11,878 22,498 1,015,566
Notes to Consolidated Financial Statements continuedThousands of Georgian Lari
27. Risk Management continuedCredit risk continued
Letters of creditAs at 31 December 2018
Stage 1 Stage 2 Stage 3 Total
High grade 31,381 2,553 _ 33,934
Standard grade 4,844 – _ 4,844
Low grade – 2,355 _ 2,355
Not rated 876 – _ 876
Balance at 31 December 2018 37,101 4,908 _ 42,009
Undrawn loan facilitiesAs at 31 December 2018
Stage 1 Stage 2 Stage 3 Total
High grade 185,926 165 – 186,091
Standard grade 22,951 150 – 23,101
Low grade 19,349 3,495 – 22,844
Not rated 44,351 466 61 44,878
Defaulted
Other – – 1,340 1,340
Balance at 31 December 2018 272,577 4,276 1,401 278,254
The table below shows the credit quality by class of asset for loan-related lines in the statement of financial position as at 31 December 2017 and 31 December 2016, based on the Group’s credit rating system.
31 December 2017 Notes
Neither past due nor impaired Past due or individually
impaired TotalHigh
gradeStandard
gradeSub-standard
grade
Amounts due from credit institutions 8 1,225,829 118 – – 1,225,947
Debt investment securities available for sale 9 1,563,515 – – – 1,563,515
Loans to customers: 10
Commercial loans 1,766,329 511,296 6,193 310,606 2,594,424
Consumer loans 1,580,503 37,612 31,915 101,076 1,751,106
Micro and SME loans 1,547,233 105,302 30,019 93,490 1,776,044
Residential mortgage loans 1,619,638 28,961 19,783 44,133 1,712,515
Gold – pawn loans 65,865 – – 2,075 67,940
6,579,568 683,171 87,910 551,380 7,902,029
Finance lease receivables 10 48,069 12,161 2,063 5,393 67,686
Total 9,416,981 695,450 89,973 556,773 10,759,177
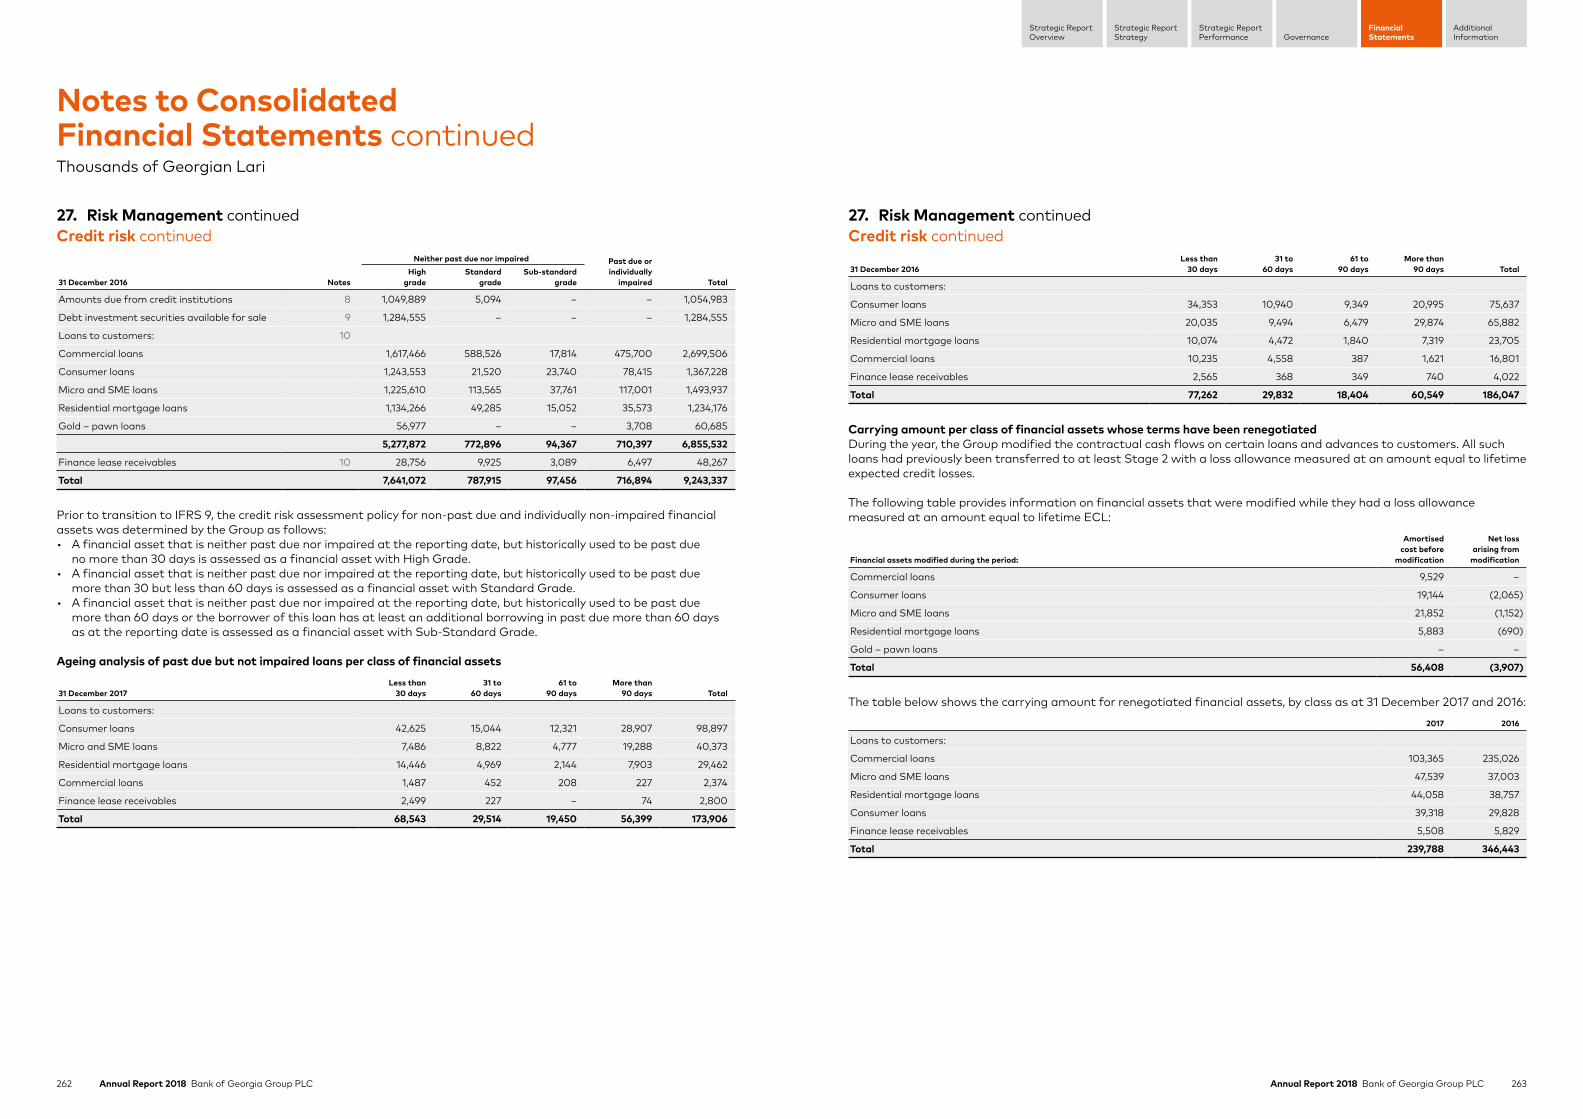
262 Annual Report 2018 Bank of Georgia Group PLC 263Annual Report 2018 Bank of Georgia Group PLC
Strategic ReportStrategy
Strategic ReportPerformance Governance
FinancialStatements
AdditionalInformation
Strategic ReportOverview
27. Risk Management continuedCredit risk continued
31 December 2016 Notes
Neither past due nor impaired Past due or individually
impaired TotalHigh
gradeStandard
gradeSub-standard
grade
Amounts due from credit institutions 8 1,049,889 5,094 – – 1,054,983
Debt investment securities available for sale 9 1,284,555 – – – 1,284,555
Loans to customers: 10
Commercial loans 1,617,466 588,526 17,814 475,700 2,699,506
Consumer loans 1,243,553 21,520 23,740 78,415 1,367,228
Micro and SME loans 1,225,610 113,565 37,761 117,001 1,493,937
Residential mortgage loans 1,134,266 49,285 15,052 35,573 1,234,176
Gold – pawn loans 56,977 – – 3,708 60,685
5,277,872 772,896 94,367 710,397 6,855,532
Finance lease receivables 10 28,756 9,925 3,089 6,497 48,267
Total 7,641,072 787,915 97,456 716,894 9,243,337
Prior to transition to IFRS 9, the credit risk assessment policy for non-past due and individually non-impaired financial assets was determined by the Group as follows:• A financial asset that is neither past due nor impaired at the reporting date, but historically used to be past due
no more than 30 days is assessed as a financial asset with High Grade.• A financial asset that is neither past due nor impaired at the reporting date, but historically used to be past due
more than 30 but less than 60 days is assessed as a financial asset with Standard Grade.• A financial asset that is neither past due nor impaired at the reporting date, but historically used to be past due
more than 60 days or the borrower of this loan has at least an additional borrowing in past due more than 60 days as at the reporting date is assessed as a financial asset with Sub-Standard Grade.
Ageing analysis of past due but not impaired loans per class of financial assets
31 December 2017Less than
30 days31 to
60 days61 to
90 daysMore than
90 days Total
Loans to customers:
Consumer loans 42,625 15,044 12,321 28,907 98,897
Micro and SME loans 7,486 8,822 4,777 19,288 40,373
Residential mortgage loans 14,446 4,969 2,144 7,903 29,462
Commercial loans 1,487 452 208 227 2,374
Finance lease receivables 2,499 227 – 74 2,800
Total 68,543 29,514 19,450 56,399 173,906
Notes to Consolidated Financial Statements continuedThousands of Georgian Lari
27. Risk Management continuedCredit risk continued
31 December 2016Less than
30 days31 to
60 days61 to
90 daysMore than
90 days Total
Loans to customers:
Consumer loans 34,353 10,940 9,349 20,995 75,637
Micro and SME loans 20,035 9,494 6,479 29,874 65,882
Residential mortgage loans 10,074 4,472 1,840 7,319 23,705
Commercial loans 10,235 4,558 387 1,621 16,801
Finance lease receivables 2,565 368 349 740 4,022
Total 77,262 29,832 18,404 60,549 186,047
Carrying amount per class of financial assets whose terms have been renegotiatedDuring the year, the Group modified the contractual cash flows on certain loans and advances to customers. All such loans had previously been transferred to at least Stage 2 with a loss allowance measured at an amount equal to lifetime expected credit losses.
The following table provides information on financial assets that were modified while they had a loss allowance measured at an amount equal to lifetime ECL:
Financial assets modified during the period:
Amortised cost before
modification
Net loss arising from
modification
Commercial loans 9,529 –
Consumer loans 19,144 (2,065)
Micro and SME loans 21,852 (1,152)
Residential mortgage loans 5,883 (690)
Gold – pawn loans – –
Total 56,408 (3,907)
The table below shows the carrying amount for renegotiated financial assets, by class as at 31 December 2017 and 2016:
2017 2016
Loans to customers:
Commercial loans 103,365 235,026
Micro and SME loans 47,539 37,003
Residential mortgage loans 44,058 38,757
Consumer loans 39,318 29,828
Finance lease receivables 5,508 5,829
Total 239,788 346,443
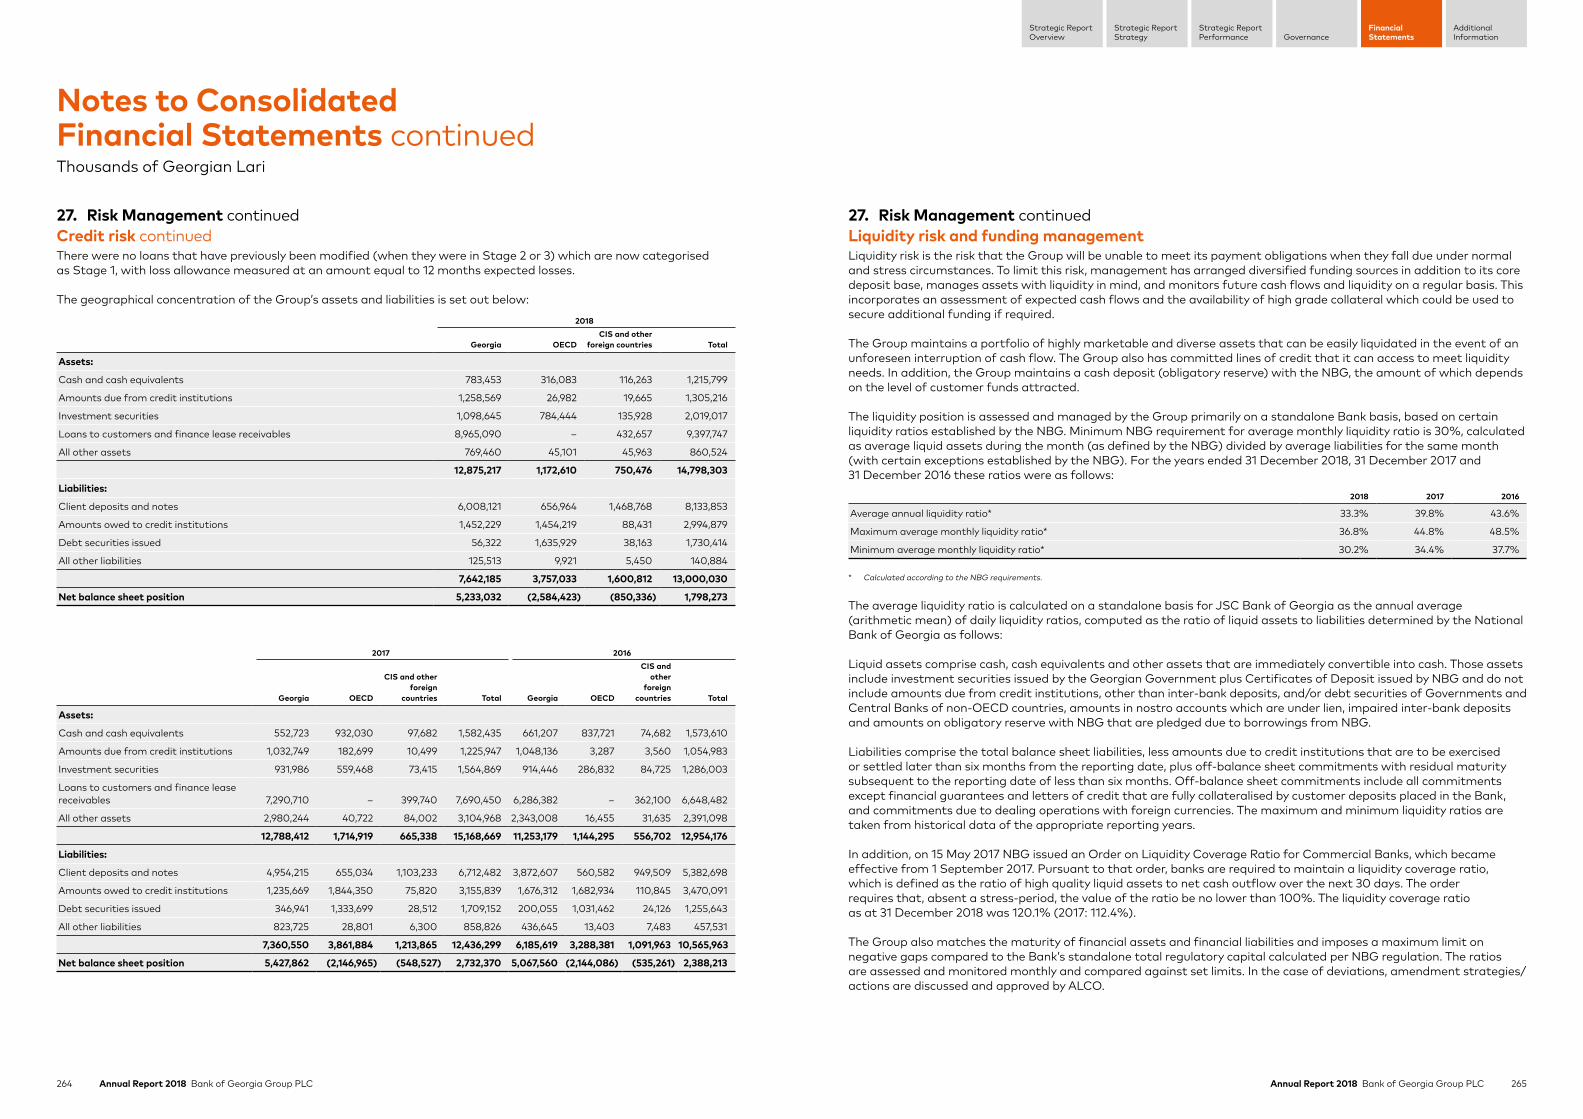
264 Annual Report 2018 Bank of Georgia Group PLC 265Annual Report 2018 Bank of Georgia Group PLC
Strategic ReportStrategy
Strategic ReportPerformance Governance
FinancialStatements
AdditionalInformation
Strategic ReportOverview
27. Risk Management continuedCredit risk continuedThere were no loans that have previously been modified (when they were in Stage 2 or 3) which are now categorised as Stage 1, with loss allowance measured at an amount equal to 12 months expected losses.
The geographical concentration of the Group’s assets and liabilities is set out below:
2018
Georgia OECDCIS and other
foreign countries Total
Assets:
Cash and cash equivalents 783,453 316,083 116,263 1,215,799
Amounts due from credit institutions 1,258,569 26,982 19,665 1,305,216
Investment securities 1,098,645 784,444 135,928 2,019,017
Loans to customers and finance lease receivables 8,965,090 – 432,657 9,397,747
All other assets 769,460 45,101 45,963 860,524
12,875,217 1,172,610 750,476 14,798,303
Liabilities:
Client deposits and notes 6,008,121 656,964 1,468,768 8,133,853
Amounts owed to credit institutions 1,452,229 1,454,219 88,431 2,994,879
Debt securities issued 56,322 1,635,929 38,163 1,730,414
All other liabilities 125,513 9,921 5,450 140,884
7,642,185 3,757,033 1,600,812 13,000,030
Net balance sheet position 5,233,032 (2,584,423) (850,336) 1,798,273
2017 2016
Georgia OECD
CIS and other foreign
countries Total Georgia OECD
CIS and other
foreign countries Total
Assets:
Cash and cash equivalents 552,723 932,030 97,682 1,582,435 661,207 837,721 74,682 1,573,610
Amounts due from credit institutions 1,032,749 182,699 10,499 1,225,947 1,048,136 3,287 3,560 1,054,983
Investment securities 931,986 559,468 73,415 1,564,869 914,446 286,832 84,725 1,286,003
Loans to customers and finance lease receivables 7,290,710 – 399,740 7,690,450 6,286,382 – 362,100 6,648,482
All other assets 2,980,244 40,722 84,002 3,104,968 2,343,008 16,455 31,635 2,391,098
12,788,412 1,714,919 665,338 15,168,669 11,253,179 1,144,295 556,702 12,954,176
Liabilities:
Client deposits and notes 4,954,215 655,034 1,103,233 6,712,482 3,872,607 560,582 949,509 5,382,698
Amounts owed to credit institutions 1,235,669 1,844,350 75,820 3,155,839 1,676,312 1,682,934 110,845 3,470,091
Debt securities issued 346,941 1,333,699 28,512 1,709,152 200,055 1,031,462 24,126 1,255,643
All other liabilities 823,725 28,801 6,300 858,826 436,645 13,403 7,483 457,531
7,360,550 3,861,884 1,213,865 12,436,299 6,185,619 3,288,381 1,091,963 10,565,963
Net balance sheet position 5,427,862 (2,146,965) (548,527) 2,732,370 5,067,560 (2,144,086) (535,261) 2,388,213
Notes to Consolidated Financial Statements continuedThousands of Georgian Lari
27. Risk Management continuedLiquidity risk and funding managementLiquidity risk is the risk that the Group will be unable to meet its payment obligations when they fall due under normal and stress circumstances. To limit this risk, management has arranged diversified funding sources in addition to its core deposit base, manages assets with liquidity in mind, and monitors future cash flows and liquidity on a regular basis. This incorporates an assessment of expected cash flows and the availability of high grade collateral which could be used to secure additional funding if required.
The Group maintains a portfolio of highly marketable and diverse assets that can be easily liquidated in the event of an unforeseen interruption of cash flow. The Group also has committed lines of credit that it can access to meet liquidity needs. In addition, the Group maintains a cash deposit (obligatory reserve) with the NBG, the amount of which depends on the level of customer funds attracted.
The liquidity position is assessed and managed by the Group primarily on a standalone Bank basis, based on certain liquidity ratios established by the NBG. Minimum NBG requirement for average monthly liquidity ratio is 30%, calculated as average liquid assets during the month (as defined by the NBG) divided by average liabilities for the same month (with certain exceptions established by the NBG). For the years ended 31 December 2018, 31 December 2017 and 31 December 2016 these ratios were as follows:
2018 2017 2016
Average annual liquidity ratio* 33.3% 39.8% 43.6%
Maximum average monthly liquidity ratio* 36.8% 44.8% 48.5%
Minimum average monthly liquidity ratio* 30.2% 34.4% 37.7%
* Calculated according to the NBG requirements.
The average liquidity ratio is calculated on a standalone basis for JSC Bank of Georgia as the annual average (arithmetic mean) of daily liquidity ratios, computed as the ratio of liquid assets to liabilities determined by the National Bank of Georgia as follows:
Liquid assets comprise cash, cash equivalents and other assets that are immediately convertible into cash. Those assets include investment securities issued by the Georgian Government plus Certificates of Deposit issued by NBG and do not include amounts due from credit institutions, other than inter-bank deposits, and/or debt securities of Governments and Central Banks of non-OECD countries, amounts in nostro accounts which are under lien, impaired inter-bank deposits and amounts on obligatory reserve with NBG that are pledged due to borrowings from NBG.
Liabilities comprise the total balance sheet liabilities, less amounts due to credit institutions that are to be exercised or settled later than six months from the reporting date, plus off-balance sheet commitments with residual maturity subsequent to the reporting date of less than six months. Off-balance sheet commitments include all commitments except financial guarantees and letters of credit that are fully collateralised by customer deposits placed in the Bank, and commitments due to dealing operations with foreign currencies. The maximum and minimum liquidity ratios are taken from historical data of the appropriate reporting years.
In addition, on 15 May 2017 NBG issued an Order on Liquidity Coverage Ratio for Commercial Banks, which became effective from 1 September 2017. Pursuant to that order, banks are required to maintain a liquidity coverage ratio, which is defined as the ratio of high quality liquid assets to net cash outflow over the next 30 days. The order requires that, absent a stress-period, the value of the ratio be no lower than 100%. The liquidity coverage ratio as at 31 December 2018 was 120.1% (2017: 112.4%).
The Group also matches the maturity of financial assets and financial liabilities and imposes a maximum limit on negative gaps compared to the Bank’s standalone total regulatory capital calculated per NBG regulation. The ratios are assessed and monitored monthly and compared against set limits. In the case of deviations, amendment strategies/actions are discussed and approved by ALCO.
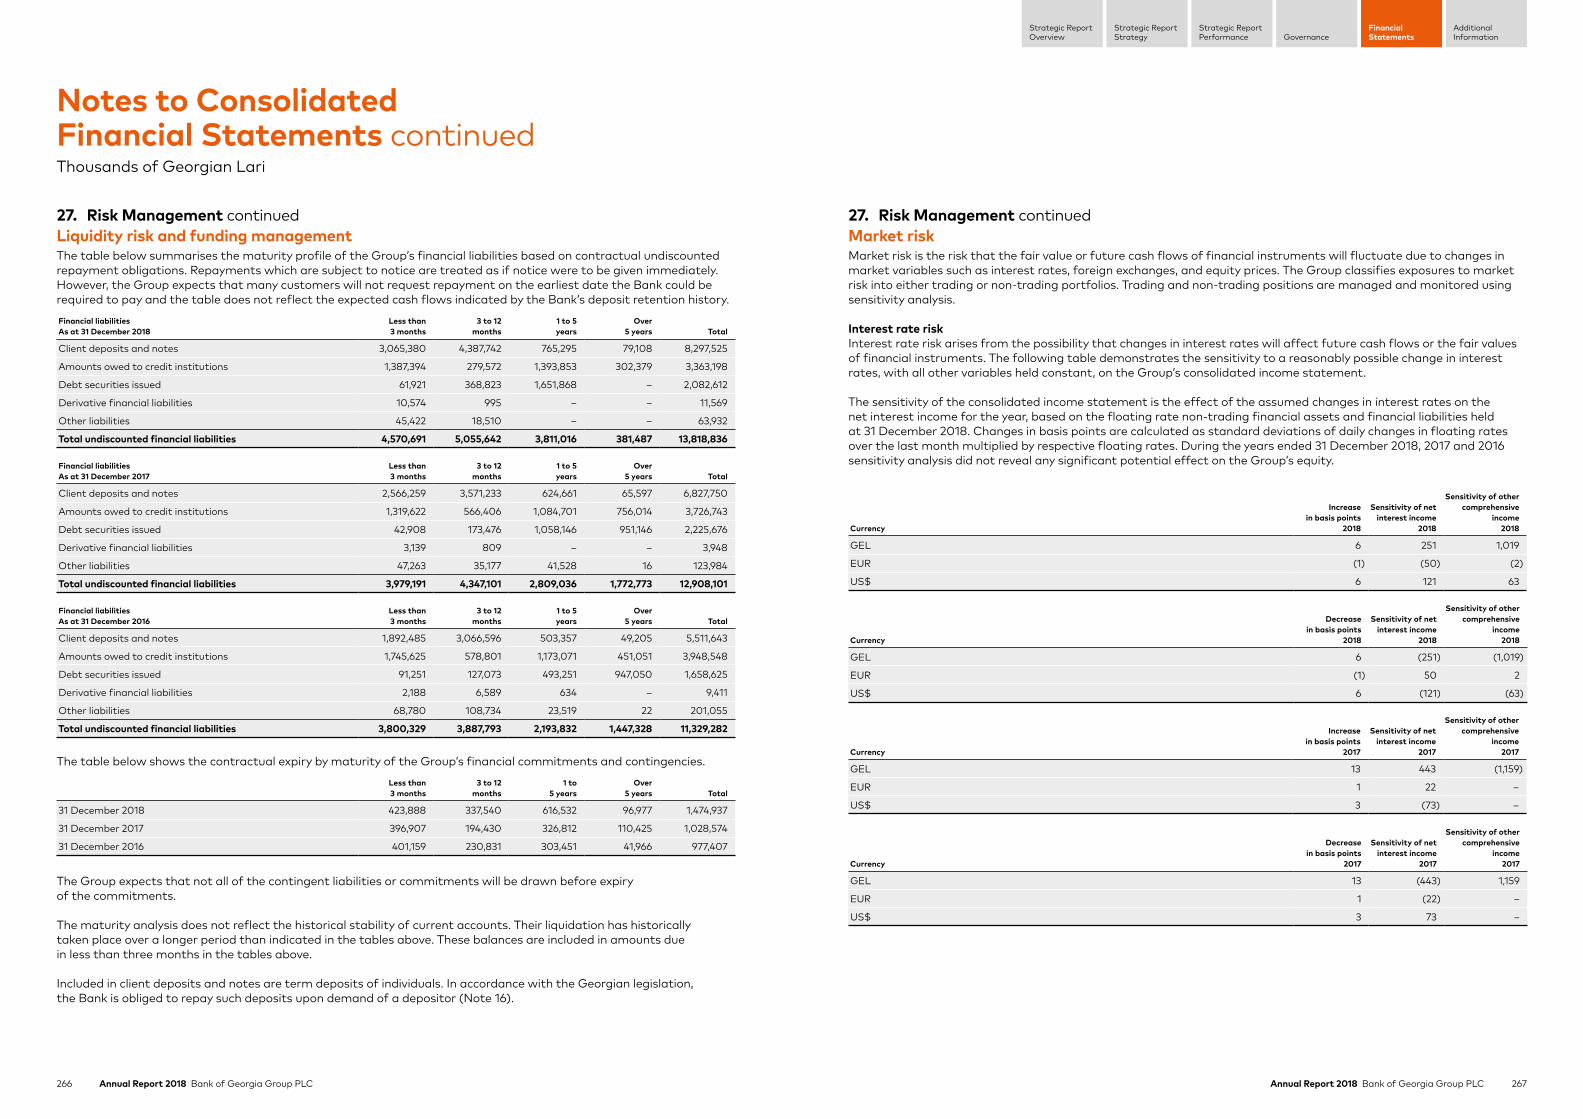
266 Annual Report 2018 Bank of Georgia Group PLC 267Annual Report 2018 Bank of Georgia Group PLC
Strategic ReportStrategy
Strategic ReportPerformance Governance
FinancialStatements
AdditionalInformation
Strategic ReportOverview
27. Risk Management continuedLiquidity risk and funding managementThe table below summarises the maturity profile of the Group’s financial liabilities based on contractual undiscounted repayment obligations. Repayments which are subject to notice are treated as if notice were to be given immediately. However, the Group expects that many customers will not request repayment on the earliest date the Bank could be required to pay and the table does not reflect the expected cash flows indicated by the Bank’s deposit retention history.
Financial liabilitiesAs at 31 December 2018
Less than 3 months
3 to 12months
1 to 5years
Over5 years Total
Client deposits and notes 3,065,380 4,387,742 765,295 79,108 8,297,525
Amounts owed to credit institutions 1,387,394 279,572 1,393,853 302,379 3,363,198
Debt securities issued 61,921 368,823 1,651,868 – 2,082,612
Derivative financial liabilities 10,574 995 – – 11,569
Other liabilities 45,422 18,510 – – 63,932
Total undiscounted financial liabilities 4,570,691 5,055,642 3,811,016 381,487 13,818,836
Financial liabilitiesAs at 31 December 2017
Less than 3 months
3 to 12months
1 to 5years
Over5 years Total
Client deposits and notes 2,566,259 3,571,233 624,661 65,597 6,827,750
Amounts owed to credit institutions 1,319,622 566,406 1,084,701 756,014 3,726,743
Debt securities issued 42,908 173,476 1,058,146 951,146 2,225,676
Derivative financial liabilities 3,139 809 – – 3,948
Other liabilities 47,263 35,177 41,528 16 123,984
Total undiscounted financial liabilities 3,979,191 4,347,101 2,809,036 1,772,773 12,908,101
Financial liabilitiesAs at 31 December 2016
Less than 3 months
3 to 12months
1 to 5years
Over5 years Total
Client deposits and notes 1,892,485 3,066,596 503,357 49,205 5,511,643
Amounts owed to credit institutions 1,745,625 578,801 1,173,071 451,051 3,948,548
Debt securities issued 91,251 127,073 493,251 947,050 1,658,625
Derivative financial liabilities 2,188 6,589 634 – 9,411
Other liabilities 68,780 108,734 23,519 22 201,055
Total undiscounted financial liabilities 3,800,329 3,887,793 2,193,832 1,447,328 11,329,282
The table below shows the contractual expiry by maturity of the Group’s financial commitments and contingencies.
Less than 3 months
3 to 12months
1 to5 years
Over5 years Total
31 December 2018 423,888 337,540 616,532 96,977 1,474,937
31 December 2017 396,907 194,430 326,812 110,425 1,028,574
31 December 2016 401,159 230,831 303,451 41,966 977,407
The Group expects that not all of the contingent liabilities or commitments will be drawn before expiry of the commitments.
The maturity analysis does not reflect the historical stability of current accounts. Their liquidation has historically taken place over a longer period than indicated in the tables above. These balances are included in amounts due in less than three months in the tables above.
Included in client deposits and notes are term deposits of individuals. In accordance with the Georgian legislation, the Bank is obliged to repay such deposits upon demand of a depositor (Note 16).
Notes to Consolidated Financial Statements continuedThousands of Georgian Lari
27. Risk Management continuedMarket riskMarket risk is the risk that the fair value or future cash flows of financial instruments will fluctuate due to changes in market variables such as interest rates, foreign exchanges, and equity prices. The Group classifies exposures to market risk into either trading or non-trading portfolios. Trading and non-trading positions are managed and monitored using sensitivity analysis.
Interest rate riskInterest rate risk arises from the possibility that changes in interest rates will affect future cash flows or the fair values of financial instruments. The following table demonstrates the sensitivity to a reasonably possible change in interest rates, with all other variables held constant, on the Group’s consolidated income statement.
The sensitivity of the consolidated income statement is the effect of the assumed changes in interest rates on the net interest income for the year, based on the floating rate non-trading financial assets and financial liabilities held at 31 December 2018. Changes in basis points are calculated as standard deviations of daily changes in floating rates over the last month multiplied by respective floating rates. During the years ended 31 December 2018, 2017 and 2016 sensitivity analysis did not reveal any significant potential effect on the Group’s equity.
Currency
Increase in basis points
2018
Sensitivity of net interest income
2018
Sensitivity of other comprehensive
income2018
GEL 6 251 1,019
EUR (1) (50) (2)
US$ 6 121 63
Currency
Decrease in basis points
2018
Sensitivity of net interest income
2018
Sensitivity of other comprehensive
income2018
GEL 6 (251) (1,019)
EUR (1) 50 2
US$ 6 (121) (63)
Currency
Increase in basis points
2017
Sensitivity of net interest income
2017
Sensitivity of other comprehensive
income2017
GEL 13 443 (1,159)
EUR 1 22 –
US$ 3 (73) –
Currency
Decrease in basis points
2017
Sensitivity of net interest income
2017
Sensitivity of other comprehensive
income2017
GEL 13 (443) 1,159
EUR 1 (22) –
US$ 3 73 –
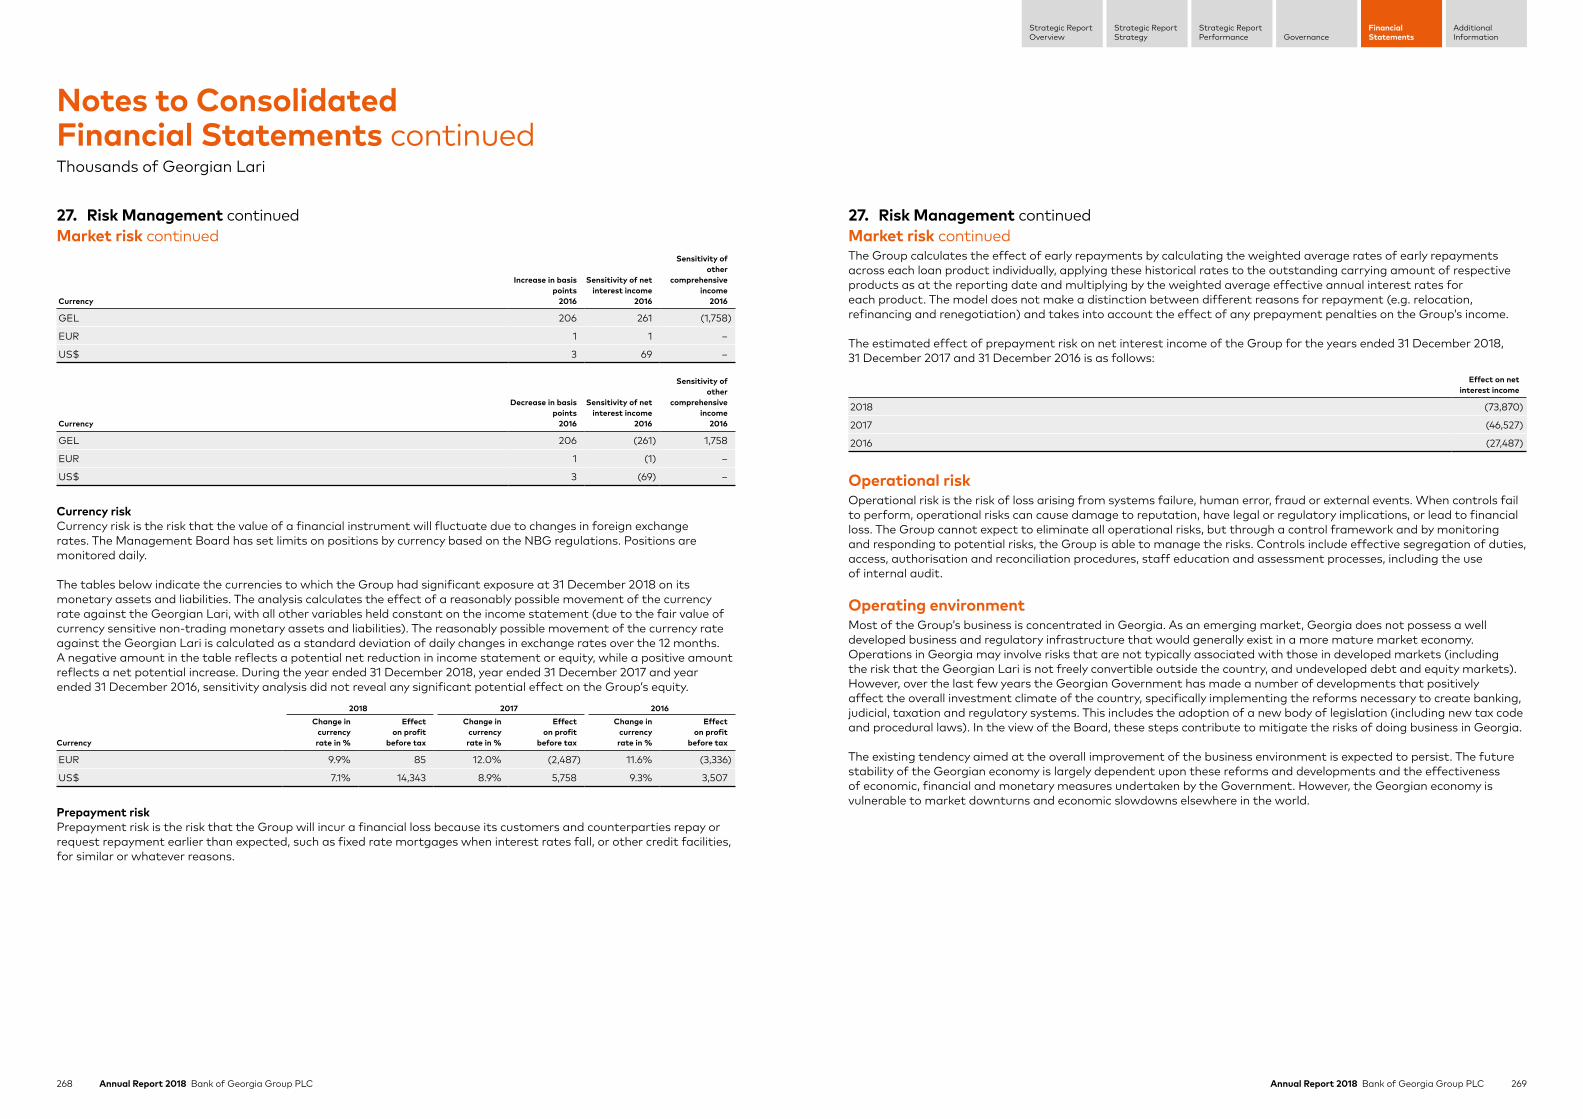
268 Annual Report 2018 Bank of Georgia Group PLC 269Annual Report 2018 Bank of Georgia Group PLC
Strategic ReportStrategy
Strategic ReportPerformance Governance
FinancialStatements
AdditionalInformation
Strategic ReportOverview
27. Risk Management continuedMarket risk continued
Currency
Increase in basis points
2016
Sensitivity of net interest income
2016
Sensitivity of other
comprehensive income
2016
GEL 206 261 (1,758)
EUR 1 1 –
US$ 3 69 –
Currency
Decrease in basis points
2016
Sensitivity of net interest income
2016
Sensitivity of other
comprehensive income
2016
GEL 206 (261) 1,758
EUR 1 (1) –
US$ 3 (69) –
Currency riskCurrency risk is the risk that the value of a financial instrument will fluctuate due to changes in foreign exchange rates. The Management Board has set limits on positions by currency based on the NBG regulations. Positions are monitored daily.
The tables below indicate the currencies to which the Group had significant exposure at 31 December 2018 on its monetary assets and liabilities. The analysis calculates the effect of a reasonably possible movement of the currency rate against the Georgian Lari, with all other variables held constant on the income statement (due to the fair value of currency sensitive non-trading monetary assets and liabilities). The reasonably possible movement of the currency rate against the Georgian Lari is calculated as a standard deviation of daily changes in exchange rates over the 12 months. A negative amount in the table reflects a potential net reduction in income statement or equity, while a positive amount reflects a net potential increase. During the year ended 31 December 2018, year ended 31 December 2017 and year ended 31 December 2016, sensitivity analysis did not reveal any significant potential effect on the Group’s equity.
Currency
2018 2017 2016Change in
currency rate in %
Effect on profit
before tax
Change in currency rate in %
Effect on profit
before tax
Change in currency rate in %
Effect on profit
before tax
EUR 9.9% 85 12.0% (2,487) 11.6% (3,336)
US$ 7.1% 14,343 8.9% 5,758 9.3% 3,507
Prepayment riskPrepayment risk is the risk that the Group will incur a financial loss because its customers and counterparties repay or request repayment earlier than expected, such as fixed rate mortgages when interest rates fall, or other credit facilities, for similar or whatever reasons.
Notes to Consolidated Financial Statements continuedThousands of Georgian Lari
27. Risk Management continuedMarket risk continuedThe Group calculates the effect of early repayments by calculating the weighted average rates of early repayments across each loan product individually, applying these historical rates to the outstanding carrying amount of respective products as at the reporting date and multiplying by the weighted average effective annual interest rates for each product. The model does not make a distinction between different reasons for repayment (e.g. relocation, refinancing and renegotiation) and takes into account the effect of any prepayment penalties on the Group’s income.
The estimated effect of prepayment risk on net interest income of the Group for the years ended 31 December 2018, 31 December 2017 and 31 December 2016 is as follows:
Effect on net interest income
2018 (73,870)
2017 (46,527)
2016 (27,487)
Operational riskOperational risk is the risk of loss arising from systems failure, human error, fraud or external events. When controls fail to perform, operational risks can cause damage to reputation, have legal or regulatory implications, or lead to financial loss. The Group cannot expect to eliminate all operational risks, but through a control framework and by monitoring and responding to potential risks, the Group is able to manage the risks. Controls include effective segregation of duties, access, authorisation and reconciliation procedures, staff education and assessment processes, including the use of internal audit.
Operating environmentMost of the Group’s business is concentrated in Georgia. As an emerging market, Georgia does not possess a well developed business and regulatory infrastructure that would generally exist in a more mature market economy. Operations in Georgia may involve risks that are not typically associated with those in developed markets (including the risk that the Georgian Lari is not freely convertible outside the country, and undeveloped debt and equity markets). However, over the last few years the Georgian Government has made a number of developments that positively affect the overall investment climate of the country, specifically implementing the reforms necessary to create banking, judicial, taxation and regulatory systems. This includes the adoption of a new body of legislation (including new tax code and procedural laws). In the view of the Board, these steps contribute to mitigate the risks of doing business in Georgia.
The existing tendency aimed at the overall improvement of the business environment is expected to persist. The future stability of the Georgian economy is largely dependent upon these reforms and developments and the effectiveness of economic, financial and monetary measures undertaken by the Government. However, the Georgian economy is vulnerable to market downturns and economic slowdowns elsewhere in the world.
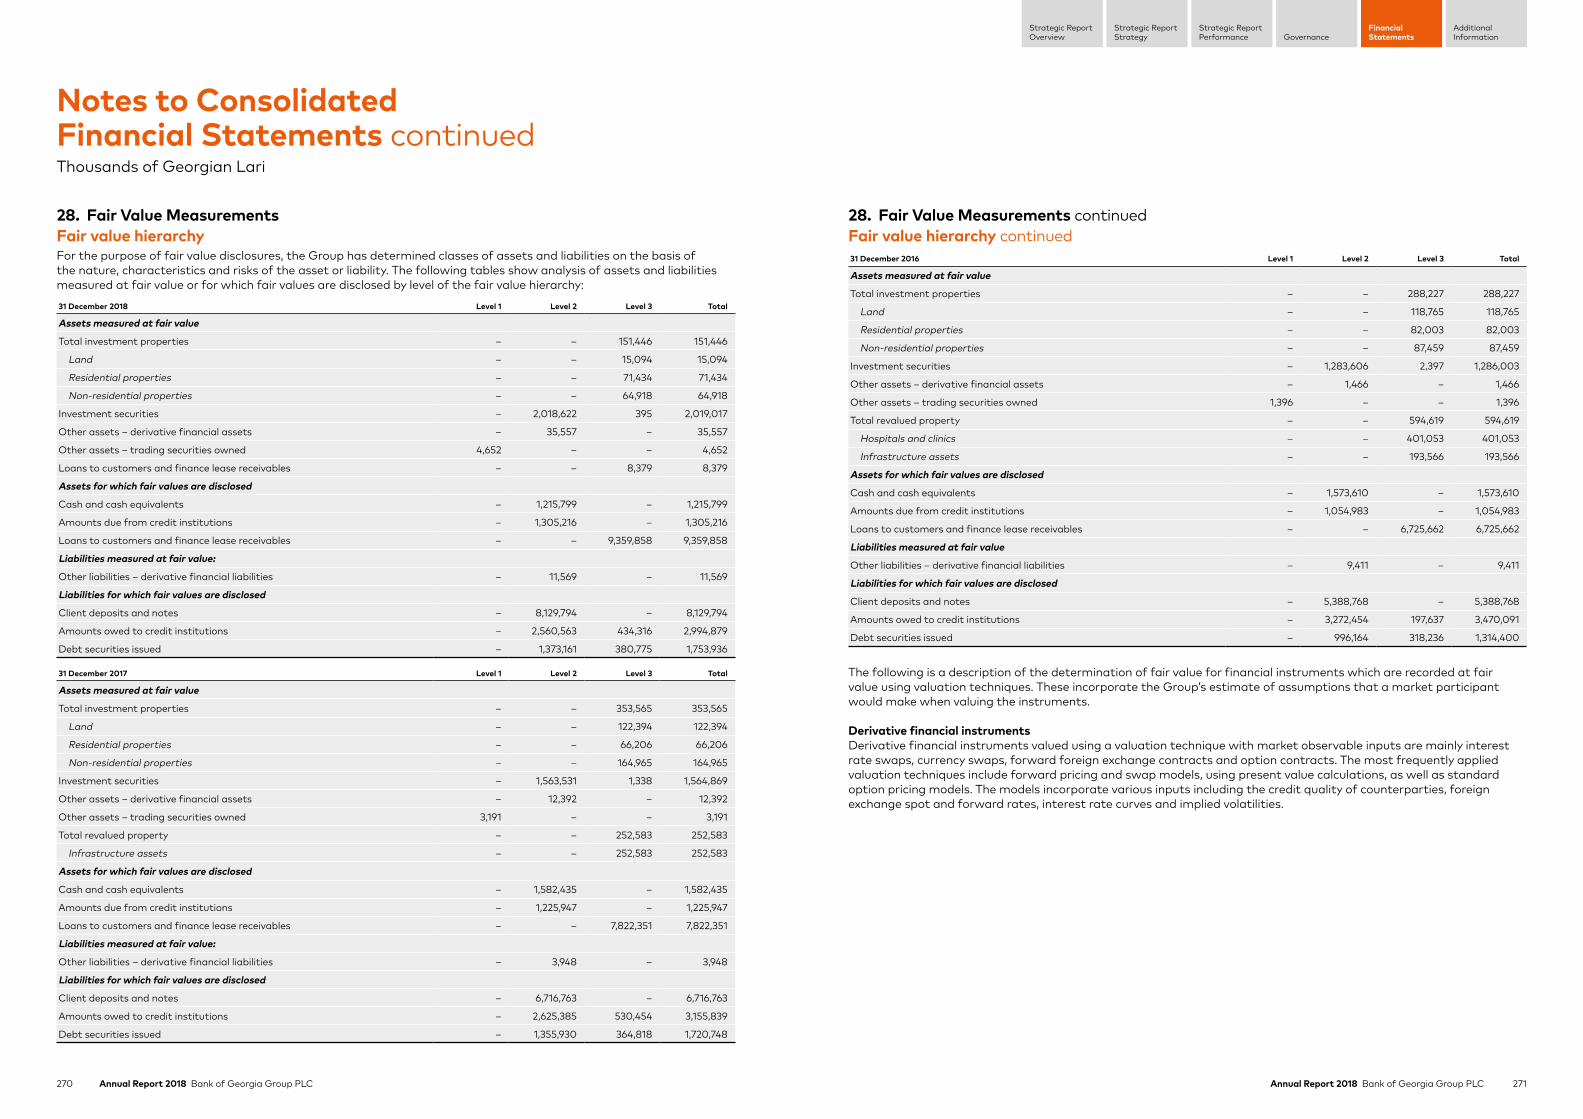
270 Annual Report 2018 Bank of Georgia Group PLC 271Annual Report 2018 Bank of Georgia Group PLC
Strategic ReportStrategy
Strategic ReportPerformance Governance
FinancialStatements
AdditionalInformation
Strategic ReportOverview
28. Fair Value MeasurementsFair value hierarchyFor the purpose of fair value disclosures, the Group has determined classes of assets and liabilities on the basis of the nature, characteristics and risks of the asset or liability. The following tables show analysis of assets and liabilities measured at fair value or for which fair values are disclosed by level of the fair value hierarchy:
31 December 2018 Level 1 Level 2 Level 3 Total
Assets measured at fair value
Total investment properties – – 151,446 151,446
Land – – 15,094 15,094
Residential properties – – 71,434 71,434
Non-residential properties – – 64,918 64,918
Investment securities – 2,018,622 395 2,019,017
Other assets – derivative financial assets – 35,557 – 35,557
Other assets – trading securities owned 4,652 – – 4,652
Loans to customers and finance lease receivables – – 8,379 8,379
Assets for which fair values are disclosed
Cash and cash equivalents – 1,215,799 – 1,215,799
Amounts due from credit institutions – 1,305,216 – 1,305,216
Loans to customers and finance lease receivables – – 9,359,858 9,359,858
Liabilities measured at fair value:
Other liabilities – derivative financial liabilities – 11,569 – 11,569
Liabilities for which fair values are disclosed
Client deposits and notes – 8,129,794 – 8,129,794
Amounts owed to credit institutions – 2,560,563 434,316 2,994,879
Debt securities issued – 1,373,161 380,775 1,753,936
31 December 2017 Level 1 Level 2 Level 3 Total
Assets measured at fair value
Total investment properties – – 353,565 353,565
Land – – 122,394 122,394
Residential properties – – 66,206 66,206
Non-residential properties – – 164,965 164,965
Investment securities – 1,563,531 1,338 1,564,869
Other assets – derivative financial assets – 12,392 – 12,392
Other assets – trading securities owned 3,191 – – 3,191
Total revalued property – – 252,583 252,583
Infrastructure assets – – 252,583 252,583
Assets for which fair values are disclosed
Cash and cash equivalents – 1,582,435 – 1,582,435
Amounts due from credit institutions – 1,225,947 – 1,225,947
Loans to customers and finance lease receivables – – 7,822,351 7,822,351
Liabilities measured at fair value:
Other liabilities – derivative financial liabilities – 3,948 – 3,948
Liabilities for which fair values are disclosed
Client deposits and notes – 6,716,763 – 6,716,763
Amounts owed to credit institutions – 2,625,385 530,454 3,155,839
Debt securities issued – 1,355,930 364,818 1,720,748
Notes to Consolidated Financial Statements continuedThousands of Georgian Lari
28. Fair Value Measurements continuedFair value hierarchy continued31 December 2016 Level 1 Level 2 Level 3 Total
Assets measured at fair value
Total investment properties – – 288,227 288,227
Land – – 118,765 118,765
Residential properties – – 82,003 82,003
Non-residential properties – – 87,459 87,459
Investment securities – 1,283,606 2,397 1,286,003
Other assets – derivative financial assets – 1,466 – 1,466
Other assets – trading securities owned 1,396 – – 1,396
Total revalued property – – 594,619 594,619
Hospitals and clinics – – 401,053 401,053
Infrastructure assets – – 193,566 193,566
Assets for which fair values are disclosed
Cash and cash equivalents – 1,573,610 – 1,573,610
Amounts due from credit institutions – 1,054,983 – 1,054,983
Loans to customers and finance lease receivables – – 6,725,662 6,725,662
Liabilities measured at fair value
Other liabilities – derivative financial liabilities – 9,411 – 9,411
Liabilities for which fair values are disclosed
Client deposits and notes – 5,388,768 – 5,388,768
Amounts owed to credit institutions – 3,272,454 197,637 3,470,091
Debt securities issued – 996,164 318,236 1,314,400
The following is a description of the determination of fair value for financial instruments which are recorded at fair value using valuation techniques. These incorporate the Group’s estimate of assumptions that a market participant would make when valuing the instruments.
Derivative financial instrumentsDerivative financial instruments valued using a valuation technique with market observable inputs are mainly interest rate swaps, currency swaps, forward foreign exchange contracts and option contracts. The most frequently applied valuation techniques include forward pricing and swap models, using present value calculations, as well as standard option pricing models. The models incorporate various inputs including the credit quality of counterparties, foreign exchange spot and forward rates, interest rate curves and implied volatilities.
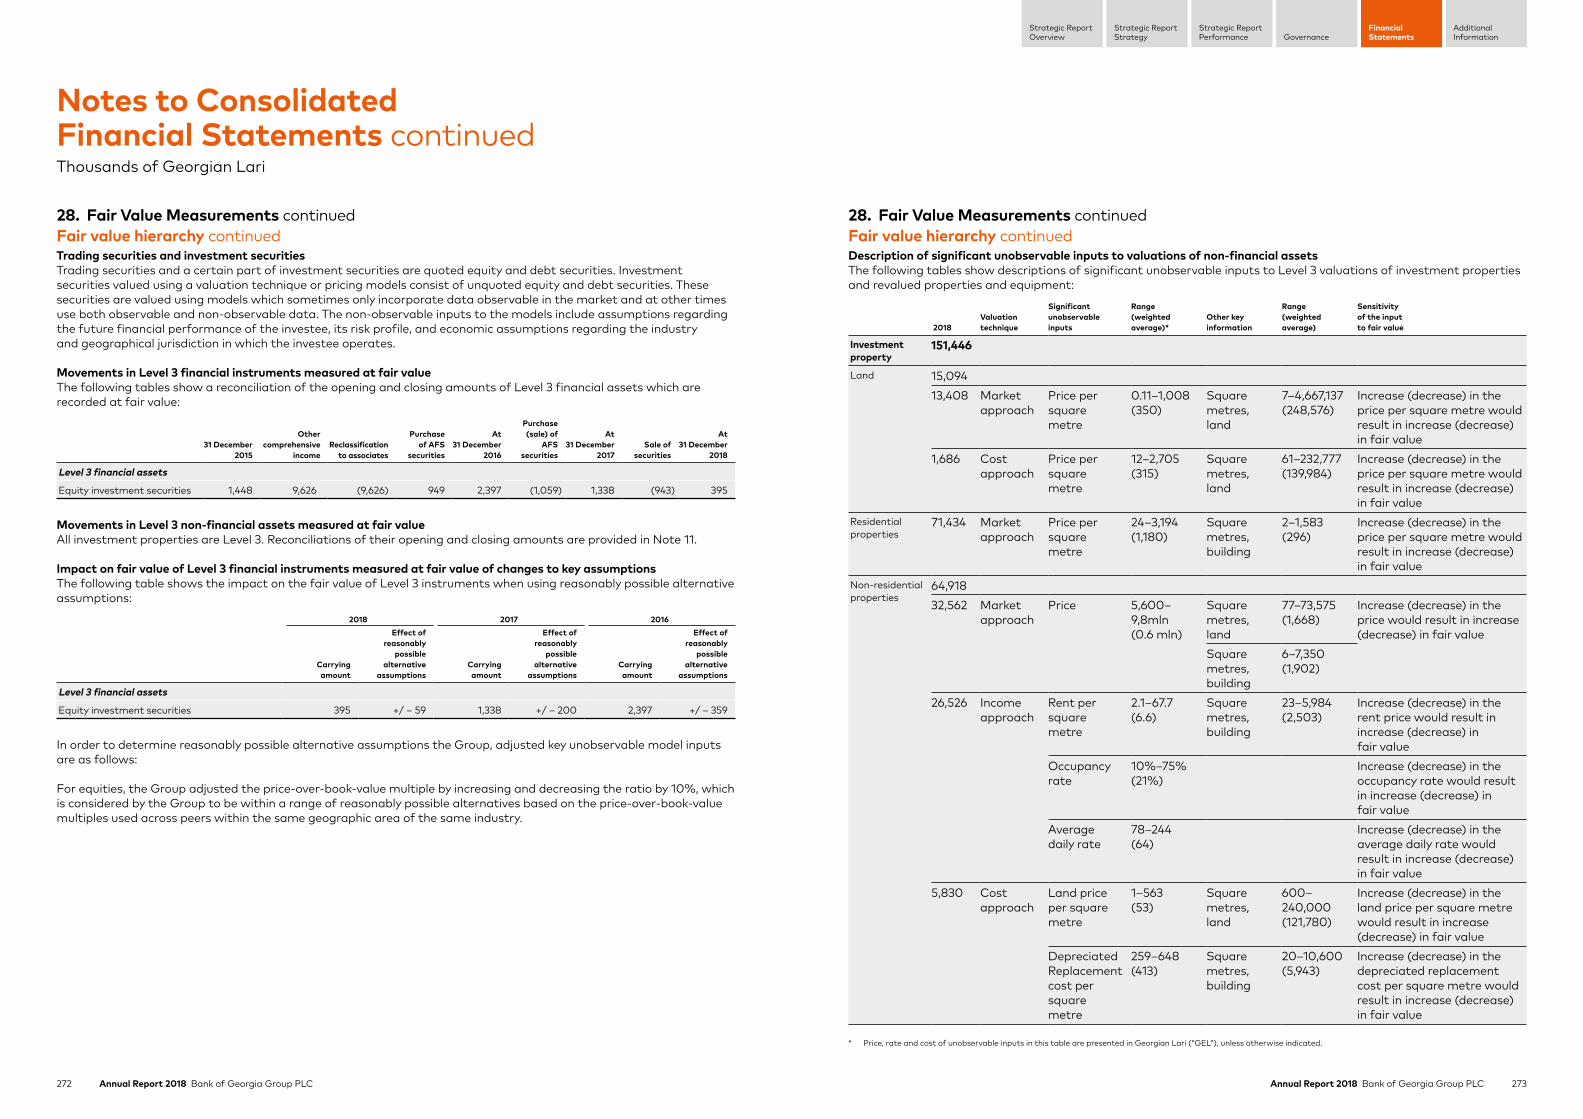
272 Annual Report 2018 Bank of Georgia Group PLC 273Annual Report 2018 Bank of Georgia Group PLC
Strategic ReportStrategy
Strategic ReportPerformance Governance
FinancialStatements
AdditionalInformation
Strategic ReportOverview
28. Fair Value Measurements continuedFair value hierarchy continuedTrading securities and investment securitiesTrading securities and a certain part of investment securities are quoted equity and debt securities. Investment securities valued using a valuation technique or pricing models consist of unquoted equity and debt securities. These securities are valued using models which sometimes only incorporate data observable in the market and at other times use both observable and non-observable data. The non-observable inputs to the models include assumptions regarding the future financial performance of the investee, its risk profile, and economic assumptions regarding the industry and geographical jurisdiction in which the investee operates.
Movements in Level 3 financial instruments measured at fair valueThe following tables show a reconciliation of the opening and closing amounts of Level 3 financial assets which are recorded at fair value:
31 December 2015
Other comprehensive
incomeReclassification
to associates
Purchase of AFS
securities
At 31 December
2016
Purchase (sale) of
AFS securities
At 31 December
2017Sale of
securities
At 31 December
2018
Level 3 financial assets
Equity investment securities 1,448 9,626 (9,626) 949 2,397 (1,059) 1,338 (943) 395
Movements in Level 3 non-financial assets measured at fair valueAll investment properties are Level 3. Reconciliations of their opening and closing amounts are provided in Note 11.
Impact on fair value of Level 3 financial instruments measured at fair value of changes to key assumptionsThe following table shows the impact on the fair value of Level 3 instruments when using reasonably possible alternative assumptions:
2018 2017 2016
Carrying amount
Effect of reasonably
possible alternative
assumptionsCarrying amount
Effect of reasonably
possible alternative
assumptionsCarrying amount
Effect of reasonably
possible alternative
assumptions
Level 3 financial assets
Equity investment securities 395 +/ – 59 1,338 +/ – 200 2,397 +/ – 359
In order to determine reasonably possible alternative assumptions the Group, adjusted key unobservable model inputs are as follows:
For equities, the Group adjusted the price-over-book-value multiple by increasing and decreasing the ratio by 10%, which is considered by the Group to be within a range of reasonably possible alternatives based on the price-over-book-value multiples used across peers within the same geographic area of the same industry.
Notes to Consolidated Financial Statements continuedThousands of Georgian Lari
28. Fair Value Measurements continuedFair value hierarchy continuedDescription of significant unobservable inputs to valuations of non-financial assetsThe following tables show descriptions of significant unobservable inputs to Level 3 valuations of investment properties and revalued properties and equipment:
2018Valuation technique
Significant unobservable inputs
Range (weighted average)*
Other key information
Range (weighted average)
Sensitivity of the input to fair value
Investment property
151,446
Land 15,094
13,408 Market approach
Price per square metre
0.11–1,008 (350)
Square metres, land
7–4,667,137 (248,576)
Increase (decrease) in the price per square metre would result in increase (decrease) in fair value
1,686 Cost approach
Price per square metre
12–2,705 (315)
Square metres, land
61–232,777 (139,984)
Increase (decrease) in the price per square metre would result in increase (decrease) in fair value
Residential properties
71,434 Market approach
Price per square metre
24–3,194 (1,180)
Square metres, building
2–1,583 (296)
Increase (decrease) in the price per square metre would result in increase (decrease) in fair value
Non-residential properties
64,918 32,562 Market
approachPrice 5,600–
9,8mln (0.6 mln)
Square metres, land
77–73,575 (1,668)
Increase (decrease) in the price would result in increase (decrease) in fair value
Square metres, building
6–7,350 (1,902)
26,526 Income approach
Rent per square metre
2.1–67.7 (6.6)
Square metres, building
23–5,984 (2,503)
Increase (decrease) in the rent price would result in increase (decrease) in fair value
Occupancy rate
10%–75% (21%)
Increase (decrease) in the occupancy rate would result in increase (decrease) in fair value
Averagedaily rate
78–244 (64)
Increase (decrease) in the average daily rate would result in increase (decrease) in fair value
5,830 Cost approach
Land price per square metre
1–563 (53)
Square metres, land
600–240,000 (121,780)
Increase (decrease) in the land price per square metre would result in increase (decrease) in fair value
Depreciated Replacement cost per square metre
259–648 (413)
Square metres, building
20–10,600 (5,943)
Increase (decrease) in the depreciated replacement cost per square metre would result in increase (decrease) in fair value
* Price, rate and cost of unobservable inputs in this table are presented in Georgian Lari (“GEL”), unless otherwise indicated.
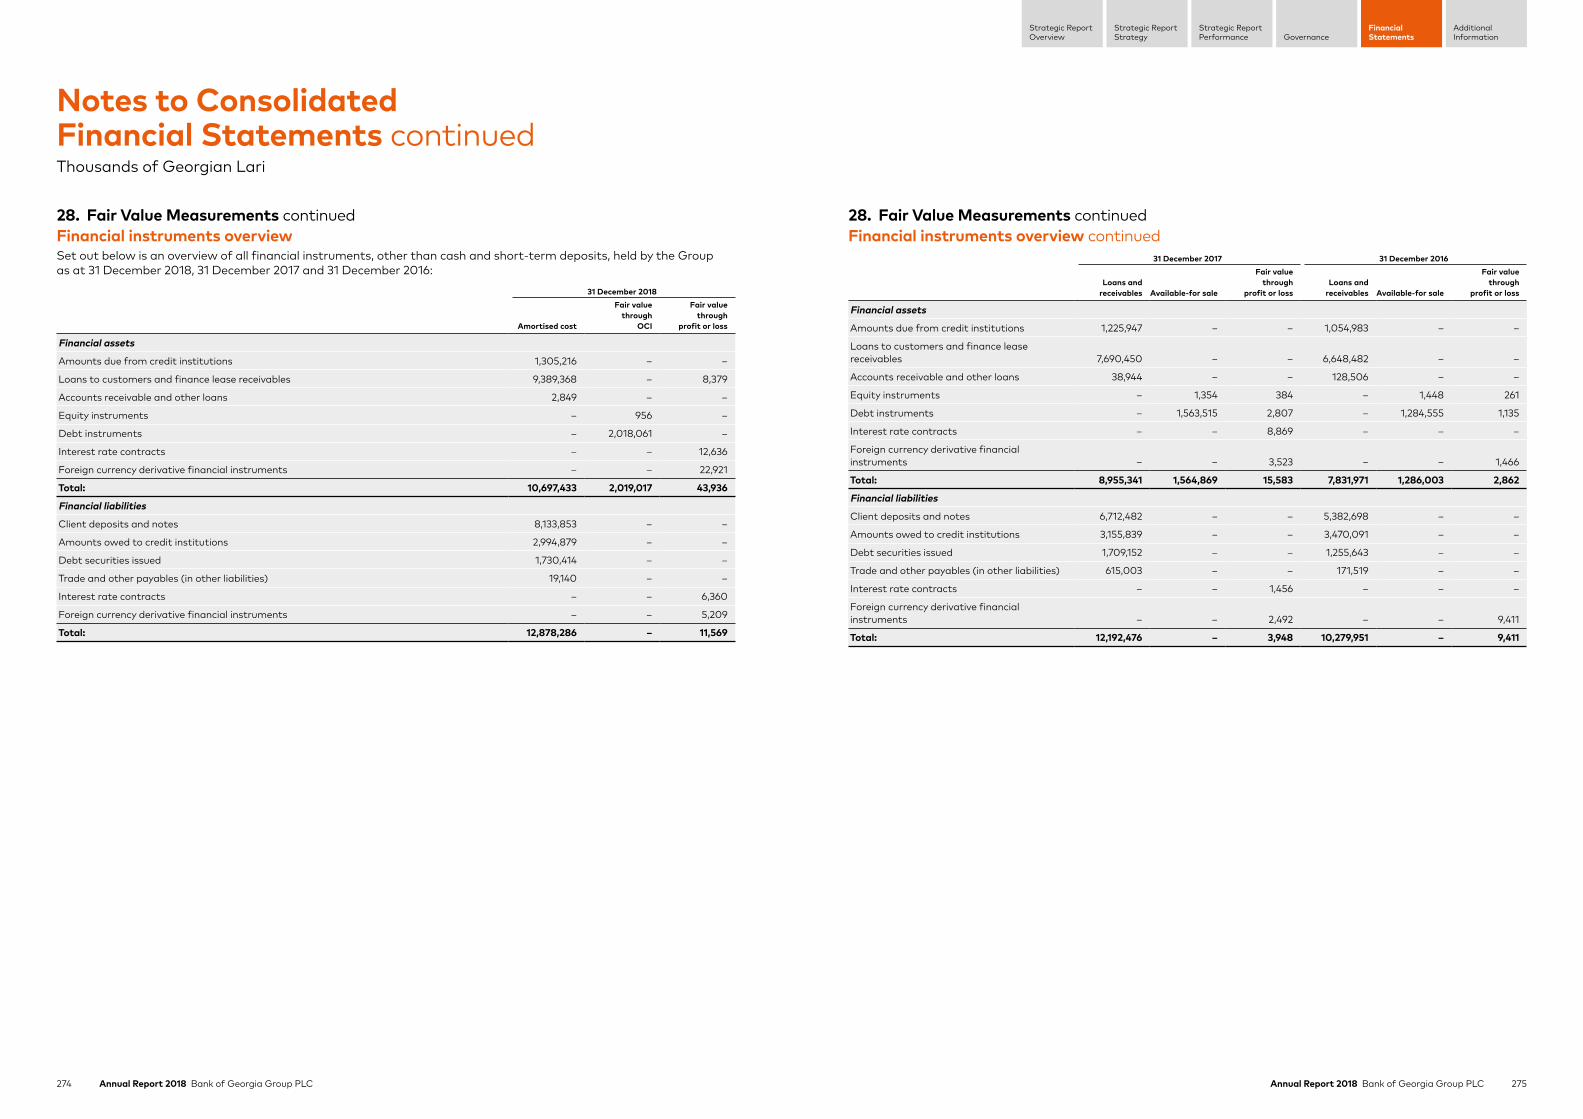
274 Annual Report 2018 Bank of Georgia Group PLC 275Annual Report 2018 Bank of Georgia Group PLC
Strategic ReportStrategy
Strategic ReportPerformance Governance
FinancialStatements
AdditionalInformation
Strategic ReportOverview
28. Fair Value Measurements continuedFinancial instruments overviewSet out below is an overview of all financial instruments, other than cash and short-term deposits, held by the Group as at 31 December 2018, 31 December 2017 and 31 December 2016:
31 December 2018
Amortised cost
Fair value through
OCI
Fair value through
profit or loss
Financial assets
Amounts due from credit institutions 1,305,216 – –
Loans to customers and finance lease receivables 9,389,368 – 8,379
Accounts receivable and other loans 2,849 – –
Equity instruments – 956 –
Debt instruments – 2,018,061 –
Interest rate contracts – – 12,636
Foreign currency derivative financial instruments – – 22,921
Total: 10,697,433 2,019,017 43,936
Financial liabilities
Client deposits and notes 8,133,853 – –
Amounts owed to credit institutions 2,994,879 – –
Debt securities issued 1,730,414 – –
Trade and other payables (in other liabilities) 19,140 – –
Interest rate contracts – – 6,360
Foreign currency derivative financial instruments – – 5,209
Total: 12,878,286 – 11,569
Notes to Consolidated Financial Statements continuedThousands of Georgian Lari
28. Fair Value Measurements continuedFinancial instruments overview continued
31 December 2017 31 December 2016
Loans and receivables Available-for sale
Fair value through
profit or lossLoans and
receivables Available-for sale
Fair value through
profit or loss
Financial assets
Amounts due from credit institutions 1,225,947 – – 1,054,983 – –
Loans to customers and finance lease receivables 7,690,450 – – 6,648,482 – –
Accounts receivable and other loans 38,944 – – 128,506 – –
Equity instruments – 1,354 384 – 1,448 261
Debt instruments – 1,563,515 2,807 – 1,284,555 1,135
Interest rate contracts – – 8,869 – – –
Foreign currency derivative financial instruments – – 3,523 – – 1,466
Total: 8,955,341 1,564,869 15,583 7,831,971 1,286,003 2,862
Financial liabilities
Client deposits and notes 6,712,482 – – 5,382,698 – –
Amounts owed to credit institutions 3,155,839 – – 3,470,091 – –
Debt securities issued 1,709,152 – – 1,255,643 – –
Trade and other payables (in other liabilities) 615,003 – – 171,519 – –
Interest rate contracts – – 1,456 – – –
Foreign currency derivative financial instruments – – 2,492 – – 9,411
Total: 12,192,476 – 3,948 10,279,951 – 9,411
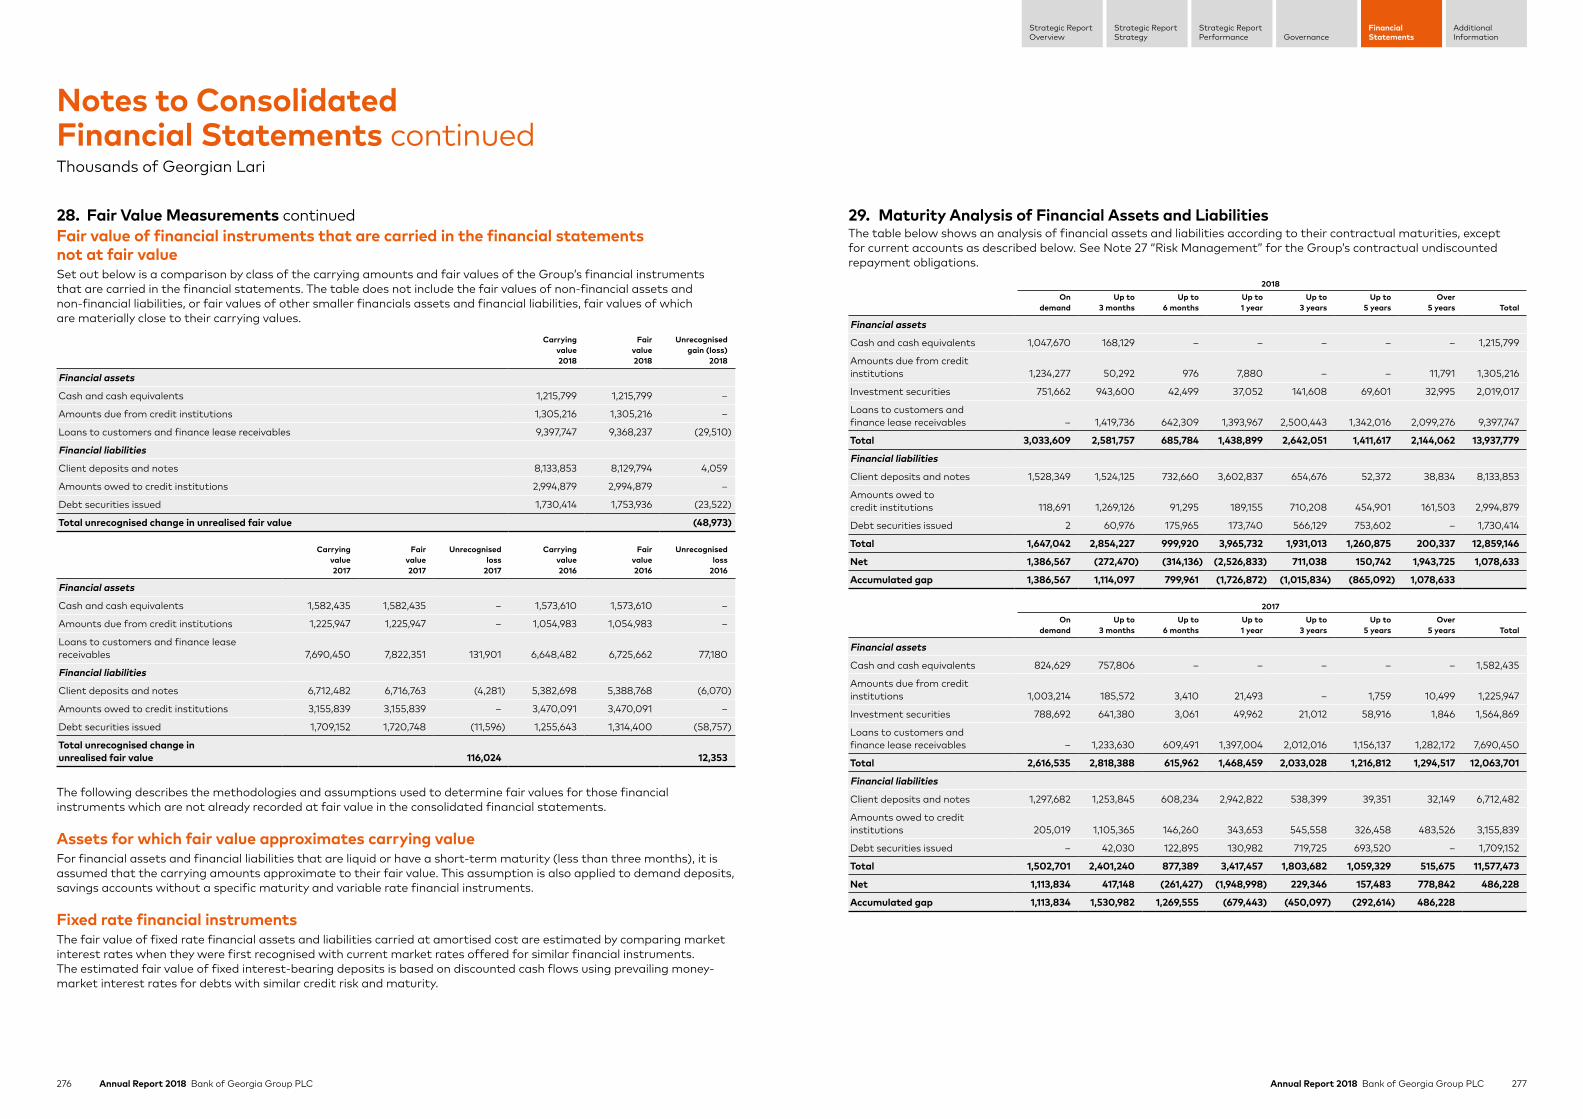
276 Annual Report 2018 Bank of Georgia Group PLC 277Annual Report 2018 Bank of Georgia Group PLC
Strategic ReportStrategy
Strategic ReportPerformance Governance
FinancialStatements
AdditionalInformation
Strategic ReportOverview
28. Fair Value Measurements continuedFair value of financial instruments that are carried in the financial statements not at fair valueSet out below is a comparison by class of the carrying amounts and fair values of the Group’s financial instruments that are carried in the financial statements. The table does not include the fair values of non-financial assets and non-financial liabilities, or fair values of other smaller financials assets and financial liabilities, fair values of which are materially close to their carrying values.
Carrying value 2018
Fair value 2018
Unrecognised gain (loss)
2018
Financial assets
Cash and cash equivalents 1,215,799 1,215,799 –
Amounts due from credit institutions 1,305,216 1,305,216 –
Loans to customers and finance lease receivables 9,397,747 9,368,237 (29,510)
Financial liabilities
Client deposits and notes 8,133,853 8,129,794 4,059
Amounts owed to credit institutions 2,994,879 2,994,879 –
Debt securities issued 1,730,414 1,753,936 (23,522)
Total unrecognised change in unrealised fair value (48,973)
Carrying value2017
Fair value 2017
Unrecognised loss
2017
Carrying value2016
Fair value 2016
Unrecognised loss
2016
Financial assets
Cash and cash equivalents 1,582,435 1,582,435 – 1,573,610 1,573,610 –
Amounts due from credit institutions 1,225,947 1,225,947 – 1,054,983 1,054,983 –
Loans to customers and finance lease receivables 7,690,450 7,822,351 131,901 6,648,482 6,725,662 77,180
Financial liabilities
Client deposits and notes 6,712,482 6,716,763 (4,281) 5,382,698 5,388,768 (6,070)
Amounts owed to credit institutions 3,155,839 3,155,839 – 3,470,091 3,470,091 –
Debt securities issued 1,709,152 1,720,748 (11,596) 1,255,643 1,314,400 (58,757)
Total unrecognised change in unrealised fair value 116,024 12,353
The following describes the methodologies and assumptions used to determine fair values for those financial instruments which are not already recorded at fair value in the consolidated financial statements.
Assets for which fair value approximates carrying valueFor financial assets and financial liabilities that are liquid or have a short-term maturity (less than three months), it is assumed that the carrying amounts approximate to their fair value. This assumption is also applied to demand deposits, savings accounts without a specific maturity and variable rate financial instruments.
Fixed rate financial instrumentsThe fair value of fixed rate financial assets and liabilities carried at amortised cost are estimated by comparing market interest rates when they were first recognised with current market rates offered for similar financial instruments. The estimated fair value of fixed interest-bearing deposits is based on discounted cash flows using prevailing money-market interest rates for debts with similar credit risk and maturity.
Notes to Consolidated Financial Statements continuedThousands of Georgian Lari
29. Maturity Analysis of Financial Assets and LiabilitiesThe table below shows an analysis of financial assets and liabilities according to their contractual maturities, except for current accounts as described below. See Note 27 “Risk Management” for the Group’s contractual undiscounted repayment obligations.
2018On
demandUp to
3 monthsUp to
6 monthsUp to 1 year
Up to 3 years
Up to 5 years
Over 5 years Total
Financial assets
Cash and cash equivalents 1,047,670 168,129 – – – – – 1,215,799
Amounts due from credit institutions 1,234,277 50,292 976 7,880 – – 11,791 1,305,216
Investment securities 751,662 943,600 42,499 37,052 141,608 69,601 32,995 2,019,017
Loans to customers and finance lease receivables – 1,419,736 642,309 1,393,967 2,500,443 1,342,016 2,099,276 9,397,747
Total 3,033,609 2,581,757 685,784 1,438,899 2,642,051 1,411,617 2,144,062 13,937,779
Financial liabilities
Client deposits and notes 1,528,349 1,524,125 732,660 3,602,837 654,676 52,372 38,834 8,133,853
Amounts owed to credit institutions 118,691 1,269,126 91,295 189,155 710,208 454,901 161,503 2,994,879
Debt securities issued 2 60,976 175,965 173,740 566,129 753,602 – 1,730,414
Total 1,647,042 2,854,227 999,920 3,965,732 1,931,013 1,260,875 200,337 12,859,146
Net 1,386,567 (272,470) (314,136) (2,526,833) 711,038 150,742 1,943,725 1,078,633
Accumulated gap 1,386,567 1,114,097 799,961 (1,726,872) (1,015,834) (865,092) 1,078,633
2017On
demandUp to
3 monthsUp to
6 monthsUp to 1 year
Up to 3 years
Up to 5 years
Over 5 years Total
Financial assets
Cash and cash equivalents 824,629 757,806 – – – – – 1,582,435
Amounts due from credit institutions 1,003,214 185,572 3,410 21,493 – 1,759 10,499 1,225,947
Investment securities 788,692 641,380 3,061 49,962 21,012 58,916 1,846 1,564,869
Loans to customers and finance lease receivables – 1,233,630 609,491 1,397,004 2,012,016 1,156,137 1,282,172 7,690,450
Total 2,616,535 2,818,388 615,962 1,468,459 2,033,028 1,216,812 1,294,517 12,063,701
Financial liabilities
Client deposits and notes 1,297,682 1,253,845 608,234 2,942,822 538,399 39,351 32,149 6,712,482
Amounts owed to credit institutions 205,019 1,105,365 146,260 343,653 545,558 326,458 483,526 3,155,839
Debt securities issued – 42,030 122,895 130,982 719,725 693,520 – 1,709,152
Total 1,502,701 2,401,240 877,389 3,417,457 1,803,682 1,059,329 515,675 11,577,473
Net 1,113,834 417,148 (261,427) (1,948,998) 229,346 157,483 778,842 486,228
Accumulated gap 1,113,834 1,530,982 1,269,555 (679,443) (450,097) (292,614) 486,228
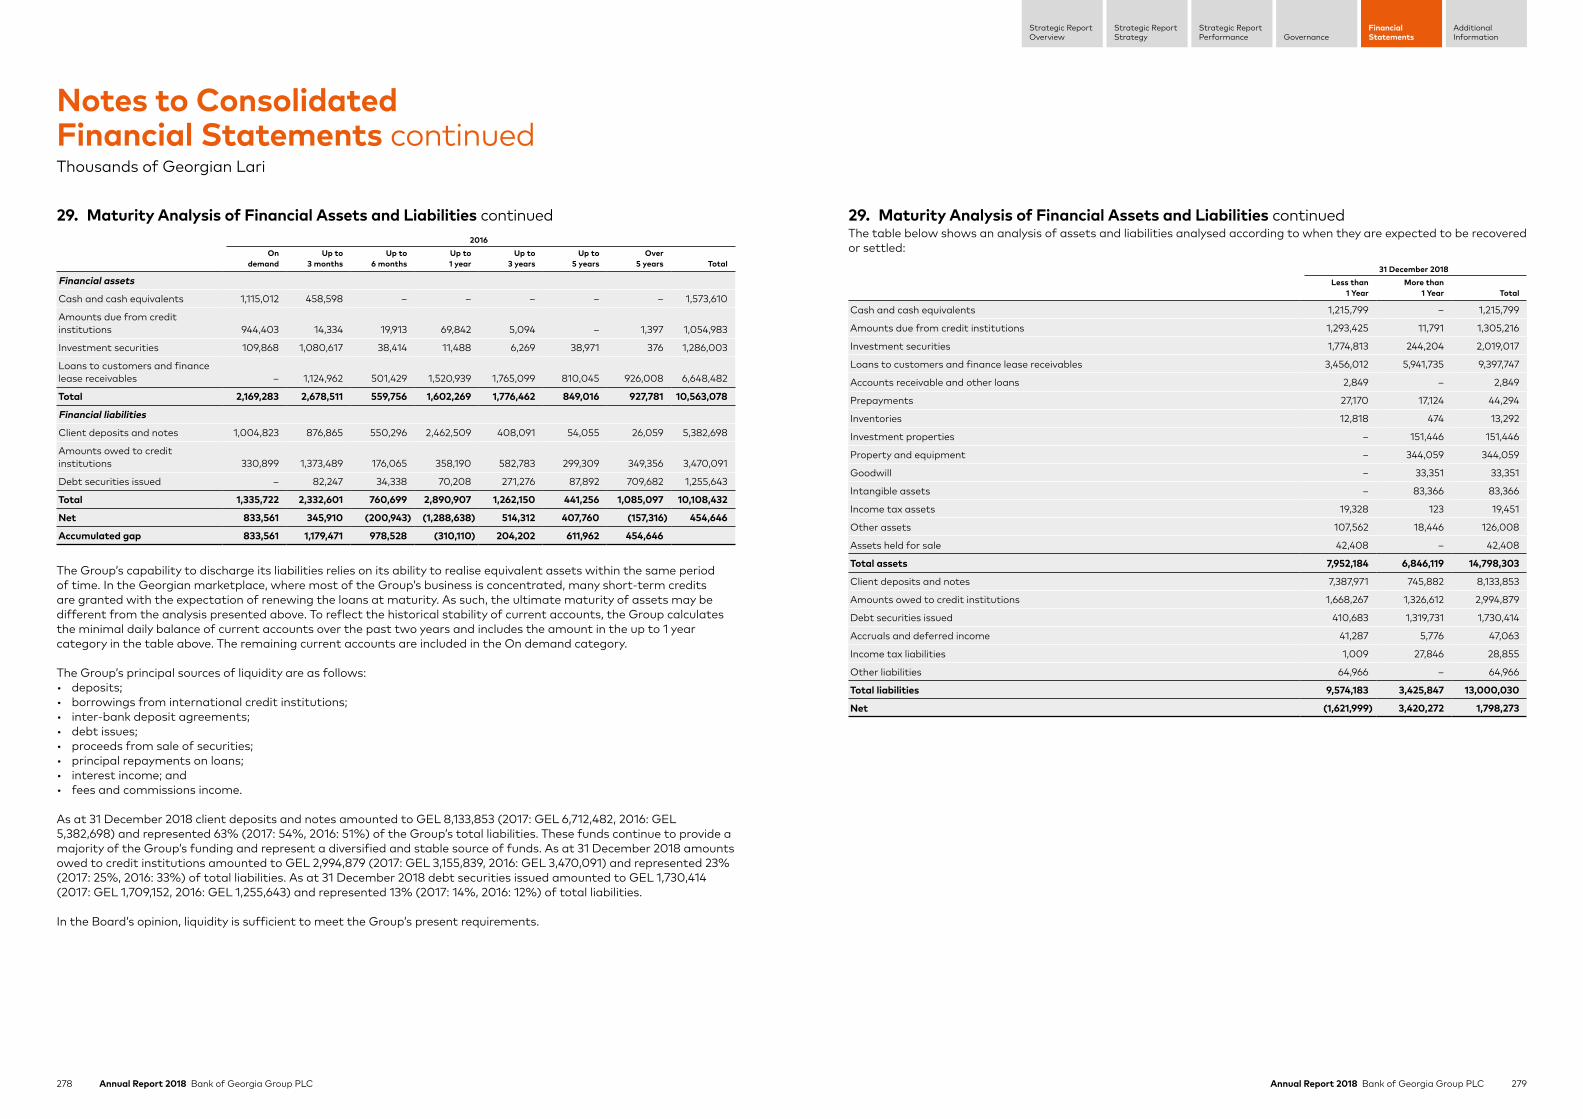
278 Annual Report 2018 Bank of Georgia Group PLC 279Annual Report 2018 Bank of Georgia Group PLC
Strategic ReportStrategy
Strategic ReportPerformance Governance
FinancialStatements
AdditionalInformation
Strategic ReportOverview
29. Maturity Analysis of Financial Assets and Liabilities continued2016
On demand
Up to 3 months
Up to 6 months
Up to 1 year
Up to 3 years
Up to 5 years
Over 5 years Total
Financial assets
Cash and cash equivalents 1,115,012 458,598 – – – – – 1,573,610
Amounts due from credit institutions 944,403 14,334 19,913 69,842 5,094 – 1,397 1,054,983
Investment securities 109,868 1,080,617 38,414 11,488 6,269 38,971 376 1,286,003
Loans to customers and finance lease receivables – 1,124,962 501,429 1,520,939 1,765,099 810,045 926,008 6,648,482
Total 2,169,283 2,678,511 559,756 1,602,269 1,776,462 849,016 927,781 10,563,078
Financial liabilities
Client deposits and notes 1,004,823 876,865 550,296 2,462,509 408,091 54,055 26,059 5,382,698
Amounts owed to credit institutions 330,899 1,373,489 176,065 358,190 582,783 299,309 349,356 3,470,091
Debt securities issued – 82,247 34,338 70,208 271,276 87,892 709,682 1,255,643
Total 1,335,722 2,332,601 760,699 2,890,907 1,262,150 441,256 1,085,097 10,108,432
Net 833,561 345,910 (200,943) (1,288,638) 514,312 407,760 (157,316) 454,646
Accumulated gap 833,561 1,179,471 978,528 (310,110) 204,202 611,962 454,646
The Group’s capability to discharge its liabilities relies on its ability to realise equivalent assets within the same period of time. In the Georgian marketplace, where most of the Group’s business is concentrated, many short-term credits are granted with the expectation of renewing the loans at maturity. As such, the ultimate maturity of assets may be different from the analysis presented above. To reflect the historical stability of current accounts, the Group calculates the minimal daily balance of current accounts over the past two years and includes the amount in the up to 1 year category in the table above. The remaining current accounts are included in the On demand category.
The Group’s principal sources of liquidity are as follows:• deposits;• borrowings from international credit institutions;• inter-bank deposit agreements;• debt issues;• proceeds from sale of securities;• principal repayments on loans;• interest income; and• fees and commissions income.
As at 31 December 2018 client deposits and notes amounted to GEL 8,133,853 (2017: GEL 6,712,482, 2016: GEL 5,382,698) and represented 63% (2017: 54%, 2016: 51%) of the Group’s total liabilities. These funds continue to provide a majority of the Group’s funding and represent a diversified and stable source of funds. As at 31 December 2018 amounts owed to credit institutions amounted to GEL 2,994,879 (2017: GEL 3,155,839, 2016: GEL 3,470,091) and represented 23% (2017: 25%, 2016: 33%) of total liabilities. As at 31 December 2018 debt securities issued amounted to GEL 1,730,414 (2017: GEL 1,709,152, 2016: GEL 1,255,643) and represented 13% (2017: 14%, 2016: 12%) of total liabilities.
In the Board’s opinion, liquidity is sufficient to meet the Group’s present requirements.
Notes to Consolidated Financial Statements continuedThousands of Georgian Lari
29. Maturity Analysis of Financial Assets and Liabilities continuedThe table below shows an analysis of assets and liabilities analysed according to when they are expected to be recovered or settled:
31 December 2018Less than
1 YearMore than
1 Year Total
Cash and cash equivalents 1,215,799 – 1,215,799
Amounts due from credit institutions 1,293,425 11,791 1,305,216
Investment securities 1,774,813 244,204 2,019,017
Loans to customers and finance lease receivables 3,456,012 5,941,735 9,397,747
Accounts receivable and other loans 2,849 – 2,849
Prepayments 27,170 17,124 44,294
Inventories 12,818 474 13,292
Investment properties – 151,446 151,446
Property and equipment – 344,059 344,059
Goodwill – 33,351 33,351
Intangible assets – 83,366 83,366
Income tax assets 19,328 123 19,451
Other assets 107,562 18,446 126,008
Assets held for sale 42,408 – 42,408
Total assets 7,952,184 6,846,119 14,798,303
Client deposits and notes 7,387,971 745,882 8,133,853
Amounts owed to credit institutions 1,668,267 1,326,612 2,994,879
Debt securities issued 410,683 1,319,731 1,730,414
Accruals and deferred income 41,287 5,776 47,063
Income tax liabilities 1,009 27,846 28,855
Other liabilities 64,966 – 64,966
Total liabilities 9,574,183 3,425,847 13,000,030
Net (1,621,999) 3,420,272 1,798,273
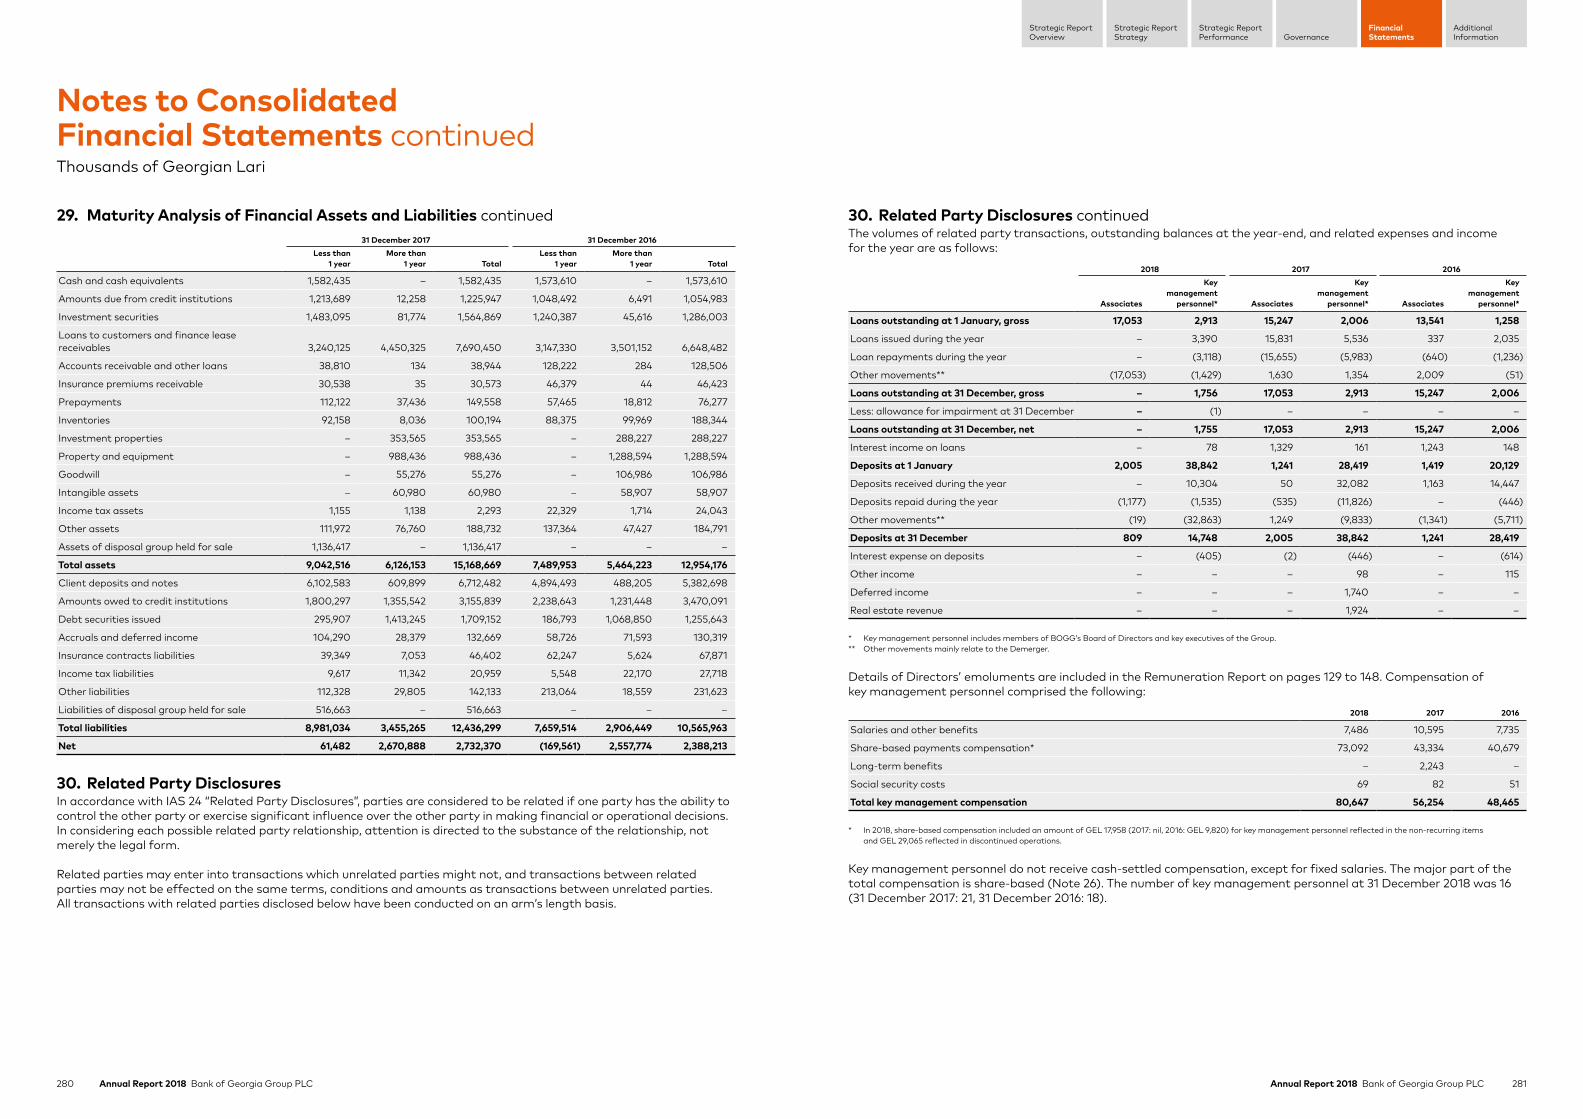
280 Annual Report 2018 Bank of Georgia Group PLC 281Annual Report 2018 Bank of Georgia Group PLC
Strategic ReportStrategy
Strategic ReportPerformance Governance
FinancialStatements
AdditionalInformation
Strategic ReportOverview
29. Maturity Analysis of Financial Assets and Liabilities continued31 December 2017 31 December 2016
Less than 1 year
More than 1 year Total
Less than 1 year
More than 1 year Total
Cash and cash equivalents 1,582,435 – 1,582,435 1,573,610 – 1,573,610
Amounts due from credit institutions 1,213,689 12,258 1,225,947 1,048,492 6,491 1,054,983
Investment securities 1,483,095 81,774 1,564,869 1,240,387 45,616 1,286,003
Loans to customers and finance lease receivables 3,240,125 4,450,325 7,690,450 3,147,330 3,501,152 6,648,482
Accounts receivable and other loans 38,810 134 38,944 128,222 284 128,506
Insurance premiums receivable 30,538 35 30,573 46,379 44 46,423
Prepayments 112,122 37,436 149,558 57,465 18,812 76,277
Inventories 92,158 8,036 100,194 88,375 99,969 188,344
Investment properties – 353,565 353,565 – 288,227 288,227
Property and equipment – 988,436 988,436 – 1,288,594 1,288,594
Goodwill – 55,276 55,276 – 106,986 106,986
Intangible assets – 60,980 60,980 – 58,907 58,907
Income tax assets 1,155 1,138 2,293 22,329 1,714 24,043
Other assets 111,972 76,760 188,732 137,364 47,427 184,791
Assets of disposal group held for sale 1,136,417 – 1,136,417 – – –
Total assets 9,042,516 6,126,153 15,168,669 7,489,953 5,464,223 12,954,176
Client deposits and notes 6,102,583 609,899 6,712,482 4,894,493 488,205 5,382,698
Amounts owed to credit institutions 1,800,297 1,355,542 3,155,839 2,238,643 1,231,448 3,470,091
Debt securities issued 295,907 1,413,245 1,709,152 186,793 1,068,850 1,255,643
Accruals and deferred income 104,290 28,379 132,669 58,726 71,593 130,319
Insurance contracts liabilities 39,349 7,053 46,402 62,247 5,624 67,871
Income tax liabilities 9,617 11,342 20,959 5,548 22,170 27,718
Other liabilities 112,328 29,805 142,133 213,064 18,559 231,623
Liabilities of disposal group held for sale 516,663 – 516,663 – – –
Total liabilities 8,981,034 3,455,265 12,436,299 7,659,514 2,906,449 10,565,963
Net 61,482 2,670,888 2,732,370 (169,561) 2,557,774 2,388,213
30. Related Party DisclosuresIn accordance with IAS 24 “Related Party Disclosures”, parties are considered to be related if one party has the ability to control the other party or exercise significant influence over the other party in making financial or operational decisions. In considering each possible related party relationship, attention is directed to the substance of the relationship, not merely the legal form.
Related parties may enter into transactions which unrelated parties might not, and transactions between related parties may not be effected on the same terms, conditions and amounts as transactions between unrelated parties. All transactions with related parties disclosed below have been conducted on an arm’s length basis.
Notes to Consolidated Financial Statements continuedThousands of Georgian Lari
30. Related Party Disclosures continuedThe volumes of related party transactions, outstanding balances at the year-end, and related expenses and income for the year are as follows:
2018 2017 2016
Associates
Key management
personnel* Associates
Key management
personnel* Associates
Key management
personnel*
Loans outstanding at 1 January, gross 17,053 2,913 15,247 2,006 13,541 1,258
Loans issued during the year – 3,390 15,831 5,536 337 2,035
Loan repayments during the year – (3,118) (15,655) (5,983) (640) (1,236)
Other movements** (17,053) (1,429) 1,630 1,354 2,009 (51)
Loans outstanding at 31 December, gross – 1,756 17,053 2,913 15,247 2,006
Less: allowance for impairment at 31 December – (1) – – – –
Loans outstanding at 31 December, net – 1,755 17,053 2,913 15,247 2,006
Interest income on loans – 78 1,329 161 1,243 148
Deposits at 1 January 2,005 38,842 1,241 28,419 1,419 20,129
Deposits received during the year – 10,304 50 32,082 1,163 14,447
Deposits repaid during the year (1,177) (1,535) (535) (11,826) – (446)
Other movements** (19) (32,863) 1,249 (9,833) (1,341) (5,711)
Deposits at 31 December 809 14,748 2,005 38,842 1,241 28,419
Interest expense on deposits – (405) (2) (446) – (614)
Other income – – – 98 – 115
Deferred income – – – 1,740 – –
Real estate revenue – – – 1,924 – –
* Key management personnel includes members of BOGG’s Board of Directors and key executives of the Group.** Other movements mainly relate to the Demerger.
Details of Directors’ emoluments are included in the Remuneration Report on pages 129 to 148. Compensation of key management personnel comprised the following:
2018 2017 2016
Salaries and other benefits 7,486 10,595 7,735
Share-based payments compensation* 73,092 43,334 40,679
Long-term benefits – 2,243 –
Social security costs 69 82 51
Total key management compensation 80,647 56,254 48,465
* In 2018, share-based compensation included an amount of GEL 17,958 (2017: nil, 2016: GEL 9,820) for key management personnel reflected in the non-recurring items and GEL 29,065 reflected in discontinued operations.
Key management personnel do not receive cash-settled compensation, except for fixed salaries. The major part of the total compensation is share-based (Note 26). The number of key management personnel at 31 December 2018 was 16 (31 December 2017: 21, 31 December 2016: 18).
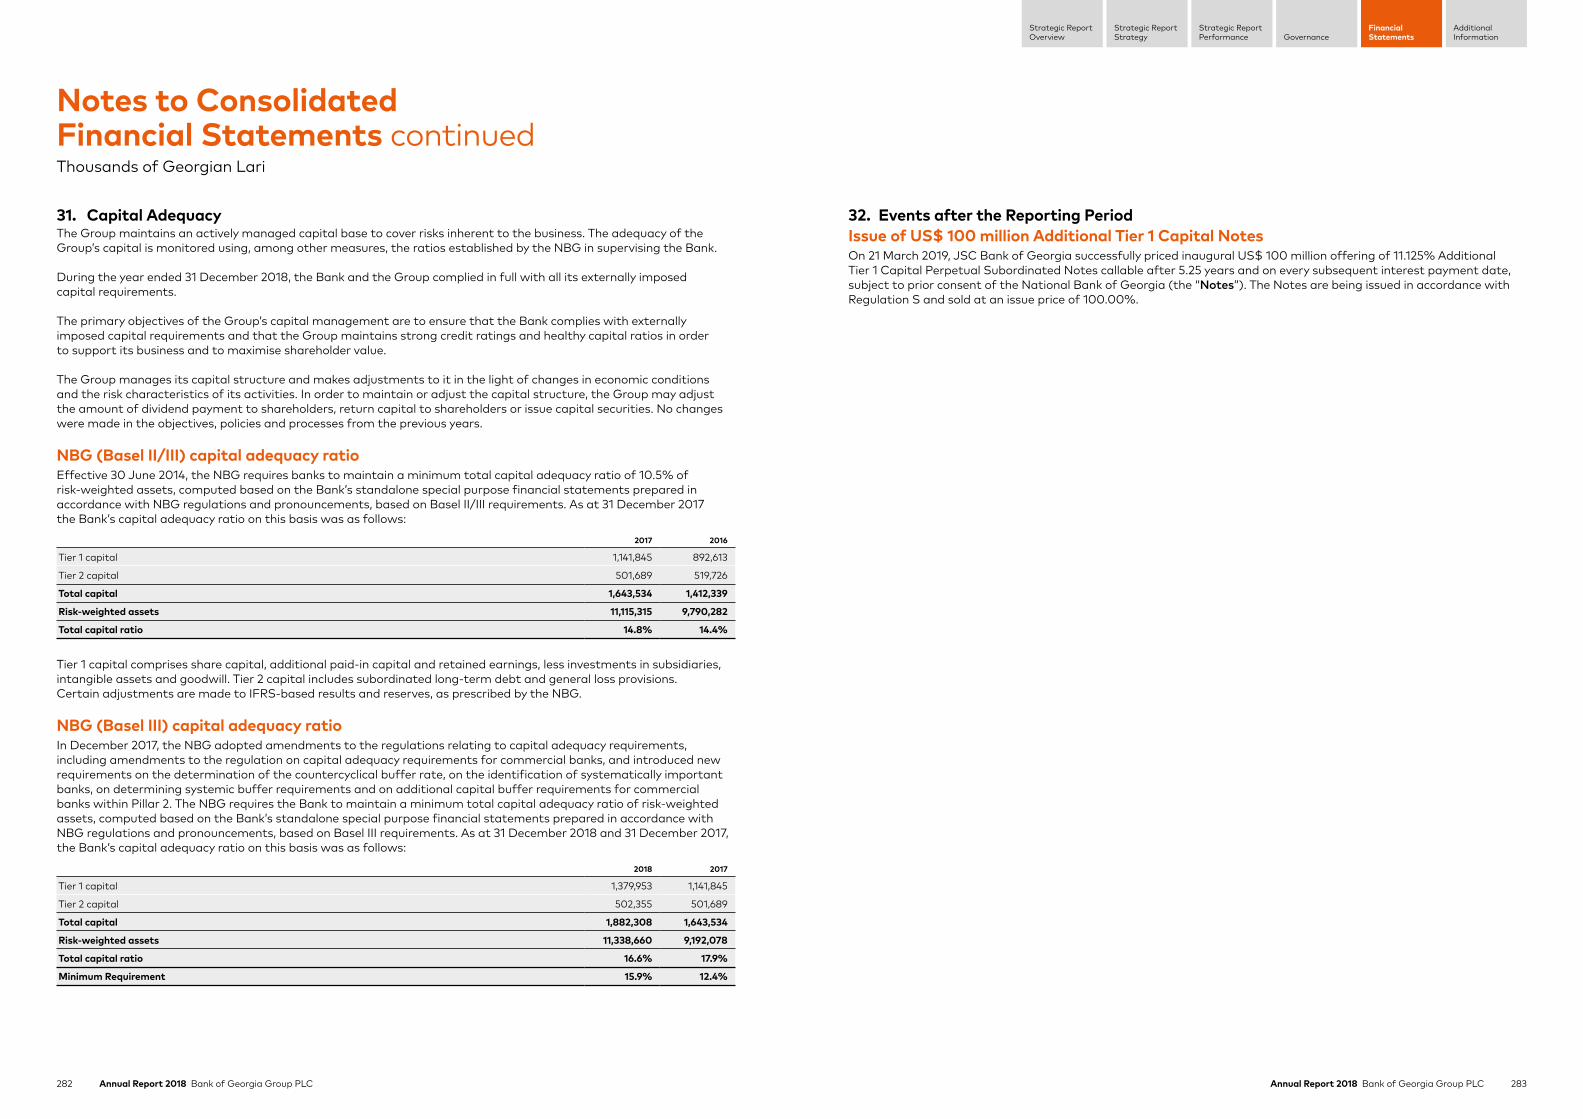
282 Annual Report 2018 Bank of Georgia Group PLC 283Annual Report 2018 Bank of Georgia Group PLC
Strategic ReportStrategy
Strategic ReportPerformance Governance
FinancialStatements
AdditionalInformation
Strategic ReportOverview
31. Capital AdequacyThe Group maintains an actively managed capital base to cover risks inherent to the business. The adequacy of the Group’s capital is monitored using, among other measures, the ratios established by the NBG in supervising the Bank.
During the year ended 31 December 2018, the Bank and the Group complied in full with all its externally imposed capital requirements.
The primary objectives of the Group’s capital management are to ensure that the Bank complies with externally imposed capital requirements and that the Group maintains strong credit ratings and healthy capital ratios in order to support its business and to maximise shareholder value.
The Group manages its capital structure and makes adjustments to it in the light of changes in economic conditions and the risk characteristics of its activities. In order to maintain or adjust the capital structure, the Group may adjust the amount of dividend payment to shareholders, return capital to shareholders or issue capital securities. No changes were made in the objectives, policies and processes from the previous years.
NBG (Basel II/III) capital adequacy ratioEffective 30 June 2014, the NBG requires banks to maintain a minimum total capital adequacy ratio of 10.5% of risk-weighted assets, computed based on the Bank’s standalone special purpose financial statements prepared in accordance with NBG regulations and pronouncements, based on Basel II/III requirements. As at 31 December 2017 the Bank’s capital adequacy ratio on this basis was as follows:
2017 2016
Tier 1 capital 1,141,845 892,613
Tier 2 capital 501,689 519,726
Total capital 1,643,534 1,412,339
Risk-weighted assets 11,115,315 9,790,282
Total capital ratio 14.8% 14.4%
Tier 1 capital comprises share capital, additional paid-in capital and retained earnings, less investments in subsidiaries, intangible assets and goodwill. Tier 2 capital includes subordinated long-term debt and general loss provisions. Certain adjustments are made to IFRS-based results and reserves, as prescribed by the NBG.
NBG (Basel III) capital adequacy ratioIn December 2017, the NBG adopted amendments to the regulations relating to capital adequacy requirements, including amendments to the regulation on capital adequacy requirements for commercial banks, and introduced new requirements on the determination of the countercyclical buffer rate, on the identification of systematically important banks, on determining systemic buffer requirements and on additional capital buffer requirements for commercial banks within Pillar 2. The NBG requires the Bank to maintain a minimum total capital adequacy ratio of risk-weighted assets, computed based on the Bank’s standalone special purpose financial statements prepared in accordance with NBG regulations and pronouncements, based on Basel III requirements. As at 31 December 2018 and 31 December 2017, the Bank’s capital adequacy ratio on this basis was as follows:
2018 2017
Tier 1 capital 1,379,953 1,141,845
Tier 2 capital 502,355 501,689
Total capital 1,882,308 1,643,534
Risk-weighted assets 11,338,660 9,192,078
Total capital ratio 16.6% 17.9%
Minimum Requirement 15.9% 12.4%
Notes to Consolidated Financial Statements continuedThousands of Georgian Lari
32. Events after the Reporting PeriodIssue of US$ 100 million Additional Tier 1 Capital NotesOn 21 March 2019, JSC Bank of Georgia successfully priced inaugural US$ 100 million offering of 11.125% Additional Tier 1 Capital Perpetual Subordinated Notes callable after 5.25 years and on every subsequent interest payment date, subject to prior consent of the National Bank of Georgia (the “Notes”). The Notes are being issued in accordance with Regulation S and sold at an issue price of 100.00%.
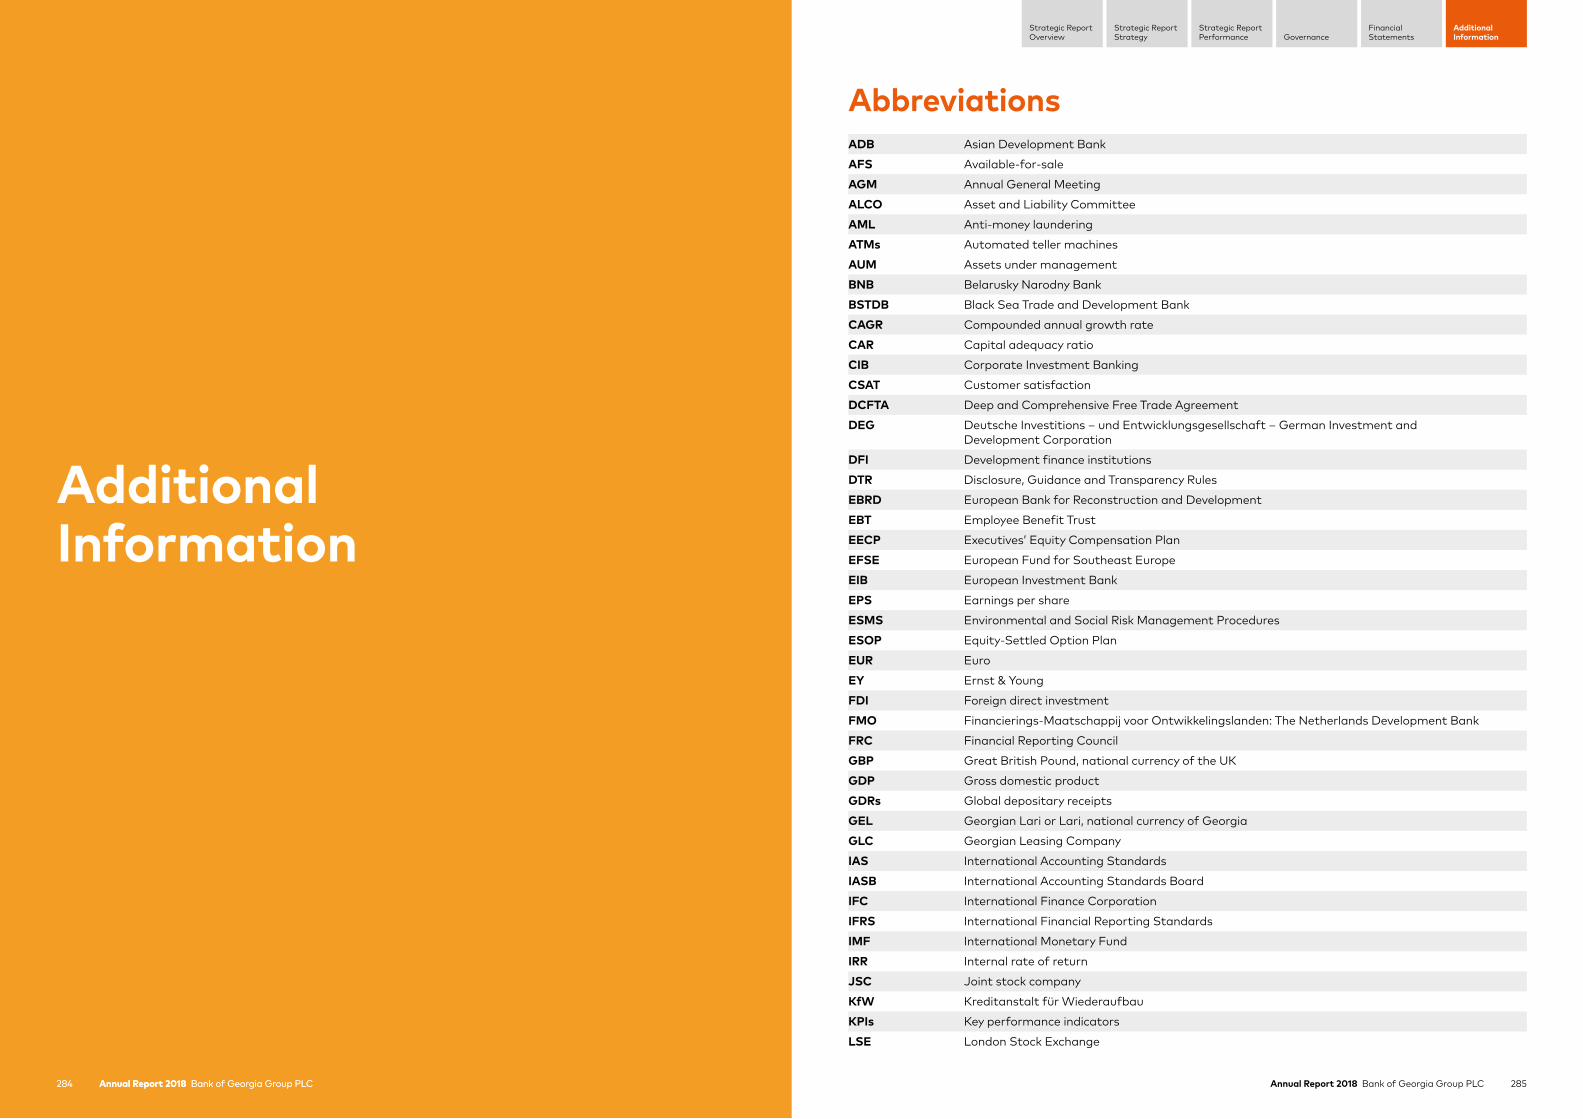
285Annual Report 2018 Bank of Georgia Group PLC
Strategic ReportStrategy
Strategic ReportPerformance Governance
FinancialStatements
AdditionalInformation
Strategic ReportOverview
Annual Report 2018 Bank of Georgia Group PLC284 Annual Report 2018 Bank of Georgia Group PLC284
ADB Asian Development BankAFS Available-for-saleAGM Annual General MeetingALCO Asset and Liability CommitteeAML Anti-money launderingATMs Automated teller machinesAUM Assets under managementBNB Belarusky Narodny BankBSTDB Black Sea Trade and Development BankCAGR Compounded annual growth rateCAR Capital adequacy ratioCIB Corporate Investment BankingCSAT Customer satisfactionDCFTA Deep and Comprehensive Free Trade AgreementDEG Deutsche Investitions – und Entwicklungsgesellschaft – German Investment and
Development CorporationDFI Development finance institutionsDTR Disclosure, Guidance and Transparency RulesEBRD European Bank for Reconstruction and DevelopmentEBT Employee Benefit TrustEECP Executives’ Equity Compensation PlanEFSE European Fund for Southeast EuropeEIB European Investment BankEPS Earnings per shareESMS Environmental and Social Risk Management ProceduresESOP Equity-Settled Option PlanEUR EuroEY Ernst & YoungFDI Foreign direct investmentFMO Financierings-Maatschappij voor Ontwikkelingslanden: The Netherlands Development BankFRC Financial Reporting CouncilGBP Great British Pound, national currency of the UKGDP Gross domestic productGDRs Global depositary receiptsGEL Georgian Lari or Lari, national currency of GeorgiaGLC Georgian Leasing CompanyIAS International Accounting StandardsIASB International Accounting Standards BoardIFC International Finance CorporationIFRS International Financial Reporting StandardsIMF International Monetary FundIRR Internal rate of returnJSC Joint stock companyKfW Kreditanstalt für WiederaufbauKPIs Key performance indicatorsLSE London Stock Exchange
Abbreviations
Additional Information
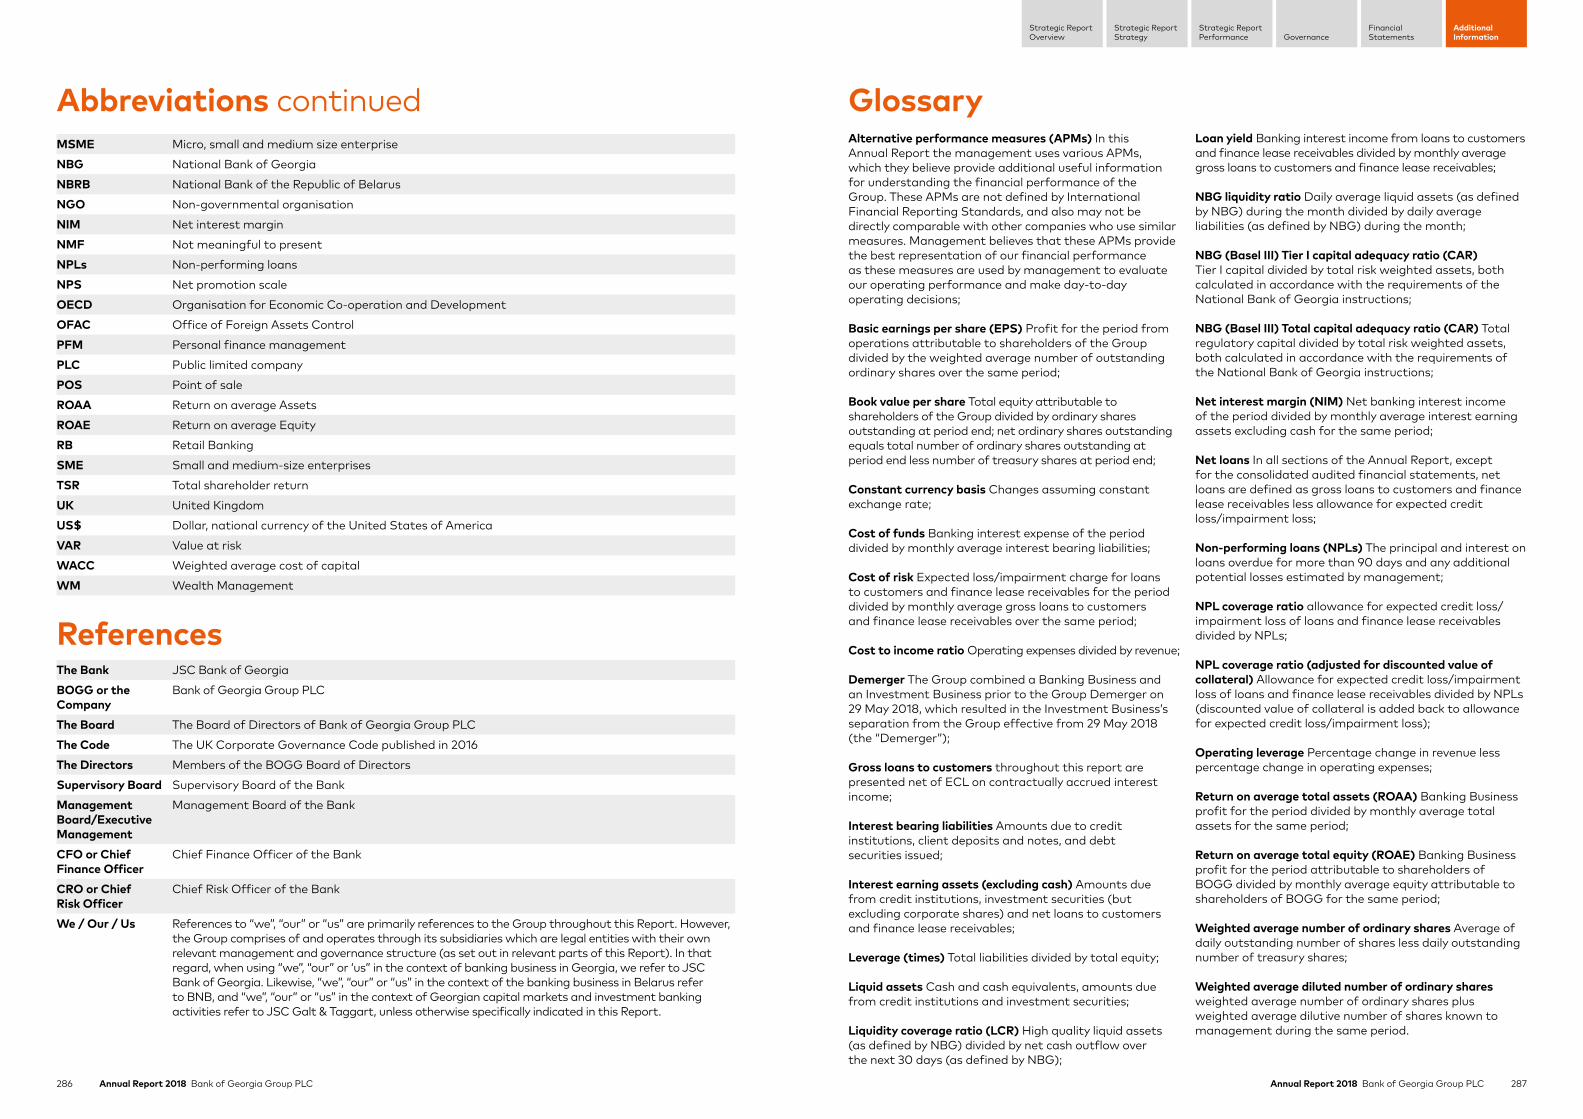
286 Annual Report 2018 Bank of Georgia Group PLC 287Annual Report 2018 Bank of Georgia Group PLC
Strategic ReportStrategy
Strategic ReportPerformance Governance
FinancialStatements
AdditionalInformation
Strategic ReportOverview
Alternative performance measures (APMs) In this Annual Report the management uses various APMs, which they believe provide additional useful information for understanding the financial performance of the Group. These APMs are not defined by International Financial Reporting Standards, and also may not be directly comparable with other companies who use similar measures. Management believes that these APMs provide the best representation of our financial performance as these measures are used by management to evaluate our operating performance and make day-to-day operating decisions;
Basic earnings per share (EPS) Profit for the period from operations attributable to shareholders of the Group divided by the weighted average number of outstanding ordinary shares over the same period;
Book value per share Total equity attributable to shareholders of the Group divided by ordinary shares outstanding at period end; net ordinary shares outstanding equals total number of ordinary shares outstanding at period end less number of treasury shares at period end;
Constant currency basis Changes assuming constant exchange rate;
Cost of funds Banking interest expense of the period divided by monthly average interest bearing liabilities;
Cost of risk Expected loss/impairment charge for loans to customers and finance lease receivables for the period divided by monthly average gross loans to customers and finance lease receivables over the same period;
Cost to income ratio Operating expenses divided by revenue;
Demerger The Group combined a Banking Business and an Investment Business prior to the Group Demerger on 29 May 2018, which resulted in the Investment Business’s separation from the Group effective from 29 May 2018 (the “Demerger”);
Gross loans to customers throughout this report are presented net of ECL on contractually accrued interest income;
Interest bearing liabilities Amounts due to credit institutions, client deposits and notes, and debt securities issued;
Interest earning assets (excluding cash) Amounts due from credit institutions, investment securities (but excluding corporate shares) and net loans to customers and finance lease receivables;
Leverage (times) Total liabilities divided by total equity;
Liquid assets Cash and cash equivalents, amounts due from credit institutions and investment securities;
Liquidity coverage ratio (LCR) High quality liquid assets (as defined by NBG) divided by net cash outflow over the next 30 days (as defined by NBG);
Loan yield Banking interest income from loans to customers and finance lease receivables divided by monthly average gross loans to customers and finance lease receivables;
NBG liquidity ratio Daily average liquid assets (as defined by NBG) during the month divided by daily average liabilities (as defined by NBG) during the month;
NBG (Basel III) Tier I capital adequacy ratio (CAR) Tier I capital divided by total risk weighted assets, both calculated in accordance with the requirements of the National Bank of Georgia instructions;
NBG (Basel III) Total capital adequacy ratio (CAR) Total regulatory capital divided by total risk weighted assets, both calculated in accordance with the requirements of the National Bank of Georgia instructions;
Net interest margin (NIM) Net banking interest income of the period divided by monthly average interest earning assets excluding cash for the same period;
Net loans In all sections of the Annual Report, except for the consolidated audited financial statements, net loans are defined as gross loans to customers and finance lease receivables less allowance for expected credit loss/impairment loss;
Non-performing loans (NPLs) The principal and interest on loans overdue for more than 90 days and any additional potential losses estimated by management;
NPL coverage ratio allowance for expected credit loss/impairment loss of loans and finance lease receivables divided by NPLs;
NPL coverage ratio (adjusted for discounted value of collateral) Allowance for expected credit loss/impairment loss of loans and finance lease receivables divided by NPLs (discounted value of collateral is added back to allowance for expected credit loss/impairment loss);
Operating leverage Percentage change in revenue less percentage change in operating expenses;
Return on average total assets (ROAA) Banking Business profit for the period divided by monthly average total assets for the same period;
Return on average total equity (ROAE) Banking Business profit for the period attributable to shareholders of BOGG divided by monthly average equity attributable to shareholders of BOGG for the same period;
Weighted average number of ordinary shares Average of daily outstanding number of shares less daily outstanding number of treasury shares;
Weighted average diluted number of ordinary shares weighted average number of ordinary shares plus weighted average dilutive number of shares known to management during the same period.
GlossaryMSME Micro, small and medium size enterpriseNBG National Bank of GeorgiaNBRB National Bank of the Republic of BelarusNGO Non-governmental organisationNIM Net interest marginNMF Not meaningful to presentNPLs Non-performing loansNPS Net promotion scaleOECD Organisation for Economic Co-operation and DevelopmentOFAC Office of Foreign Assets ControlPFM Personal finance managementPLC Public limited companyPOS Point of saleROAA Return on average AssetsROAE Return on average EquityRB Retail BankingSME Small and medium-size enterprisesTSR Total shareholder returnUK United KingdomUS$ Dollar, national currency of the United States of AmericaVAR Value at riskWACC Weighted average cost of capitalWM Wealth Management
ReferencesThe Bank JSC Bank of GeorgiaBOGG or the Company
Bank of Georgia Group PLC
The Board The Board of Directors of Bank of Georgia Group PLCThe Code The UK Corporate Governance Code published in 2016The Directors Members of the BOGG Board of DirectorsSupervisory Board Supervisory Board of the BankManagement Board/Executive Management
Management Board of the Bank
CFO or Chief Finance Officer
Chief Finance Officer of the Bank
CRO or Chief Risk Officer
Chief Risk Officer of the Bank
We / Our / Us References to “we”, “our” or “us” are primarily references to the Group throughout this Report. However, the Group comprises of and operates through its subsidiaries which are legal entities with their own relevant management and governance structure (as set out in relevant parts of this Report). In that regard, when using “we”, “our” or ‘us” in the context of banking business in Georgia, we refer to JSC Bank of Georgia. Likewise, “we”, “our” or “us” in the context of the banking business in Belarus refer to BNB, and “we”, “our” or “us” in the context of Georgian capital markets and investment banking activities refer to JSC Galt & Taggart, unless otherwise specifically indicated in this Report.
Abbreviations continued
02 Annual Report 2018 Bank of Georgia Group PLC
Our website All shareholders and potential shareholders can gain access to the Annual Report, presentations to investors, key financial information, regulatory news, share and dividend data, AGM documentation and other significant information about Bank of Georgia Group PLC at http://www.bankofgeorgiagroup.com
Our registered addressBank of Georgia Group PLC 84 Brook Street London W1K 5EH United Kingdom
Annual General MeetingThe Annual General Meeting of Bank of Georgia Group PLC (the “AGM”) will be held at Baker & McKenzie LLP, 100 New Bridge Street, London EC4V 6JA. Details of the date, time and business to be conducted at the AGM is contained in the Notice of AGM, which is available on the BOGG’s website: https://www.bankofgeorgiagroup.com/information/meetings
Shareholder enquiriesBank of Georgia Group’s share register is maintained by Computershare Investor Services PLC.Any queries about the administration of holdings of ordinary shares, such as change of address or change of ownership, should be directed to the address or telephone number immediately below. Holders of ordinary shares may also check details of their shareholding, subject to passing an identity check, by visiting the Registrar’s website: www.investorcentre.co.uk or by calling the Shareholder Helpline on +44 (0)370 873 5866. Computershare Investor Services PLC The Pavilions, Bridgwater Road Bristol BS99 6ZY United Kingdom +44 (0)870 873 5866
DividendsOn 19 February 2019, the Directors of Bank of Georgia Group declared their intention to recommend a final dividend in the amount of GEL 2.55 per share (payable in British Pounds Sterling at the prevailing rate), subject to the shareholder approval at the BOGG’s AGM. As a holding company whose principal assets are the shares of its subsidiaries, Bank of Georgia Group relies primarily on dividends and other statutorily and contractually permissible payments from its subsidiaries, principally the Bank, to generate reserves necessary to pay dividends to its shareholders.
If the final dividend is approved at BOGG’s AGM on 17 May 2019, BOGG expects the following dividend timetable:
Ex-Dividend Date: 30 May 2019Record Date: 31 May 2019Currency Conversion Date: 3 June 2019Payment Date: 28 June 2019
The National Bank of Georgia Georgian Lari/British Pounds Sterling average exchange rate for the period 27 to 31 May 2019 will be used as the exchange rate on the Currency Conversion Date.
Forward-looking statementsCertain statements in this Annual Report and Accounts contain forward-looking statements, including, but not limited to, statements concerning expectations, projections, objectives, targets, goals, strategies, future events, future revenues or performance, capital expenditures, financing needs, plans or intentions relating to acquisitions, competitive strengths and weaknesses, plans or goals relating to financial position and future operations and development. Although Bank of Georgia Group PLC believes that the expectations and opinions reflected in such forward-looking statements are reasonable, no assurance can be given that such expectations and opinions will prove to have been correct. By their nature, these forward-looking statements are subject to a number of known and unknown risks, uncertainties and contingencies, and actual results and events could differ materially from those currently being anticipated as reflected in such statements. Important factors that could cause actual results to differ materially from those expressed or implied in forward-looking statements, certain of which are beyond our control, and certain of which include, among other things, those described in “Principal risks and uncertainties” included in this Annual Report and Accounts, see pages 60 to 67. No part of these results or report constitutes, or shall be taken to constitute, an invitation or inducement to invest in Bank of Georgia Group PLC or any other entity and must not be relied upon in any way in connection with any investment decision. Bank of Georgia Group PLC undertakes no obligation to update any forward-looking statements, whether as a result of new information, future events or otherwise, except to the extent legally required. Nothing in this document should be construed as a profit forecast.
Shareholder Information