140513 Commodity Strategy report - Macro Research...
51
Trading Strategy Commodity strategy report, May 13, 2014 A Commodity bust in slow motion In the midst of an unsynchronised commodity bust Supply wave is here after a decade of oil, gas and mining capex flurry Supply dynamics favour nickel, zinc and aluminium over copper and iron ore Supply disruptions hindered oil price gravidity but pressure increases
Transcript of 140513 Commodity Strategy report - Macro Research...

Trading Strategy
Commodity strategy report, May 13, 2014
A Commodity bust in slow motion
In the midst of an unsynchronised commodity bust
Supply wave is here after a decade of oil, gas and mining capex flurry
Supply dynamics favour nickel, zinc and aluminium over copper and iron ore
Supply disruptions hindered oil price gravidity but pressure increases

Contents
Summary and trading case 3
This commodity cycle in perspective 5
A mining bust in slow motion 8
Precious metals: gold value in the eye of the beholder 21
Western world steel rising from the ashes 25
Crude oil and natural gas – the boom of 21st century 29
Is a new bull market coming in commodities? 35
Appendix: Price charts 37
Appendix: Production and consumption charts 42
Disclaimers 50
Martin Jansson +46 (0)87012343 [email protected]
This report has been prepared solely on raw data
from Bloomberg and the Raw Materials Group,
and shows how the timing differences between the
decision to expand and production coming on
stream have a significant impact on metal prices.
We conclude that the wave of copper and iron ore
supply set to hit the market will suppress prices,
while aluminium, nickel and zinc have already
taken the pain. Oil production is reallocated from
ME to US, and pressure on OPEC will increase as
supply disruptions ease in ME.

Trading Strategy Commodity report, May 13, 2014
3
Summary and trading case We have analysed the last decade of booming commodity prices. After digging into 1,500 mining projects,
drilling down into the US shale revolution, and looking at years of supply disruptions in the Middle East, we
conclude that we are in the midst of an unsynchronised commodity bust, where supply will take the lead after
years of tracking intense commodity consumption in China. We expect that oil, iron ore, copper, zinc,
aluminium and nickel will all be priced on the marginal cost of production in the coming years.
Commodity prices no longer walk in tandem, conclusions: The step change in Chinese commodity demand is petering out. As the nation’s intensity of
commodity consumption normalises, we expect metal, oil and gas prices to be increasingly determined by supply dynamics, as supply has few other barriers to entry than capital and time on hand.
Zinc and nickel were filled with low hanging capex fruit, mostly brownfield expansions, even before the financial crisis, and are better balanced markets. These are also the first to hit a supply deficit again, starting with the nickel rally this year. Zinc supply is likely to become an issue, but our supply analysis indicates no shortage emerging until 2016.
Copper and iron ore have needed larger and more time-consuming greenfield projects to match demand. The current ballooning project pipeline will likely push prices of these commodities lower. In contrast to iron ore, copper projects have a high incentive price, meaning the price dive should be followed by a rebound back to current levels within a few years.
Aluminium is set to remain in a tight, flat range as the main input material; bauxite is not a hard rock mined raw material. It is in constant and abundant supply, meaning that bauxite prices have not come up as a result of the deficits that have driven the mining industry.
Falling input costs from lower iron ore prices work in steel producers’ favour and should help the bleeding steel industry to expand margins ahead, even though steel prices are set to fall by 10%. As a general topic ahead, we believe that we will see a relative power shift, where upstream stands to lose ground to downstream players.
The booming US shale production will likely continue to push worldwide energy costs down. Crude oil is set to fall in a scenario in which supply disruptions in the Middle East ease, but oil prices will have to remain relatively high to globalise the shale revolution and to bridge depleting US shale wells.
The platinum group metals stand out as being late-cycle in demand, where consumption intensity has yet to peak, while mining them is becoming increasingly complicated for various reasons.
Table 1: Price assumptions between now and 2018e
Source: Handelsbanken Capital Markets
Spot Low 2018 Low/spot 2018/spot
Iron ore 102 80 80 -22% -22%
Brent oil 108 90 95 -17% -12%
Copper 6 855 5 500 6 700 -20% -2%
Platinum 1 434 1 350 1 550 -6% 8%
Aluminium 1 773 1 800 2 000 2% 13%
Palladium 807 700 950 -13% 18%
Nickel 18 500 18 500 22 000 0% 19%
Zinc 2 050 2 000 2 500 -2% 22%
The mining spending
cycle is just about to
overshoot
Nickel is the first out
of the red; zinc next
in line to rally
Iron ore and copper
stand to lose
Lack of bottlenecks
keeps aluminium flat
Steel prices to fall on
lower iron ore
Oil set to fall when
supply disruptions
ease
PGMs to outperform
everything in the
long run

Trading Strategy Sector report, May 13, 2014
4
Mining project pipeline As a basis for this report, we have analysed the mining project pipeline consisting of more than 1,500 projects completed during the past decade or set to be completed until 2018. In the current pipeline we see the strongest annual supply growth in iron ore (7%), followed by copper (5%), aluminum (5%), zinc (4%) nickel (3%) and PGMs (0%). For the sake of supply/demand balances, we assume consumption growth of 4% for copper, iron ore, nickel, and zinc, and 5% for aluminium; growth rates in the past decade have amounted to 2.8 % for copper, 7.5% for iron ore, 5.5% for aluminium, 5.1% for zinc and 3.7% for nickel. Few macroeconomic analyses indicate that the coming five years will hold stronger commodity demand than during the past decade of strong Chinese growth featuring high commodity intensity.
Figure 1: Production growth projections for metals
Source: Handelsbanken Capital Markets
Trading case in the commodities universe
Brent: Put ratio spread. Buy 1 * June 2015 102 put, Sell 2 * June 2015 90 put
Premium = Pay USD 1.60
Max profit = USD 10.40
Breakeven = USD 100.40 and USD 79.60
Aluminium: Strangle. Sell 1 * June 2015 1,775 put, Sell 1 * June 2015 2,025 call
Premium = Receive USD 161/t
Breakeven = USD 1,614 and USD 2,186
Zinc: Call ratio spread. Buy 1 * June 2016 2,140 call, Sell 2 * June 2016 2,425 call
Premium = USD 0
Max profit = USD 285/t
Break even = USD 2,710/t
Copper:
A) Knock In Call, Buy 1 * Jun 2015 KI 6,000 call with 5,800 barrier
Premium = USD 70 (vs. USD 1000 for vanilla call)
B) Short copper outright
-5%
0%
5%
10%
15%
20%
25%
30%
35%
40%
45%
2014
2015
2016
2017
2018
YoY
cha
nge
IO Cu Al Zn Ni PGM:s Demand @ 4 %
More than 1,500
mining projects
analysed
We assume
consumption growth
of 4-5%

Trading Strategy Commodity report, May 13, 2014
5
This commodity cycle in perspective Extractive industries are boom/bust industries and are by nature caught in a constant struggle between
supply and demand dynamics. After two decades with buyers having the upper hand in pricing and
commodity prices being under pressure, China emerged as the largest single commodity consumer ever in
the early 2000s. With few barriers to entry other than capital and time on hand, resource industries
responded by expanding; this report digs into the supply side of the equation.
The third commodity boom in a century Since the late 19th century, there have been three golden periods of strong economic growth and high demand for minerals. The first commenced in the late 1800s with the industrial revolution in Europe and the USA. That cycle had many similarities with what is playing out in China today, with urbanisation and rapidly rising standards of living as main drivers. The second boom occurred after the Second World War with the reconstruction of Europe and the strong economic development in Korea and Japan. In 1950-1973, crude oil prices were effectively controlled by the Seven Sisters and remained nearly constant in real terms. The second boom ended along with the oil crisis in 1980. From the first oil crises in 1973-1974 until the early 1980s, oil prices skyrocketed, largely as a result of increased market control by the newly formed OPEC price cartel.
In 1980, real oil prices also started to decline after a decade of intensive exploration and new discoveries of reserves in non-OPEC countries such as Angola (today an OPEC member), Mexico, Norway, the former Soviet Union and the UK. All these new sources reduced the market control of OPEC from 53% in 1974 to 30% in 1985. The following two decades (1980s and 1990s) of depressing oil prices and, in total, three decades of depressing metal prices (1973-2003) had important consequences and forms the booming period of 2000s, when China entered the stage as the largest commodity-buying nation in history.
Figure 2: Real prices of crude oil and copper 1950-2013
Source:Bloomberg, Macrobond, Handelsbanken Capital Markets
China has echoes of
the industrial
revolution in Europe
and the US
In 1980, oil prices
started to decline
after non-OPEC
discoveries
Current boom came
after two decades of
price deflation and
low industry
spending
Trading Strategy Sector report, May 13, 2014
6
The Chinese derivatives and upstream/downstream mismatch
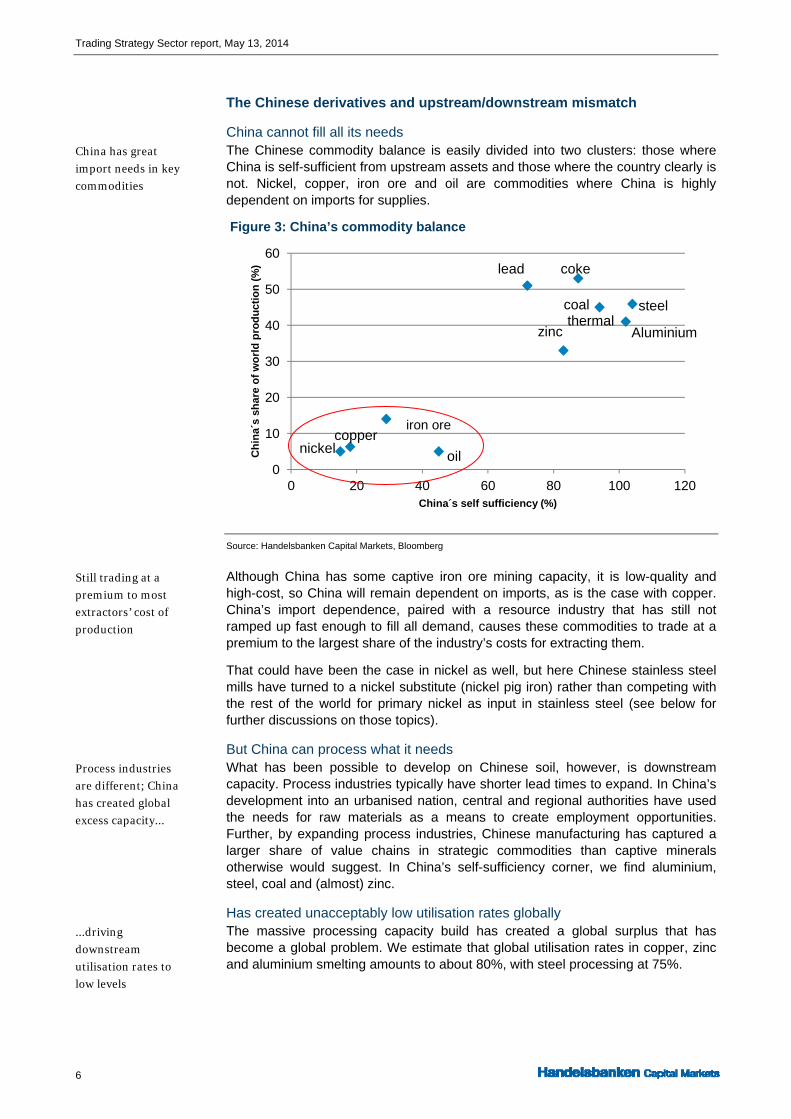
China cannot fill all its needs The Chinese commodity balance is easily divided into two clusters: those where China is self-sufficient from upstream assets and those where the country clearly is not. Nickel, copper, iron ore and oil are commodities where China is highly dependent on imports for supplies.
Figure 3: China’s commodity balance
Source: Handelsbanken Capital Markets, Bloomberg
Although China has some captive iron ore mining capacity, it is low-quality and high-cost, so China will remain dependent on imports, as is the case with copper. China’s import dependence, paired with a resource industry that has still not ramped up fast enough to fill all demand, causes these commodities to trade at a premium to the largest share of the industry’s costs for extracting them.
That could have been the case in nickel as well, but here Chinese stainless steel mills have turned to a nickel substitute (nickel pig iron) rather than competing with the rest of the world for primary nickel as input in stainless steel (see below for further discussions on those topics).
But China can process what it needs What has been possible to develop on Chinese soil, however, is downstream capacity. Process industries typically have shorter lead times to expand. In China’s development into an urbanised nation, central and regional authorities have used the needs for raw materials as a means to create employment opportunities. Further, by expanding process industries, Chinese manufacturing has captured a larger share of value chains in strategic commodities than captive minerals otherwise would suggest. In China’s self-sufficiency corner, we find aluminium, steel, coal and (almost) zinc.
Has created unacceptably low utilisation rates globally The massive processing capacity build has created a global surplus that has become a global problem. We estimate that global utilisation rates in copper, zinc and aluminium smelting amounts to about 80%, with steel processing at 75%.
0
10
20
30
40
50
60
0 20 40 60 80 100 120
Ch
ina´
s sh
are
of
wo
rld
pro
du
ctio
n (
%)
China´s self sufficiency (%)
iron ore
steel
copper
oil
zinc Aluminium
nickel
lead coke
coalthermal
China has great
import needs in key
commodities
Still trading at a
premium to most
extractors’ cost of
production
Process industries
are different; China
has created global
excess capacity...
...driving
downstream
utilisation rates to
low levels

Trading Strategy Commodity report, May 13, 2014
7
Lack of market concentration creates lack of industry discipline The upstream resources markets are fragmented. On aggregate, no single commodity is concentrated to the extent that supply could be controlled to alter the supply/demand equation. The implication of a lack of concentration combined with the lack of differentiating factors in end products (commodities) means that there is a lack of industry discipline; hence, each operator always strives to optimise its own outcome.
The exception here is oil, where OPEC controls 36% of production, enabling the cartel to act as one single producer. Iron ore was on the verge of becoming concentrated in 2010 when BHP Billiton and Rio Tinto, two of the top iron pre-producers in the world, attempted to merge their Australian iron ore assets. However, the transaction was axed after anti-competition complaints from regulators and top customers, including China, as the combined entity would have controlled over 30% of global seaborne trade in iron ore.
Figure 4: Market concentration in various minerals, percent
Source: Handelsbanken Capital Markets, Raw Materials Group
The highest market concentration is found among the platinum group metals (PGMs). The main reason for that relative concentration is geological. PMGs are mined in Russia and at harsh conditions in South Africa. Shafts deeper than 3,500 metres with temperatures of up to 70°C and high rock pressure keep many miners from entering the space. Among the most fragmented markets is coal. 75 % of all coal is mined in Asia or FSU. Coal is easy to mine and abundant; low mechanisation has made it easy for smaller and less sophisticated miners to enter the market. Copper and iron ore are the most capital-intensive metallic minerals. Important barriers to entry here are access to funding and complicated infrastructural requirements, an increasingly important factor as miners must go more remote as the lowest hanging fruits are gone.
Commodities have a cost of carry and lack forward-looking abilities In a fragmented industry with commoditised end products and long lead times between the commencement of production and actual output, the supply side should be predictable, as the barriers for every project are known. Given that commodities have a cost of carry and that spot pricing rarely factors in future events, long-term prices will be set by supply. As presented above, we believe that we are on the downward slope of a supply-driven commodity downturn peaked in 2011. As prices fall, spending from resource companies dries up as cash flow yields crumble, paving the way for the next boom, which will occur once demand again exceeds supply from an under-invested industry.
Upstream markets
are fragmented and
lack industry
discipline
Coal most
fragmented, PMG:s
most concentrated
Extractive industries
are boom/bust
industries

Trading Strategy Sector report, May 13, 2014
8
A mining bust in slow motion The mining industry has now spent more than a decade on heavy investments. The theme “China buys what
China needs” has been the driver. With high price premiums over the marginal cost of production,
investments in many mining projects have displayed an irresistible internal rate of return (IRRs) on paper.
However, we maintain that the price cycle for metals such as zinc and nickel peaked in 2006-07 and that
copper and iron ore are merely lagging that trend. In our view, the lag is due to commodities filling demand
on brownfield investments, while copper and iron ore will continue to see price deflation as projects come on
stream. As argued and illustrated below, we believe we are in a commodity bust that is playing out in
unsynchronised slow motion and that there is more downside in key commodities, while aluminium, zinc
and nickel have already passed bottom levels.
Working through base metals, iron ore supply side; this is what we expect The entrance of China as a commodity consumer caused a commodity boom across all assets, although more in some than others. We have examined the mining expansion pipelines for the coming five years for iron ore, coking coal, copper, nickel and zinc (precious metals are discussed in later sections). We draw the following four conclusions:
Iron ore is likely to see prices decline towards USD 80/tonne, as the project pipeline is too large to be absorbed at current prices
Copper is likely to see prices decline to USD 5,500/tonne, as abundant supplies will need to be absorbed before there is any renewed shortage
Zinc is in ample supply and is likely to trade at prices of USD 2,100/tonne, +/- USD 200, for the coming two years, only to see prices rise thereafter on an emerging supply shortage
Nickel has entered a period of supply shortage after Indonesia banned exports of nickel ore to China. Prices are likely to drift towards USD 25,000/tonne without the NPI industry in China before it falls back as these levels will trigger new supply.
Aluminium has moved close to, or into deficit this year after some major producers suspended operations due to poor profitability. This action has lifted the price, but any sustained price rallies will trigger capacity to come back on stream, though we foresee a flat, tight trading interval of USD 1,800-2,000/tonne during coming years.
Chinese metal consumption normalising History suggests that a country’s consumption of metal typically grows in line with per capita income until that figure reaches USD 15-20,000. China now has more than 1.3 billion inhabitants. The country’s urbanisation rate has exploded, with the coastal areas setting the pace. Chinese incomes, property prices and standards of living now resemble those of many other developed economies. The western parts of China are still less developed, but with a large share of China now urbanised, the intensity of commodity usage has drifted lower. In Figure 5 we illustrate how China’s consumption growth of various metals and oil has fallen below one as a ratio to GDP growth, meaning commodity demand is now growing slower than the economy in general. As China now aims to curb structural and investment spending in an attempt to develop a more dynamic, consumer-driven economy, it is likely that the intensity of commodity consumption will continue to cool.
Four high-conviction
conclusions
The intensity of
commodity usage
has drifted lower in
China

Trading Strategy Commodity report, May 13, 2014
9
Figure 5: Chinese consumption intensity of commodities
Source: Handelsbanken Capital Markets, Bloomberg, Macrobond
Difference in competitive position mapped in the cash-cost curve Miners have few or no competitive advantages in what they produce, but rather in where, how and with what they produce it. Miners’ operating expenses are fixed at 70-80%, which means that miners will always operate at close to full capacity. Differentiating factors for cash costs in a mine are head grades, geology, mining method, FX and, not least, the occurrence of by-products.
The cash-cost curve of a metal is illustrated in a bar chart with aggregated output from all mines in the respective universe. The width of each bar represents the annual output from a specific mine, while the height of the same bar illustrates the cash costs for extracting the metal from the same mine. The mines furthest to the right in the supply curve are those with the poorest finances; as the least competitive miners, they should be the first to close once prices fall.
The steeper the cash-cost curve, the higher the fall Early in a mining cycle, when demand and prices rise, brownfield projects show the easiest and fastest profitability because they are low-cost and quick to complete. To the extent that brownfields are not sufficient to meet demand, miners start greenfield projects. These are typically larger, more costly and take longer to complete, as infrastructure spending is always required, but greenfields have the benefit of often being large-scale and cost-efficient to operate; hence, a newly-built mine may well end up in the first (most competitive) quartile on the cash-cost curve.
In boom markets and early in the bust of a metal cycle, cash-cost curves tend to be steeper. High-cost swing producers earn a decent living from the supply deficit that makes their output needed and defines the marginal pricing of the metal. Through the cycle, and as more and larger greenfield projects lower down in the cash-cost curve are completed, high-cost mines tend to constitute abundant supply and fall victim to the early stage of a bust. As these mines are forced to close, very small changes in excess supply will mean sharp drops in prices as the cash-cost curve flattens out and excess returns diminish.
Greenfields larger and completion lagging A mining boom typically commences with the number of completed brownfields rising and ends with the number of completed greenfields declining. Our study clearly indicates that we are on the verge of seeing greenfield declines materialising. Here, we illustrate 1,458 mining projects that were completed between 2000 and 2013:
There is no industry
discipline; miners
will always operate
at full capacity
A mining boom
starts with
brownfield
expansions
Cash-cost curves
tend to be steep;
swing producers
make money
Brownfield
expansions are
quicker to respond

Trading Strategy Sector report, May 13, 2014
10
Figure 6: Completed mining projects, 2000-13
Source: Handelsbanken Capital Markets, Raw Materials Group
The charts illustrate the dynamics of brownfields being early to complete and generally being lower in value than greenfields. Shorter lead times in completing brownfield projects mean that the trend in completing such projects is better matched with the price cycle. Completed brownfield expansions rose in 2004 and in 2010, while the completed number of greenfields has been rising over the past two years of declining metal prices, after a slow start.
The average size of a brownfield project is currently USD 430m versus greenfield projects with an average total spending of USD 787m; this compares with respective costs of USD 75m and USD 143m 10 years ago. In 2013, finalised copper greenfield projects accounted for 50% of mining spending in finalised projects, up from 20% in all other years since 2000. Gold accounts for a steady 20%, without any trend over the period. Nickel has had a few substantial greenfield projects with huge budget overruns and reached 30% of greenfield spending in 2010 as a high mark. Iron ore accounts for less than 15% of finalised projects, as these are larger in size and take longer to develop; most greenfield projects are still to be completed and the spending flurry has not yet occurred.
Figure 7: Indexed commodity prices, 2000-14
Source: Handelsbanken Capital Markets, Bloomberg
0
5
10
15
20
25
30
0
10
20
30
40
50
60
70
80
90
100
2000 2001 2002 2003 2004 2005 2006 2007 2008 2009 2010 2011 2012 2013
Bill
ion
US
D
Capex finished greenfield Capex finished brownfields
Number of finished greenfield Number of finished brownfield
Brownfields better
matched with the
price cycle
Finalisation of
copper greenfields
accounted for 50% of
mining investments
in 2013
Iron ore and copper
prices lagging

Trading Strategy Commodity report, May 13, 2014
11
Iron ore: a bust in the making
Excess capacity is coming on stream Global iron ore markets currently produce about 1.9 billion tonnes, with more than 60% of that volume seaborne (i.e. exported from producing countries to consuming countries). China is by far the largest buyer of seaborne ore. Although there is a pick-up in demand from most regions in the world, we believe that China will remain the driver of iron ore demand in the coming five years, as in excess of 60% of seaborne demand comes from China. The growth rate that we assume in seaborne growth ahead is 4%, which is well in line with what the China Iron and Steel Association (CISA) expects in China.
In our estimates, an iron ore surplus will materialise by 2015. We base this on a conservative iron ore supply scenario, where we just assess the number of iron ore projects that have already obtained financing and necessary permits and are in the process of being completed.
When looking at the pipeline of iron ore projects, we note that this surplus would last through to 2020. Assuming that high prices linger for a few years more, we note that a number of still-unfunded projects could intrude into the market and kill prices.
Figure 8: Mismatch between iron ore supply and demand
Source: Handelsbanken Capital Markets, Raw Materials Group, Bloomberg
Prices should approach USD 80/tonne The cash-cost curve for iron ore displays the typical steepness in the fourth quartile of a commodity that has not reached excessive supply volumes. The low-grade and small-scale Chinese mines generally have higher costs, while traditional iron ore regions Brazil and Australia are found in the lower quartiles.
Our analysis of 40 new iron ore projects shows an average cash cost of USD 48/tonne (after deducting USD 20 and USD 7 respectively for a pellets premium and lump premiums over fines, and adding shipping costs to China from site), meaning that large new greenfield projects end up in the first and second quartiles. The average production cost in China is close to USD 120 USD/tonne and the cash-cost for current supply excluding Chinese producers is USD 63/tonne. New iron ore supply will be dominated by Australia, with 57% of new supply coming from that country by 2018. Brazil's share of new supply will be steady, ranging between 17-22% during the next five years.
0
0
0
1
1
1
1
1
2
2
2
Mt Iron ore
Demand 4% CAGR
Production
Financed new supply
Not Financed new supply
Seaborne iron ore
demand at 4% CAGR
ahead
Iron ore to go into
surplus in 2015
It could last through
to 2020
Fourth-quartile
mines have high
cash-costs
New projects will
end up in the first
and second quartiles

Trading Strategy Sector report, May 13, 2014
12
Besides Chinese, Brazilian and Australian mines, a large number of high-cost mines refine and sell higher-grade products such as iron pellets. These miners, including LKAB, live off the premiums for the higher value added that they deliver.
Figure 9: Iron ore supply cash-cost curve, 2013 and 2018 (seaborne growth)
Source: Handelsbanken Capital Markets, Raw Materials Group, Bloomberg
The impact of new capacity expansions will be that high-cost swing producers that have decent earnings at current prices (the 2014 average to May has been USD 120/tonne) will be forced to close and prices will fall along the cash-cost curve. In the assumption above of a 4% CAGR in the consumption of seaborne ore, demand will be lower than two billion tonnes, meaning that iron ore industries are heading for severe supply abundance in the coming years. Judging from the cash-cost curve above, that would imply iron ore prices in the range of USD 80/tonne.
Chinese steel mills will be happy to see local ore mines go bust The current volume of Chinese iron ore imports are approaching 800 million tonnes per annum and sourcing from domestic mines amounts to 220 million tonnes. At the latest 12-month price of USD 125/tonne, the value of these imports stands at USD 100bn; in addition, Chinese steel plants spend another USD 30bn on locally sourced ore. Assuming that the Chinese mines are scrapped in our price scenario, the Chinese would increase their dependence on seaborne markets, which may seem somewhat counterintuitive for Chinese consumers to applaud.
However, Chinese mines produce low-grade ore high in impurities. With the steel fleet being upgraded and modernised in China, the need for higher-quality feed rises. Additionally, the total bill for Chinese ore consumption would fall from USD 130bn to USD 90bn as iron ore prices decline to USD 80/tonne. Chinese mines have played a role not only as local sourcers, but they have also helped keep prices at a level where iron ore miners worldwide have run head-over-heels to create a future surplus in ore markets.
Metallurgical coal price has already collapsed Metallurgical coal, which is used in blast furnaces in the steel-making process, has gone through a price bust similar to what we expect to see for iron ore. Met coal mining is typically done in non-complex open mines, and expansions to meet demand in the past decade have been faster than for iron ore. In the past three years, coking coal prices have been under severe structural pressure: prices fell to multi-year lows after the supply wave hit the markets. Looking ahead in 2014, some 13 million metric tonnes of incremental met coal supply will hit the market, representing 4.5% of seaborne trade.
Prices could trend
down the curve to
USD 80-90/tonne
Chinese steel mills
have will need to
turn to more
imports…
…but will save USD
40bn by doing so
Met coal price has
already collapsed
Trading Strategy Commodity report, May 13, 2014
13
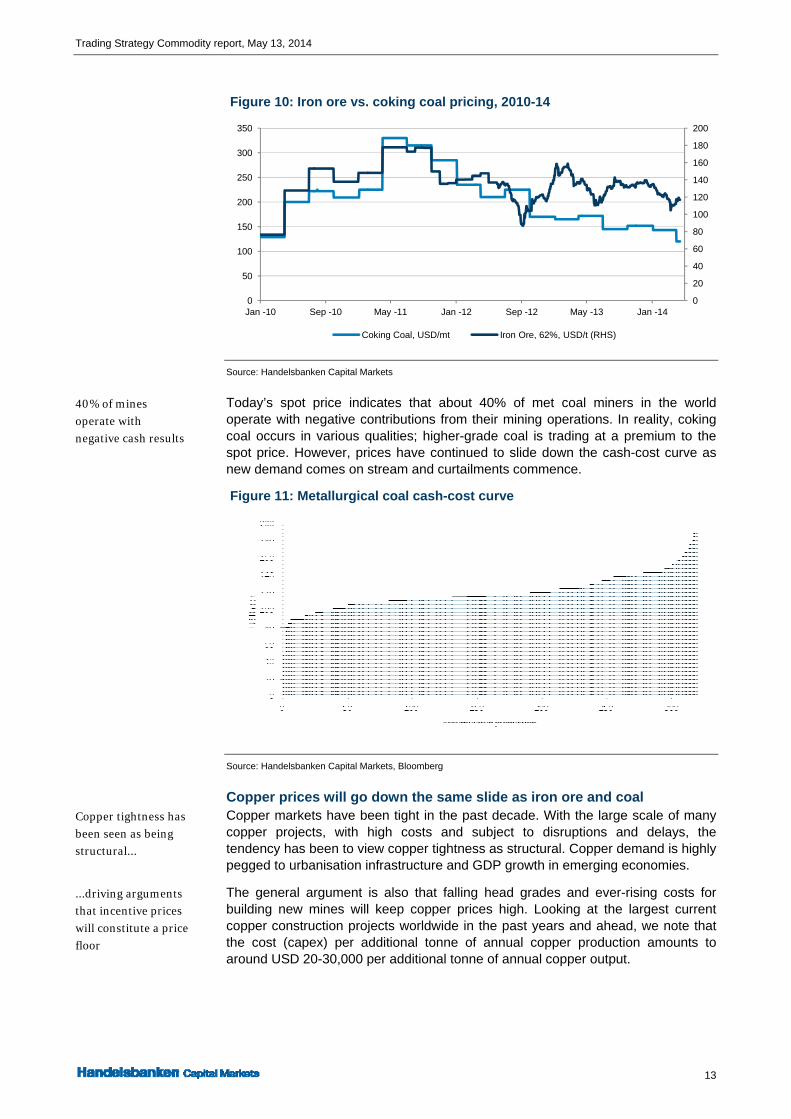
Figure 10: Iron ore vs. coking coal pricing, 2010-14
Source: Handelsbanken Capital Markets
Today’s spot price indicates that about 40% of met coal miners in the world operate with negative contributions from their mining operations. In reality, coking coal occurs in various qualities; higher-grade coal is trading at a premium to the spot price. However, prices have continued to slide down the cash-cost curve as new demand comes on stream and curtailments commence.
Figure 11: Metallurgical coal cash-cost curve
Source: Handelsbanken Capital Markets, Bloomberg
Copper prices will go down the same slide as iron ore and coal Copper markets have been tight in the past decade. With the large scale of many copper projects, with high costs and subject to disruptions and delays, the tendency has been to view copper tightness as structural. Copper demand is highly pegged to urbanisation infrastructure and GDP growth in emerging economies.
The general argument is also that falling head grades and ever-rising costs for building new mines will keep copper prices high. Looking at the largest current copper construction projects worldwide in the past years and ahead, we note that the cost (capex) per additional tonne of annual copper production amounts to around USD 20-30,000 per additional tonne of annual copper output.
0
20
40
60
80
100
120
140
160
180
200
0
50
100
150
200
250
300
350
Jan -10 Sep -10 May -11 Jan -12 Sep -12 May -13 Jan -14
Coking Coal, USD/mt Iron Ore, 62%, USD/t (RHS)
40% of mines
operate with
negative cash results
Copper tightness has
been seen as being
structural...
...driving arguments
that incentive prices
will constitute a price
floor

Trading Strategy Sector report, May 13, 2014
14
Figure 12: Capex (‘000 USD) per additional tonne of annual production
Source: Handelsbanken Capital Markets, Bloomberg
Assuming an average 15-year depreciation term, we would need to add USD 1,300-2,000/tonne of production costs to cover both capex and operating costs. With this argument, it would be fair to assume that copper miners will build new mines only if prices remain above USD 6,000-6,700/tonne. Over time, this is a fair assumption. The incentive price point where miners spend is highly relevant for pricing as long as supply is tight; but when excess supply emerges, the marginal level of suffering swings into focus. As that happens, the relevant questions are which mines will close and when.
Industry participants have taken action, but it is not enough Comparing the pipeline of the 2011 copper cash-cost curve at the price-cycle peak (looking forward to 2018) to the current cash-cost curve, we note that projects have been put on hold. The pipeline has decreased by 1.6m tonnes of copper, which is equivalent to 20% of the 2011 pipeline. Projects scrapped or postponed are large-scale ones, including Rieko Diq, Tampakan and Olympic Dam.
Figure 13: Copper pipeline to 2018 planned in 2011 (scrapped in red)
Source: Handelsbanken Capital Markets, Raw Materials Group, Bloomberg
A 20% decrease in the pipeline is substantial; however, the main issue as we see it is that the projects scrapped are those furthest from generating cash flow (i.e. greenfield projects that have not been started or have barely begun). Hence, although these scrapped projects do wonders for production in 2017e-18e, they do
0
5
10
15
20
25
30
Lum
wan
a
Pin
to V
alle
y
Mic
hiqu
illa
y
Kan
suki
Toq
uepa
la
Kan
sans
hi S
ulfid
e
Bue
navi
sta
Min
e
Put
hep
Peb
ble
Sen
tinel
Nok
omis
Ant
amin
a
Los
Bro
nces
Inca
de
Oro
Eag
le
La G
ranj
a
Que
llave
co
Esp
eran
za E
xpan
sion
Las
Bam
bas
Can
aria
co N
orte
Tam
paka
n
Sie
rra
Gor
da
El T
esor
o
Rek
o di
q
Aqu
a R
ica
Frie
da R
iver
Cob
re P
anam
a
Oyu
Tol
goi
Ant
ucoy
a
Gal
ore
Cre
ek
Tor
omoc
ho
When excess supply
emerges, cash-cost
curves set prices
Copper projects have
been scrapped
…but projected
output from those
were too far out to
matter now

Trading Strategy Commodity report, May 13, 2014
15
little to mitigate the supply wave in 2014e-15e. Rather than smoothing booms and busts, the scrapped projects may well pave the way for the next copper price boom by limiting supply. But before we see any such boom, we believe that there is all the reason in the mining world to see a copper price bust.
The problem is at the top of the cash-cost curve As with iron ore, the fourth quartile of the copper cash-cost curve is steep and the marginal cost of copper production rises fast. As in most mine segments, capex for new greenfields is high due to more remotely-located mineral deposits with poor infrastructure. However, operating expenses are quite similar to those mines operating today and relative cash costs are determined by factors such as the occurrence of by-products. Hence, for copper and iron ore, new mines do not end up solely in the fourth quartile; new mines do not push the cost-curve higher, they merely extend it, making the slope of the curve flatter (new projects in green below).
Figure 14: Copper supply cash-cost curve, 2013 and 2018
Source: Handelsbanken Capital Markets, Raw Materials Group, Bloomberg
Copper surplus between 2014 and 2017; price decline expected Copper demand averaged 2.8% growth in the past decade, primarily driven by China. Comparing the supply growth in 2014-18, we see copper swinging into surplus in 2014. Based on the cash-cost curves above, we expect copper prices to decline to USD 5,500/tonne in 2015 and 2016.
Figure 15: Copper surplus mounting after decades of spending
Source: Handelsbanken Capital Markets, Raw Materials Group, Bloomberg
10
12
14
16
18
20
22
24
26
Mt Copper
New mine supply
Demand 4% CAGR
Production
The slope of the 4th
quartile copper cash
cost curve is steep
making downside
high
Copper expected at
USD 5,500/tonne

Trading Strategy Sector report, May 13, 2014
16
In the current pipeline, we see this surplus lingering beyond 2018. As noted above, the copper industries have been responsive in scrapping expansion plans. Unlike in iron ore, surplus in copper is not structural but more temporary in nature; as copper prices decline, we expect that postponed projects will aid the supply/demand balance and that incentive pricing again will be a reasonable floor for long-term assumptions, which we expect to be some USD 6,700/tonne from 2018 and onwards.
The Chinese copper financing trade has merely delayed the price decline A topic that normally emerges parallel to discussions of lower growth in Chinese copper consumption is the Chinese copper financing trade (CCFT). In the CCFT, copper is used as collateral when cheap loans are imported from offshore financial markets to mainland China. There are various estimates on how large these copper positions are and how much copper is actually tied up in these trades.
Our understanding is that a borrower must have a warehouse warrant of some type in China, meaning that the maximum tonnage that can be tied up in this trade is a million tonnes of copper. The inventory build in Chinese bonded warehouses coincides with copper markets moving from contango to backwardation, as selling pressure occurs when physical holders hedge positions on the future curve to eliminate copper price risk in the trade.
Figure 16: Imports push copper curve from contango to backwardation
Source: Handelsbanken Capital Markets, Bloomberg
The Chinese State Administration for Foreign Exchange (SAFE) has expressed that this type of asset-backed currency inflow should cease. If and when this occurs, excess supply is likely to be released and have a one-off effect on prices. Our view is that the CCFT has delayed the slide in copper prices, as markets without this artificially-created demand would have been exposed to higher tonnage on the supply side. This demand has most likely contributed to delaying the impending growth of supply.
Nickel has been sliding down the curve for two years Along with copper, nickel is one of the strategic commodities where China has insufficient amounts of domestic reserves to fill its needs; thus, China is a major importer of nickel. In recent years, China has expanded its imports of low-grade iron ore with high nickel content, primarily from Indonesia and to some extent from the Philippines. This ore has become the main feedstock in Chinese stainless steel production and has substituted refined nickel as input. The nickel ore from
Surplus mounts in
2014-17
Chinese copper
financing trade plays
its part
Could tie up to a
million tonnes of
copper
Price risk on the
downside if CCFTs
are banned
Nickel pig iron killed
nickel prices

Trading Strategy Commodity report, May 13, 2014
17
Indonesia contains 1.8-2% nickel and 15-20% iron, which is ideal for the electric arc furnaces common in Chinese stainless steel manufacturing.
Figure 17: China nickel import by source
Source: Handelsbanken Capital Markets, Bloomberg
The nickel pig iron from Indonesia has had two main effects on global markets:
The substitution of refined nickel has caused mine supply to exceed demand, leading to nickel prices falling to USD 14,000, where 30% of miners are cash-cost negative
Chinese stainless steel producers enjoy a cost benefit of approximately 10% over western-world stainless steel producers from low cost feed
Hence, nickel prices collapsed in what seems like typical excess supply but in fact, substitution played a major role in creating this supply/demand imbalance.
Indonesians want a greater piece of the pie In January 2014, the Indonesian government imposed a ban of exports of unrefined nickel ore. The aim is to force miners to build nickel smelting and refineries in Indonesia in order to maintain their mining licences, thus giving the Indonesia a larger share of the value chain. The export ban has been discussed for some time and most Chinese pig iron producers held ore stocks of up to six months of production. Nevertheless, Chinese steel producers are eating through their stockpiles of ore, and they are now left with the option to either buy refined nickel or source scrap from global markets. While nickel pig iron is priced in local Asian markets, refined nickel is priced on the LME, meaning that nickel prices should find a new equilibrium as the stainless industry in China is reshaped (discussed further below).
Tight supply to drive prices higher The supply pipeline in nickel is tight. In recent years nickel pig iron-based stainless steel production has deteriorated the interest to spend on new expansions.
Ban on ore exports
from Indonesia
Tightening refined
nickel markets

Trading Strategy Sector report, May 13, 2014
18
Figure 18: Nickel among the tightest metals ahead
Source: Handelsbanken Capital Markets, Raw Materials Group, Bloomberg
We expect that refined nickel consumption will start eating into inventories at LME already in 2014, as stockpiled Indonesian ore in China is consumed and the market moves from surplus to deficit. With nickel pig iron moving largely out of the picture, nickel sourcing will occur to a greater extent from refined nickel or scrap, driving prices higher.
Zinc is the metal where a rally may be looming Zinc as a metal constitutes 3-4% of the total value of mined metals. Being minor and often mined in smaller mines with few economies of scale, it has not attracted interest from major miners. Prices have been in steady decline since the peak in 2006 and with inventories being high, the pipeline has become somewhat muted. In addition to this, we expect that a number of mines will be depleted in the coming years, mitigating the expansions that we know of.
Figure 19: Zinc has a few more years before reaching a deficit
Source: Handelsbanken Capital Markets, Raw Materials Group, Bloomberg
At current prices, we see little fundamental downside in zinc prices but rather expect balanced markets throughout 2014 and into 2015. In 2016, the world’s second largest zinc mine, Century in Australia (owned by Chinese Minmetals), will be depleted, and we believe that this will be the spark that ignites a zinc deficit which is set to drive prices higher.
0
0.5
1
1.5
2
2.5
3
Mt Nickel
New mine supply
Demand 4% CAGR
Production
5
7
9
11
13
15
17
19
21
23
Mt Zinc
New mine supply
Demand 4% CAGR
Production
Driving prices higher
Zinc pipeline is
somewhat muted
May cause supply
squeeze in 2016

Trading Strategy Commodity report, May 13, 2014
19
Figure 20: The zinc supply cash-cost curve, 2014 and 2018
Source: Handelsbanken Capital Markets, Raw Materials Group, Bloomberg
Based on the shape of the cash-cost curve, we expect zinc prices to drift towards USD 2.500/tonne in 2016-18. A word of caution here is that China appears to be close to self-sufficient in zinc and we have little information about the Chinese zinc industry. Based on our understanding from better-known zinc mines, we believe that USD 2,500/tonne zinc in mines with lead by-products would make high economic sense; in our view, such price levels would spark investments in mine expansions.
Aluminium: capacity closures to keep supply balanced In contrast to base metals and iron ore, aluminium is produced from bauxite, which is not is a hard rock mined metal and hence is not subject to the same supply deficits in various parts of the cycle as other metal commodities are. Rather than adding capacity in mining, expanding capacity in bauxite extraction is simple. The supply/demand balance is determined by downstream capacity relative to demand. As a consequence, aluminium was only doubled during the last cycle, where as other base metals five folded and iron ore eight folded.
Figure 21: Capacity reductions keep markets balanced
Source: Handelsbanken Capital Markets, Raw Materials Group, Bloomberg
Demand for aluminium has been running at close to 6% CAGR in the past decade, which is higher than for other base metals as a result of low price inflation compared to other metals. Three of the major global aluminium producers have in
0 20001000 40003000 60005000 80007000 9000
US
D/t
on
Accumulated production
-2000
-1000
0
1000
2000
3000
5
15
25
35
45
55
65
75
Mt Aluminium
New supply
Demand 5% CAGR
Production
Trading Strategy Sector report, May 13, 2014
20
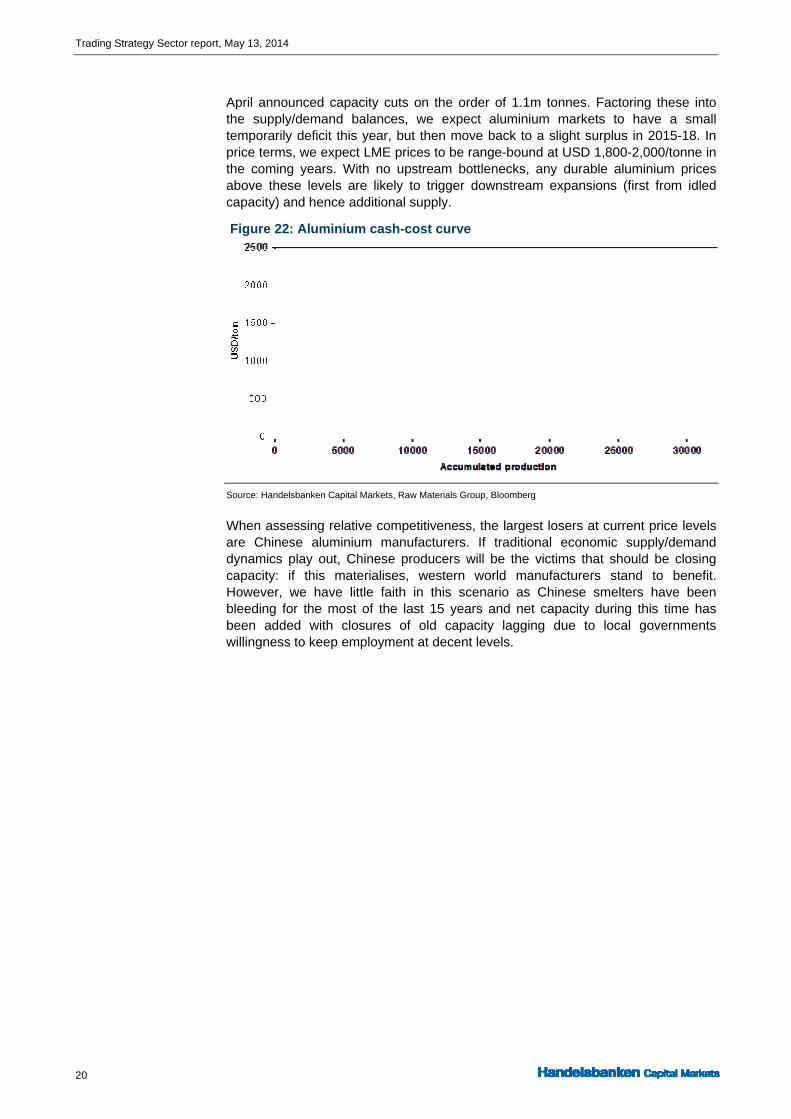
April announced capacity cuts on the order of 1.1m tonnes. Factoring these into the supply/demand balances, we expect aluminium markets to have a small temporarily deficit this year, but then move back to a slight surplus in 2015-18. In price terms, we expect LME prices to be range-bound at USD 1,800-2,000/tonne in the coming years. With no upstream bottlenecks, any durable aluminium prices above these levels are likely to trigger downstream expansions (first from idled capacity) and hence additional supply.
Figure 22: Aluminium cash-cost curve
Source: Handelsbanken Capital Markets, Raw Materials Group, Bloomberg
When assessing relative competitiveness, the largest losers at current price levels are Chinese aluminium manufacturers. If traditional economic supply/demand dynamics play out, Chinese producers will be the victims that should be closing capacity: if this materialises, western world manufacturers stand to benefit. However, we have little faith in this scenario as Chinese smelters have been bleeding for the most of the last 15 years and net capacity during this time has been added with closures of old capacity lagging due to local governments willingness to keep employment at decent levels.
Trading Strategy Commodity report, May 13, 2014
21
Precious metals: gold value in the eye of the beholder The value of gold is based solely on perception, in our view, as industrial usage is second to speculation as a
driver of price. Although silver may have a higher share of industrial usage than gold, the metal trends tend
to mirror those of gold. The low industrial usage and high level of investment demand make these metals
directional, and this direction appears to be down. However, platinum group metals (PGMs) are to a greater
extent priced on supply/demand fundamentals, and with supply being constrained, we believe that these will
continue to be the star performers among precious metals.
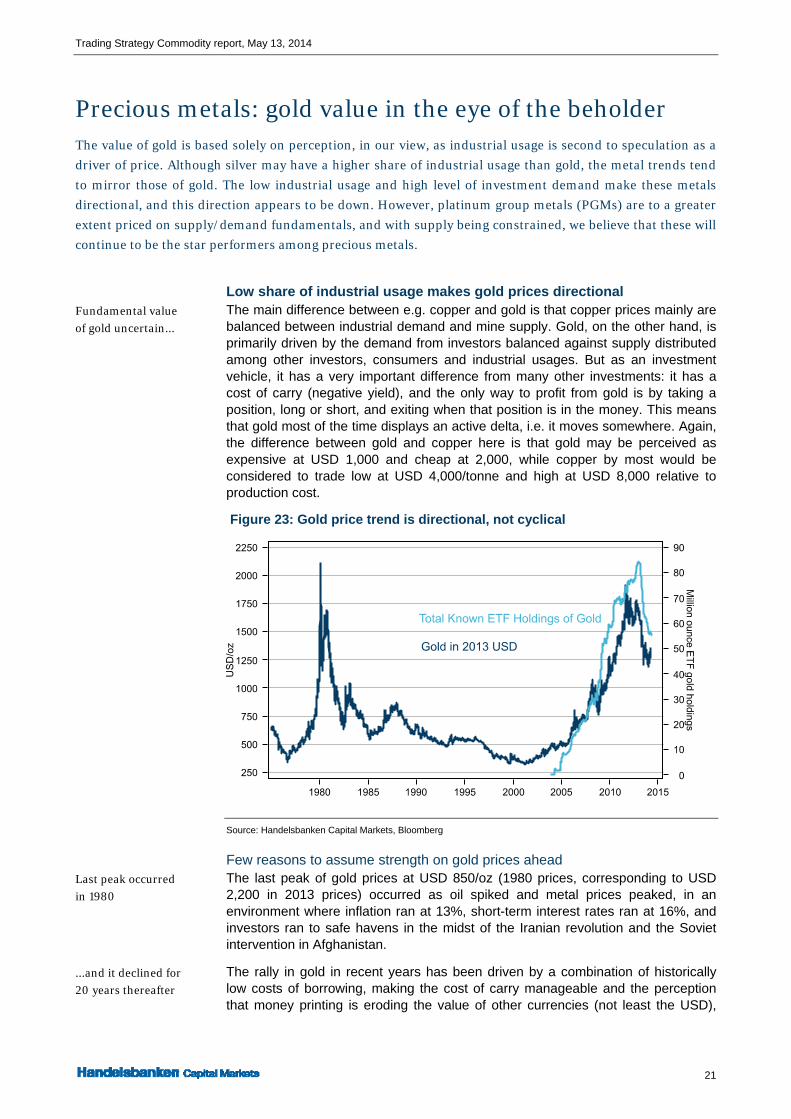
Low share of industrial usage makes gold prices directional The main difference between e.g. copper and gold is that copper prices mainly are balanced between industrial demand and mine supply. Gold, on the other hand, is primarily driven by the demand from investors balanced against supply distributed among other investors, consumers and industrial usages. But as an investment vehicle, it has a very important difference from many other investments: it has a cost of carry (negative yield), and the only way to profit from gold is by taking a position, long or short, and exiting when that position is in the money. This means that gold most of the time displays an active delta, i.e. it moves somewhere. Again, the difference between gold and copper here is that gold may be perceived as expensive at USD 1,000 and cheap at 2,000, while copper by most would be considered to trade low at USD 4,000/tonne and high at USD 8,000 relative to production cost.
Figure 23: Gold price trend is directional, not cyclical
Source: Handelsbanken Capital Markets, Bloomberg
Few reasons to assume strength on gold prices ahead The last peak of gold prices at USD 850/oz (1980 prices, corresponding to USD 2,200 in 2013 prices) occurred as oil spiked and metal prices peaked, in an environment where inflation ran at 13%, short-term interest rates ran at 16%, and investors ran to safe havens in the midst of the Iranian revolution and the Soviet intervention in Afghanistan.
The rally in gold in recent years has been driven by a combination of historically low costs of borrowing, making the cost of carry manageable and the perception that money printing is eroding the value of other currencies (not least the USD),
Fundamental value
of gold uncertain...
Last peak occurred
in 1980
...and it declined for
20 years thereafter

Trading Strategy Sector report, May 13, 2014
22
and making gold the ultimate hedge against central banks’ relentless stimulus. The main problem with these arguments is that they are based on a value of gold that only can be anchored in history; it has been more expensive before. With interest rates most likely pointing higher and gold being more directional in its pricing than fundamental, we struggle to see good arguments for gold to trend higher from here, but rather expect that deflation will continue. From the peak in 1980, it took 20 years before prices bottomed.
A gold price bust will have implications on the mining industry Gold is of importance for the mining industry as gold mining accounts for some 15% of total spending in the industry, third behind copper and iron ore. The strong price trend in the past decade paired with a brisk appetite from equity investors has turned gold into the most explored-for mineral in the mining universe in recent years. Despite this, new discoveries are of low grade and the average cash costs for mining gold have increased by 350% in a decade due to larger ore production, only to keep metal output flat.
Figure 24: Cash cost of mining gold has rocketed since 2002
Source: Handelsbanken Capital Markets, Raw Materials Group, Bloomberg
The result of low-quality gold mining is that high gold prices have contributed to longer lead times for equipment, spare parts and skilled people. A declining gold price would hence ease some of the cost pressures on the rest of the mining industry, as a larger number of gold mines would cease operations. In copper mining, however, gold and silver account for 10% of the value of the copper mining universe, and an easing of cost pressures would most likely be more than mitigated by lower value of by-product credits.
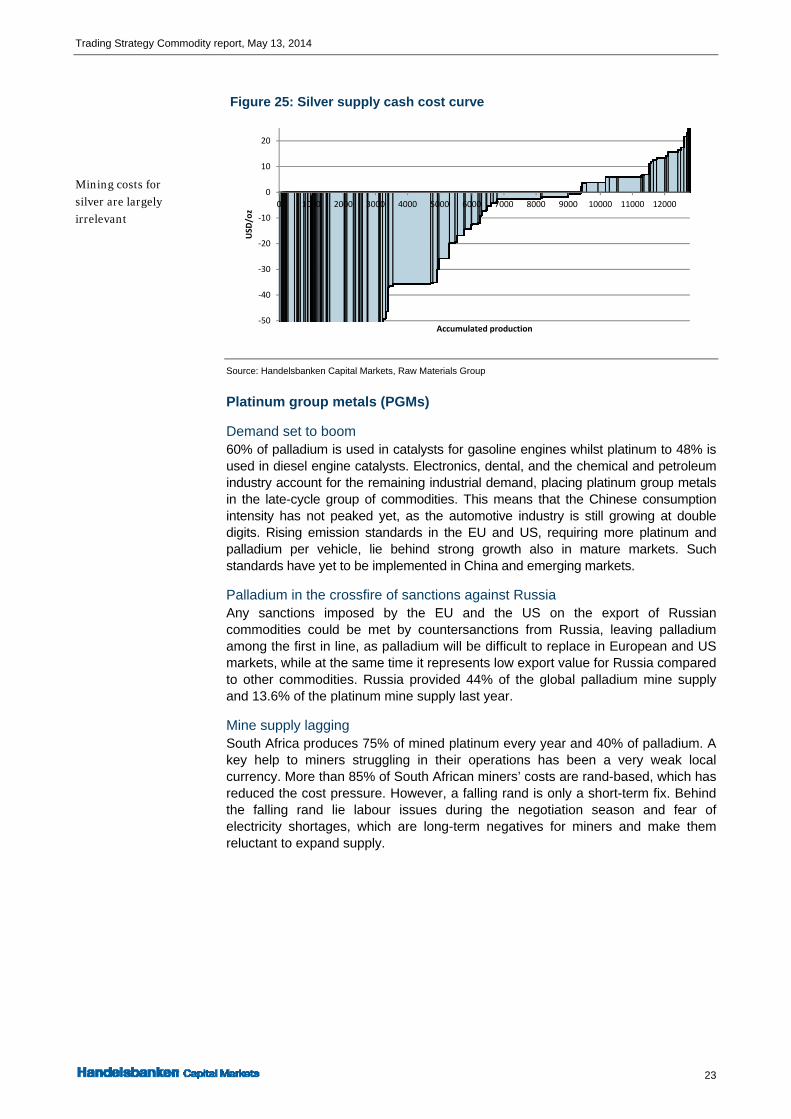
Silver tends to follow gold and cash costs are less relevant The price trend of silver tends to map that of gold. A main difference, however, is that silver is mined in dedicated mines to a lesser extent than gold, and more often occurs as a by-product from other mines. Hence, a silver cash-cost curve displays mines that are largely cash-cost negative. Therefore, by defining a zinc and lead mine with by-product credits from silver as a silver mine, the proceeds from selling silver and lead most often cover all operating expenses and, hence, the implicit cost for the silver production is negative.
This also means that the silver price will depend on output to a lesser extent than any other metals, but rather tends to look more like gold, where perception is a key driver.
0
200
400
600
800
1000
1200
1400
1600
1800
2000
0 10 20 30 40 50 60 70 80 90 100
US
D/o
z
%
2012
2007
2002
Opportunistic gold
mining has driven
production costs
higher
…and caused cost
inflation in the
mining industry
Silver tends to follow
gold
Trading Strategy Commodity report, May 13, 2014
23
Figure 25: Silver supply cash cost curve
Source: Handelsbanken Capital Markets, Raw Materials Group
Platinum group metals (PGMs)
Demand set to boom 60% of palladium is used in catalysts for gasoline engines whilst platinum to 48% is used in diesel engine catalysts. Electronics, dental, and the chemical and petroleum industry account for the remaining industrial demand, placing platinum group metals in the late-cycle group of commodities. This means that the Chinese consumption intensity has not peaked yet, as the automotive industry is still growing at double digits. Rising emission standards in the EU and US, requiring more platinum and palladium per vehicle, lie behind strong growth also in mature markets. Such standards have yet to be implemented in China and emerging markets.
Palladium in the crossfire of sanctions against Russia Any sanctions imposed by the EU and the US on the export of Russian commodities could be met by countersanctions from Russia, leaving palladium among the first in line, as palladium will be difficult to replace in European and US markets, while at the same time it represents low export value for Russia compared to other commodities. Russia provided 44% of the global palladium mine supply and 13.6% of the platinum mine supply last year.
Mine supply lagging South Africa produces 75% of mined platinum every year and 40% of palladium. A key help to miners struggling in their operations has been a very weak local currency. More than 85% of South African miners’ costs are rand-based, which has reduced the cost pressure. However, a falling rand is only a short-term fix. Behind the falling rand lie labour issues during the negotiation season and fear of electricity shortages, which are long-term negatives for miners and make them reluctant to expand supply.
‐50
‐40
‐30
‐20
‐10
0
10
20
0 1000 2000 3000 4000 5000 6000 7000 8000 9000 10000 11000 12000
USD
/oz
Accumulated production
Mining costs for
silver are largely
irrelevant

Trading Strategy Sector report, May 13, 2014
24
Figure 26: PMGs: New supply, demand and production
Source: Handelsbanken Capital Markets, Raw Materials Group, Bloomberg
While most other metals have experienced strong mine supply growth during the past five years as a natural consequence of high prices and miners expanding production, as revenues are ploughed back in to operations, PGMs differ. Miners have been reluctant to invest in South Africa, which suffers from an unstable political climate, labour issues and technically-challenging deep ore bodies. For Russian miners, PGMs are valuable bimetals to nickel production. They had a significant contribution to profitability during recent quarters when nickel traded below USD 18,000/tonne but they are not the primary target in expansion plans. Nickel prices have suffered from rising substitution by nickel pig iron in recent years, and mine expansions have not been on the agenda for Russian miners. Nickel investments might surface in the wake of the Indonesian export ban, but it will take years for Russian miners to complete any expansion plans, leaving PGMs exposed to South Africa’s struggling mining industry and strong global demand.
Figure 27: Cash cost of PGM mines in South Africa and Zimbabwe
Source: Handelsbanken Capital Markets, Raw Materials Group
0
100
200
300
400
500
600
700
ton Demand 5% CAGR
Production
New supply
0
200
400
600
800
1000
1200
1400
1600
1800
0 1000 2000 3000 4000 5000 6000
USD
/4E oz
Accumulated production
PGM basket price 1174 USD
Avg cash cost 800 USD

Trading Strategy Commodity report, May 13, 2014
25
Western world steel rising from the ashes Although steel markets will not be a quick fix, we argue that industry margins will rise from current levels.
Based on our assumption that iron ore prices will continue to deflate, and as input costs are likely to remain a
key driver of the nominal price of steel, we argue that we will see lower steel prices ahead. As this
materialises, we see a lesser scope for global trade in steel and we expect that price negotiations will leave
more room for margin expansion in carbon steel. In stainless, we believe that higher nickel prices and less
price competition from Chinese nickel pig iron producers will enable higher base prices in western world
stainless steel producers.
No quick fix in carbon steel Steel markets have suffered from excess capacity since after the global financial crisis as demand has not returned to pre-crisis levels. Steel intensity in China has peaked and demand in western Europe has not returned to pre-crisis levels.
Figure 28: Global steel capacity utilisation
Source: Handelsbanken Capital Markets, World Steel Association
In terms of utilisation ahead, we see no easing. According to Eurfer, net additions of steel capacity may amount to some 10% of total global capacity until 2016. China has initiated closures of environmentally hazardous capacity, but according to Hebei Steel, the net trend is that total capacity in China is still growing.
With freight costs being a fraction of total steel prices, abundant supplies in China have been exported elsewhere in the past few years, with total exported volumes amounting to some 50 million tonnes annually, corresponding to 7% of produced materials. China produces 50% of all steel globally, and these exports of excess capacity have been sufficient to pressure steel margins in the rest of the world.
The main problem with low capacity utilisation in steel is the high operating leverage due to the high level of fixed costs. As in mining, markets are fragmented and no companies act for the betterment of the general industry. The cash cost curve in steel is flat and cost savings have been eaten up by price pressure, as the positive leverage from gaining volumes has been, and still is in many cases, better than holding onto the savings. A steel plant with 3 million tonnes in capacity operating at 75% utilisation, and with fixed costs of SEK 2bn while trying to save SEK 0.5bn, would be better off giving away all savings through price pressure and increasing utilisation to 85% than it would if it held onto the savings (no price reductions) and maintained volumes. This creates substantial issues for steel producers in the
65%
70%
75%
80%
85%
Jan -11 Jul -11 Jan -12 Jul -12 Jan -13 Jul -13 Jan -14
Steel utilisation rates
too low
Steel capacity is most
likely still growing
China exports 7% of
produced volumes
Operating leverage
remains a challenge
Trading Strategy Sector report, May 13, 2014
26
current market. The cure for the above is higher utilisation and hence a better pricing position between steel sellers and buyers.
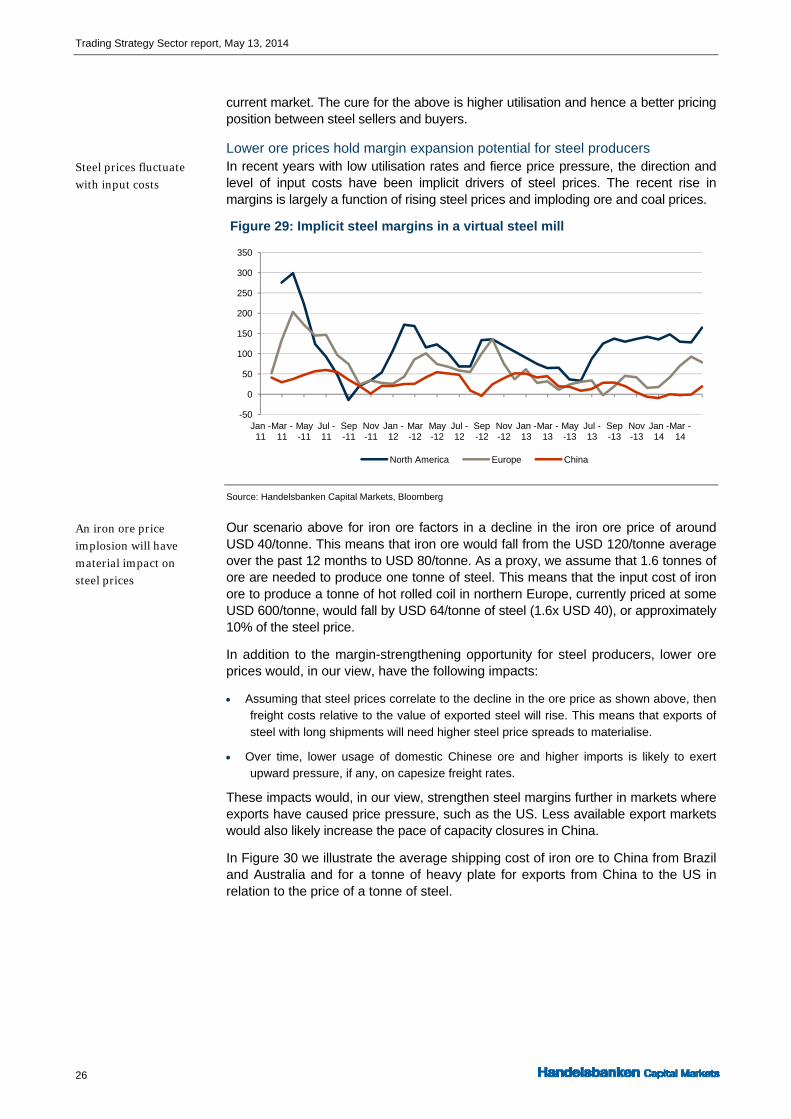
Lower ore prices hold margin expansion potential for steel producers In recent years with low utilisation rates and fierce price pressure, the direction and level of input costs have been implicit drivers of steel prices. The recent rise in margins is largely a function of rising steel prices and imploding ore and coal prices.
Figure 29: Implicit steel margins in a virtual steel mill
Source: Handelsbanken Capital Markets, Bloomberg
Our scenario above for iron ore factors in a decline in the iron ore price of around USD 40/tonne. This means that iron ore would fall from the USD 120/tonne average over the past 12 months to USD 80/tonne. As a proxy, we assume that 1.6 tonnes of ore are needed to produce one tonne of steel. This means that the input cost of iron ore to produce a tonne of hot rolled coil in northern Europe, currently priced at some USD 600/tonne, would fall by USD 64/tonne of steel (1.6x USD 40), or approximately 10% of the steel price.
In addition to the margin-strengthening opportunity for steel producers, lower ore prices would, in our view, have the following impacts:
Assuming that steel prices correlate to the decline in the ore price as shown above, then freight costs relative to the value of exported steel will rise. This means that exports of steel with long shipments will need higher steel price spreads to materialise.
Over time, lower usage of domestic Chinese ore and higher imports is likely to exert upward pressure, if any, on capesize freight rates.
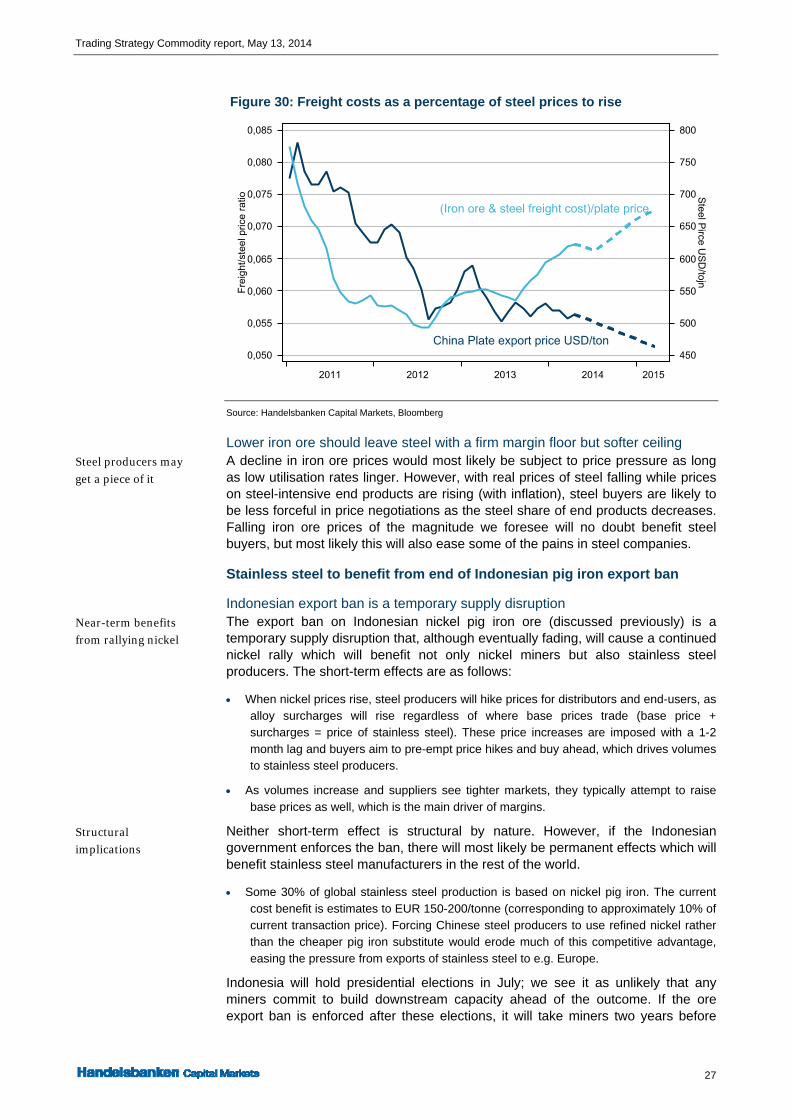
These impacts would, in our view, strengthen steel margins further in markets where exports have caused price pressure, such as the US. Less available export markets would also likely increase the pace of capacity closures in China.
In Figure 30 we illustrate the average shipping cost of iron ore to China from Brazil and Australia and for a tonne of heavy plate for exports from China to the US in relation to the price of a tonne of steel.
-50
0
50
100
150
200
250
300
350
Jan -11
Mar -11
May -11
Jul -11
Sep -11
Nov -11
Jan -12
Mar -12
May -12
Jul -12
Sep -12
Nov -12
Jan -13
Mar -13
May -13
Jul -13
Sep -13
Nov -13
Jan -14
Mar -14
North America Europe China
Steel prices fluctuate
with input costs
An iron ore price
implosion will have
material impact on
steel prices
Trading Strategy Commodity report, May 13, 2014
27
Figure 30: Freight costs as a percentage of steel prices to rise
Source: Handelsbanken Capital Markets, Bloomberg
Lower iron ore should leave steel with a firm margin floor but softer ceiling A decline in iron ore prices would most likely be subject to price pressure as long as low utilisation rates linger. However, with real prices of steel falling while prices on steel-intensive end products are rising (with inflation), steel buyers are likely to be less forceful in price negotiations as the steel share of end products decreases. Falling iron ore prices of the magnitude we foresee will no doubt benefit steel buyers, but most likely this will also ease some of the pains in steel companies.
Stainless steel to benefit from end of Indonesian pig iron export ban
Indonesian export ban is a temporary supply disruption The export ban on Indonesian nickel pig iron ore (discussed previously) is a temporary supply disruption that, although eventually fading, will cause a continued nickel rally which will benefit not only nickel miners but also stainless steel producers. The short-term effects are as follows:
When nickel prices rise, steel producers will hike prices for distributors and end-users, as alloy surcharges will rise regardless of where base prices trade (base price + surcharges = price of stainless steel). These price increases are imposed with a 1-2 month lag and buyers aim to pre-empt price hikes and buy ahead, which drives volumes to stainless steel producers.
As volumes increase and suppliers see tighter markets, they typically attempt to raise base prices as well, which is the main driver of margins.
Neither short-term effect is structural by nature. However, if the Indonesian government enforces the ban, there will most likely be permanent effects which will benefit stainless steel manufacturers in the rest of the world.
Some 30% of global stainless steel production is based on nickel pig iron. The current cost benefit is estimates to EUR 150-200/tonne (corresponding to approximately 10% of current transaction price). Forcing Chinese steel producers to use refined nickel rather than the cheaper pig iron substitute would erode much of this competitive advantage, easing the pressure from exports of stainless steel to e.g. Europe.
Indonesia will hold presidential elections in July; we see it as unlikely that any miners commit to build downstream capacity ahead of the outcome. If the ore export ban is enforced after these elections, it will take miners two years before
Steel producers may
get a piece of it
Near-term benefits
from rallying nickel
Structural
implications

Trading Strategy Sector report, May 13, 2014
28
downstream capacity has been installed. However, as these decisions to build are taken it is likely that Chinese stainless steel mills commence calibrating their production to use scrap and refined nickel. Such a restructuring of the Chinese stainless steel industry will create a new equilibrium in refined nickel markets but also likely lay the foundation for less meagre stainless steel markets in Europe as the export incentive ease for the Chinese.

Trading Strategy Commodity report, May 13, 2014
29
Crude oil and natural gas – the boom of 21st century Optimists say the conditions are right for a truly global unconventional oil business. Sustained high oil prices
give drillers every incentive to unlock more supply. This is what happened in the US, where forecasts for 2015
predict the US will be vying with Russia and Saudi Arabia to be the world’s largest producer. However, we
remain cautious: the rest of the world is not the US.
US shale oil: the production boom of the 21st century Technology improvements come stepwise in the extractive industries. The technology for extracting unconventional oil and gas has advanced rapidly, which by itself makes today’s unconventional resources the conventional ones of tomorrow. It also vouches for increasing production simultaneously, as prices fall when improvements in technology lower production costs.
Global impact from local booms One of the most visible success signs of recent times is illustrated in the figures below. Higher natural gas output from a significant lower number of rigs verifies the improved efficiency looked for by commodity-producing industries. The impact of this is already being felt outside the US, although the US export ban on crude oil remains intact. A rising gas supply at low cost has substituted demand for US coal, which instead has been exported elsewhere, particularly to Europe, putting pressure on coal and electricity prices.
Figure 31: Gas output vs. rigs US coal exports, nat. gas production
Source: Handelsbanken Capital Markets, Bloomberg
The US crude oil miracle We are witnessing one of the greatest production booms of modern times. After 40 years of declining production, the US managed to implement new technology and reverse the negative trend of crude oil output. US production is growing even faster than Russia’s did between 2000 and 2005, and is predicted to add another million barrels per day during 2014 to rise again by nearly the same amount in 2015 and reach 9.3m b/d. The world balance has changed and will continue to do so quickly. Many non-OPEC countries have increased production, and only one of the world’s five biggest oil producers today is an OPEC member.
The US, Canada and Mexico now produce more oil than the top three OPEC countries, Saudi Arabia, Iraq and Iran. OPEC, whose politics are largely a consequence of what Saudi Arabia can afford given the country represents 30% of
Technology
advancing rapidly
US gas boom putting
pressure on coal and
electricity prices in
Europe
Only one of the
world’s five biggest
oil producers is an
OPEC member

Trading Strategy Sector report, May 13, 2014
30
the cartel’s production, has seen its power wane. OPEC´s ambition to stabilise the price lies behind the fluctuating production in Saudi Arabia. North Sea production is declining fast, as it has been doing for a decade. Recent years have seen more bucks but less of a bang in that region.
Figure 32: World oil map is changing fast (US forecast from EIA)
Source: Handelsbanken Capital Markets, Bloomberg
Not repeated elsewhere The sceptics say, however, that the oil production rise will be short-lived and concentrated in North America. The success in the US is accredited to a few small independent oil companies run by managers with a superhuman tolerance for risk. That sort of development will not be seen in Europe, the home of eco-warriors, and it will not be repeated easily in China, Russia or Latin America, which all lack the fleet of service companies that have done the grunt work in the US. For those reasons, significant production from unconventional sources outside North America is probably a decade away. In addition, the structurally steep decline rates of shale oil wells means a greater number of them need to be drilled to maintain merely flat production – a strong argument that growth rates will slow significantly in a few years.
Lower imports affect exporters of light, sweet oil
The rising US production corresponds to lower import needs. Most new American wells, such as those in the Bakken shale oil field, produce light, sweet crude that can be easily refined into gasoline. Lower US imports affect west African exporters in the first place, as they produce similar qualities. On the other hand, the US still has a strong need for sour, dense qualities, which are produced by Saudi, Canada and Venezuela. These countries still keep their positions as crude exporters.
Significant shale oil
production outside
North America is a
decade away
America’s new wells
producing light,
sweet crude

Trading Strategy Commodity report, May 13, 2014
31
Figure 33: US crude output, imports US crude imports from West Africa
Source: Handelsbanken Capital Markets, Bloomberg
Incentive price only matters when supply is tight The IEA says a breakeven oil price of USD 64/barrel is required to make tight oil projects feasible. That is the lower end of North American unconventional oil reserves. The high end is represented by oil sands, with a supply cost in a wide range between USD 50-90/barrel. In general, USD 80-85/barrel would make most sources in North America viable. Today’s marginal cost of non-OPEC production worldwide is USD 104/barrel, strongly supported by ultra deepwater projects. It would thus be natural to assume that oil producers only will expand capacity if prices remain above the USD 100 mark. Over time, this is a fair assumption. The incentive price where producers spend is highly relevant for pricing as long as supply is tight, but when actual excess supply emerges, the marginal level of suffering swings into focus, and as that happens, the relevant question is what OPEC can sustain.
Supply disruption hindered price gravidity Concerns about Iran, oil thieves in Nigeria, disintegration in Iraq and civil war in Libya have all fuelled the price of oil during the last three years. Exports from these countries are down by about 3 million barrels per day. This loss is almost exactly compensated by increased production in the US, which has led to stability in the oil price without any strategically voluntary cutbacks from OPEC. Now, these problems are starting to ease.
Iraq has already increased exports from its southern regions and reached record levels in February post the American intervention in 2003.
Incentive price
where producers
spend is only
relevant as long as
tightness remains
Supply disruptions
are compensated by
US rising production
Iraq has already
increased exports

Trading Strategy Sector report, May 13, 2014
32
Figure 34: Crude production OPEC supply disruptions
Source: Handelsbanken Capital Markets, Bloomberg
Negotiations with Iran had a breakthrough in November 2013 when an interim deal struck over its nuclear programme and exports started to edge higher. Easing of sanctions so far does not include oil, but a long-term deal is scheduled to be finalised by July 20. If oil sanctions ease, then Iran’s oil exports could begin a slow recovery.
Libya seems more hopeful. Exports are hindered by strikes and threats from rebels seeking self-rule for Libya’s eastern regions to sell oil independently of Tripoli. Rebels agreed to surrender two oil ports to the government on April 6. The two remaining export facilities they control will be handed over shortly. It is unlikely that 2014 will end without a solution being found, and Libya will then have the opportunity to secure much needed oil export income. Of the three trouble spots, it is Libya that can quickest achieve exports that influence the price and Libya is therefore the one to watch more closely.
OPEC will come under pressure OPEC’s situation is hereby set to deteriorate rapidly. The members of the cartel that have not been affected by supply disruptions or sanctions have been able to benefit from high production and high prices when exports from three members have involuntarily ceased. If Libya, Iran and Iraq return to exporting oil at pre-disruption levels, it remains to be seen how interested Saudi Arabia is in cutting production to hand over income to Iraq, which is still officially outside OPEC’s joint production quota, and Iran, with whom relations have been mixed throughout OPEC’s history.
Putin gave some relief Recent good news out of Libya has been counteracted by the rising risk premium due to the escalation of violence in Ukraine. Any change in the situation with Russia will override news flow in MENA given Russia’s larger portion of the crude export market. At the same time, growing public discontent and lack of investment are taking their toll on Venezuelan oil output, which has dropped from 2.7 million barrels per day in 2013 to 2.5 million in 2014.
Saudi Arabia to set floor at USD 91 The potentially rising supply on the world export market comes at the same time as shifting demographics and fuel efficiency in developed economies and China’s cooling economic growth affecting the demand side of the price equation. Given last year’s civil unrest in the MENA region, it has been increasingly important for budgets to be balanced so that cherished social benefits are maintained as these governments traditionally have had low taxes and high levels of subsidies for food
Supply disruptions
equal to US boom
If oil sanctions ease
on Iran, exports
could begin a slow
recovery in H2 2014
It is unlikely that
2014 will end
without Libya back
in exports
OPEC’s situation is
set to deteriorate
rapidly
Russia risk premium
overrides news flow
in MENA
Saudi will maintain a
fiscal balance at
Brent price of more
than USD 91

Trading Strategy Commodity report, May 13, 2014
33
and fuel. Saudi will maintain a fiscal balance at a Brent price of more than USD 91. These levels will be more important if OPEC comes under pressure as we expect.
Figure 35: Oil price for fiscal breakeven in MENA from IMF
Source: Handelsbanken Capital Markets, Bloomberg, IMF
Natural gas Even though the US and Canada have the most developed fields in unconventional gas, other nations are about to catch up. China, Argentina and Australia are all set to be among significant future producers. China has huge shale gas reserves and has entered into an agreement with the US to share technological know-how.
The development of shale resources is however subject to a lengthy learning curve. It took the United States 35 years to move from discovery to production. However, this will go much faster for the followers. Europe is only at the start of this process. European deposits appear to be deeper than in the US and hence more technically challenging. Land ownership is also much more fragmented and there is less incentive for European residents to support nearby drilling. A ban on the industry is already in place in France, Bulgaria and North Rhine Westphalia in Germany.
Regional gas market will normalise in slow motion Given the high transport barriers in intercontinental natural gas markets stemming from the high cost of transportation and the need for board-breaking infrastructure solutions, a wide spread between regional gas prices has established. The price divergence has widened after the Fukushima accident, but Japan’s nuclear regulators are about to review a possible restart of 17 nuclear reactors. This is a slow process and will likely not impact gas prices in 2014. However, the election of pro-nuclear Yoichi Masuzoe as Tokyo Governor could accelerate the process.
As infrastructure for exporting natural gas is built in the US for imports in Europe, prices will start to narrow. The expected surge in liquefied natural gas to Europe during and after 2015 will reduce Russia’s flows and stranglehold on Europe’s gas supply. Russia currently supplies 30% of the Continent’s gas needs.
China, Argentina and
Australia are all set
to be significant
future producers
It took the United
States 35 years to
move from discovery
to production
High transport
barriers in
intercontinental
natural gas markets
Russia is supplying
30% of Europe’s gas
needs

Trading Strategy Sector report, May 13, 2014
34
Figure 36: Regional gas prices have diverged
Source: Handelsbanken Capital Markets, Bloomberg

Trading Strategy Commodity report, May 13, 2014
35
Is a new bull market coming in commodities? As argued in previous sections of this report, the current commodity cycle is in deflation mode and we believe
that key commodities still need to bottom in terms of pricing. However, as greenfield spending has peaked
and demand grows into the current pipeline of supply, it is inevitable that prices will once again commence
rising. New arguments maintain that nickel prices have turned and that zinc may be turning in the coming
two years. Although copper and iron ore remain with risks on the downside, we believe that copper will be
among the leading metals in the next boom market as well.
The next ‘Big 5’ are larger together than China Looking at potential drivers of commodity consumption ahead, we highlight five countries in Asia that may be leading the next demand boom. Although Nigeria and Ethiopia will see high population growth, we assume that African countries will lag developing countries in southeast Asia and will hence have no abilities to bridge demand between this boom and the next.
Figure 37: Income/capita, USD China’s regional divergence
Source: Handelsbanken Capital Markets, Macrobond
Adding up the populations of India (1,265 million), Indonesia (240 million), Pakistan (185 million), Bangladesh (158 million), Philippines (100 million) and Vietnam (92 million) gives an aggregate population of 1.8 billion people and an aggregate GDP of USD 2,600bn, compared to China’s 1.4 billion people and in excess of USD 8,200bn in GDP.
Development in the above-named countries will no doubt drive global demand for natural resources to new highs in terms of tonnage. However, none of these countries has the political determination, infrastructure or liquidity reserves to walk down the same synchronised development path as China has done in the past decade. As argued above, we believe a commodity bust is materialising now, with oil, copper and iron ore deflating. Therefore, we would not bank on the likelihood of the next ‘Big 5’ countries offsetting the expected supply/demand imbalance, and we can only conclude that the next boom will take place after the current bust has played out.
Is the mining spending cycle dead? In our view, the peak of the decisions for this mining spending boom occurred in 2011. In 2010 and 2011, the industry saw growth in greenfield project announcements of 20% while new announcements grew 9% and 8% in 2012 and
Five emerging
countries…
…with a total of
~2bn people…
These are unlikely to
absorb the emerging
supply wave
Expansion decisions
peaked in 2011
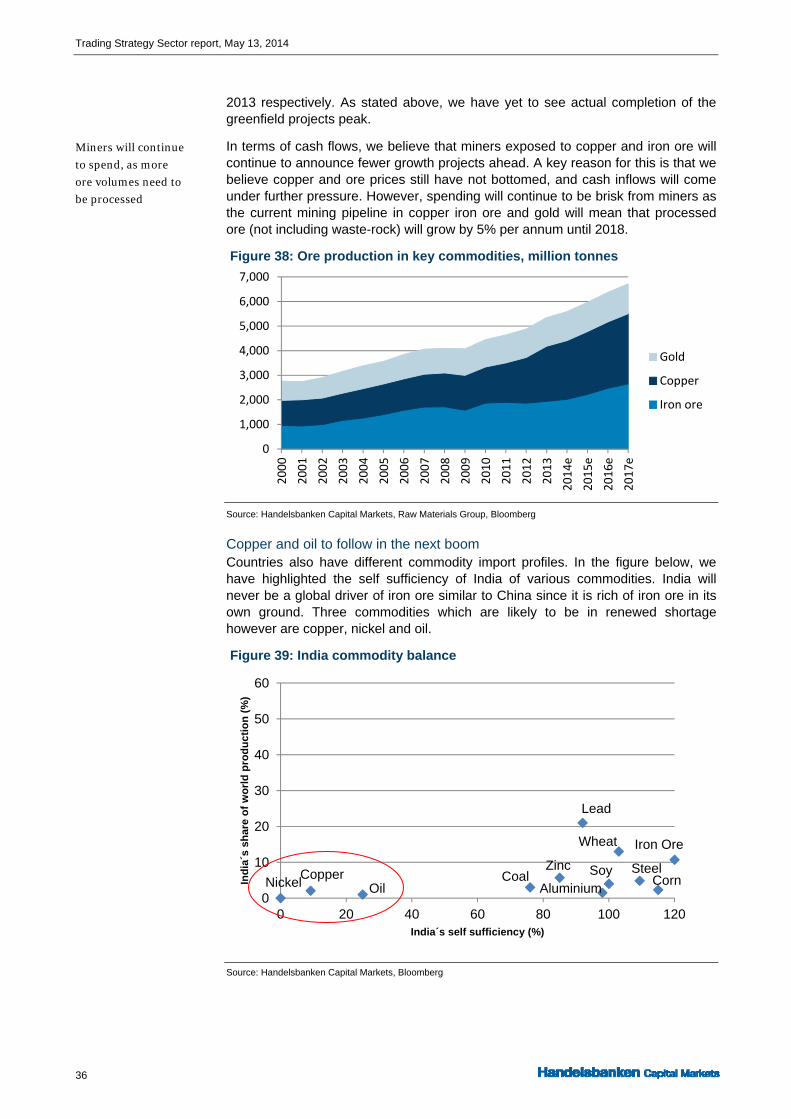
Trading Strategy Sector report, May 13, 2014
36
2013 respectively. As stated above, we have yet to see actual completion of the greenfield projects peak.
In terms of cash flows, we believe that miners exposed to copper and iron ore will continue to announce fewer growth projects ahead. A key reason for this is that we believe copper and ore prices still have not bottomed, and cash inflows will come under further pressure. However, spending will continue to be brisk from miners as the current mining pipeline in copper iron ore and gold will mean that processed ore (not including waste-rock) will grow by 5% per annum until 2018.
Figure 38: Ore production in key commodities, million tonnes
Source: Handelsbanken Capital Markets, Raw Materials Group, Bloomberg
Copper and oil to follow in the next boom Countries also have different commodity import profiles. In the figure below, we have highlighted the self sufficiency of India of various commodities. India will never be a global driver of iron ore similar to China since it is rich of iron ore in its own ground. Three commodities which are likely to be in renewed shortage however are copper, nickel and oil.
Figure 39: India commodity balance
Source: Handelsbanken Capital Markets, Bloomberg
0
1,000
2,000
3,000
4,000
5,000
6,000
7,0002000
2001
2002
2003
2004
2005
2006
2007
2008
2009
2010
2011
2012
2013
2014e
2015e
2016e
2017e
Gold
Copper
Iron ore
0
10
20
30
40
50
60
0 20 40 60 80 100 120
Ind
ia´s
sh
are
of
wo
rld
pro
du
cti
on
(%
)
India´s self sufficiency (%)
SteelZinc
Iron Ore
Copper CoalOil
Lead
Aluminium
Wheat
CornSoy
Nickel
Miners will continue
to spend, as more
ore volumes need to
be processed
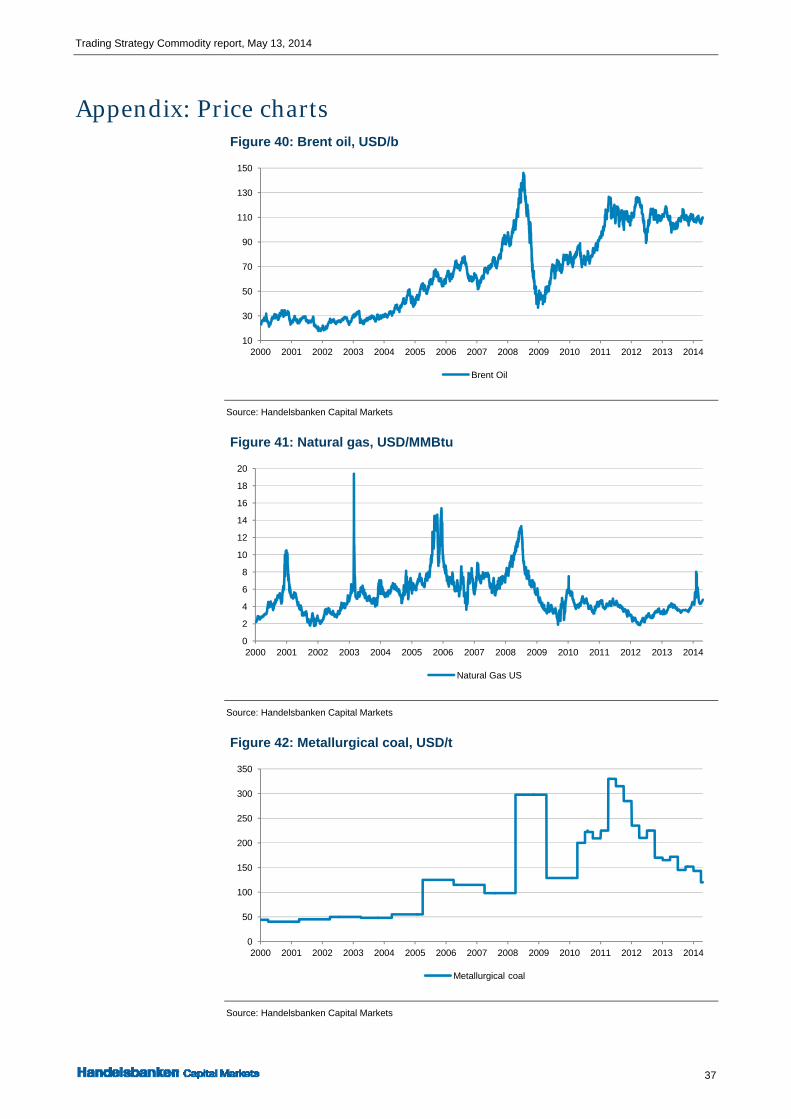
Trading Strategy Commodity report, May 13, 2014
37
Appendix: Price charts Figure 40: Brent oil, USD/b
Source: Handelsbanken Capital Markets
Figure 41: Natural gas, USD/MMBtu
Source: Handelsbanken Capital Markets
Figure 42: Metallurgical coal, USD/t
Source: Handelsbanken Capital Markets
10
30
50
70
90
110
130
150
2000 2001 2002 2003 2004 2005 2006 2007 2008 2009 2010 2011 2012 2013 2014
Brent Oil
0
2
4
6
8
10
12
14
16
18
20
2000 2001 2002 2003 2004 2005 2006 2007 2008 2009 2010 2011 2012 2013 2014
Natural Gas US
0
50
100
150
200
250
300
350
2000 2001 2002 2003 2004 2005 2006 2007 2008 2009 2010 2011 2012 2013 2014
Metallurgical coal

Trading Strategy Commodity report, May 13, 2014
38
Figure 43: Iron ore, USD/t
Source: Handelsbanken Capital Markets
Figure 44: Steel, HRC Northern Europe, EUR/t
Source: Handelsbanken Capital Markets
Figure 45: Aluminium, USD/t
Source: Handelsbanken Capital Markets
0
20
40
60
80
100
120
140
160
180
200
2000 2001 2002 2003 2004 2005 2006 2007 2008 2009 2010 2011 2012 2013 2014
Iron ore
350
400
450
500
550
600
650
700
750
800
2006 2007 2008 2009 2010 2011 2012 2013
HRC Steel North Europé
1,000
1,500
2,000
2,500
3,000
3,500
2000 2001 2002 2003 2004 2005 2006 2007 2008 2009 2010 2011 2012 2013 2014
Aluminium

Trading Strategy Commodity report, May 13, 2014
39
Figure 46: Copper, USD/t
Source: Handelsbanken Capital Markets
Figure 47: Nickel, USD/t
Source: Handelsbanken Capital Markets
Figure 48: Zinc, USD/t
Source: Handelsbanken Capital Markets
1,000
2,000
3,000
4,000
5,000
6,000
7,000
8,000
9,000
10,000
11,000
2000 2001 2002 2003 2004 2005 2006 2007 2008 2009 2010 2011 2012 2013 2014
Copper
0
10,000
20,000
30,000
40,000
50,000
60,000
2000 2001 2002 2003 2004 2005 2006 2007 2008 2009 2010 2011 2012 2013 2014
Nickel
500
1,000
1,500
2,000
2,500
3,000
3,500
4,000
4,500
5,000
2000 2001 2002 2003 2004 2005 2006 2007 2008 2009 2010 2011 2012 2013 2014
Zinc
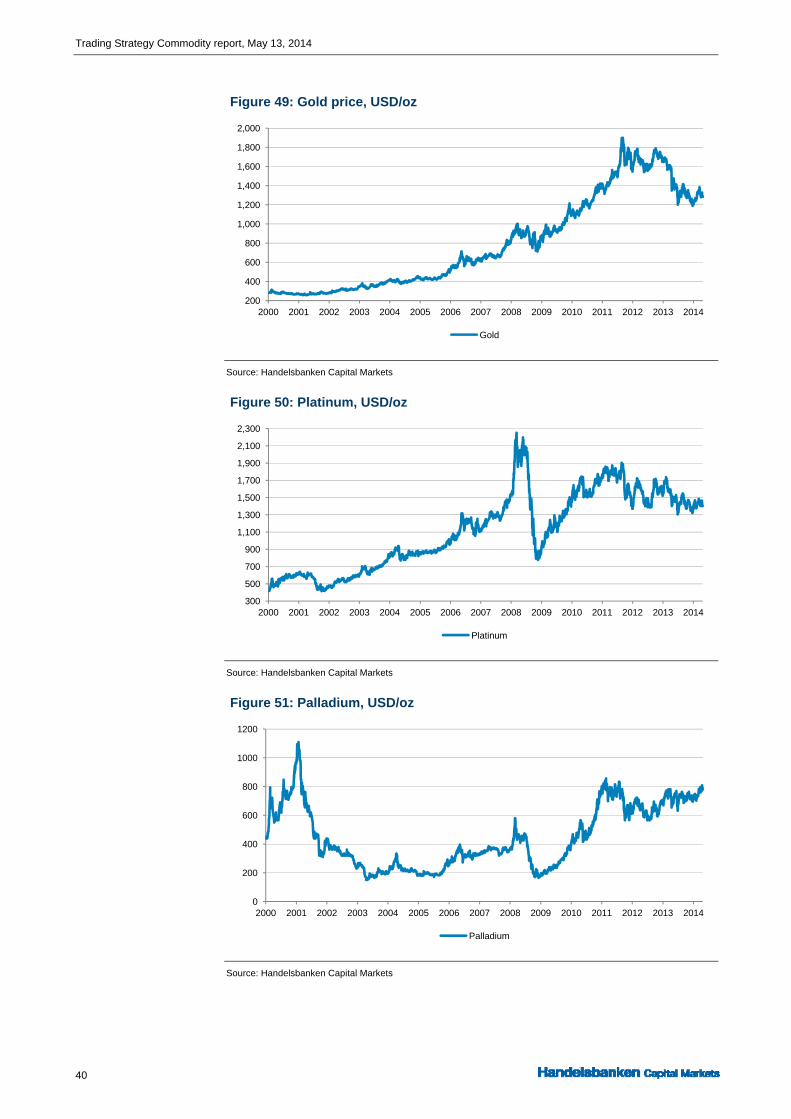
Trading Strategy Commodity report, May 13, 2014
40
Figure 49: Gold price, USD/oz
Source: Handelsbanken Capital Markets
Figure 50: Platinum, USD/oz
Source: Handelsbanken Capital Markets
Figure 51: Palladium, USD/oz
Source: Handelsbanken Capital Markets
200
400
600
800
1,000
1,200
1,400
1,600
1,800
2,000
2000 2001 2002 2003 2004 2005 2006 2007 2008 2009 2010 2011 2012 2013 2014
Gold
300
500
700
900
1,100
1,300
1,500
1,700
1,900
2,100
2,300
2000 2001 2002 2003 2004 2005 2006 2007 2008 2009 2010 2011 2012 2013 2014
Platinum
0
200
400
600
800
1000
1200
2000 2001 2002 2003 2004 2005 2006 2007 2008 2009 2010 2011 2012 2013 2014
Palladium
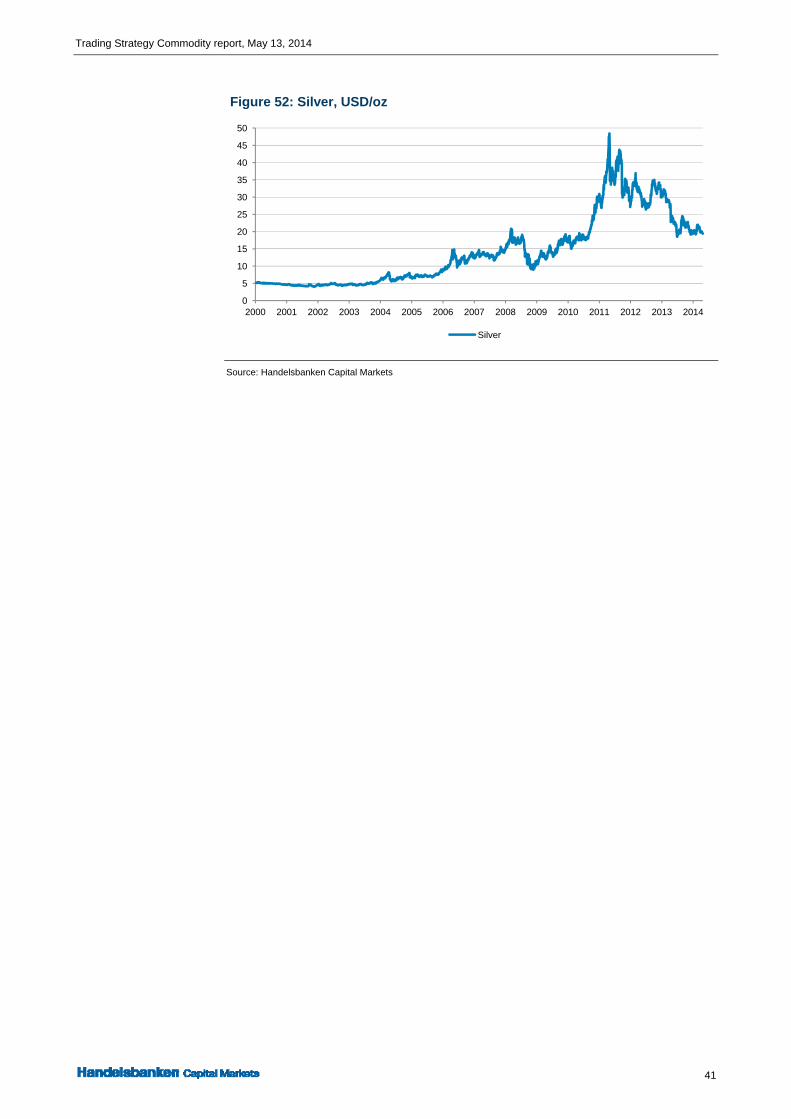
Trading Strategy Commodity report, May 13, 2014
41
Figure 52: Silver, USD/oz
Source: Handelsbanken Capital Markets
0
5
10
15
20
25
30
35
40
45
50
2000 2001 2002 2003 2004 2005 2006 2007 2008 2009 2010 2011 2012 2013 2014
Silver
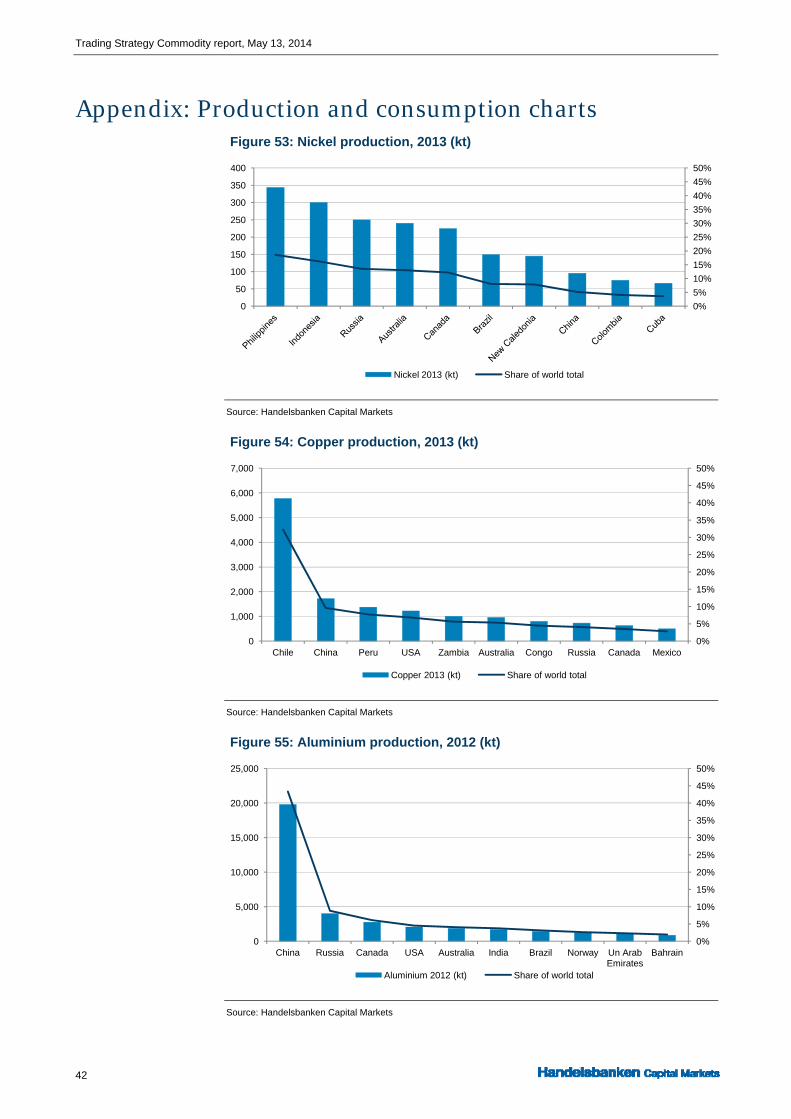
Trading Strategy Commodity report, May 13, 2014
42
Appendix: Production and consumption charts Figure 53: Nickel production, 2013 (kt)
Source: Handelsbanken Capital Markets
Figure 54: Copper production, 2013 (kt)
Source: Handelsbanken Capital Markets
Figure 55: Aluminium production, 2012 (kt)
Source: Handelsbanken Capital Markets
0%
5%
10%
15%
20%
25%
30%
35%
40%
45%
50%
0
50
100
150
200
250
300
350
400
Nickel 2013 (kt) Share of world total
0%
5%
10%
15%
20%
25%
30%
35%
40%
45%
50%
0
1,000
2,000
3,000
4,000
5,000
6,000
7,000
Chile China Peru USA Zambia Australia Congo Russia Canada Mexico
Copper 2013 (kt) Share of world total
0%
5%
10%
15%
20%
25%
30%
35%
40%
45%
50%
0
5,000
10,000
15,000
20,000
25,000
China Russia Canada USA Australia India Brazil Norway Un Arab Emirates
Bahrain
Aluminium 2012 (kt) Share of world total

Trading Strategy Commodity report, May 13, 2014
43
Figure 56: Zinc production, 2013 (kt)
Source: Handelsbanken Capital Markets
Figure 57: Iron ore production, 2012 (Mt)
Source: Handelsbanken Capital Markets
Figure 58: Gold production, 2013 (t)
Source: Handelsbanken Capital Markets
0%
5%
10%
15%
20%
25%
30%
35%
40%
45%
50%
0
500
1,000
1,500
2,000
2,500
3,000
3,500
4,000
4,500
5,000
Zinc 2013 (kt) Share of world total
0%
5%
10%
15%
20%
25%
30%
35%
40%
45%
50%
0
100
200
300
400
500
600
Australia Brazil China India Russia Ukraine South Africa
USA Canada Iran
Iron ore 2012 (Mt) Share of world total
0%
5%
10%
15%
20%
25%
30%
35%
40%
45%
50%
0
50
100
150
200
250
300
350
400
450
500
China Australia Russia USA South Africa
Peru Canada Mexico Ghana Indonesia
Gold 2013 (t) Share of world total

Trading Strategy Commodity report, May 13, 2014
44
Figure 59: Silver production, 2013 (t)
Source: Handelsbanken Capital Markets
Figure 60: Palladium production, 2013 (t)
Source: Handelsbanken Capital Markets
Figure 61: Platinum production, 2013 (t)
Source: Handelsbanken Capital Markets
0%
5%
10%
15%
20%
25%
30%
35%
40%
45%
50%
0
1,000
2,000
3,000
4,000
5,000
6,000
Silver 2013 (t) Share of world total
0%
5%
10%
15%
20%
25%
30%
35%
40%
45%
50%
0
10
20
30
40
50
60
70
80
90
Russia South Africa Canada USA Zimbabwe Botswana Finland Australia
Palladium 2013 (t) Share of world total
0%
10%
20%
30%
40%
50%
60%
70%
80%
90%
100%
0
20
40
60
80
100
120
140
South Africa
Russia Zimbabwe Canada USA Finland Colombia Botswana Australia
Platinum 2013 (t) Share of world total

Trading Strategy Commodity report, May 13, 2014
45
Figure 62: Crude oil production, 2013 (Mbpd)
Source: Handelsbanken Capital Markets
Figure 63: Global nickel consumption by first use, 2013
Source: Handelsbanken Capital Markets
Figure 64: Global stainless steel consumption by first use, 2013
Source: Handelsbanken Capital Markets
0%
5%
10%
15%
20%
25%
30%
35%
40%
45%
50%
0.0
2.0
4.0
6.0
8.0
10.0
12.0
Crude oil 2013 (Mbpd) Share of world total
0%
10%
20%
30%
40%
50%
60%
70%
Primary nickel in stainless
Non-Ferrous Alloys
Plating Other Alloy Steel Foundry
0%
5%
10%
15%
20%
25%
30%
35%
Process & other industries
Catering utensils & domestic appliances
Architecture, building & construction
Automotive & transport
Others & unallocated
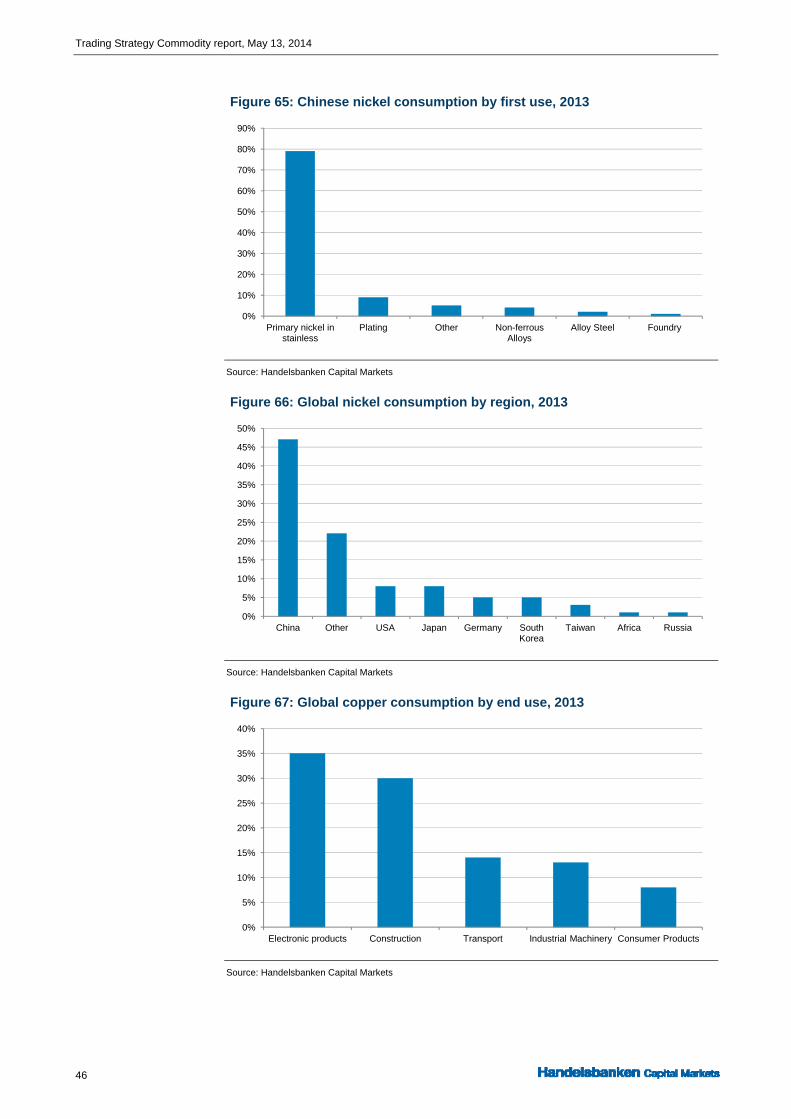
Trading Strategy Commodity report, May 13, 2014
46
Figure 65: Chinese nickel consumption by first use, 2013
Source: Handelsbanken Capital Markets
Figure 66: Global nickel consumption by region, 2013
Source: Handelsbanken Capital Markets
Figure 67: Global copper consumption by end use, 2013
Source: Handelsbanken Capital Markets
0%
10%
20%
30%
40%
50%
60%
70%
80%
90%
Primary nickel in stainless
Plating Other Non-ferrous Alloys
Alloy Steel Foundry
0%
5%
10%
15%
20%
25%
30%
35%
40%
45%
50%
China Other USA Japan Germany South Korea
Taiwan Africa Russia
0%
5%
10%
15%
20%
25%
30%
35%
40%
Electronic products Construction Transport Industrial Machinery Consumer Products

Trading Strategy Commodity report, May 13, 2014
47
Figure 68: Global refined copper consumption by region, 2013
Source: Handelsbanken Capital Markets
Figure 69: Global copper consumption by first use, 2013
Source: Handelsbanken Capital Markets
Figure 70: Chinese copper consumption by first use, 2013
Source: Handelsbanken Capital Markets
0%
5%
10%
15%
20%
25%
30%
35%
40%
45%
China Other Asia Europe North America Latin America Oceania Africa
0%
10%
20%
30%
40%
50%
60%
70%
Wire Rod Cu Alloys Tube Plate, Sheet & Strip
Rods, Bars & Sections
Electrolytic Foil
0%
10%
20%
30%
40%
50%
60%
70%
Wire Rod Cu Alloys Tube Plate, Sheet & Strip
Electrolytic Foil Rods, Bars, & Sections

Trading Strategy Commodity report, May 13, 2014
48
Figure 71: Global zinc consumption by first use, 2013
Source: Handelsbanken Capital Markets
Figure 72: Global zinc consumption by region, 2013
Source: Handelsbanken Capital Markets
Figure 73: Global zinc consumption by end use, 2013
Source: Handelsbanken Capital Markets
0%
5%
10%
15%
20%
25%
30%
35%
40%
45%
50%
Galvanising Brass Semis & Castings
Rolled & Extruded Products
Diecasting Alloys Oxides & Chemicals
Miscellaneous
0%
5%
10%
15%
20%
25%
30%
35%
40%
45%
China Other Asia
Western Europe
Other USA Japan Russia Oceania Eastern Europe
Africa
0%
10%
20%
30%
40%
50%
60%
Construction Transport Infrastructure Industrial Machinery Consumer Products
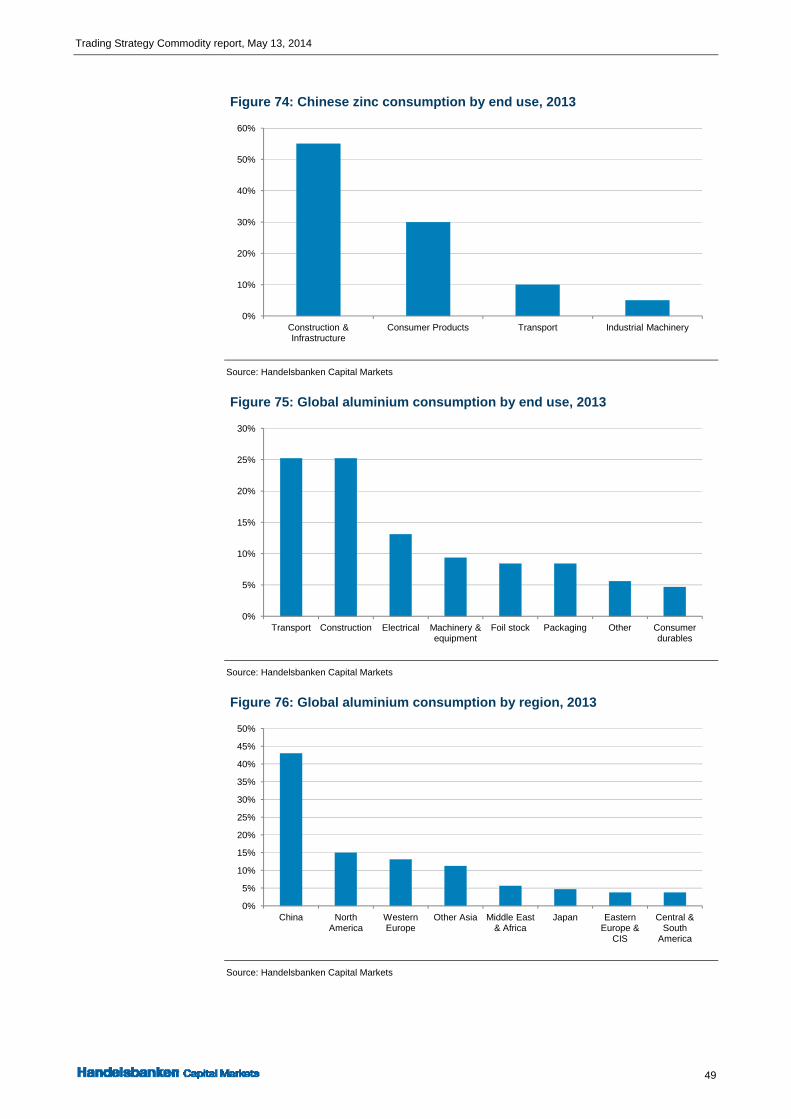
Trading Strategy Commodity report, May 13, 2014
49
Figure 74: Chinese zinc consumption by end use, 2013
Source: Handelsbanken Capital Markets
Figure 75: Global aluminium consumption by end use, 2013
Source: Handelsbanken Capital Markets
Figure 76: Global aluminium consumption by region, 2013
Source: Handelsbanken Capital Markets
0%
10%
20%
30%
40%
50%
60%
Construction & Infrastructure
Consumer Products Transport Industrial Machinery
0%
5%
10%
15%
20%
25%
30%
Transport Construction Electrical Machinery & equipment
Foil stock Packaging Other Consumer durables
0%
5%
10%
15%
20%
25%
30%
35%
40%
45%
50%
China North America
Western Europe
Other Asia Middle East & Africa
Japan Eastern Europe &
CIS
Central & South
America

Research disclaimers Handelsbanken Capital Markets, a division of Svenska Handelsbanken AB (publ) (collectively referred to herein as ‘SHB’), is responsible for the preparation of research reports. SHB is regulated in Sweden by the Swedish Financial Supervisory Authority, in Norway by the Financial Supervisory Authority of Norway, in Finland by the Financial Supervisory of Finland and in Denmark by the Danish Financial Supervisory Authority. All research reports are prepared from trade and statistical services and other information that SHB considers to be reliable. SHB has not independently verified such information and does not represent that such information is true, accurate or complete. Accordingly, to the extent permitted by law, neither SHB, nor any of its directors, officers or employees, nor any other person, accept any liability whatsoever for any loss, however it arises, from any use of such research reports or its contents or otherwise arising in connection therewith. This report has not been given to the subject company, or any other external party, prior to publication to approval the accuracy of the facts presented. The subject company has not been notified of the recommendation, target price or estimate changes, as stated in this report, prior to publication. In no event will SHB or any of its affiliates, their officers, directors or employees be liable to any person for any direct, indirect, special or consequential damages arising out of any use of the information contained in the research reports, including without limitation any lost profits even if SHB is expressly advised of the possibility or likelihood of such damages. The views contained in SHB research reports are the opinions of employees of SHB and its affiliates and accurately reflect the personal views of the respective analysts at this date and are subject to change. There can be no assurance that future events will be consistent with any such opinions. Each analyst identified in this research report also certifies that the opinions expressed herein and attributed to such analyst accurately reflect his or her individual views about the companies or securities discussed in the research report. Research reports are prepared by SHB for information purposes only. The information in the research reports does not constitute a personal recommendation or personalised investment advice and such reports or opinions should not be the basis for making investment or strategic decisions. This document does not constitute or form part of any offer for sale or subscription of or solicitation of any offer to buy or subscribe for any securities nor shall it or any part of it form the basis of or be relied on in connection with any contract or commitment whatsoever. Past performance may not be repeated and should not be seen as an indication of future performance. The value of investments and the income from them may go down as well as up and investors may forfeit all principal originally invested. Investors are not guaranteed to make profits on investments and may lose money. Exchange rates may cause the value of overseas investments and the income arising from them to rise or fall. This research product will be updated on a regular basis. No part of SHB research reports may be reproduced or distributed to any other person without the prior written consent of SHB. The distribution of this document in certain jurisdictions may be restricted by law and persons into whose possession this document comes should inform themselves about, and observe, any such restrictions. Please be advised of the following important research disclosure statements: SHB employees, including analysts, receive compensation that is generated by overall firm profitability. Analyst compensation is not based on specific corporate finance or debt capital markets services. No part of analysts’ compensation has been, is or will be directly or indirectly related to specific recommendations or views expressed within research reports. From time to time, SHB and/or its affiliates may provide investment banking and other services, including corporate banking services and securities advice, to any of the companies mentioned in our research. We may act as adviser and/or broker to any of the companies mentioned in our research. SHB may also seek corporate finance assignments with such companies. We buy and sell securities mentioned in our research from customers on a principal basis. Accordingly, we may at any time have a long or short position in any such securities. We may also make a market in the securities of all the companies mentioned in this report. [Further information and relevant disclosures are contained within our research reports.] SHB, its affiliates, their clients, officers, directors or employees may own or have positions in securities mentioned in research reports. According to the Bank’s Ethical Guidelines for the Handelsbanken Group, the board and all employees of the Bank must observe high standards of ethics in carrying out their responsibilities at the Bank, as well as other assignments. The Bank has also adopted Guidelines concerning Research which are intended to ensure the integrity and independence of research analysts and the research department, as well as to identify actual or potential conflicts of interests relating to analysts or the Bank and to resolve any such conflicts by eliminating or mitigating them and/or making such disclosures as may be appropriate. As part of its control of conflicts of interests, the Bank has introduced restrictions (“Information barriers”) on communications between the Research department and other departments of the Bank. In addition, in the Bank’s organisational structure, the Research department is kept separate from the Corporate Finance department and other departments with similar remits. The Guidelines concerning Research also include regulations for how payments, bonuses and salaries may be paid out to analysts, what marketing activities an analyst may participate in, how analysts are to handle their own securities transactions and those of closely related persons, etc. In addition, there are restrictions in communications between analysts and the subject company. For full information on the Bank’s ethical guidelines please see the Bank’s website www.handelsbanken.com/About the bank/Investor relations/Corporate social responsibility/Ethical guidelines. Handelsbanken has a ZERO tolerance of bribery and corruption. This is established in the Bank’s Group Policy on Bribery and Corruption. The prohibition against bribery also includes the soliciting, arranging or accepting bribes intended for the employee’s family, friends, associates or acquaintances. For company-specific disclosure texts, please consult the Handelsbanken Capital Markets website: www.handelsbanken.com/research. When distributed in the UK Research reports are distributed in the UK by SHB. SHB is authorised by the Swedish Financial Supervisory Authority (Finansinspektionen) and the Prudential Regulation Authority and subject to limited regulation by the Financial Conduct Authority and Prudential Regulation Authority. Details about the extent of our authorisation and regulation by the Prudential Regulation Authority, and regulation by the Financial Conduct Authority are available from us on request. UK customers should note that neither the UK Financial Services Compensation Scheme for investment business nor the rules of the Financial Conduct Authority made under the UK Financial Services and Markets Act 2000 (as amended) for the protection of private customers apply to this research report and accordingly UK customers will not be protected by that scheme. This document may be distributed in the United Kingdom only to persons who are authorised or exempted persons within the meaning of the Financial Services and Markets Act 2000 (as amended) (or any order made thereunder) or (i) to persons who have professional experience in matters relating to investments falling within Article 19(5) of the Financial Services and Markets Act 2000 (Financial Promotion) Order 2005 (the “Order”), (ii) to high net worth entities falling within Article 49(2)(a) to (d) of the Order or (iii) to persons who are professional clients under Chapter 3 of the Financial Conduct Authority Conduct of Business Sourcebook (all such persons together being referred to as “Relevant Persons”). When distributed in the United States Important Third-Party Research Disclosures: SHB and its employees are not subject to FINRA’s research analyst rules which are intended to prevent conflicts of interest by, among other things, prohibiting certain compensation practices, restricting trading by analysts and restricting communications with the companies that are the subject of the research report. SHB research reports are intended for distribution in the United States solely to “major U.S. institutional investors,” as defined in Rule 15a-6 under the Securities Exchange Act of 1934. Each major U.S. institutional investor that receives a copy of research report by its acceptance hereof represents and agrees that it shall not distribute or provide research reports to any other person Reports regarding fixed-income products are prepared by SHB and distributed by SHB to major U.S. institutional investors under Rule 15a-6(a)(2). Reports regarding equity products are prepared by SHB and distributed in the United States by Handelsbanken Markets Securities Inc. (“HMSI”) under Rule 15a-6(a)(2). When distributed by HMSI, HMSI takes responsibility for the report. Any U.S. person receiving these research reports that desires to effect transactions in any equity product discussed within the research reports should call or write HMSI. HMSI is a FINRA Member, telephone number (+1-212-326-5153).

Svenska Handelsbanken AB (publ) Stockholm Blasieholmstorg 11 SE-106 70 Stockholm Tel. +46 8 701 10 00 Fax. +46 8 701 28 50
Copenhagen Havneholmen 29 DK-1561 Copenhagen V Tel. +45 46 79 12 00 Fax. +45 46 79 15 52
Helsinki Aleksanterinkatu 11 FI-00100 Helsinki Tel. +358 10 444 11 Fax. +358 10 444 2578
Oslo Tjuvholmen Allé 11, Postboks 1249 Vika NO-0110 Oslo Tel. +47 223 97 000 Fax. +47 2233 6915
London 3 Thomas More Square London GB-E1W 1WY Tel. +44 207 578 8668 Fax. +44 207 578 8090
New York Handelsbanken Markets Securities, Inc. 875 Third Avenue, 4th Floor New York, NY 10022-7218 Tel. +1 212 326 5153 Fax. +1 212 326 2730 FINRA, SIPC
Contact information Capital Markets Michael Green Head +46 8 701 43 56
Per Elcar Head of Securities, Fixed Income, +46 8 701 19 49
FX and Commodities
Jan Häggström Head of Economic Research and +46 8 701 10 97 Chief Economist, SHB
Peter Karlsson Head of Equity & Credit Research +46 8 701 21 51
Björn Linden Head of Securities, Fixed Income, FX and Commodities International +44 7909528735
Debt Capital Markets Tony Lindlöf Head of Debt Capital Markets +46 8 701 25 10
Per Jäderberg Head of Corporate Loans +46 8 701 33 51
Måns Niklasson Head of Acquisition Finance +46 8 701 52 84
Ulf Stejmar Head of Corporate Bonds +46 8 463 45 79
Fixed Income Equity Sales, Foreign Exchange & Commodities Carl Cederschiöld Head of Sales +46 8 701 10 38
Eggert Mörling Head of Equity Sales +46 8 463 49 11
Henrik Franzén Head of Fixed Income Sales +46 8 463 46 72
Magnus Strömer Head of FX and Commodities Sales +46 8 463 45 63
Peter Carlberg Head of Derivative Sales +46 8 701 14 53
Lennart Living Head of Structured Saving Products +46 8 463 57 13
Martin Nossman Head of Cross Asset Execution +46 8 463 25 56
Trading Strategy Claes Måhlén Head, Chief Strategist +46 8 463 45 35
Johan Sahlström Chief Credit Strategist +46 8 463 45 37
Ronny Berg Senior Credit Strategist +47 22 82 30 36
Ola Eriksson Senior Credit Strategist +46 8 463 47 49
Martin Jansson Senior Commodity Strategist +46 8 461 23 43
Nils Kristian Knudsen Senior Strategist FX/FI +47 22 82 30 10
Andreas Skogelid Senior Strategist FI +46 8 701 56 80
Pierre Carlsson Strategist FX +46 8 463 46 17
Paul Betton Credit Analyst +46 8 463 45 78
Economic Research Jan Häggström Head of Economic Research +46 8 701 10 97
Sweden Petter Lundvik USA, Special Analysis +46 8 701 33 97 Gunnar Tersman Eastern Europe, Emerging Markets +46 8 701 20 53 Helena Trygg Japan, United Kingdom +46 8 701 12 84 Anders Brunstedt Sweden +46 8 701 54 32 Eva Dorenius Web Editor +46 8 701 50 54
Finland Tiina Helenius Head, Economic Research +358 10 444 2404
Tuulia Asplund Finnish economy +358 10 444 2403
Denmark Jes Asmussen Head, Economic Research +45 467 91203
Rasmus Gudum-Sessingø Danish economy +45 467 91619
Bjarke Roed-Frederiksen China and Latin America +45 467 91229
Norway Knut Anton Mork Head, Economic Research +47 22 39 71 81
Nils Kristian Knudsen Senior Strategist FX/FI +47 22 82 30 10
Kari Due-Andresen Norwegian economy +47 22 39 70 07
Marius Nyborg Hov Norwegian economy +47 22 39 7340
Regional Sales Copenhagen Kristian Nielsen +45 46 79 12 69
Gothenburg Karl-Johan Svensson +46 31 743 31 09
Gävle Johan Magnusson +46 26 172 111
Helsinki Mika Rämänen +358 10 444 62 20
Linköping Fredrik Lundgren +46 13 28 91 10
London Ray Spiers +44 207 578 86 12
Luleå/Umeå Ove Larsson +46 90 154 719
Luxembourg Erik Bertram +352 274 868 245
Malmö Ulf Larsson +46 40 24 54 04
Oslo Petter Fjellheim +47 22 82 30 29
Stockholm Malin Nilén +46 8 701 27 70
Toll-free numbers From Sweden to N.Y. & Singapore 020-58 64 46
From Norway to N.Y. & Singapore 800 40 333
From Denmark to N.Y. & Singapore 8001 72 02
From Finland to N.Y. & Singapore 0800 91 11 00
Within the US 1-800 396-2758


![Commodity Profile & Strategy Agreement Title: [insert] Reference: [insert]](https://static.fdocuments.us/doc/165x107/568155f7550346895dc3bf24/commodity-profile-strategy-agreement-title-insert-reference-insert-56ef364b95ad8.jpg)

![MeasuringConnectivityinLinearMultivariateProcesses ...downloads.hindawi.com/journals/cmmm/2012/140513.pdfability of PCoh to measure some forms of causality [34, 35], about the specific](https://static.fdocuments.us/doc/165x107/60815ba39c0cdf36647344fc/measuringconnectivityinlinearmultivariateprocesses-ability-of-pcoh-to-measure.jpg)

![Commodity Profile & Strategy Agreement Title: [insert] Reference: [insert] For info – delete prior to issue The strategy is used in the planning stage.](https://static.fdocuments.us/doc/165x107/56649e365503460f94b2512f/commodity-profile-strategy-agreement-title-insert-reference-insert.jpg)