1212121 Systematix 3QFY17 RU - 20-01...1212121 Systematix Research is also available on Bloomberg...
12
Systematix Research is also available on Bloomberg SSSL <Go>, Thomson & Reuters Systematix Shares & Stocks (I) Ltd. Investors are advised to refer through disclosures made at the end of the research report. 1 Ujjivan Financial Services Good show in a challenging quarter; maintain Buy Despite robust core business growth and earnings, Ujjivan Financial Services’ (UJJIVAN) 3QFY17 profit declined 9.5% yoy, led by high NPA provisions, which were driven by demonetisation. Key highlights were: 1) assets under management (AUM) grew 43.5% yoy (1.6% qoq), while disbursements fell 0.6% yoy (23.9% qoq); 2) operating profit grew 49.7% yoy, led by strong NII (43.9% yoy) and sturdy NIM (13%); 3) operating expenses rose 51.7% yoy (7.6% qoq), reflecting ongoing transition towards becoming a small finance bank; 4) GNPAs stood at 0.25% (up 8bps qoq), with ~50% qoq rise in absolute GNPAs, and repayment rates fell 189bps qoq to 97.9%; 5) demonetisation had a limited impact on UJJIVAN’s lending business and 6) company expects to launch the SFB in 4QFY17 (first week of February). Robust credit growth led by microfinance, with sturdy NIM: Gross advances grew 43.5% yoy (1.6% qoq), chiefly driven by microfinance (40.6% yoy, 86% of advances), with robust contributions from MSE (33.2% yoy, 4.9% of advances) and housing (77.6% yoy, 5.5% of advances). However, demonetisation impacted disbursements, which fell 0.6% yoy (23.9% qoq). Microfinance disbursements fell 24.7% qoq, with the average ticket size in this segment rising 2.8% qoq to Rs23,172. NIM (reported) improved 39bps yoy (20bps qoq) to 13.2%. Given the latent demand, under-penetration and lack of relevant financial products in its target borrower segments, we expect UJJIVAN’s advances to clock a CAGR of 40% over FY16-19e. UJJIVAN has prudently provided for overdue loans: GNPAs rose 8bps qoq to 0.25%, with ~50% qoq rise in absolute GNPAs. Also, PAR over 30 days increased sharply qoq, from 0.25% to 3.8%. On Jan 18, 2017, the collection efficiency for loans due in November and December was 95.4% and 91.5% respectively, suggesting that the demonetisation impact persisted beyond 3QFY17. However, UJJIVAN has recognised the asset quality stress and prudently provided for overdue loans, leading to high credit costs qoq – from 0.5% to 3.4%. We expect macro-economic risks to gradually abate and believe the company would profit from its robust lending franchise, healthy capital adequacy and strong balance sheet liquidity. Valuations and risks: Due to lower-than-past business growth assumptions, we lower our FY18e/19e PAT estimates by 8.3%/6.7%. Hence, we revise the target price from Rs630 to Rs585 (3.1x 1HFY19e BV, earlier 3.3x 1HFY19e BV), based on the residual income model (CoE: 15.2%; beta: 1.4; Rf: 7.5%). In our view, valuations are likely to hold and could even improve, given the strong profitability (29% CAGR in PAT over FY17e-19e), healthy asset quality and capitalisation. We maintain a Buy rating and expect a far more fundamentally robust business model going forward, aided by sustainable AUM growth and stable asset quality, given the regulatory supervision, government support for the target credit segments and credit bureaus. Risks: Execution risks in SFB transition, irrational competition from banks and a change in management. Table 1: Quarterly financial statement (Rs mn) 3QFY17 3QFY16 yoy (%) 2QFY17 qoq (%) Net Interest income 3,313 2,469 34.1 3,143 5.4 Other Income 1,332 1,093 21.8 1,274 4.5 Net Income 1,981 1,376 43.9 1,868 6.0 Operating Expenses 400 204 96.1 415 (3.5) Operating Profit 1,211 809 49.7 1,196 1.3 Provisions 547 61 794.2 70 687.7 Profit Before Tax 664 748 (11.2) 1,127 (41.1) Tax 225 262 (14.4) 396 (43.3) Net Profit 439 486 (9.5) 730 (39.8) Source: Company, Systematix Institutional Research RESULT UPDATE Sector: Small Finance Banks Rating: Buy CMP: Rs353 Target Price: Rs585 Stock Info Sensex/Nifty 27,308 / 8,435 Bloomberg UJJIVAN IN Equity shares (mn) 118.5 52-wk High/Low Rs547/ 217 Face value Rs10 M-Cap Rs41.8bn/ $0.8bn 3-m Avg volume $8.3mn Financial Snapshot (Rs mn) Y/E Mar FY17e FY18e FY19e Net interest income 7,598 10,123 13,516 Operating profit 4,503 4,989 7,133 PAT 2,445 2,756 3,804 EPS (Rs) 20.7 23.2 31.9 PE (x) 17.1 15.2 11.1 BV (Rs) 151 173 203 P/BV (x) 2.3 2.0 1.7 RoA (%) 3.8 2.8 2.5 RoE (%) 16.4 14.3 17.0 Dividend yield (%) 0.2 0.2 0.3 Shareholding pattern (%) Sep ’16 Jun ’16 Mar ’16 Promoter - - - –Pledged - - - FII 9.6 9.2 41.1 DII 58.4 63.8 38.4 Others 32.0 27.0 20.5 Stock Performance (1-year) Systematix Institutional Equities 20 January, 2017 Clyton Fernandes [email protected] +91 22 6704 8066
Transcript of 1212121 Systematix 3QFY17 RU - 20-01...1212121 Systematix Research is also available on Bloomberg...
1212121
Systematix Research is also available on Bloomberg SSSL <Go>, Thomson & Reuters Systematix Shares & Stocks (I) Ltd.
Investors are advised to refer through disclosures made at the end of the research report.
1
Ujjivan Financial Services
Good show in a challenging quarter; maintain Buy Despite robust core business growth and earnings, Ujjivan Financial Services’ (UJJIVAN) 3QFY17 profit declined 9.5% yoy, led by high NPA provisions, which were driven by demonetisation. Key highlights were: 1) assets under management (AUM) grew 43.5% yoy (1.6% qoq), while disbursements fell 0.6% yoy (23.9% qoq); 2) operating profit grew 49.7% yoy, led by strong NII (43.9% yoy) and sturdy NIM (13%); 3) operating expenses rose 51.7% yoy (7.6% qoq), reflecting ongoing transition towards becoming a small finance bank; 4) GNPAs stood at 0.25% (up 8bps qoq), with ~50% qoq rise in absolute GNPAs, and repayment rates fell 189bps qoq to 97.9%; 5) demonetisation had a limited impact on UJJIVAN’s lending business and 6) company expects to launch the SFB in 4QFY17 (first week of February).
Robust credit growth led by microfinance, with sturdy NIM: Gross advances grew 43.5% yoy (1.6% qoq), chiefly driven by microfinance (40.6% yoy, 86% of advances), with robust contributions from MSE (33.2% yoy, 4.9% of advances) and housing (77.6% yoy, 5.5% of advances). However, demonetisation impacted disbursements, which fell 0.6% yoy (23.9% qoq). Microfinance disbursements fell 24.7% qoq, with the average ticket size in this segment rising 2.8% qoq to Rs23,172. NIM (reported) improved 39bps yoy (20bps qoq) to 13.2%. Given the latent demand, under-penetration and lack of relevant financial products in its target borrower segments, we expect UJJIVAN’s advances to clock a CAGR of 40% over FY16-19e.
UJJIVAN has prudently provided for overdue loans: GNPAs rose 8bps qoq to 0.25%, with ~50% qoq rise in absolute GNPAs. Also, PAR over 30 days increased sharply qoq, from 0.25% to 3.8%. On Jan 18, 2017, the collection efficiency for loans due in November and December was 95.4% and 91.5% respectively, suggesting that the demonetisation impact persisted beyond 3QFY17. However, UJJIVAN has recognised the asset quality stress and prudently provided for overdue loans, leading to high credit costs qoq – from 0.5% to 3.4%. We expect macro-economic risks to gradually abate and believe the company would profit from its robust lending franchise, healthy capital adequacy and strong balance sheet liquidity.
Valuations and risks: Due to lower-than-past business growth assumptions, we lower our FY18e/19e PAT estimates by 8.3%/6.7%. Hence, we revise the target price from Rs630 to Rs585 (3.1x 1HFY19e BV, earlier 3.3x 1HFY19e BV), based on the residual income model (CoE: 15.2%; beta: 1.4; Rf: 7.5%). In our view, valuations are likely to hold and could even improve, given the strong profitability (29% CAGR in PAT over FY17e-19e), healthy asset quality and capitalisation. We maintain a Buy rating and expect a far more fundamentally robust business model going forward, aided by sustainable AUM growth and stable asset quality, given the regulatory supervision, government support for the target credit segments and credit bureaus. Risks: Execution risks in SFB transition, irrational competition from banks and a change in management.
Table 1: Quarterly financial statement
(Rs mn) 3QFY17 3QFY16 yoy (%) 2QFY17 qoq (%)
Net Interest income 3,313 2,469 34.1 3,143 5.4 Other Income 1,332 1,093 21.8 1,274 4.5 Net Income 1,981 1,376 43.9 1,868 6.0 Operating Expenses 400 204 96.1 415 (3.5) Operating Profit 1,211 809 49.7 1,196 1.3 Provisions 547 61 794.2 70 687.7 Profit Before Tax 664 748 (11.2) 1,127 (41.1) Tax 225 262 (14.4) 396 (43.3) Net Profit 439 486 (9.5) 730 (39.8)
Source: Company, Systematix Institutional Research
RESULT UPDATE
Sector: Small Finance Banks Rating: Buy
CMP: Rs353 Target Price: Rs585
Stock Info
Sensex/Nifty 27,308 / 8,435
Bloomberg UJJIVAN IN
Equity shares (mn) 118.5
52-wk High/Low Rs547/ 217
Face value Rs10
M-Cap Rs41.8bn/ $0.8bn
3-m Avg volume $8.3mn
Financial Snapshot (Rs mn)
Y/E Mar FY17e FY18e FY19e
Net interest income 7,598 10,123 13,516
Operating profit 4,503 4,989 7,133
PAT 2,445 2,756 3,804
EPS (Rs) 20.7 23.2 31.9
PE (x) 17.1 15.2 11.1
BV (Rs) 151 173 203
P/BV (x) 2.3 2.0 1.7
RoA (%) 3.8 2.8 2.5
RoE (%) 16.4 14.3 17.0
Dividend yield (%) 0.2 0.2 0.3
Shareholding pattern (%)
Sep ’16 Jun ’16 Mar ’16
Promoter - - -
–Pledged - - -
FII 9.6 9.2 41.1
DII 58.4 63.8 38.4
Others 32.0 27.0 20.5
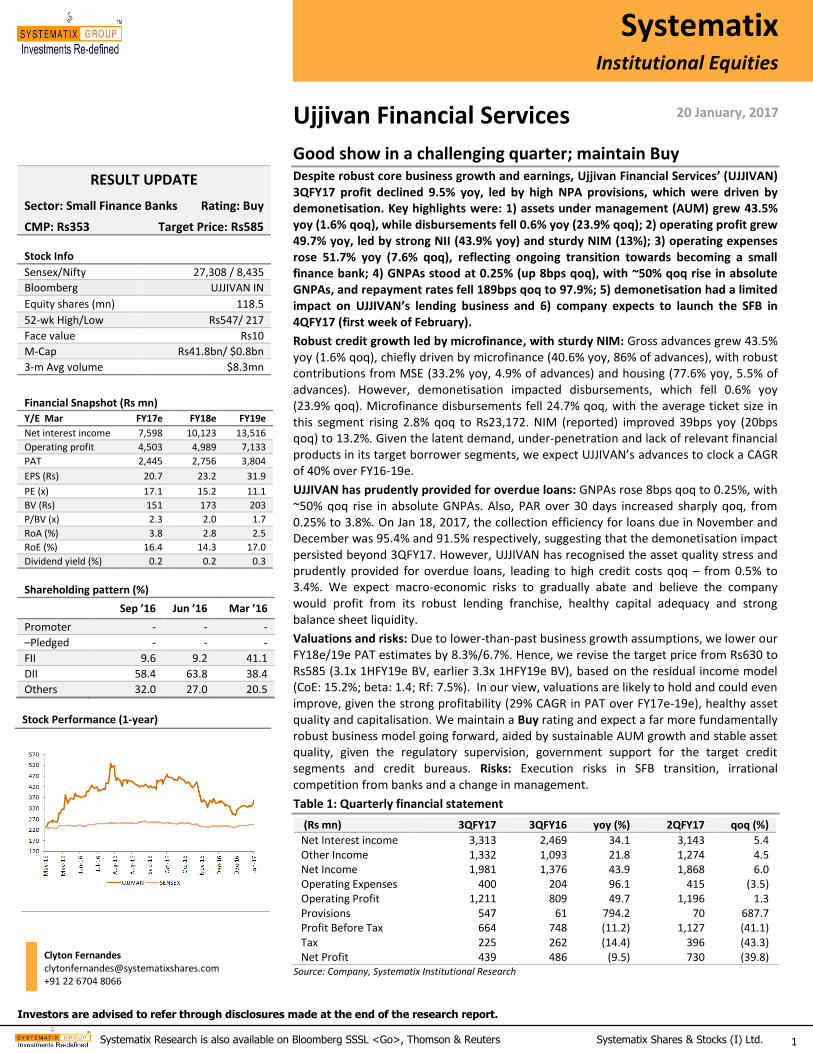
Stock Performance (1-year)
Systematix
Institutional Equities
20 January, 2017
Clyton Fernandes [email protected] +91 22 6704 8066
20 January, 2017
Systematix Research is also available on Bloomberg SSSL <Go>, Thomson & Reuters Systematix Shares & Stocks (I) Ltd.
Ujjivan Financial Services
2
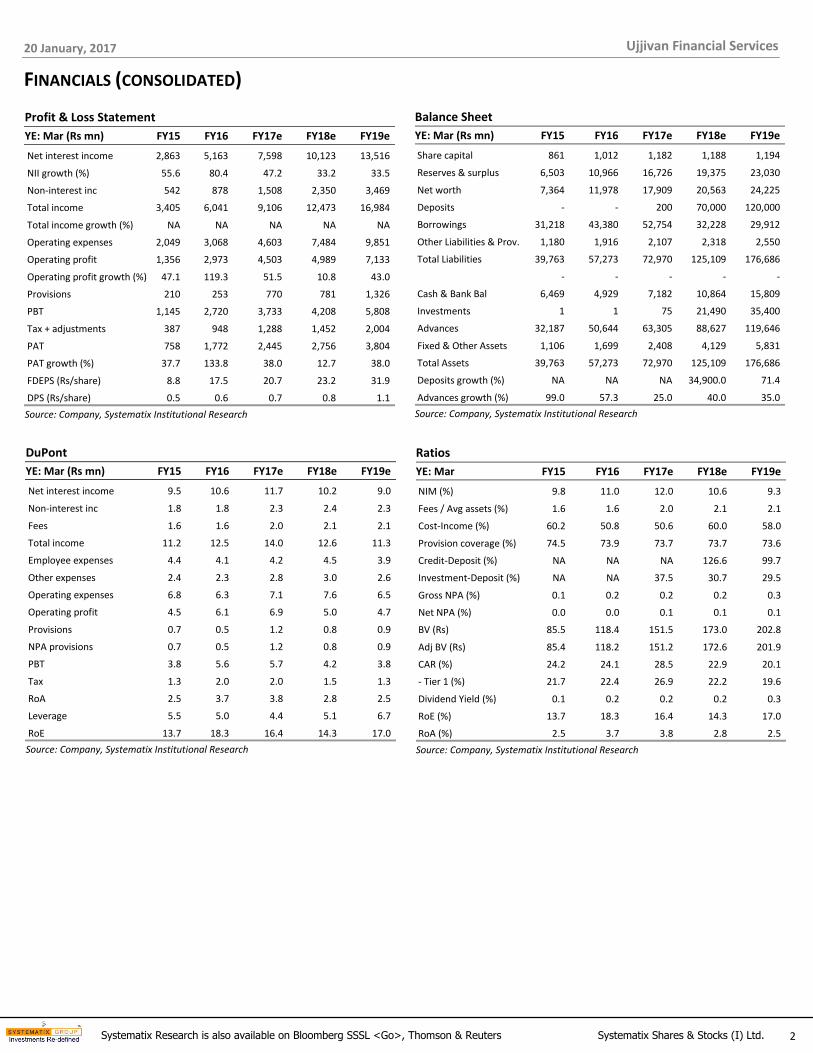
FINANCIALS (CONSOLIDATED)
Profit & Loss Statement
YE: Mar (Rs mn) FY15 FY16 FY17e FY18e FY19e
Net interest income 2,863 5,163 7,598 10,123 13,516
NII growth (%) 55.6 80.4 47.2 33.2 33.5
Non-interest inc 542 878 1,508 2,350 3,469
Total income 3,405 6,041 9,106 12,473 16,984
Total income growth (%) NA NA NA NA NA
Operating expenses 2,049 3,068 4,603 7,484 9,851
Operating profit 1,356 2,973 4,503 4,989 7,133
Operating profit growth (%) 47.1 119.3 51.5 10.8 43.0
Provisions 210 253 770 781 1,326
PBT 1,145 2,720 3,733 4,208 5,808
Tax + adjustments 387 948 1,288 1,452 2,004
PAT 758 1,772 2,445 2,756 3,804
PAT growth (%) 37.7 133.8 38.0 12.7 38.0
FDEPS (Rs/share) 8.8 17.5 20.7 23.2 31.9
DPS (Rs/share) 0.5 0.6 0.7 0.8 1.1
Source: Company, Systematix Institutional Research
Balance Sheet
YE: Mar (Rs mn) FY15 FY16 FY17e FY18e FY19e
Share capital 861 1,012 1,182 1,188 1,194
Reserves & surplus 6,503 10,966 16,726 19,375 23,030
Net worth 7,364 11,978 17,909 20,563 24,225
Deposits - - 200 70,000 120,000
Borrowings 31,218 43,380 52,754 32,228 29,912
Other Liabilities & Prov. 1,180 1,916 2,107 2,318 2,550
Total Liabilities 39,763 57,273 72,970 125,109 176,686
- - - - -
Cash & Bank Bal 6,469 4,929 7,182 10,864 15,809
Investments 1 1 75 21,490 35,400
Advances 32,187 50,644 63,305 88,627 119,646
Fixed & Other Assets 1,106 1,699 2,408 4,129 5,831
Total Assets 39,763 57,273 72,970 125,109 176,686
Deposits growth (%) NA NA NA 34,900.0 71.4
Advances growth (%) 99.0 57.3 25.0 40.0 35.0
Source: Company, Systematix Institutional Research
DuPont
YE: Mar (Rs mn) FY15 FY16 FY17e FY18e FY19e
Net interest income 9.5 10.6 11.7 10.2 9.0
Non-interest inc 1.8 1.8 2.3 2.4 2.3
Fees 1.6 1.6 2.0 2.1 2.1
Total income 11.2 12.5 14.0 12.6 11.3
Employee expenses 4.4 4.1 4.2 4.5 3.9
Other expenses 2.4 2.3 2.8 3.0 2.6
Operating expenses 6.8 6.3 7.1 7.6 6.5
Operating profit 4.5 6.1 6.9 5.0 4.7
Provisions 0.7 0.5 1.2 0.8 0.9
NPA provisions 0.7 0.5 1.2 0.8 0.9
PBT 3.8 5.6 5.7 4.2 3.8
Tax 1.3 2.0 2.0 1.5 1.3
RoA 2.5 3.7 3.8 2.8 2.5
Leverage 5.5 5.0 4.4 5.1 6.7
RoE 13.7 18.3 16.4 14.3 17.0
Source: Company, Systematix Institutional Research
Ratios
YE: Mar FY15 FY16 FY17e FY18e FY19e
NIM (%) 9.8 11.0 12.0 10.6 9.3
Fees / Avg assets (%) 1.6 1.6 2.0 2.1 2.1
Cost-Income (%) 60.2 50.8 50.6 60.0 58.0
Provision coverage (%) 74.5 73.9 73.7 73.7 73.6
Credit-Deposit (%) NA NA NA 126.6 99.7
Investment-Deposit (%) NA NA 37.5 30.7 29.5
Gross NPA (%) 0.1 0.2 0.2 0.2 0.3
Net NPA (%) 0.0 0.0 0.1 0.1 0.1
BV (Rs) 85.5 118.4 151.5 173.0 202.8
Adj BV (Rs) 85.4 118.2 151.2 172.6 201.9
CAR (%) 24.2 24.1 28.5 22.9 20.1
- Tier 1 (%) 21.7 22.4 26.9 22.2 19.6
Dividend Yield (%) 0.1 0.2 0.2 0.2 0.3
RoE (%) 13.7 18.3 16.4 14.3 17.0
RoA (%) 2.5 3.7 3.8 2.8 2.5
Source: Company, Systematix Institutional Research
20 January, 2017
Systematix Research is also available on Bloomberg SSSL <Go>, Thomson & Reuters Systematix Shares & Stocks (I) Ltd.
Ujjivan Financial Services
3
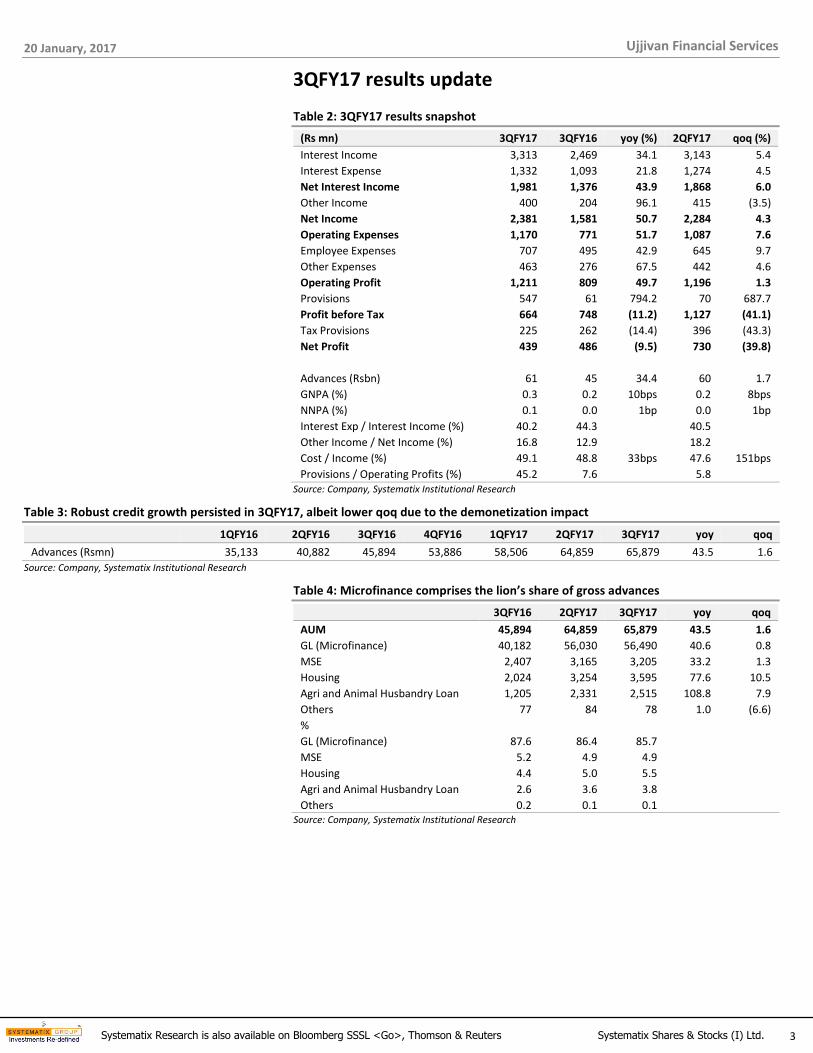
3QFY17 results update
Table 2: 3QFY17 results snapshot
(Rs mn) 3QFY17 3QFY16 yoy (%) 2QFY17 qoq (%)
Interest Income 3,313 2,469 34.1 3,143 5.4
Interest Expense 1,332 1,093 21.8 1,274 4.5
Net Interest Income 1,981 1,376 43.9 1,868 6.0
Other Income 400 204 96.1 415 (3.5)
Net Income 2,381 1,581 50.7 2,284 4.3
Operating Expenses 1,170 771 51.7 1,087 7.6
Employee Expenses 707 495 42.9 645 9.7
Other Expenses 463 276 67.5 442 4.6
Operating Profit 1,211 809 49.7 1,196 1.3
Provisions 547 61 794.2 70 687.7
Profit before Tax 664 748 (11.2) 1,127 (41.1)
Tax Provisions 225 262 (14.4) 396 (43.3)
Net Profit 439 486 (9.5) 730 (39.8)
Advances (Rsbn) 61 45 34.4 60 1.7
GNPA (%) 0.3 0.2 10bps 0.2 8bps
NNPA (%) 0.1 0.0 1bp 0.0 1bp
Interest Exp / Interest Income (%) 40.2 44.3 40.5
Other Income / Net Income (%) 16.8 12.9 18.2
Cost / Income (%) 49.1 48.8 33bps 47.6 151bps
Provisions / Operating Profits (%) 45.2 7.6 5.8 Source: Company, Systematix Institutional Research
Table 3: Robust credit growth persisted in 3QFY17, albeit lower qoq due to the demonetization impact
1QFY16 2QFY16 3QFY16 4QFY16 1QFY17 2QFY17 3QFY17 yoy qoq
Advances (Rsmn) 35,133 40,882 45,894 53,886 58,506 64,859 65,879 43.5 1.6
Source: Company, Systematix Institutional Research
Table 4: Microfinance comprises the lion’s share of gross advances
3QFY16 2QFY17 3QFY17 yoy qoq
AUM 45,894 64,859 65,879 43.5 1.6
GL (Microfinance) 40,182 56,030 56,490 40.6 0.8
MSE 2,407 3,165 3,205 33.2 1.3
Housing 2,024 3,254 3,595 77.6 10.5
Agri and Animal Husbandry Loan 1,205 2,331 2,515 108.8 7.9
Others 77 84 78 1.0 (6.6)
%
GL (Microfinance) 87.6 86.4 85.7
MSE 5.2 4.9 4.9
Housing 4.4 5.0 5.5
Agri and Animal Husbandry Loan 2.6 3.6 3.8
Others 0.2 0.1 0.1 Source: Company, Systematix Institutional Research
20 January, 2017
Systematix Research is also available on Bloomberg SSSL <Go>, Thomson & Reuters Systematix Shares & Stocks (I) Ltd.
Ujjivan Financial Services
4
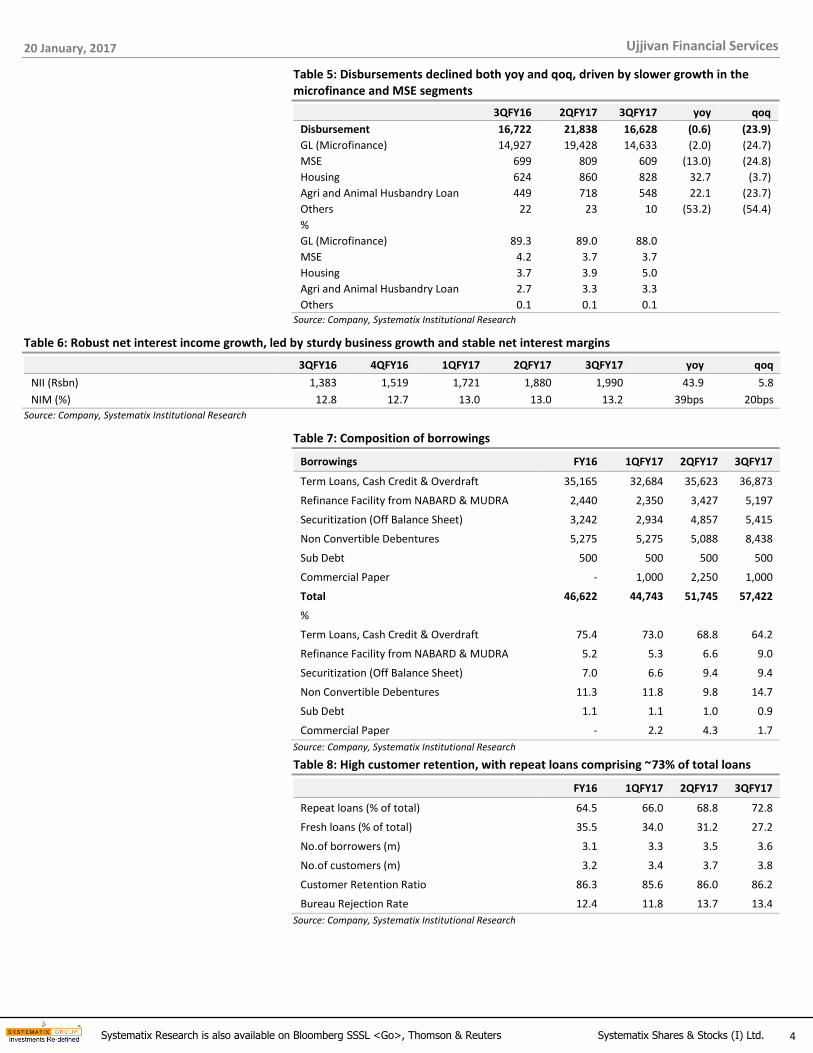
Table 5: Disbursements declined both yoy and qoq, driven by slower growth in the microfinance and MSE segments
3QFY16 2QFY17 3QFY17 yoy qoq
Disbursement 16,722 21,838 16,628 (0.6) (23.9)
GL (Microfinance) 14,927 19,428 14,633 (2.0) (24.7)
MSE 699 809 609 (13.0) (24.8)
Housing 624 860 828 32.7 (3.7)
Agri and Animal Husbandry Loan 449 718 548 22.1 (23.7)
Others 22 23 10 (53.2) (54.4)
%
GL (Microfinance) 89.3 89.0 88.0
MSE 4.2 3.7 3.7
Housing 3.7 3.9 5.0
Agri and Animal Husbandry Loan 2.7 3.3 3.3
Others 0.1 0.1 0.1 Source: Company, Systematix Institutional Research
Table 6: Robust net interest income growth, led by sturdy business growth and stable net interest margins
3QFY16 4QFY16 1QFY17 2QFY17 3QFY17 yoy qoq
NII (Rsbn) 1,383 1,519 1,721 1,880 1,990 43.9 5.8
NIM (%) 12.8 12.7 13.0 13.0 13.2 39bps 20bps
Source: Company, Systematix Institutional Research
Table 7: Composition of borrowings
Borrowings FY16 1QFY17 2QFY17 3QFY17
Term Loans, Cash Credit & Overdraft 35,165 32,684 35,623 36,873
Refinance Facility from NABARD & MUDRA 2,440 2,350 3,427 5,197
Securitization (Off Balance Sheet) 3,242 2,934 4,857 5,415
Non Convertible Debentures 5,275 5,275 5,088 8,438
Sub Debt 500 500 500 500
Commercial Paper - 1,000 2,250 1,000
Total 46,622 44,743 51,745 57,422
%
Term Loans, Cash Credit & Overdraft 75.4 73.0 68.8 64.2
Refinance Facility from NABARD & MUDRA 5.2 5.3 6.6 9.0
Securitization (Off Balance Sheet) 7.0 6.6 9.4 9.4
Non Convertible Debentures 11.3 11.8 9.8 14.7
Sub Debt 1.1 1.1 1.0 0.9
Commercial Paper - 2.2 4.3 1.7
Source: Company, Systematix Institutional Research
Table 8: High customer retention, with repeat loans comprising ~73% of total loans
FY16 1QFY17 2QFY17 3QFY17
Repeat loans (% of total) 64.5 66.0 68.8 72.8
Fresh loans (% of total) 35.5 34.0 31.2 27.2
No.of borrowers (m) 3.1 3.3 3.5 3.6
No.of customers (m) 3.2 3.4 3.7 3.8
Customer Retention Ratio 86.3 85.6 86.0 86.2
Bureau Rejection Rate 12.4 11.8 13.7 13.4
Source: Company, Systematix Institutional Research
20 January, 2017
Systematix Research is also available on Bloomberg SSSL <Go>, Thomson & Reuters Systematix Shares & Stocks (I) Ltd.
Ujjivan Financial Services
5
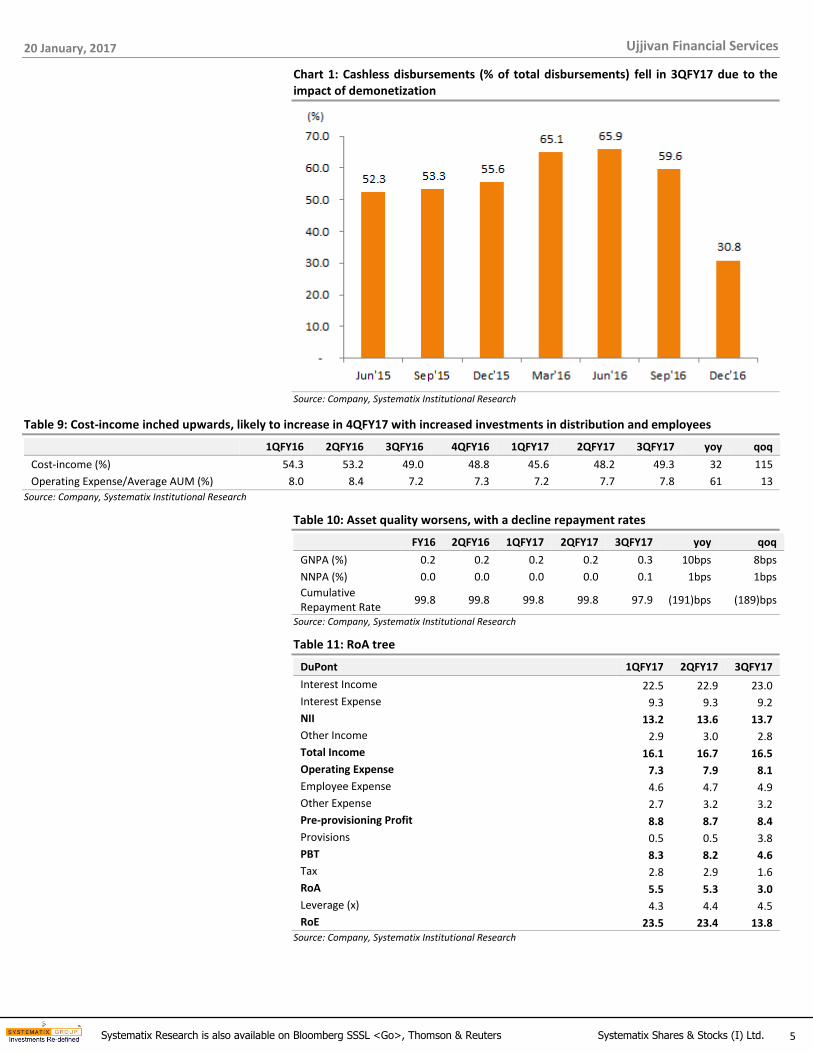
Chart 1: Cashless disbursements (% of total disbursements) fell in 3QFY17 due to the impact of demonetization
Source: Company, Systematix Institutional Research
Table 9: Cost-income inched upwards, likely to increase in 4QFY17 with increased investments in distribution and employees
1QFY16 2QFY16 3QFY16 4QFY16 1QFY17 2QFY17 3QFY17 yoy qoq
Cost-income (%) 54.3 53.2 49.0 48.8 45.6 48.2 49.3 32 115
Operating Expense/Average AUM (%) 8.0 8.4 7.2 7.3 7.2 7.7 7.8 61 13
Source: Company, Systematix Institutional Research
Table 10: Asset quality worsens, with a decline repayment rates
FY16 2QFY16 1QFY17 2QFY17 3QFY17 yoy qoq
GNPA (%) 0.2 0.2 0.2 0.2 0.3 10bps 8bps
NNPA (%) 0.0 0.0 0.0 0.0 0.1 1bps 1bps
Cumulative Repayment Rate
99.8 99.8 99.8 99.8 97.9 (191)bps (189)bps
Source: Company, Systematix Institutional Research
Table 11: RoA tree
DuPont 1QFY17 2QFY17 3QFY17
Interest Income 22.5 22.9 23.0
Interest Expense 9.3 9.3 9.2
NII 13.2 13.6 13.7
Other Income 2.9 3.0 2.8
Total Income 16.1 16.7 16.5
Operating Expense 7.3 7.9 8.1
Employee Expense 4.6 4.7 4.9
Other Expense 2.7 3.2 3.2
Pre-provisioning Profit 8.8 8.7 8.4
Provisions 0.5 0.5 3.8
PBT 8.3 8.2 4.6
Tax 2.8 2.9 1.6
RoA 5.5 5.3 3.0
Leverage (x) 4.3 4.4 4.5
RoE 23.5 23.4 13.8 Source: Company, Systematix Institutional Research
20 January, 2017
Systematix Research is also available on Bloomberg SSSL <Go>, Thomson & Reuters Systematix Shares & Stocks (I) Ltd.
Ujjivan Financial Services
6
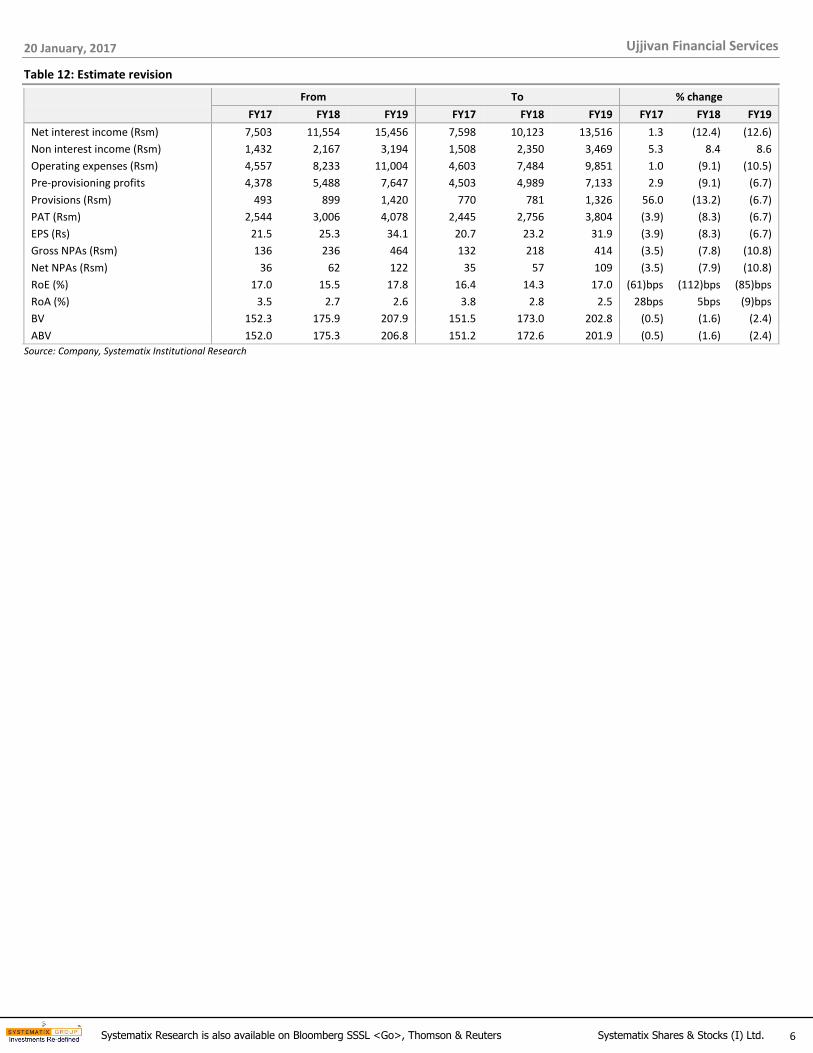
Table 12: Estimate revision
From To % change
FY17 FY18 FY19 FY17 FY18 FY19 FY17 FY18 FY19
Net interest income (Rsm) 7,503 11,554 15,456 7,598 10,123 13,516 1.3 (12.4) (12.6)
Non interest income (Rsm) 1,432 2,167 3,194 1,508 2,350 3,469 5.3 8.4 8.6
Operating expenses (Rsm) 4,557 8,233 11,004 4,603 7,484 9,851 1.0 (9.1) (10.5)
Pre-provisioning profits 4,378 5,488 7,647 4,503 4,989 7,133 2.9 (9.1) (6.7)
Provisions (Rsm) 493 899 1,420 770 781 1,326 56.0 (13.2) (6.7)
PAT (Rsm) 2,544 3,006 4,078 2,445 2,756 3,804 (3.9) (8.3) (6.7)
EPS (Rs) 21.5 25.3 34.1 20.7 23.2 31.9 (3.9) (8.3) (6.7)
Gross NPAs (Rsm) 136 236 464 132 218 414 (3.5) (7.8) (10.8)
Net NPAs (Rsm) 36 62 122 35 57 109 (3.5) (7.9) (10.8)
RoE (%) 17.0 15.5 17.8 16.4 14.3 17.0 (61)bps (112)bps (85)bps
RoA (%) 3.5 2.7 2.6 3.8 2.8 2.5 28bps 5bps (9)bps
BV 152.3 175.9 207.9 151.5 173.0 202.8 (0.5) (1.6) (2.4)
ABV 152.0 175.3 206.8 151.2 172.6 201.9 (0.5) (1.6) (2.4)
Source: Company, Systematix Institutional Research

20 January, 2017
Systematix Research is also available on Bloomberg SSSL <Go>, Thomson & Reuters Systematix Shares & Stocks (I) Ltd.
Ujjivan Financial Services
7
Charting the story
Chart 2: Credit growth (on balance sheet) has been healthy Chart 3: AUM growth has been faster than overall credit growth
Source: Company, Systematix Institutional Research Source: Company, Systematix Institutional Research
Chart 4: Robust disbursements growth over FY15-16 Chart 5: On-balance sheet assets comprise a large share of AUM
Source: Company, Systematix Institutional Research Source: Company, Systematix Institutional Research
Chart 6: Robust net interest income growth over FY14-16 Chart 7: Elevated NIM due to types of lending segments
Source: Company, Systematix Institutional Research Source: Company, Systematix Institutional Research
20 January, 2017
Systematix Research is also available on Bloomberg SSSL <Go>, Thomson & Reuters Systematix Shares & Stocks (I) Ltd.
Ujjivan Financial Services
8
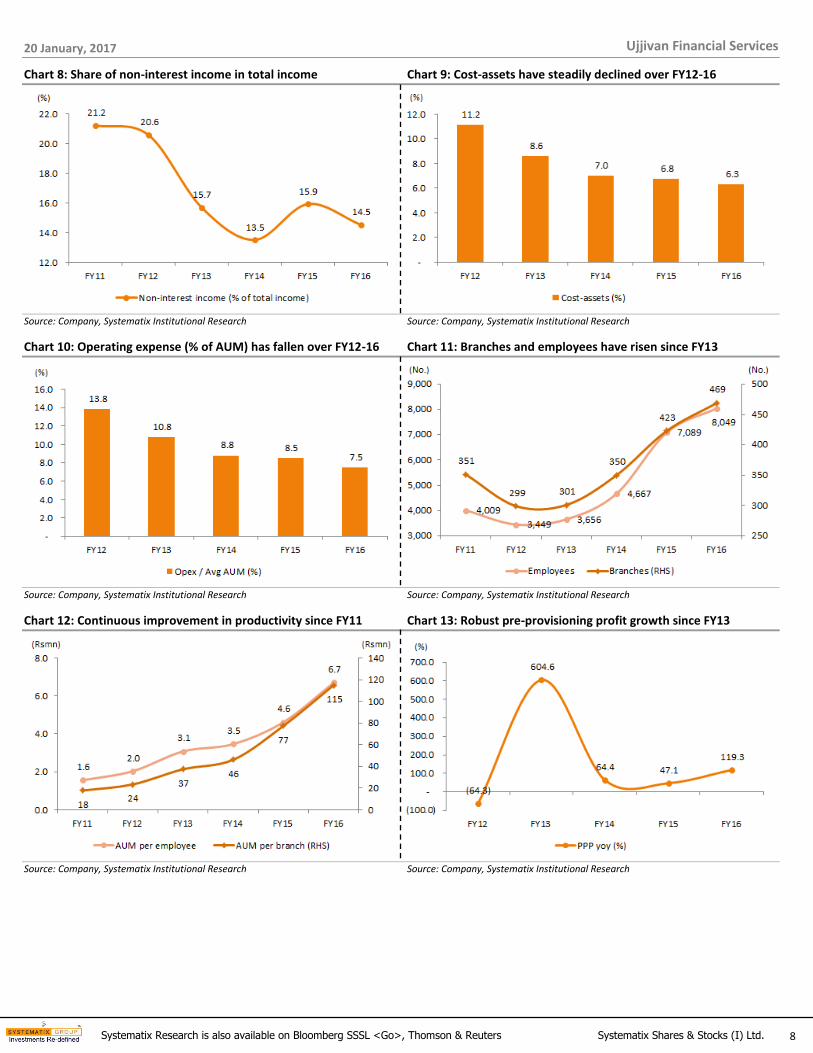
Chart 8: Share of non-interest income in total income Chart 9: Cost-assets have steadily declined over FY12-16
Source: Company, Systematix Institutional Research Source: Company, Systematix Institutional Research
Chart 10: Operating expense (% of AUM) has fallen over FY12-16 Chart 11: Branches and employees have risen since FY13
Source: Company, Systematix Institutional Research Source: Company, Systematix Institutional Research
Chart 12: Continuous improvement in productivity since FY11 Chart 13: Robust pre-provisioning profit growth since FY13
Source: Company, Systematix Institutional Research Source: Company, Systematix Institutional Research
20 January, 2017
Systematix Research is also available on Bloomberg SSSL <Go>, Thomson & Reuters Systematix Shares & Stocks (I) Ltd.
Ujjivan Financial Services
9
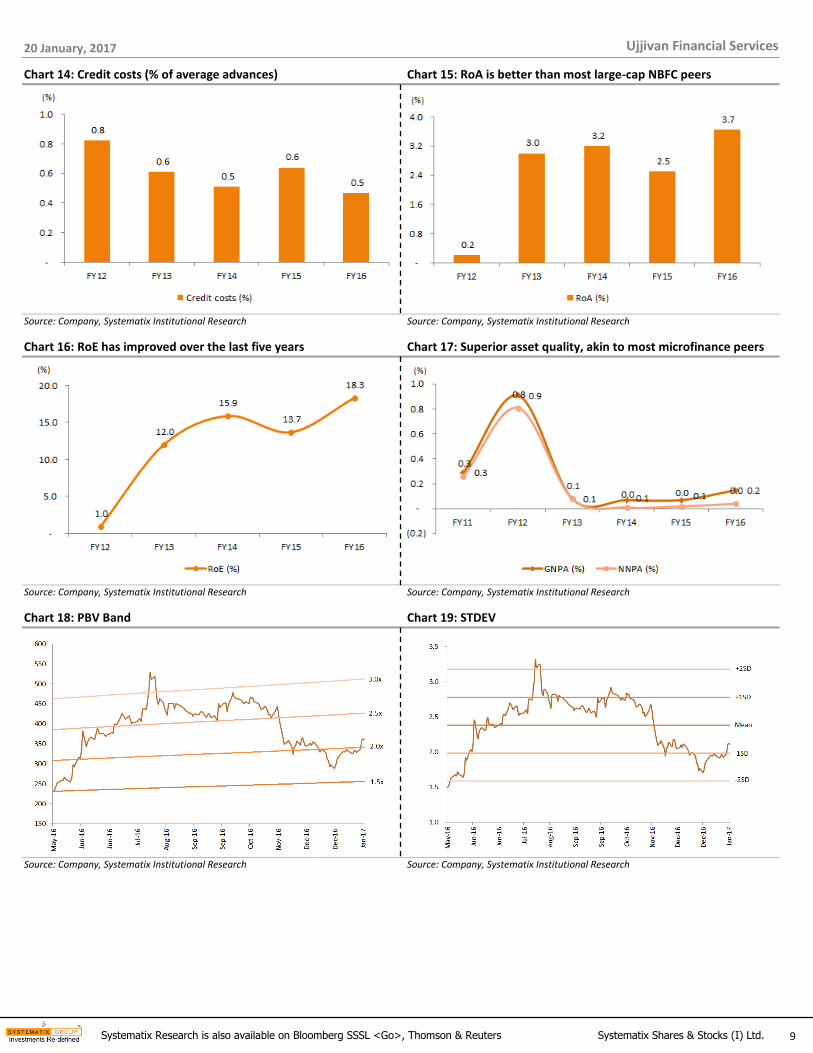
Chart 14: Credit costs (% of average advances) Chart 15: RoA is better than most large-cap NBFC peers
Source: Company, Systematix Institutional Research Source: Company, Systematix Institutional Research
Chart 16: RoE has improved over the last five years Chart 17: Superior asset quality, akin to most microfinance peers
Source: Company, Systematix Institutional Research Source: Company, Systematix Institutional Research
Chart 18: PBV Band Chart 19: STDEV
Source: Company, Systematix Institutional Research Source: Company, Systematix Institutional Research
20 January, 2017
Systematix Research is also available on Bloomberg SSSL <Go>, Thomson & Reuters Systematix Shares & Stocks (I) Ltd.
Ujjivan Financial Services
10
Nikhil Khandelwal Managing Director +91-22-6704 8001 [email protected]
Equity Research
Analysts Industry Sectors Desk-Phone E-mail
Jaspreet Singh Arora - Head of Research Cement, Building Material, Construction +91-22-6704 8062 [email protected]
Rahul Jain IT, E-commerce +91-22-6704 8025 [email protected]
Priya Ranjan Auto & Auto Ancs +91-22-6704 8067 [email protected]
Clyton Fernandes BFSI +91-22-6704 8066 [email protected]
Himanshu Nayyar Consumer, Agri, Logistics +91-22-6704 8064 [email protected]
T. Ranvir Singh Pharma, Healthcare, Agrochem +91-22-6704 8016 [email protected]
Ankit Gor Mid Caps +91-22-6704 8028 [email protected]
Divyata Dalal Construction, Infra +91-22-6704 8059 [email protected]
Gurpreet Kaur Cement, Building Material +91-22-6704 8049 [email protected]
Suneeta Kamath Auto & Auto Ancs +91-22-6704 8068 [email protected]
Rahul Khandelwal Mid Caps +91-22-6704 8003 [email protected]
Naushad Chaudhary Mid Caps +91-22-6704 8036 [email protected]
Birendrakumar Singh Technical Research +91-22-6704 8024 [email protected]
Equity Sales & Trading
Name Desk-Phone E-mail
Pankaj Karde Head - Institutional Sales & Sales Trading +91-22-6704 8061 [email protected]
Dinesh Bajaj Sales +91-22-6704 8065 [email protected]
Jigar Kamdar Sales +91-22-6704 8060 [email protected]
Venkat Ramesh Babu Sales +91-22-6704 8064 [email protected]
Bhavik Shah Sales Trading +91-22-6704 8053 [email protected]
Vinod Bhuwad Sales Trading +91-22-6704 8051 [email protected]
Nitin Hanspal Institutional Derivatives +91-22-6704 8097 [email protected]
Amit Sawant Dealer +91-22-6704 8054 [email protected]
Paras Shah Dealer +91-22-6704 8047 [email protected]
Sachin Malusare Sr. Manager +91-22-6704 8055 [email protected]
Sugandha Rane Assistant Manager +91-22-6704 8056 [email protected]
Corporate Access
Shaheen Chamadia Manager +91-22-6704 8091 [email protected]
Production
Ramesh Nair Editor +91-22-6704 8071 [email protected]
Mrunali Pagdhare Production +91-22-6704 8057 [email protected]
Institutional Equities Team
20 January, 2017
Systematix Research is also available on Bloomberg SSSL <Go>, Thomson & Reuters Systematix Shares & Stocks (I) Ltd.
Ujjivan Financial Services
11
DISCLOSURES/ APPENDIX
I. ANALYST CERTIFICATION
I, Clyton Fernandes, hereby certify (1) that the views expressed in this research report accurately reflect my personal views about any or all of the subject securities or issuers referred to in this research report, (2) No part of my compensation was, is, or will be directly or indirectly related to the specific recommendations or views expressed in this research report by Systematix Shares & Stocks (I) Limited or its Group/associates companies. (3) has taken reasonable care to achieve and maintain independence and objectivity in making any recommendations.
Disclosure of Interest Statement Update
Analyst holding in the stock No
Served as an officer, director or employee No
II. ISSUER SPECIFIC REGULATORY DISCLOSURES, Unless specifically mentioned in Point No. 9 below:
1. The Research Analyst(s), Systematix Shares & Stocks(I) Limited (SSSIL), Associate of Analyst or his relative does not have any financial interest in the company(ies) covered in this report.
2. The Research Analyst, SSSIL or its associates or relatives of the Research Analyst affiliates collectively do not hold more than 1% of the securities of the company (ies) covered in this report as of the end of the month immediately preceding the distribution of the research report.
3. The Research Analyst, his associate, his relative and SSSIL do not have any other material conflict of interest at the time of publication of this research report.
4. The Research Analyst, SSSIL and its associates have not received compensation for investment banking or merchant banking or brokerage services or for any other products or services from the company(ies) covered in this report, in the past twelve months.
5. The Research Analyst, SSSIL or its associates have not managed or co-managed in the previous twelve months, a private or public offering of securities for the company (ies) covered in this report.
6. SSSIL or its associates have not received compensation or other benefits from the company(ies) covered in this report or from any third party, in connection with the research report.
7. The Research Analyst has not served as an Officer, Director or employee of the company (ies) covered in the Research report.
8. The Research Analyst and SSSIL has not been engaged in market making activity for the company(ies) covered in the Research report.
9. Details SSSIL, Research Analyst and its associates pertaining to the companies covered in the Research report:
Sr. No.
Particulars Yes / No.
1 Whether compensation has been received from the company(ies) covered in the Research report in the past 12 months for investment banking transaction by SSSIL
No
2 Whether Research Analyst, SSSIL or its associates or relatives of the Research Analyst affiliates collectively hold more than 1% of the company(ies) covered in the Research report
No
3 Whether compensation has been received by SSSIL or its associates from the company(ies) covered in the Research report No
4
SSSIL or its affiliates have managed or co-managed in the previous twelve months a private or public offering of securities for the company(ies) covered in the Research report No
5 Research Analyst, his associate, SSSIL or its associates have received compensation for investment banking or merchant banking or brokerage services or for any other products or services from the company(ies) covered in the Research report, in the last twelve month
No
10. There are no material disciplinary action that been taken by any regulatory authority impacting equity research analysis activities.
STOCK RATINGS
BUY (B): The stock's total return is expected to exceed 20% over the next 12 months. ACCUMULATE (A): The stock's total return is expected to be within 10-20% over the next 12 months. HOLD (H): The stock's total return is expected to be within 0-10% over the next 12 months. SELL (S): The stock's total return is expected to give negative returns over the next 12 months. NOT RATED (NR): The analyst has no recommendation on the stock under review.
INDUSTRY VIEWS
ATTRACTIVE (AT): Fundamentals/Valuations of the sector are expected to be attractive over the next 12-18 months. NEUTRAL (NL): Fundamentals/Valuations of the sector are expected to neither improve nor deteriorate over the next 12-18 months. CAUTIOUS (CS): Fundamentals/Valuations of the sector are expected to deteriorate over the next 12-18 months.
III. DISCLAIMER
The information and opinions contained herein have been compiled or arrived at, based upon information obtained in good faith from sources believed to be reliable. Such information has not been independently verified and no guaranty, representation of warranty, express or implied, is made as to its accuracy completeness or correctness.
This document is for information purposes only. This report is based on information that we consider reliable, but we do not represent that it is accurate or complete, and one should exercise due caution while acting on it. Descriptions of any company or companies or their securities mentioned herein are not complete and this document is not, and should not be construed as an offer or solicitation of an offer to buy or sell any securities or other financial instruments. Past performance is not a guide for future performance, future returns are not guaranteed and a loss of original capital may occur. All opinions, projections and estimates constitute the judgment of the author as on the date of the report and these, plus any other information contained in the report, are subject to change without notice. Prices and availability of financial instruments also are subject to change without notice. This report is intended for distribution to institutional investors.
20 January, 2017
Systematix Research is also available on Bloomberg SSSL <Go>, Thomson & Reuters Systematix Shares & Stocks (I) Ltd.
Ujjivan Financial Services
12
This report is not directed to or intended for display, downloading, printing, reproducing or for distribution to or use by, any person or entity that is a citizen or resident or located in any locality, state, country or other jurisdiction where such distribution, publication, reproduction, availability or use would be contrary to law or regulation or what would subject to SSSIL or its affiliates to any registration or licensing requirement within such jurisdiction. If this report is inadvertently send or has reached any individual in such country, especially, USA, the same may be ignored and brought to the attention of the sender. Neither this document nor any copy of it may be taken or transmitted into the United State (to U.S.Persons), Canada, or Japan or distributed, directly or indirectly, in the United States or Canada or distributed or redistributed in Japan or to any resident thereof. Any unauthorized use, duplication, redistribution or disclosure of this report including, but not limited to, redistribution by electronic mail, posting of the report on a website or page, and/or providing to a third party a link, is prohibited by law and will result in prosecution. The information contained in the Report is intended solely for the recipient and may not be further distributed by the recipient to any third party.
SSSIL generally prohibits its analysts, persons reporting to analysts, and members of their households from maintaining a financial interest in the securities or derivatives of any companies that the analysts cover. Additionally, SSSIL generally prohibits its analysts and persons reporting to analysts from serving as an officer, director, or advisory board member of any companies that the analysts cover. Our salespeople, traders, and other professionals or affiliates may provide oral or written market commentary or trading strategies to our clients that reflect opinions that are contrary to the opinions expressed herein. Our proprietary trading and investing businesses may make investment decisions that are inconsistent with the recommendations expressed herein. The views expressed in this research report reflect the personal views of the analyst(s) about the subject securities or issues, and no part of the compensation of the research analyst(s) was, is, or will be directly or indirectly related to the specific recommendations and views expressed by research analyst(s) in this report. The compensation of the analyst who prepared this document is determined exclusively by SSSIL however, compensation may relate to the revenues of the Systematix Group as a whole, of which investment banking, sales and trading are a part. Research analysts and sales persons of SSSIL may provide important inputs to its affiliated company(ies).
Foreign currencies denominated securities, wherever mentioned, are subject to exchange rate fluctuations, which could have an adverse effect on their value or price, or the income derived from them. In addition, investors in securities such as ADRs, the values of which are influenced by foreign currencies effectively assume currency risk. SSSIL, its directors, analysts or employees do not take any responsibility, financial or otherwise, of the losses or the damages sustained due to the investments made or any action taken on basis of this report including but not restricted to fluctuation in the prices of shares and bonds, changes in the currency rates, diminution in the NAVs, reduction in the dividend or income, etc
SSSIL and its affiliates, officers, directors, and employees subject to the information given in the disclosures may: (a) from time to time, have long or short positions in, and buy or sell the securities thereof, of company (ies) mentioned herein or (b) be engaged in any other transaction involving such securities and earn brokerage or other compensation (financial interest) or act as a market maker in the financial instruments of the company (ies) discussed herein or act as advisor or lender / borrower to such company (ies) or have other potential material conflict of interest with respect to any recommendation and related information and opinions. The views expressed are those of the analyst and the Company may or may not subscribe to the views expressed therein.
SSSIL, its affiliates and any third party involved in, or related to, computing or compiling the information hereby expressly disclaim all warranties of originality, accuracy, completeness, merchantability or fitness for a particular purpose with respect to any of this information. Without limiting any of the foregoing, in no event shall SSSIL, any of its affiliates or any third party involved in, or related to, computing or compiling the information have any liability for any damages of any kind. The Company accepts no liability whatsoever for the actions of third parties. The Report may provide the addresses of, or contain hyperlinks to, websites. Except to the extent to which the Report refers to website material of the Company, the Company has not reviewed the linked site. Accessing such website or following such link through the report or the website of the Company shall be at your own risk and the Company shall have no liability arising out of, or in connection with, any such referenced website
SSSIL shall not be liable for any delay or any other interruption which may occur in presenting the data due to any technical glitch to present the data. In no event shall the SSSIL be liable for any damages, including without limitation, direct or indirect, special, incidental, or consequential damages, losses or expenses arising in connection with the data presented by SSSIL through this presentation.
Neither SSSIL, nor any of its other group companies or associates, shall be responsible for any decisions taken on the basis of this report. Investors are advised to consult their Investment and Tax consultants before taking any investment decisions based on this report.
Systematix Shares & Stocks (I) Ltd. CIN : U65993MH1995PLC268414 BSE SEBI Reg. No.: INB/F011132736 (Member Code: 182) | NSE SEBI Reg. No.: INB/F/E231132730 (Member Code: 11327) | MCX-SX SEBI Reg. No.: INB/F261132733 (Member Code: 17560) | Depository Participant: IN-DP-CDSL-246-2004 (DP Id: 34600) | PMS : INP000002692 | AMFI : ARN - 64917|Research Analyst : INH200000840 Regd. office address: 2nd floor, J. K. Somani Bldg, British Hotel Lane, Fort, Mumbai - 400001 Corporate office address: A 603-606 , The Capital, BKC, Bandra (E), Mumbai, India - 400051