Designing affinity ligands for downstream process intensification
Upload
nishit1990Category
view
218download
0
8/6/2019 02 Downstream Process
http://slidepdf.com/reader/full/02-downstream-process 1/29
1 /GE /
Downstream Processing
Product source and its impact
Setting project goalsDevelopment of a process
The three stages in downstreamprocessingPurification strategy
Applications

8/6/2019 02 Downstream Process
http://slidepdf.com/reader/full/02-downstream-process 2/29
2 /GE /
Product source and its impact
Product concentrationExtraction/solubilisation problems
Type and quantity of impuritiesProduct stability
Validation requirements
The source of the product influences:

8/6/2019 02 Downstream Process
http://slidepdf.com/reader/full/02-downstream-process 3/29
3 /GE /
Setting Project Goals
Regulatory requirements
Intended use of the productPhase of development
Scale of manufactureEconomics
FacilityContract manufacturing

8/6/2019 02 Downstream Process
http://slidepdf.com/reader/full/02-downstream-process 4/29
4 /GE /
Development of a processBIOREACTORBIOREACTOR
Cell SeparationCell Separation Cell DisruptionCell Disruption
CaptureCapture
IntermediatePurification
IntermediatePurification
PolishingPolishing
Chromatography Stages
— — — — — — — — — — — — — — — — — — — — — — — — — — — — — — —
D o w n s t r e m p r o c e s s i n g
Product Recovery
and Concentration
Product Recovery
and Concentration
Column-BasedSeparation
Column-BasedSeparation
Other SeparationOperation
Other SeparationOperation
Purified Bulk DrugSubstance
Purified Bulk DrugSubstance
Cell DebrisCell DebrisRemovalRemoval
Clarified CultureClarified CultureMediumMedium
8/6/2019 02 Downstream Process
http://slidepdf.com/reader/full/02-downstream-process 5/29
5 /GE /
The three stages in downstream
processing
Step
Purity
• further removal of most proteins• further removal of most nucleic acids• further removal of endotoxins
• further removal of viruses• initial purification• stabilization• clarification• concentration
• achieve final purity and safety• additional safety measure
P o l i s h i
n g
C a p t u r e
I n t e r m e d i
a t e
P u r i f i
c a t i o n
8/6/2019 02 Downstream Process
http://slidepdf.com/reader/full/02-downstream-process 6/29
6 /GE /
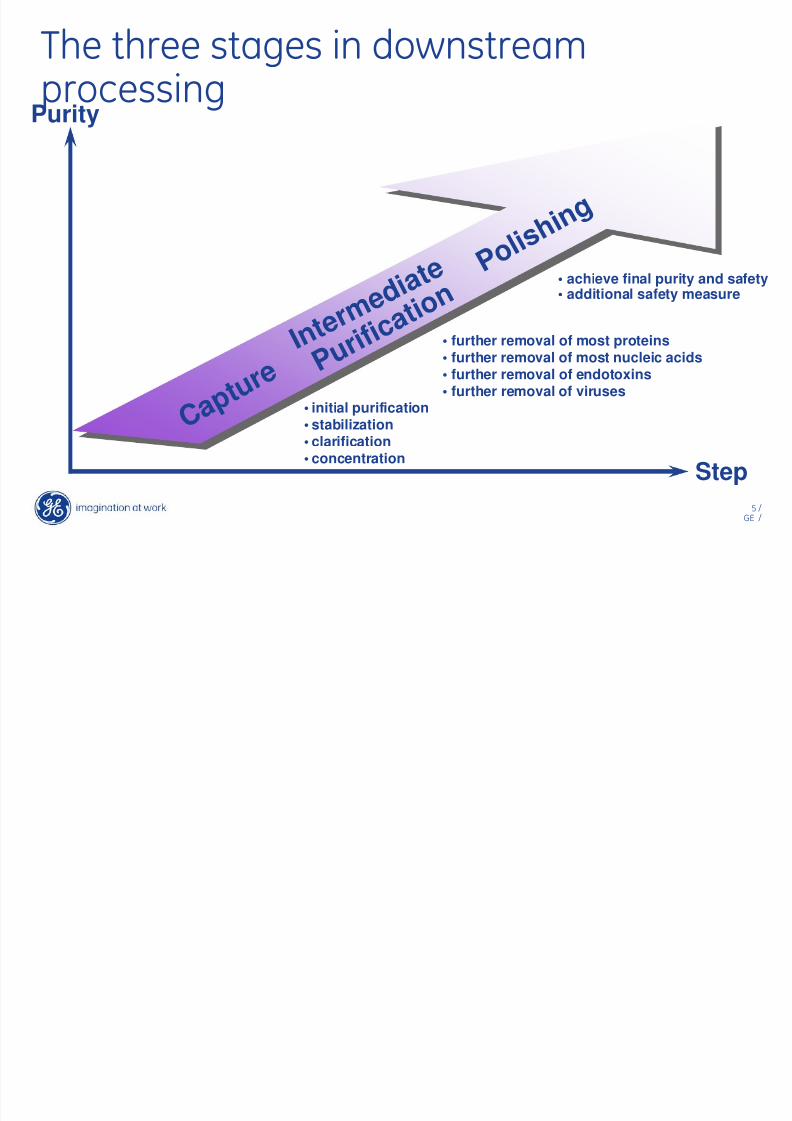
Purification Strategy
RecoveryRecovery
ResolutionResolution
SpeedSpeed LoadabilityLoadability
The optimal process must
be defined within thecontext of competinggoals.

8/6/2019 02 Downstream Process
http://slidepdf.com/reader/full/02-downstream-process 7/29

8/6/2019 02 Downstream Process
http://slidepdf.com/reader/full/02-downstream-process 8/29
8 /GE /
Intermediate PurificationRemoval of same-class impuritiesRemoval of "regulatory" impurities
Recovery
ResolutionResolution
SpeedLoadabilityLoadability

8/6/2019 02 Downstream Process
http://slidepdf.com/reader/full/02-downstream-process 9/29
9 /GE /
PolishingFinal removal of trace contaminants, e.g.structural variants of the target proteinAdjustment for storageSafety issues
Recovery
SpeedLoadability
ResolutionResolution

8/6/2019 02 Downstream Process
http://slidepdf.com/reader/full/02-downstream-process 10/29
10 /GE /
Three Phase Strategy -Ranking of ChromatographyTechniques
Considerations
Limited sample volumeLimited flow rate range
Protein ligands aresensitive to harshcleaning conditions
Use of organic solvents,loss of biological activity
Technique Capture Intermediate Polishing
GF
IEX
HIC
AC
RPC

8/6/2019 02 Downstream Process
http://slidepdf.com/reader/full/02-downstream-process 11/29
11 /GE /
Process purification of a recombinant
bacterial exotoxin
IntermediatePurification
E. coli lysateE. coli lysate
STREAMLINE™ DEAESTREAMLINE™ DEAE
Phenyl Sepharose ™ 6 Fast Flow (high sub)Phenyl Sepharose ™ 6 Fast Flow (high sub)
SOURCE™ 30QSOURCE™ 30Q
SOURCE™ 15PHESOURCE™ 15PHE
Capture
Polishing
Unclarified
8/6/2019 02 Downstream Process
http://slidepdf.com/reader/full/02-downstream-process 12/29
12 /GE /
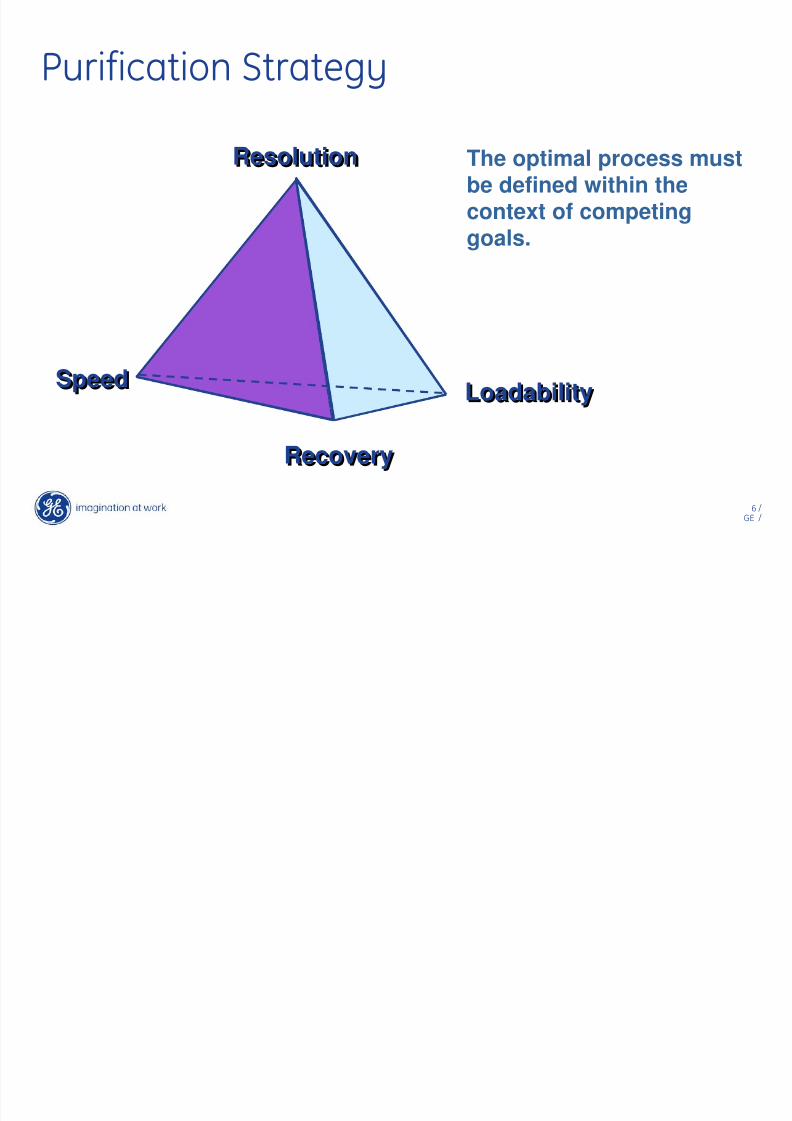
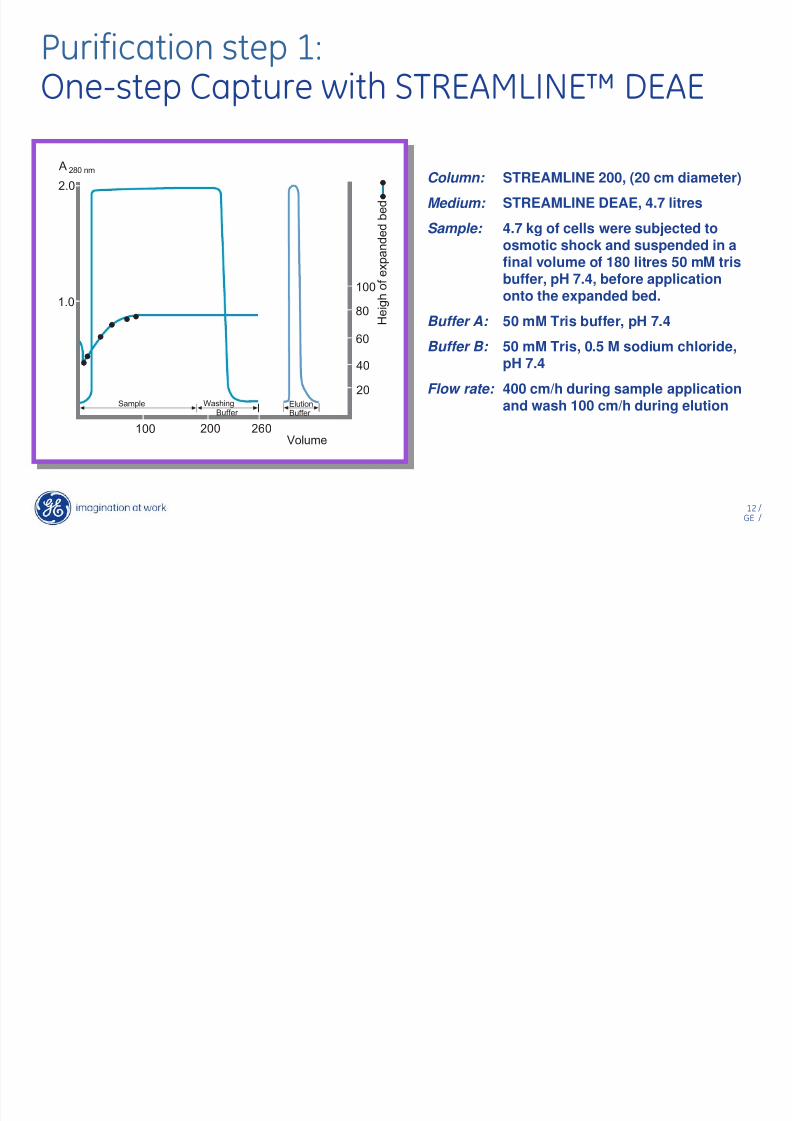
Purification step 1:
One-step Capture with STREAMLINE™ DEAEColumn: STREAMLINE 200, (20 cm diameter)
Medium: STREAMLINE DEAE, 4.7 litres
Sample: 4.7 kg of cells were subjected toosmotic shock and suspended in afinal volume of 180 litres 50 mM trisbuffer, pH 7.4, before applicationonto the expanded bed.
Buffer A: 50 mM Tris buffer, pH 7.4
Buffer B: 50 mM Tris, 0.5 M sodium chloride,pH 7.4
Flow rate: 400 cm/h during sample applicationand wash 100 cm/h during elution
100 200 260Volume
2.0
1.0
A 280 nm
20
40
60
80
100
H e
i g h o
f e x p a n
d e
d b e
d
Sample ElutionBuffer Buffer
Washing
8/6/2019 02 Downstream Process
http://slidepdf.com/reader/full/02-downstream-process 13/29
13 /GE /
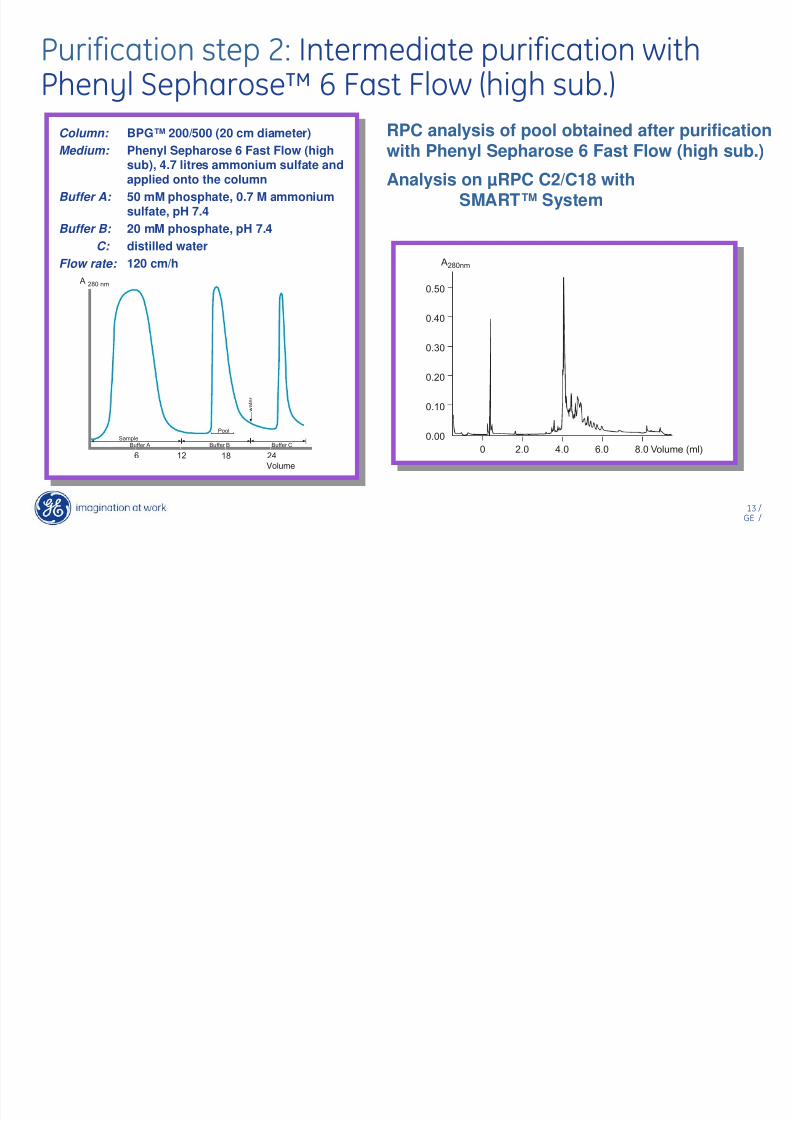
Purification step 2: Intermediate purification with
Phenyl Sepharose™ 6 Fast Flow (high sub.)RPC analysis of pool obtained after purificationwith Phenyl Sepharose 6 Fast Flow (high sub.)
Analysis on µRPC C2/C18 withSMART™ System
Column: BPG™ 200/500 (20 cm diameter)Medium: Phenyl Sepharose 6 Fast Flow (high
sub), 4.7 litres ammonium sulfate andapplied onto the column
Buffer A: 50 mM phosphate, 0.7 M ammoniumsulfate, pH 7.4
Buffer B: 20 mM phosphate, pH 7.4C: distilled water
Flow rate: 120 cm/h
6 12Volume
A 280 nm
SampleBuffer A Buffer B
18 24Buffer C
w a
t e r
Pool
A280nm
0.50
0.40
0.30
0.20
0.10
0.000 2.0 4.0 6.0 8.0 Volume (ml)
S30 E 100
8/6/2019 02 Downstream Process
http://slidepdf.com/reader/full/02-downstream-process 14/29
14 /GE /
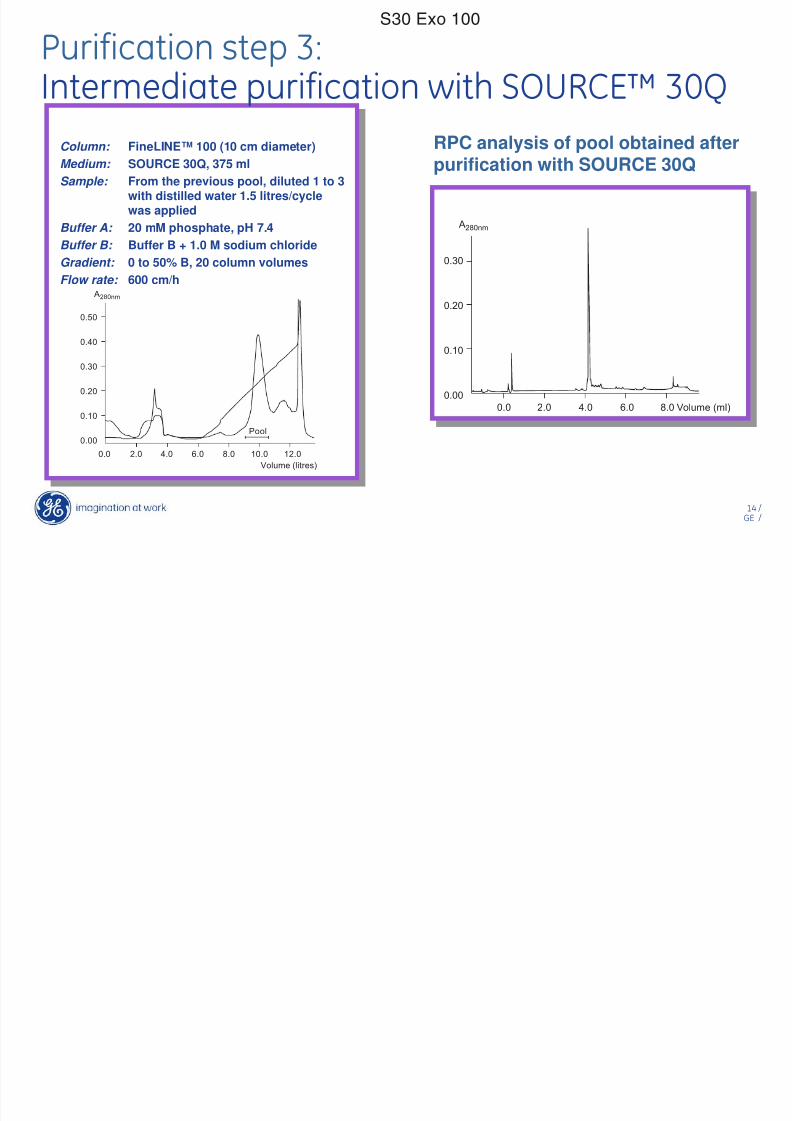
Purification step 3:
Intermediate purification with SOURCE™ 30QRPC analysis of pool obtained afterpurification with SOURCE 30Q
Column: FineLINE™ 100 (10 cm diameter)Medium: SOURCE 30Q, 375 mlSample: From the previous pool, diluted 1 to 3
with distilled water 1.5 litres/cyclewas appliedBuffer A: 20 mM phosphate, pH 7.4Buffer B: Buffer B + 1.0 M sodium chlorideGradient: 0 to 50% B, 20 column volumesFlow rate: 600 cm/h
S30 Exo 100
A 280nm
0.50
0.40
0.30
0.20
0.10
0.00
0.0 2.0 4.0 6.0 8.0 10.0 12.0Volume (litres)
Pool
A280nm
0.30
0.20
0.10
0.000.0 2.0 4.0 6.0 8.0 Volume (ml)

8/6/2019 02 Downstream Process
http://slidepdf.com/reader/full/02-downstream-process 15/29
15 /GE /
Purification step 4:
Polishing with SOURCE™ 15PHEColumn: 35 MM I.D. X 100 MMMedium: SOURCE 15PHESample: from the previous step, adjusted to
1.0 M ammonium sulfate,0.5 litres/cycle was appliedBuffer A: 1.0 M ammonium sulfate, 50 mM
phosphate, pH 7.4Buffer B: 50 mM phosphateGradient: 0 to 45% B, 15 column volumes
Flow rate: 200 cm/h
RPC analysis of pool obtained
A 280nm
0.15
0.10
0.05
0.000 20 40 60 Time (min)
Pool
Volume (ml)
A280nm
0.40
0.30
0.20
0.10
0.00
0.0 2.0 4.0 6.0 8.0

8/6/2019 02 Downstream Process
http://slidepdf.com/reader/full/02-downstream-process 16/29
16 /GE /
Conclusions• The use of novel techniques and chromatography media for Capture,
Intermediate Purification and Polishing enabled the production of a highlypurified exotoxin A from crude cell homogenate using only fourchromatographic steps.
• The use of STREAMLINE™ for removal of cell debris and particulatematter and Capture of target protein eliminated the need for traditional
clarification procedures such as high speed centrifugation followed bymicrofiltration. It not only eliminated the clarification step, but alsoproduced a concentrated and partly purified product, ready forIntermediate Purification.
• The power of combining established techniques such as HIC and IEX withmodern high performance media allows the use of high flow rates, facilitatesprocess development and shortens process time.

8/6/2019 02 Downstream Process
http://slidepdf.com/reader/full/02-downstream-process 17/29
17 /GE /
Our main Downstream application areas
Recombinant proteins & peptidesMAbsBiologicals from natural sourcesSynthetic oligonucleotides & peptidesPlasmids

8/6/2019 02 Downstream Process
http://slidepdf.com/reader/full/02-downstream-process 18/29
18 /GE /
Purification of recombinant α -amylase
from E. coli
A280 Cond
0 5.0 Volume (l)10.0 15.0 20.0
Column: INdEX™ 70 (70 mm i.d.)Adsorbent: Q Sepharose™ XL, 385 mL bed volumneSample: Recombinant α -amylase produced in E. coli ,
homogenized, 2.2 L diluted in distilled water to15.4 L, 7.2 mS/cm, 10 mM CaCl 2, centrifuged
Buffer A: 20 mM Tris-HCl, pH 8, 10 mM CaCl 2
Buffer B: 20 mM Tris-HCl, pH 8, 1 M NaCl, 10 mM CaCl 2Flow rate: 300 cm/h, 12 L/hGradient: 20 bed volumes 0-1 M NaClEluate: 1.48 L, 3.8 bed volumesSpec. act.α -amylase 6420 U/L
1 2 3 4 5 6 7
Lane 1: -Lane 2: LMW markersLane 3: Starting materialLane 4: Flow throughLane 5: 1st peak(containingα -amylase)Lane 6: 2nd peakLane 7: LMW markers
l f h f f h d
8/6/2019 02 Downstream Process
http://slidepdf.com/reader/full/02-downstream-process 19/29
19 /GE /
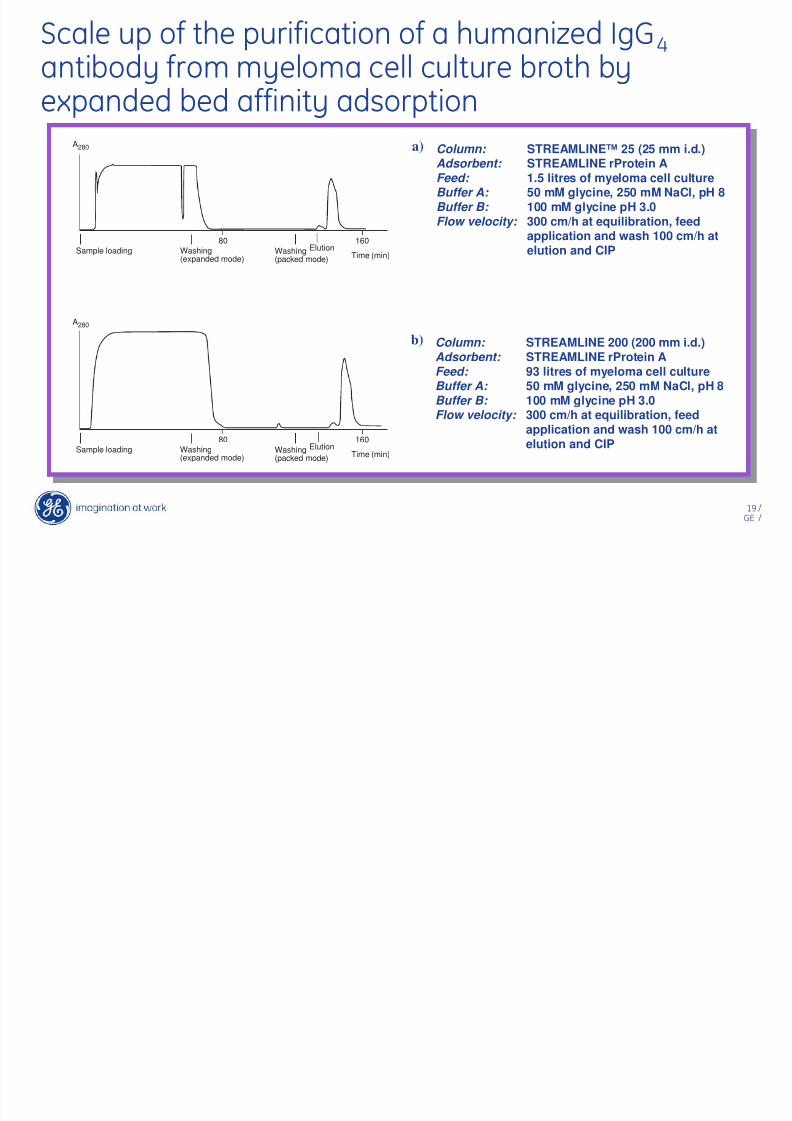
Scale up of the purification of a humanized IgG 4antibody from myeloma cell culture broth byexpanded bed affinity adsorption
A280
80 160Washing(packed mode)
Washing(expanded mode) Time (min)
ElutionSample loading
A280
80 160Washing(packed mode)
Washing(expanded mode) Time (min)
ElutionSample loading
Column: STREAMLINE™ 25 (25 mm i.d.)Adsorbent: STREAMLINE rProtein AFeed: 1.5 litres of myeloma cell cultureBuffer A: 50 mM glycine, 250 mM NaCl, pH 8Buffer B: 100 mM glycine pH 3.0Flow velocity: 300 cm/h at equilibration, feed
application and wash 100 cm/h atelution and CIP
a)
Column: STREAMLINE 200 (200 mm i.d.)Adsorbent: STREAMLINE rProtein AFeed: 93 litres of myeloma cell cultureBuffer A: 50 mM glycine, 250 mM NaCl, pH 8Buffer B: 100 mM glycine pH 3.0Flow velocity: 300 cm/h at equilibration, feed
application and wash 100 cm/h atelution and CIP
b)
P ifi i f h i d I G ib d f
8/6/2019 02 Downstream Process
http://slidepdf.com/reader/full/02-downstream-process 20/29
20 /GE /
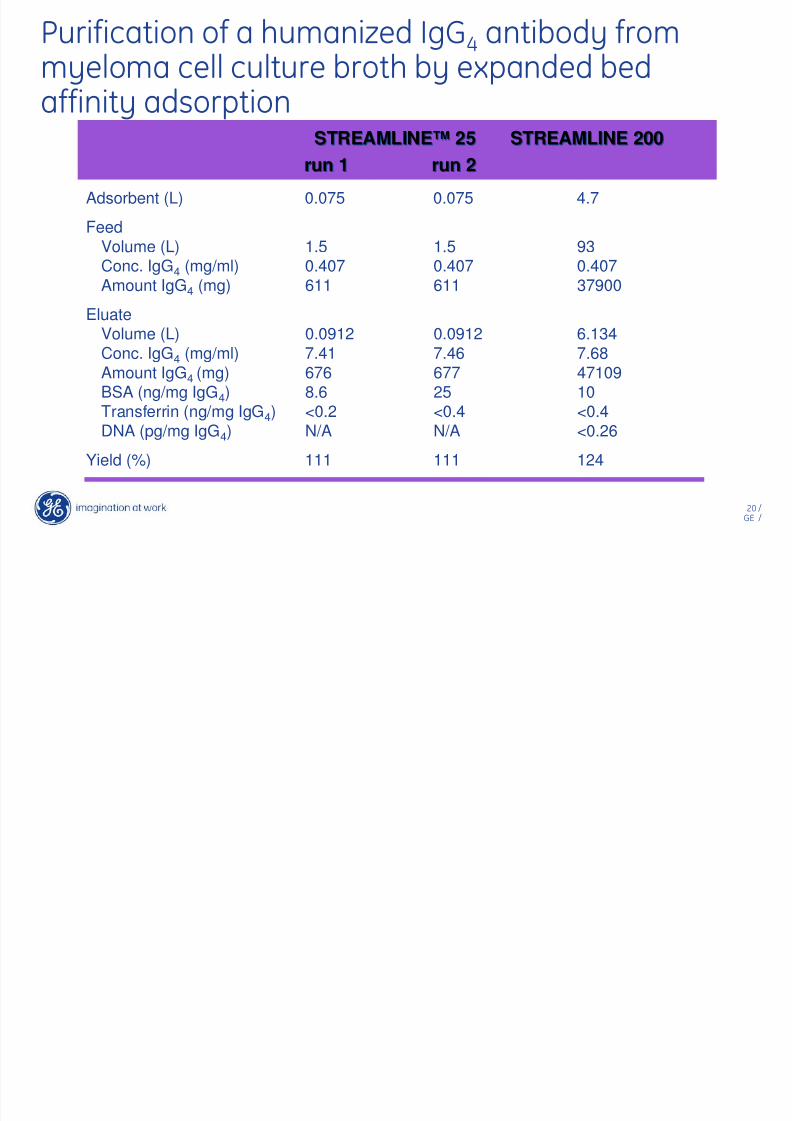
Purification of a humanized IgG 4 antibody frommyeloma cell culture broth by expanded bedaffinity adsorption
Adsorbent (L) 0.075 0.075 4.7Feed
Volume (L) 1.5 1.5 93Conc. IgG4 (mg/ml) 0.407 0.407 0.407Amount IgG
4(mg) 611 611 37900
EluateVolume (L) 0.0912 0.0912 6.134Conc. IgG4 (mg/ml) 7.41 7.46 7.68Amount IgG4 (mg) 676 677 47109
BSA (ng/mg IgG4) 8.6 25 10Transferrin (ng/mg IgG4) <0.2 <0.4 <0.4DNA (pg/mg IgG4) N/A N/A <0.26
Yield (%) 111 111 124
STREAMLINE™ 25STREAMLINE™ 25 STREAMLINE 200STREAMLINE 200run 1run 1 run 2run 2

8/6/2019 02 Downstream Process
http://slidepdf.com/reader/full/02-downstream-process 21/29

8/6/2019 02 Downstream Process
http://slidepdf.com/reader/full/02-downstream-process 22/29
22 /GE /
Sephadex™ G-25 CSephadex™ G-25 C
DEAE Sepharose™ Fast FlowDEAE Sepharose™ Fast Flow
Q Sepharose Fast FlowQ Sepharose Fast Flow
CM Sepharose Fast FlowCM Sepharose Fast Flow
CM Sepharose Fast FlowCM Sepharose Fast Flow
Procedure for production of
Immunoglobulinfresh frozen plasma without coagulationfactors or outdated plasma
euglobin ppt I and pHadjustment
pH and Iadjustment
ultrafiltrationvirus inactivationsolvent/detergent
ultrafiltrationformulation
sterile filtrationlyophilizationIgG powder 5.0 g/Lof plasma

8/6/2019 02 Downstream Process
http://slidepdf.com/reader/full/02-downstream-process 23/29
23 /GE /
Purification of oligonucleotides on
SOURCE™ 15QAn analytical chromatogram obtained for the crude starting material,analysed by ion exchange chromatography
mAU
600
400
200
0
0.0 5.0 10.0 15.0 20.0 Volume (mL)
%B
100
80
60
40
20
0
Column: RESOURCE™ Q, 1 mlSample: 25µLFlow: 0.5 mL/minEluent A: 10 mM NaOH, 1.0 M NaClEluent B: 10 mM NaOH, 3.0 M NaClGradient: 0-45% B, 17.5 column vol.System: ÄKTA™purifier Detection: 260 nm

8/6/2019 02 Downstream Process
http://slidepdf.com/reader/full/02-downstream-process 24/29
24 /GE /
Purification of oligonucleotides on
SOURCE™ 15Q
mAU
2500
2000
1500
1000
500
00 200 400 600 800 Volume (L)
mS/cm
150
100
0
Column: FineLINE™ Pilot 35Flow: 8 mL/min: 50 cm/hSystem: ÄKTA™explorer
Detection: 280 nm
AU
1.5
1.0
0.5
0.0100 200 300 400 500 L
mS/cm
150
100
0
Column: Customized FineLINE 800Flow: 250 L/min; 50 cm/hSystem: BioProcess™ Engineering 8 mm, 10 bar
Detection: 280 nm

8/6/2019 02 Downstream Process
http://slidepdf.com/reader/full/02-downstream-process 25/29
25 /GE /
Purification of oligonucleotides on
SOURCE™ 15QAn analytical chromatogram of obtained for the final product
mAU
1000
500
00.0 5.0 10.0 15.0 20.0 Volume (ml)
%B100
80
60
40
20
0
Column: RESOURCE™ Q, 1 mlSample: 25 µlFlow: 0.5 mL/minEluent A: 10 mM NaOH, 1.0 M NaCl
Eluent B: 10 mM NaOH, 3.0 M NaClGradient: 0-45% B, 17.5 column vol.System: ÄKTA™purifier Detection: 260 nm

8/6/2019 02 Downstream Process
http://slidepdf.com/reader/full/02-downstream-process 26/29
26 /GE /
Purification of PlasmidsCell paste
Addition of CaCl2
Capture - Q Sepharose™ XL
Polishing - SOURCE™ 15Q
Plasmids for gene therapy
Resuspension in bufferAlkaline lysisNeutralisation
CentrifugationFiltration - glass woolFiltration 0.45 µm
8/6/2019 02 Downstream Process
http://slidepdf.com/reader/full/02-downstream-process 27/29
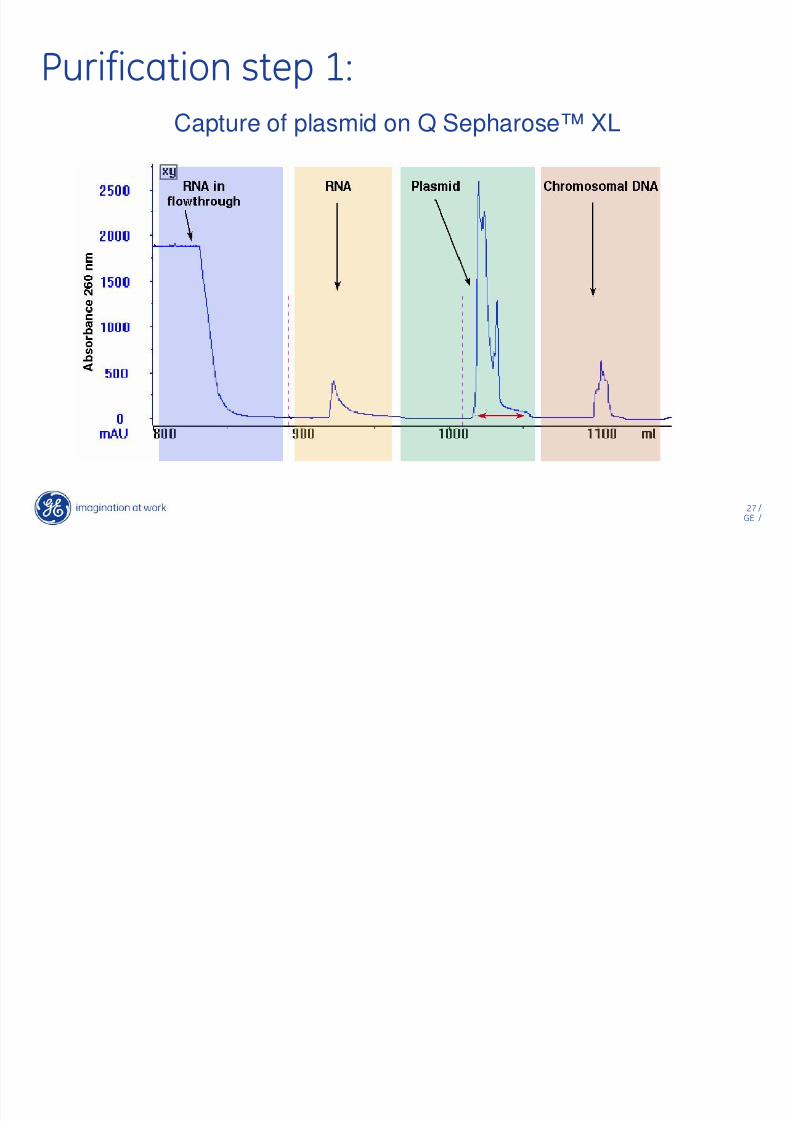
27 /GE /
Purification step 1:Capture of plasmid on Q Sepharose™ XL

8/6/2019 02 Downstream Process
http://slidepdf.com/reader/full/02-downstream-process 28/29
28 /GE /
Purification of PlasmidsPolishing on SOURCE™ 15Q

8/6/2019 02 Downstream Process
http://slidepdf.com/reader/full/02-downstream-process 29/29
29 /GE /
Purification of PlasmidsAnalysis of plasmid fractions from Capture and Polishing
Amount of plasmid applied (mg) 6.2 4.6Analysis of plasmid peakTotal nucleic acid (mg) 5.4 3.8
Plasmid amount (mg) 4.8 3.9Plasmid (% nucleic acid) 90 99.4RNA (% nucleic acid) not detectedChromosomal DNA (% nucleic acid) 2 0.6Supercoiled plasmid (% plasmid) 93 100Plasmid yield % per step 78 85Yield % (total plasmid) 78 66
Q Sepharose XLBed volume 10 mlQ Sepharose XL
Bed volume 10 mlSOURCE 15Q
Bed volume 6 mlSOURCE 15Q
Bed volume 6 ml