


Languages
Pages
Legal

The Underwriting CycleAre Loss Reserves Reasonable in Light of Potential Underwriting Cycle Biases?
December 2, 2011
PwCActuarial and Insurance Management Solutions (AIMS)
Slide 2
Agenda
• Introduction
• Pricing trends
• Inspection of reserve adequacy
• Implications on profitability

Introduction
Slide 3
Slide 4
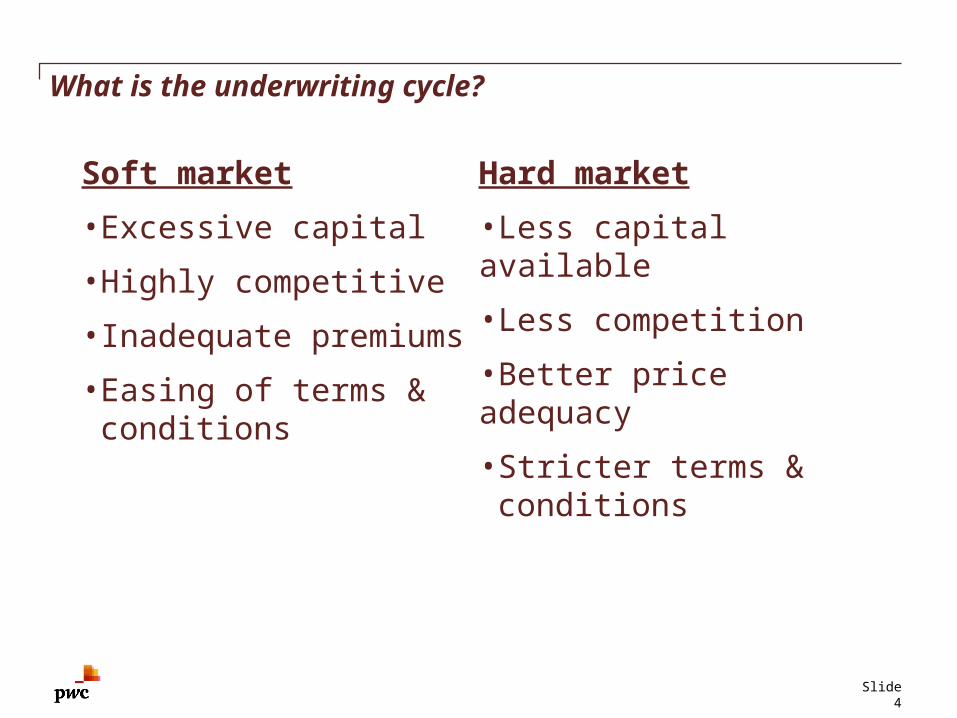
What is the underwriting cycle?
Soft market
•Excessive capital
•Highly competitive
•Inadequate premiums
• Easing of terms & conditions
Hard market
•Less capital available
•Less competition
•Better price adequacy
• Stricter terms & conditions
Slide 5
How does the underwriting cycle impact reserves?
Pricing
Bias
Potential
Reserving
Bias
Slide 6
How does reserve adequacy impact pricing?
Reserving
Bias
Potential
Pricing
Bias
Slide 7
Inherent link?
Reserving
Bias
Pricing
Bias

Pricing trends
Slide 8
Slide 9
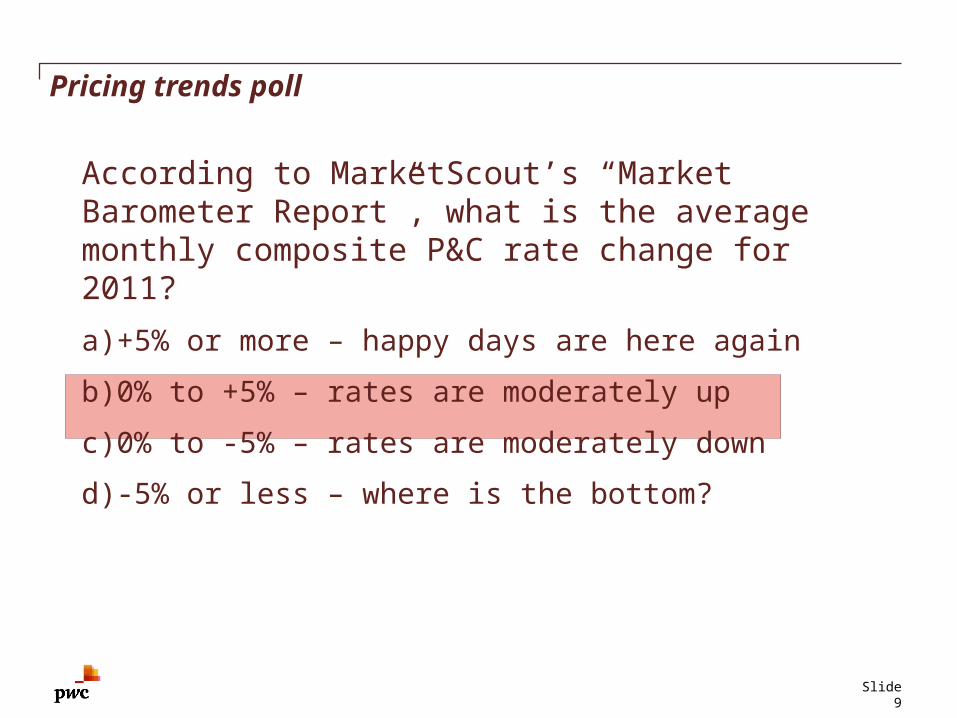
Pricing trends poll
According to MarketScout’s “Market Barometer Report”, what is the average monthly composite P&C rate change for 2011?
a)+5% or more – happy days are here again
b)0% to +5% – rates are moderately up
c)0% to -5% – rates are moderately down
d)-5% or less – where is the bottom?
Slide 10
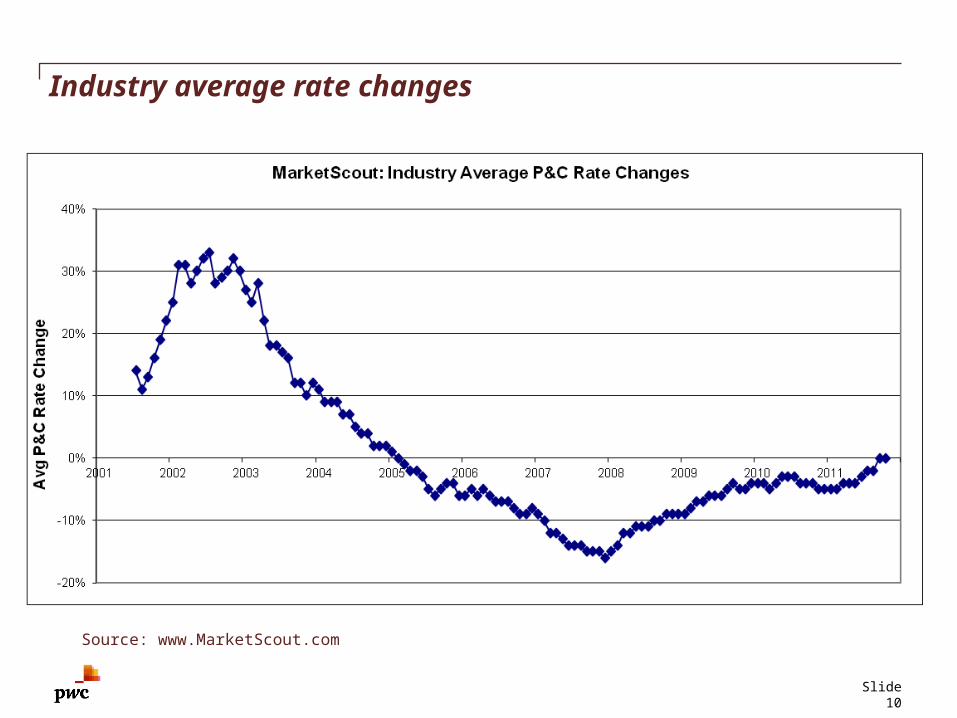
Industry average rate changes
Source: www.MarketScout.com
Slide 11
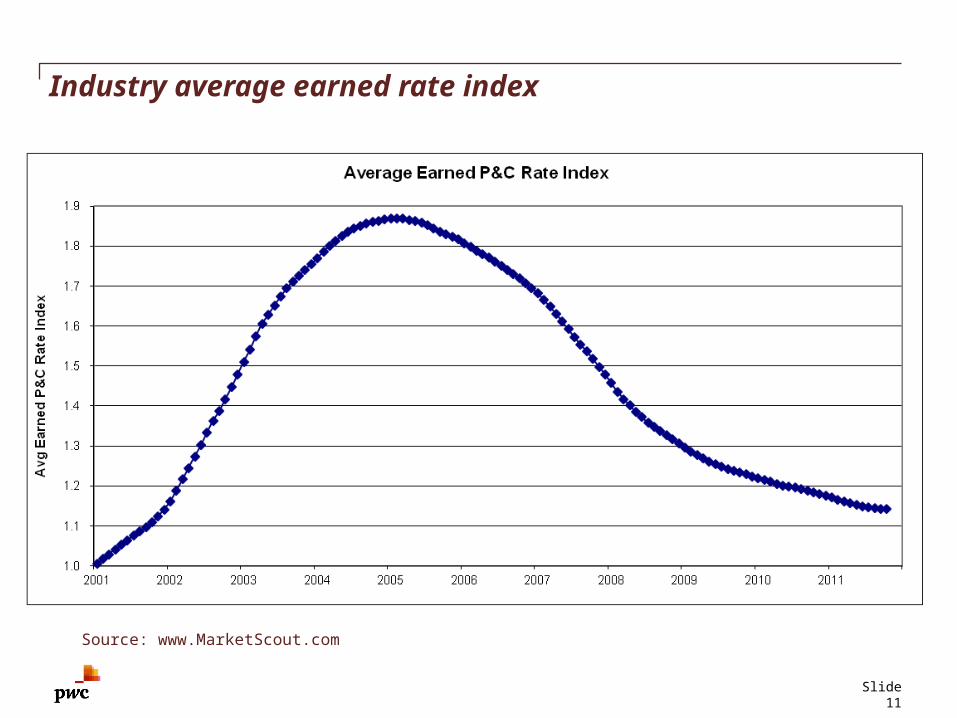
Industry average earned rate index
Source: www.MarketScout.com
Slide 12
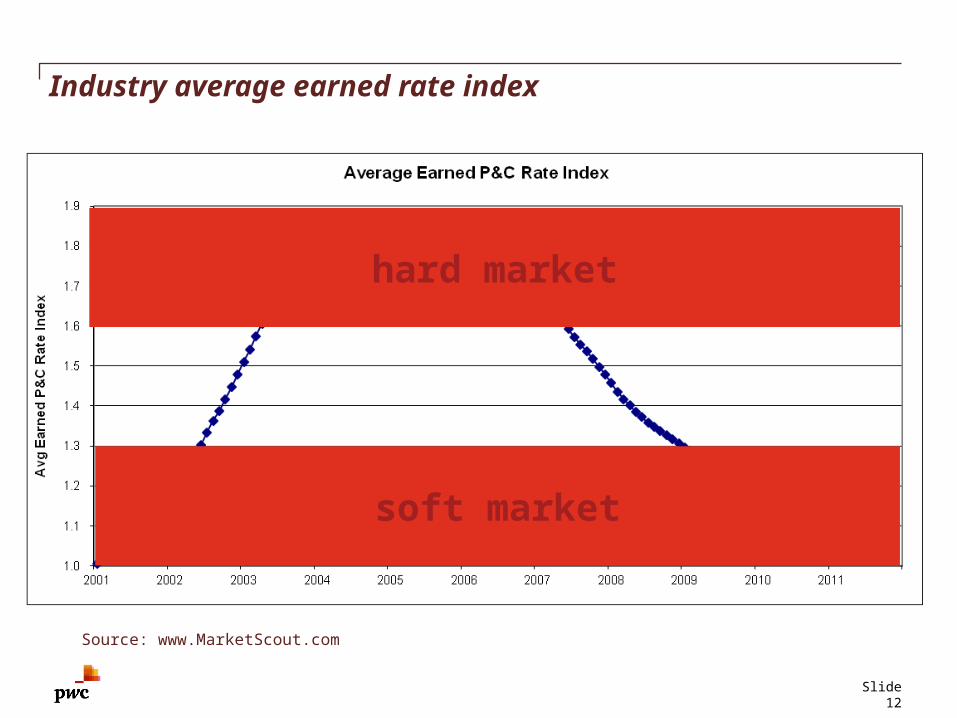
Industry average earned rate index
Source: www.MarketScout.com
hard market
soft market
Inspection of reserve adequacy
Slide 13
Slide 14
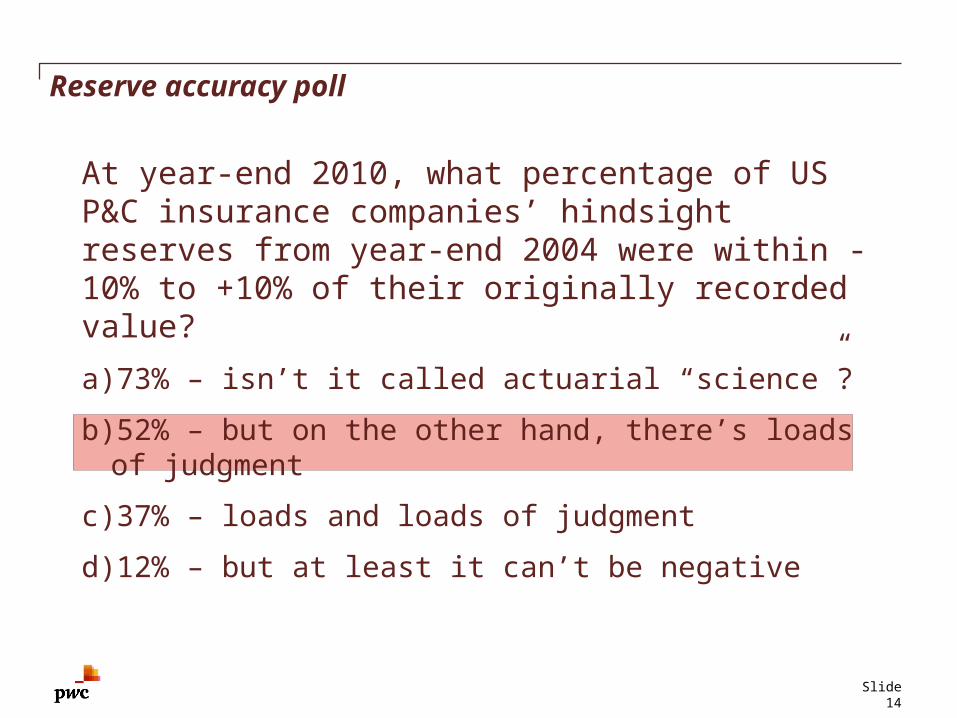
Reserve accuracy poll
At year-end 2010, what percentage of US P&C insurance companies’ hindsight reserves from year-end 2004 were within -10% to +10% of their originally recorded value?
a)73% – isn’t it called actuarial “science”?
b)52% – but on the other hand, there’s loads of judgment
c)37% – loads and loads of judgment
d)12% – but at least it can’t be negative

Slide 15
Percentage of companies with 2010 hindsight reserves within X% of initial recorded reservesCompanies with initial recorded reserves in excess of $1 million
Source: SNL, 2010
Calendar Within Within WithinYear End +/- 5% +/-10% +/- 25%
2001 14% 26% 58%
2002 14% 30% 64%
2003 19% 34% 68%
2004 20% 37% 67%
2005 17% 35% 66%
2006 15% 33% 67%
2007 15% 37% 71%
2008 26% 49% 79%
2009 39% 64% 87%
Slide 16
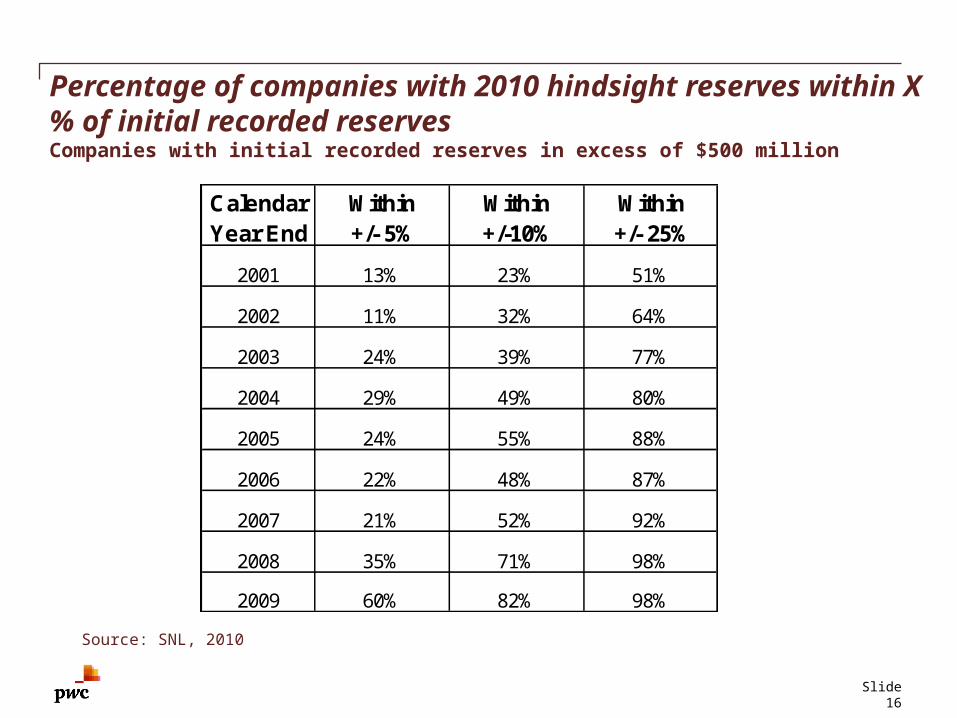
Percentage of companies with 2010 hindsight reserves within X% of initial recorded reservesCompanies with initial recorded reserves in excess of $500 million
Source: SNL, 2010
Calendar Within Within WithinYear End +/- 5% +/-10% +/- 25%
2001 13% 23% 51%
2002 11% 32% 64%
2003 24% 39% 77%
2004 29% 49% 80%
2005 24% 55% 88%
2006 22% 48% 87%
2007 21% 52% 92%
2008 35% 71% 98%
2009 60% 82% 98%
Slide 17
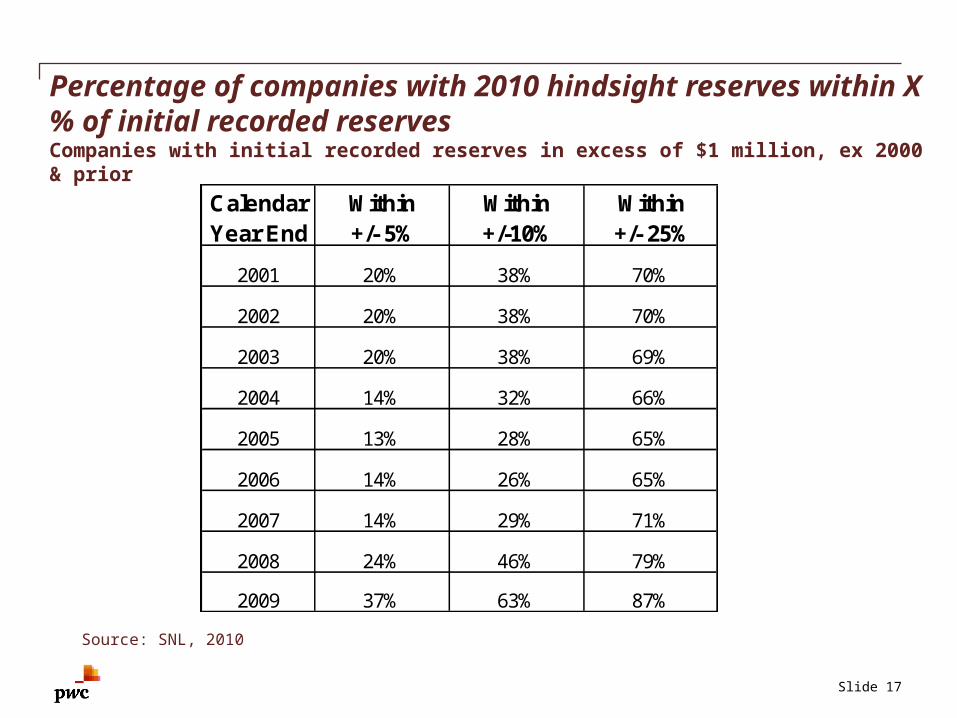
Percentage of companies with 2010 hindsight reserves within X% of initial recorded reservesCompanies with initial recorded reserves in excess of $1 million, ex 2000 & prior
Source: SNL, 2010
Calendar Within Within WithinYear End +/- 5% +/-10% +/- 25%
2001 20% 38% 70%
2002 20% 38% 70%
2003 20% 38% 69%
2004 14% 32% 66%
2005 13% 28% 65%
2006 14% 26% 65%
2007 14% 29% 71%
2008 24% 46% 79%
2009 37% 63% 87%
Slide 18
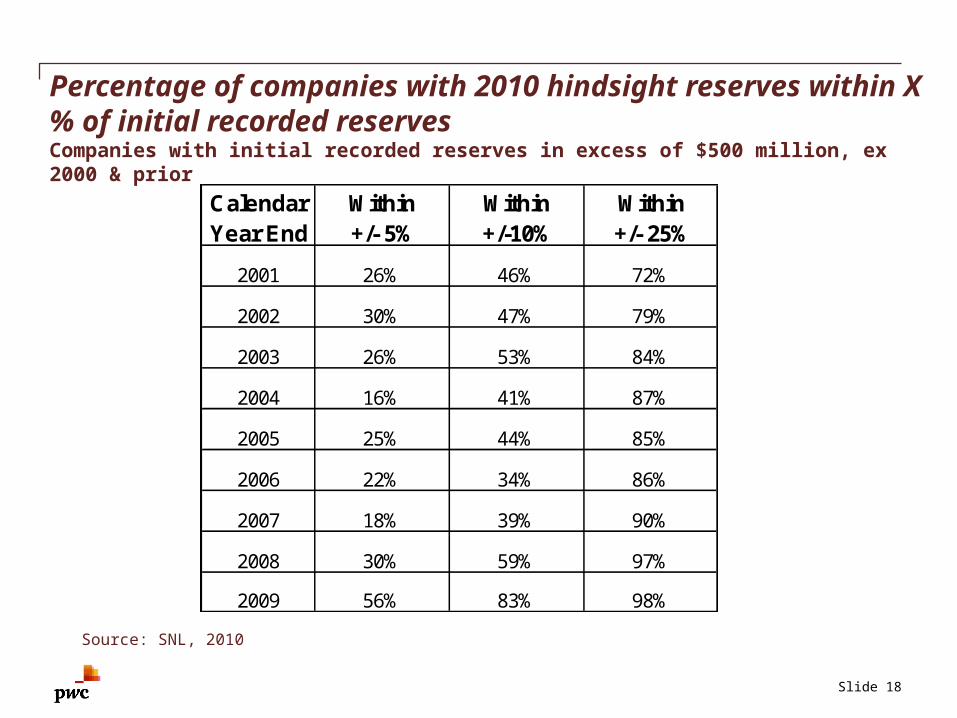
Percentage of companies with 2010 hindsight reserves within X% of initial recorded reservesCompanies with initial recorded reserves in excess of $500 million, ex 2000 & prior
Source: SNL, 2010
Calendar Within Within WithinYear End +/- 5% +/-10% +/- 25%
2001 26% 46% 72%
2002 30% 47% 79%
2003 26% 53% 84%
2004 16% 41% 87%
2005 25% 44% 85%
2006 22% 34% 86%
2007 18% 39% 90%
2008 30% 59% 97%
2009 56% 83% 98%
Slide 19
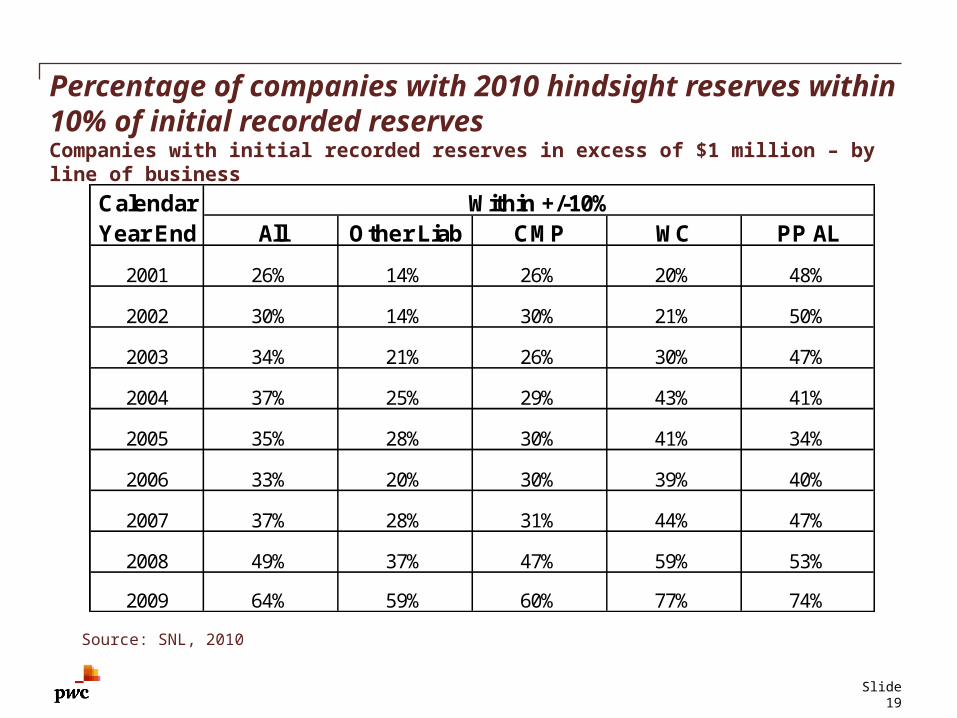
Percentage of companies with 2010 hindsight reserves within 10% of initial recorded reservesCompanies with initial recorded reserves in excess of $1 million – by line of business
Source: SNL, 2010
Calendar Within +/-10%Year End All Other Liab CMP WC PP AL
2001 26% 14% 26% 20% 48%
2002 30% 14% 30% 21% 50%
2003 34% 21% 26% 30% 47%
2004 37% 25% 29% 43% 41%
2005 35% 28% 30% 41% 34%
2006 33% 20% 30% 39% 40%
2007 37% 28% 31% 44% 47%
2008 49% 37% 47% 59% 53%
2009 64% 59% 60% 77% 74%
Slide 20
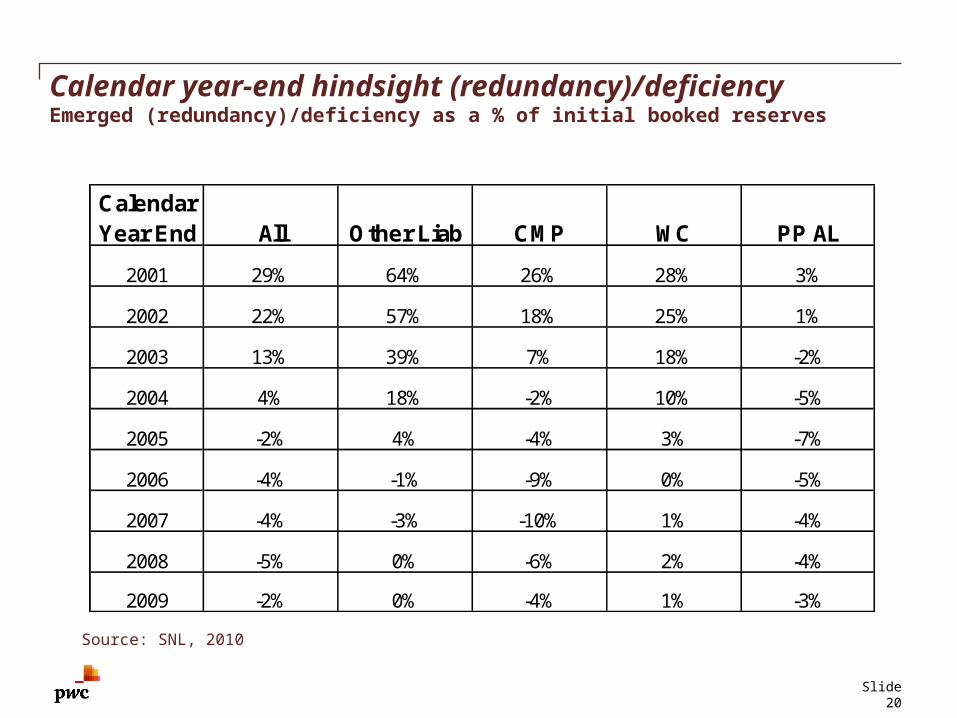
Calendar year-end hindsight (redundancy)/deficiencyEmerged (redundancy)/deficiency as a % of initial booked reserves
Source: SNL, 2010
CalendarYear End All Other Liab CMP WC PP AL
2001 29% 64% 26% 28% 3%
2002 22% 57% 18% 25% 1%
2003 13% 39% 7% 18% -2%
2004 4% 18% -2% 10% -5%
2005 -2% 4% -4% 3% -7%
2006 -4% -1% -9% 0% -5%
2007 -4% -3% -10% 1% -4%
2008 -5% 0% -6% 2% -4%
2009 -2% 0% -4% 1% -3%
Slide 21
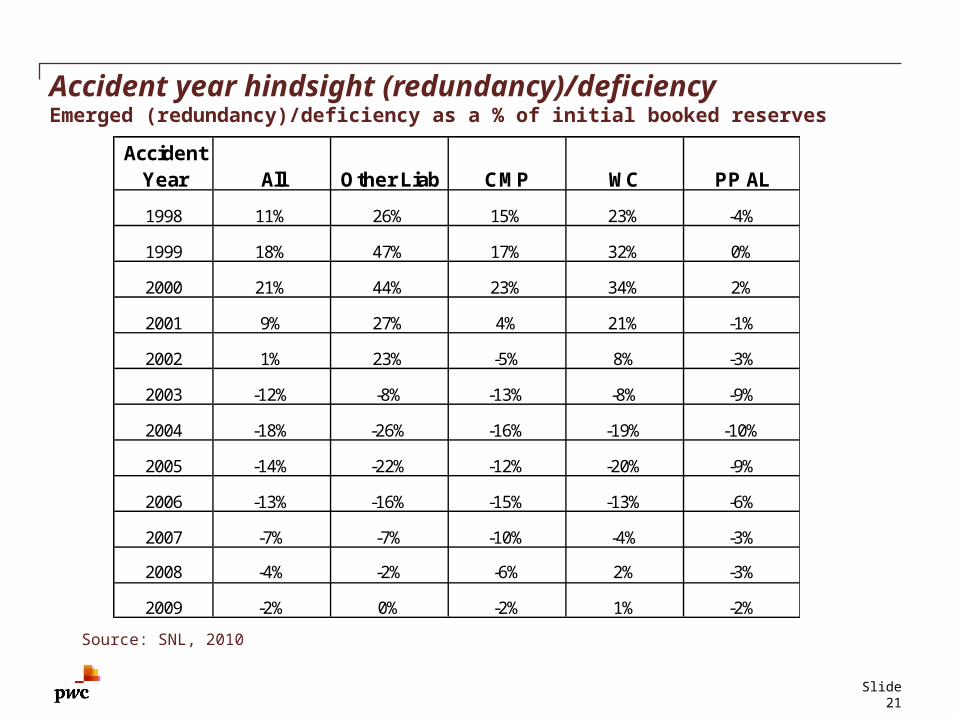
Accident year hindsight (redundancy)/deficiencyEmerged (redundancy)/deficiency as a % of initial booked reserves
Source: SNL, 2010
AccidentYear All Other Liab CMP WC PP AL
1998 11% 26% 15% 23% -4%
1999 18% 47% 17% 32% 0%
2000 21% 44% 23% 34% 2%
2001 9% 27% 4% 21% -1%
2002 1% 23% -5% 8% -3%
2003 -12% -8% -13% -8% -9%
2004 -18% -26% -16% -19% -10%
2005 -14% -22% -12% -20% -9%
2006 -13% -16% -15% -13% -6%
2007 -7% -7% -10% -4% -3%
2008 -4% -2% -6% 2% -3%
2009 -2% 0% -2% 1% -2%
Slide 22
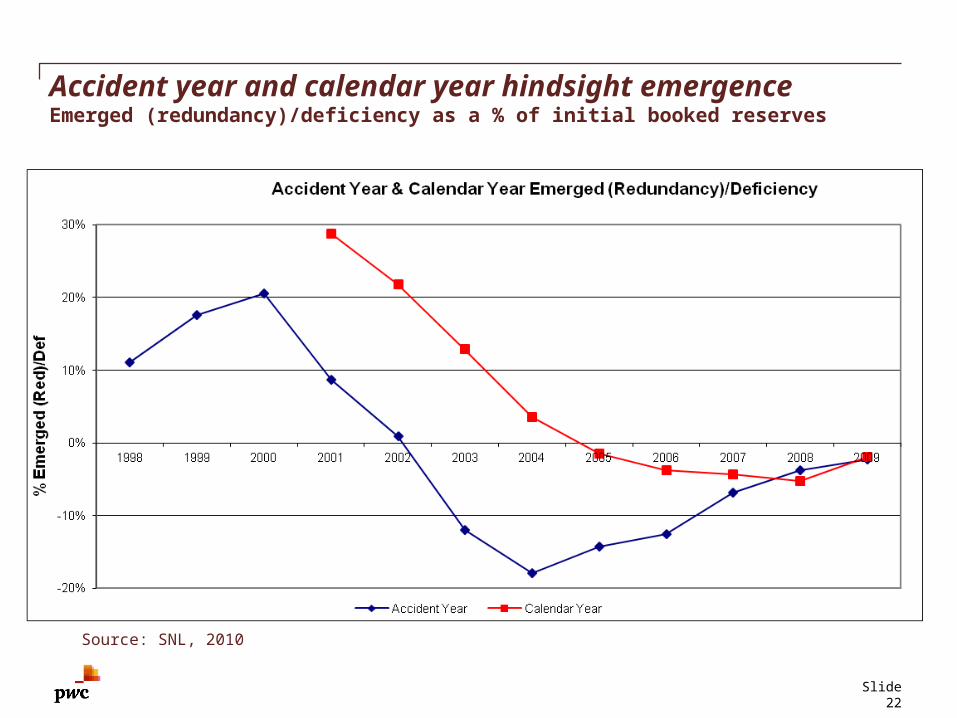
Accident year and calendar year hindsight emergenceEmerged (redundancy)/deficiency as a % of initial booked reserves
Source: SNL, 2010

Implications on profitability
Slide 23
Slide 24
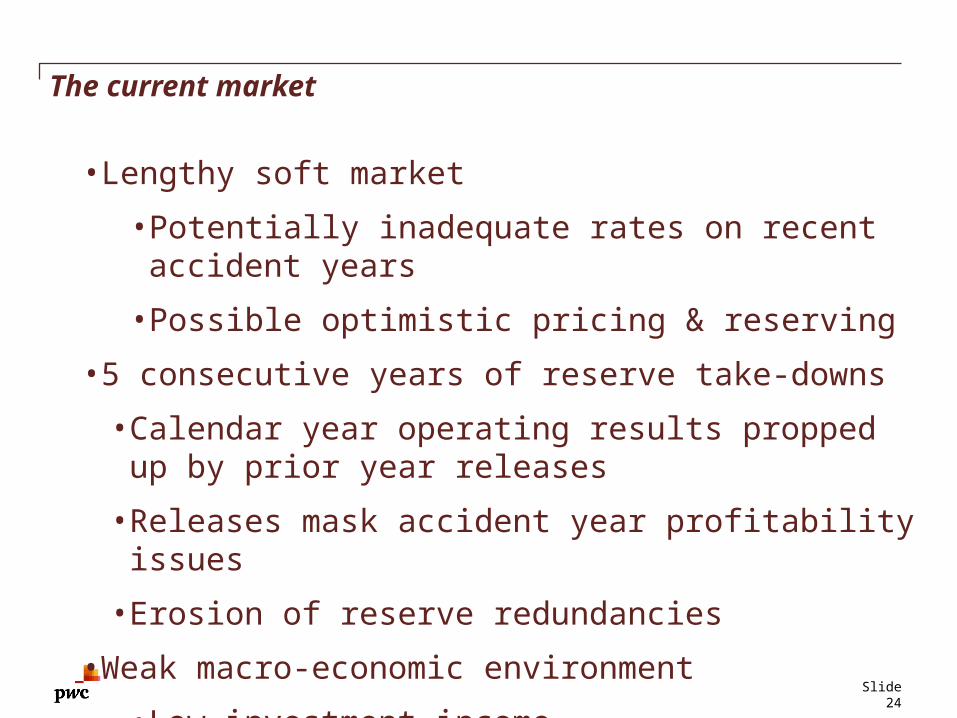
The current market
• Lengthy soft market
• Potentially inadequate rates on recent accident years
• Possible optimistic pricing & reserving
• 5 consecutive years of reserve take-downs
• Calendar year operating results propped up by prior year releases
• Releases mask accident year profitability issues
• Erosion of reserve redundancies
• Weak macro-economic environment
• Low investment income
Slide 25
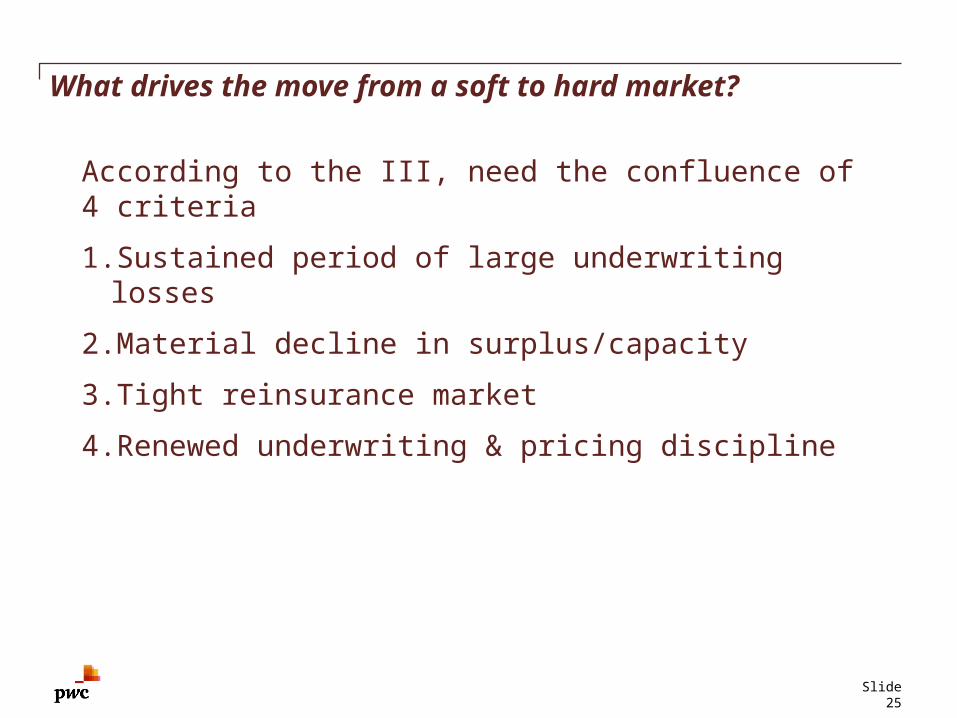
What drives the move from a soft to hard market?
According to the III, need the confluence of 4 criteria
1.Sustained period of large underwriting losses
2.Material decline in surplus/capacity
3.Tight reinsurance market
4.Renewed underwriting & pricing discipline
Slide 26
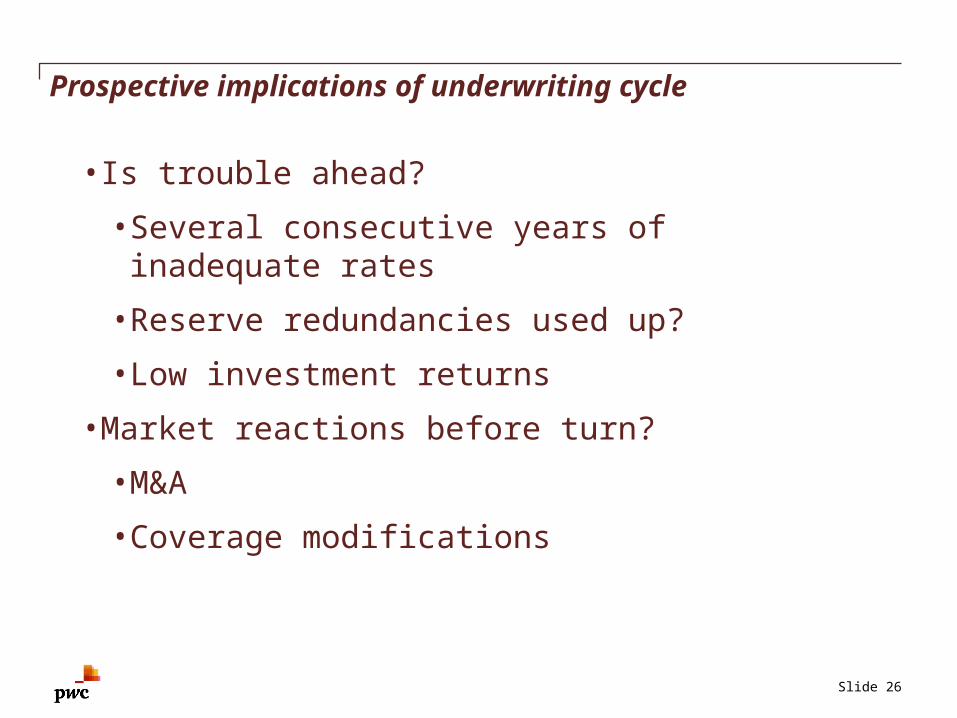
Prospective implications of underwriting cycle
•Is trouble ahead?
• Several consecutive years of inadequate rates
• Reserve redundancies used up?
• Low investment returns
•Market reactions before turn?
• M&A
• Coverage modifications
Slide 27
PwC Actuarial & Insurance Management Solutions
Scott Cederburg, FCAS, [email protected](678) 419-1539
© 2011 PricewaterhouseCoopers LLP. All rights reserved. In this document, “PwC” refers to PricewaterhouseCoopers LLP, which is a member firm of PricewaterhouseCoopers International Limited, each member firm of which is a separate legal entity.
Thank you
Top Related