The Underwriting Cycle Are Loss Reserves Reasonable in Light of Potential Underwriting Cycle Biases?...
28
The Underwriting Cycle Are Loss Reserves Reasonable in Light of Potential Underwriting Cycle Biases? December 2, 2011 PwC Actuarial and Insurance Management Solutions (AIMS)
-
Upload
charlotte-hancock -
Category
Documents
-
view
216 -
download
0
Transcript of The Underwriting Cycle Are Loss Reserves Reasonable in Light of Potential Underwriting Cycle Biases?...
The Underwriting CycleAre Loss Reserves Reasonable in Light of Potential Underwriting Cycle Biases?
December 2, 2011
PwCActuarial and Insurance Management Solutions (AIMS)
Slide 2
Agenda
• Introduction
• Pricing trends
• Inspection of reserve adequacy
• Implications on profitability

Introduction
Slide 3
Slide 4
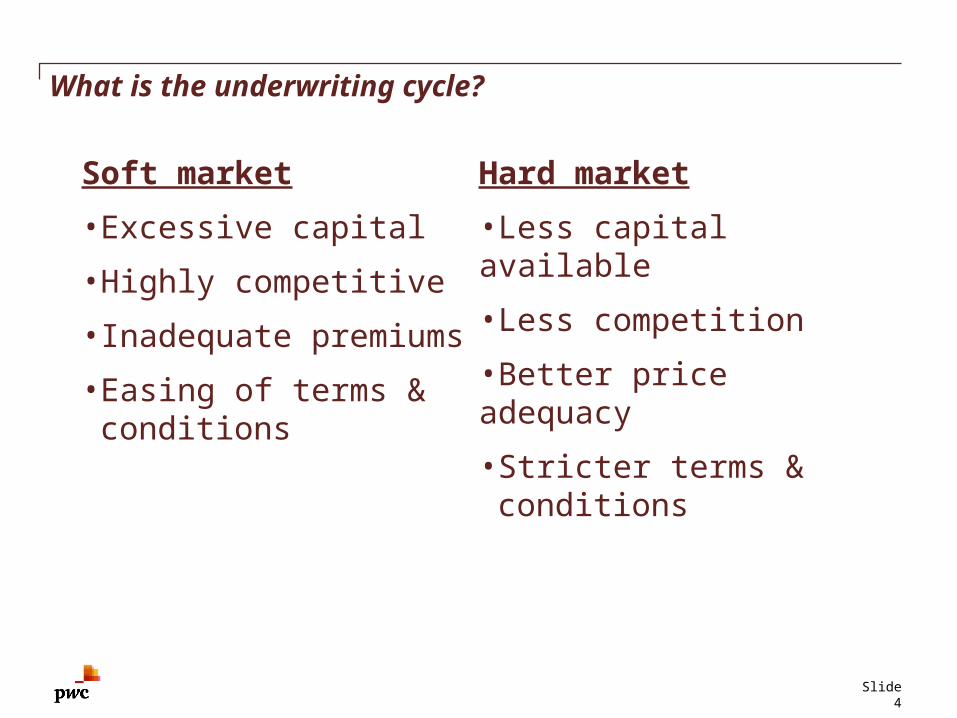
What is the underwriting cycle?
Soft market
•Excessive capital
•Highly competitive
•Inadequate premiums
• Easing of terms & conditions
Hard market
•Less capital available
•Less competition
•Better price adequacy
• Stricter terms & conditions
Slide 5
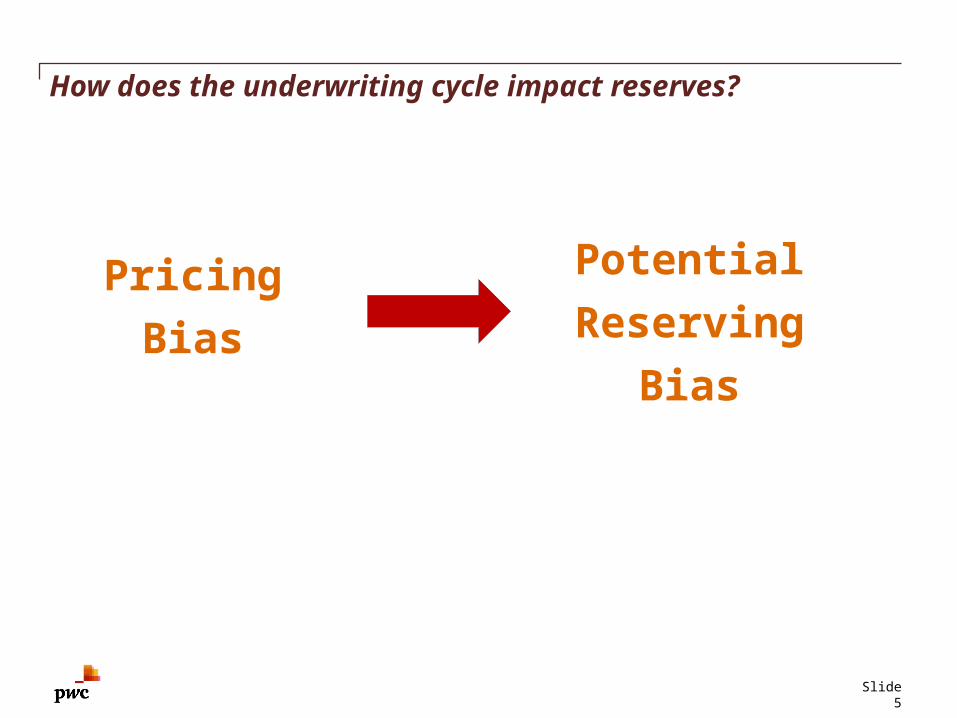
How does the underwriting cycle impact reserves?
Pricing
Bias
Potential
Reserving
Bias
Slide 6
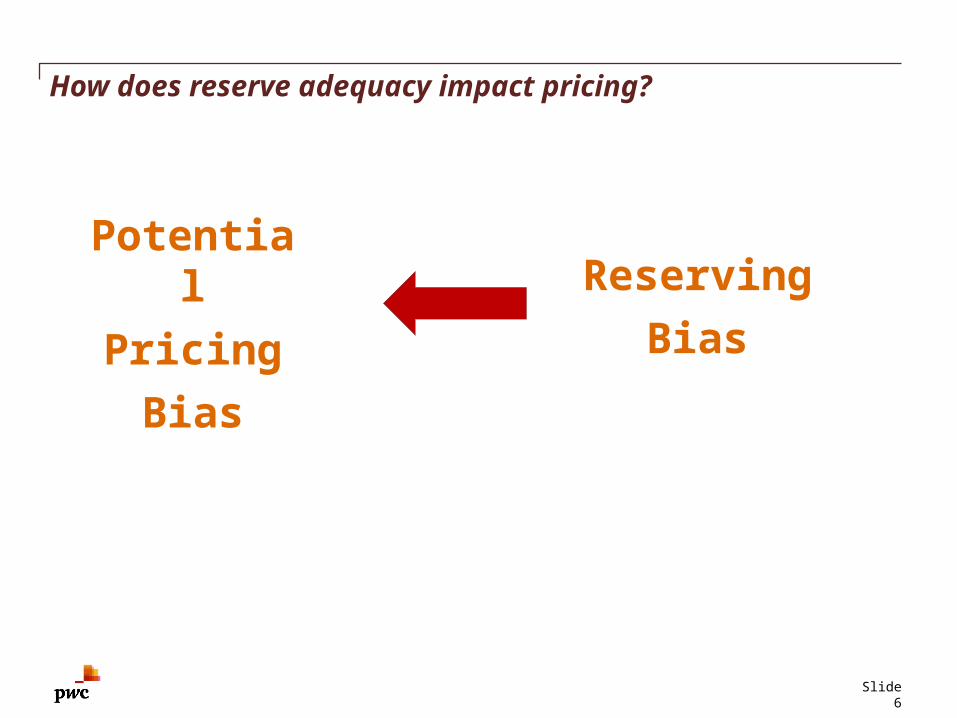
How does reserve adequacy impact pricing?
Reserving
Bias
Potential
Pricing
Bias
Slide 7
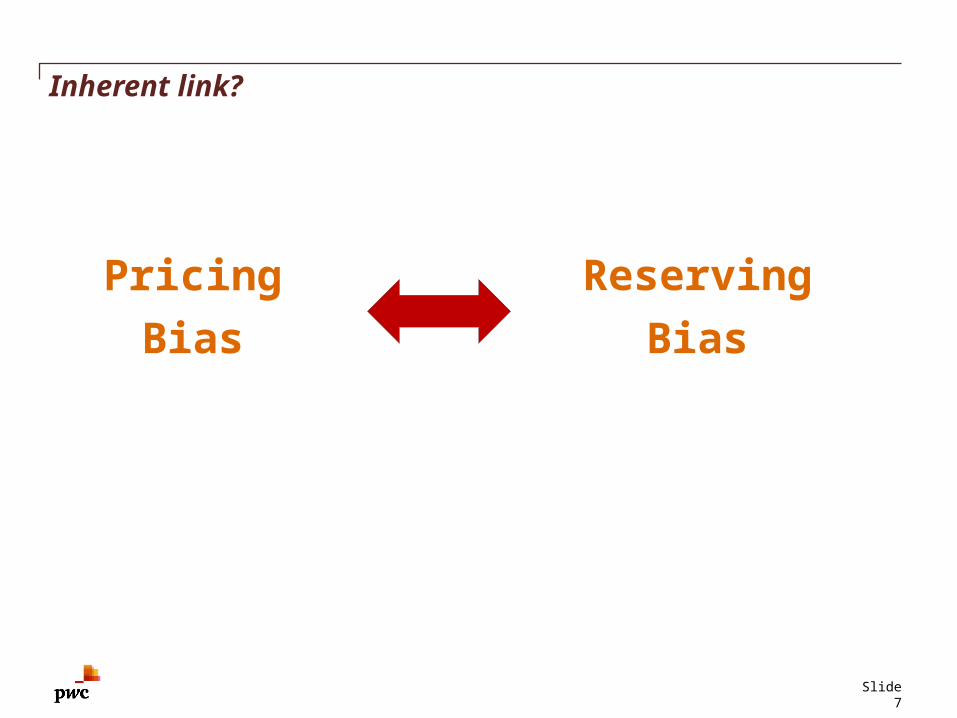
Inherent link?
Reserving
Bias
Pricing
Bias

Pricing trends
Slide 8
Slide 9
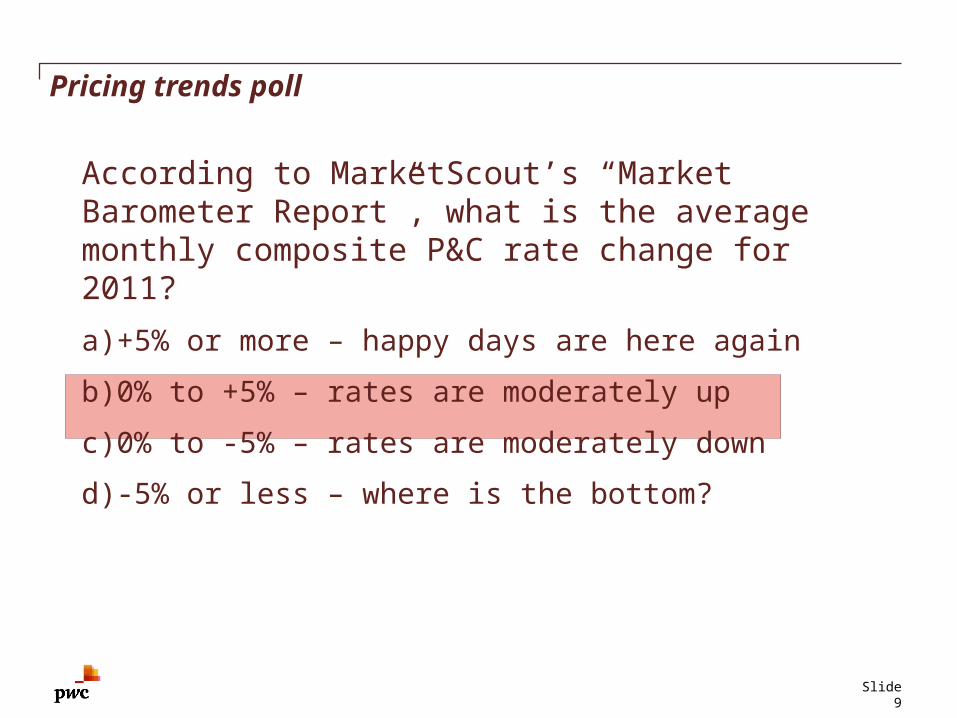
Pricing trends poll
According to MarketScout’s “Market Barometer Report”, what is the average monthly composite P&C rate change for 2011?
a)+5% or more – happy days are here again
b)0% to +5% – rates are moderately up
c)0% to -5% – rates are moderately down
d)-5% or less – where is the bottom?
Slide 10
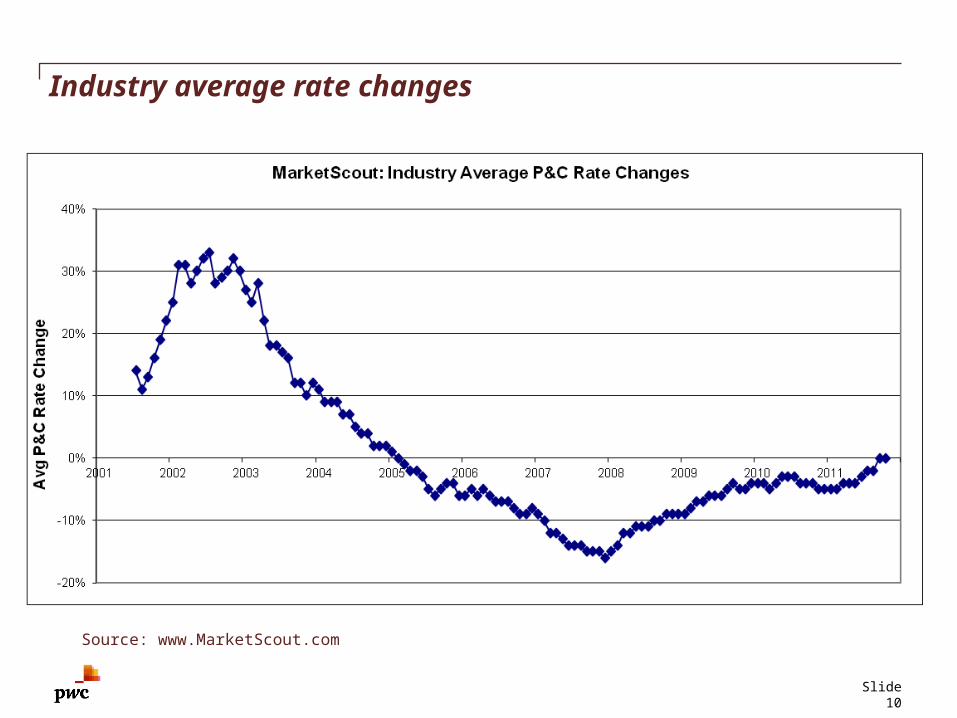
Industry average rate changes
Source: www.MarketScout.com
Slide 11
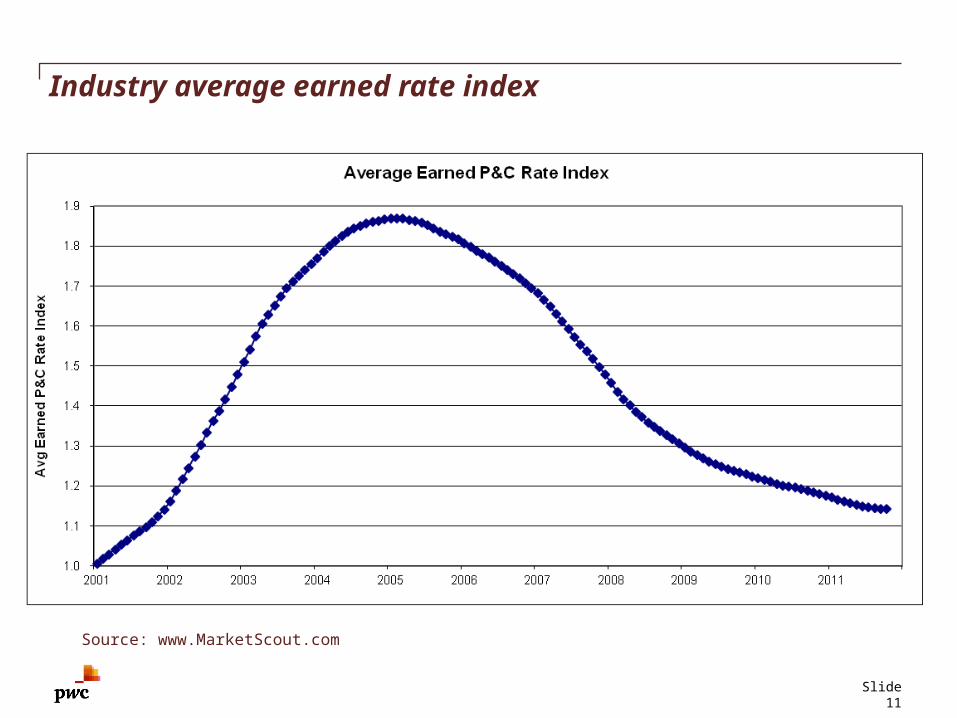
Industry average earned rate index
Source: www.MarketScout.com
Slide 12
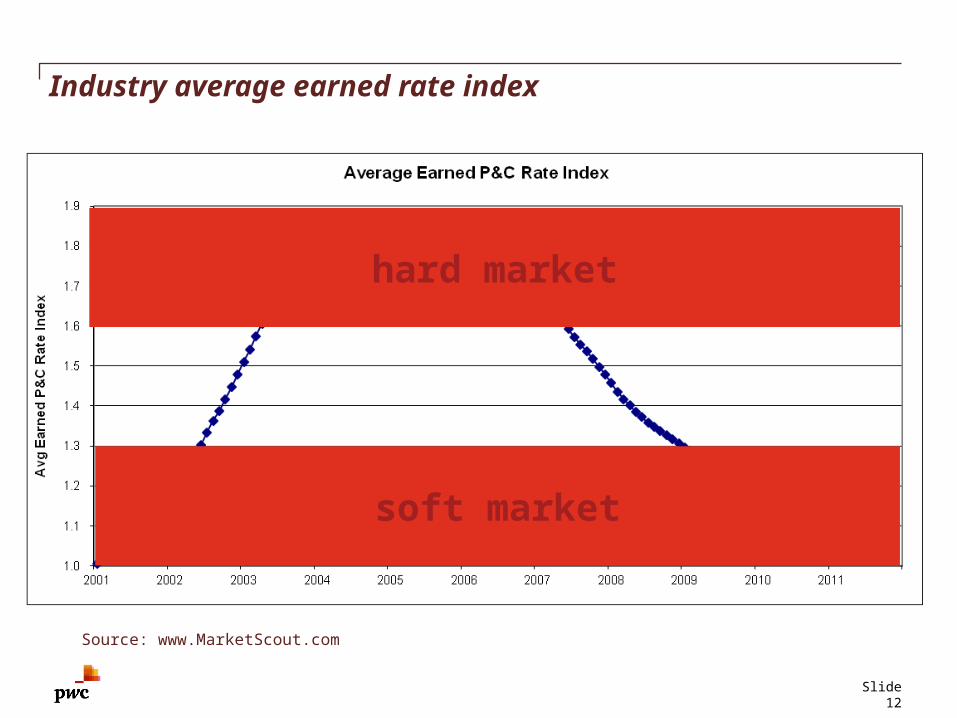
Industry average earned rate index
Source: www.MarketScout.com
hard market
soft market
Inspection of reserve adequacy
Slide 13
Slide 14
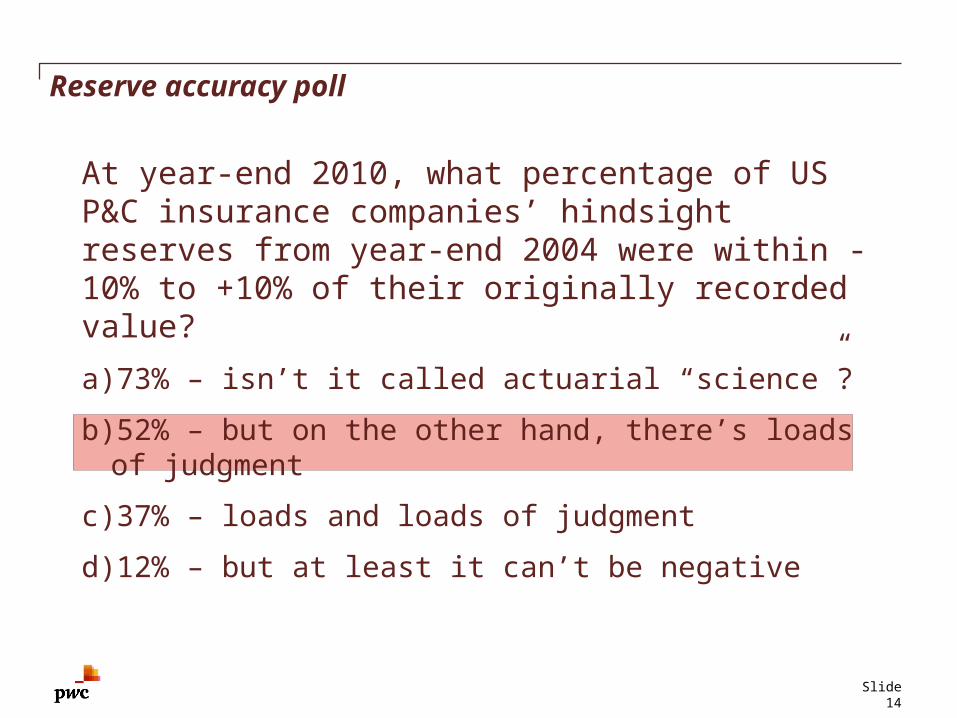
Reserve accuracy poll
At year-end 2010, what percentage of US P&C insurance companies’ hindsight reserves from year-end 2004 were within -10% to +10% of their originally recorded value?
a)73% – isn’t it called actuarial “science”?
b)52% – but on the other hand, there’s loads of judgment
c)37% – loads and loads of judgment
d)12% – but at least it can’t be negative

Slide 15
Percentage of companies with 2010 hindsight reserves within X% of initial recorded reservesCompanies with initial recorded reserves in excess of $1 million
Source: SNL, 2010
Calendar Within Within WithinYear End +/- 5% +/-10% +/- 25%
2001 14% 26% 58%
2002 14% 30% 64%
2003 19% 34% 68%
2004 20% 37% 67%
2005 17% 35% 66%
2006 15% 33% 67%
2007 15% 37% 71%
2008 26% 49% 79%
2009 39% 64% 87%
Slide 16
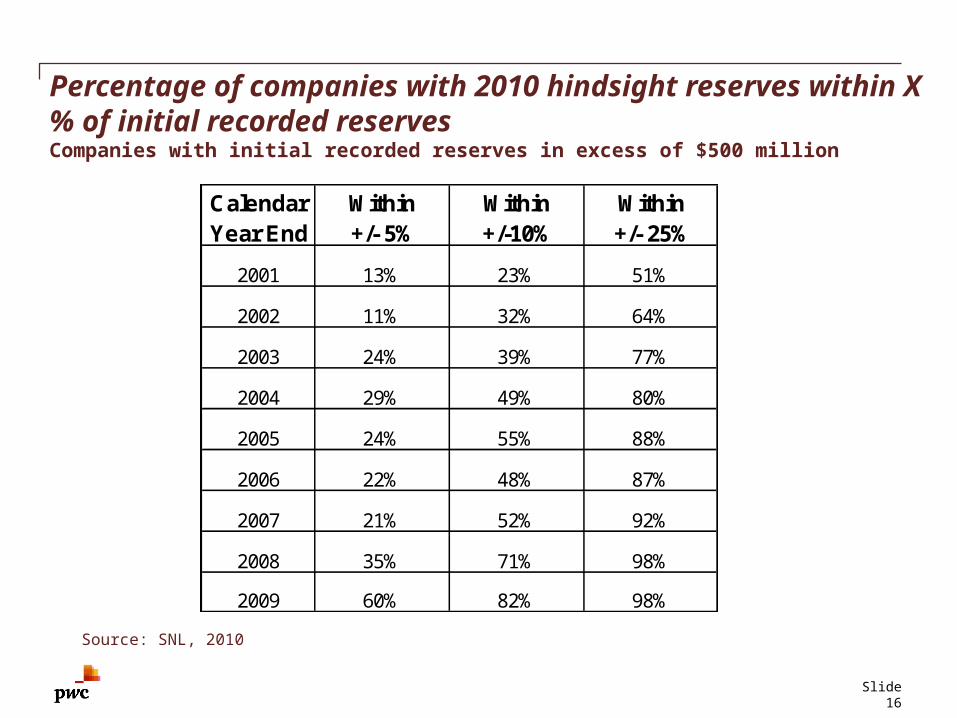
Percentage of companies with 2010 hindsight reserves within X% of initial recorded reservesCompanies with initial recorded reserves in excess of $500 million
Source: SNL, 2010
Calendar Within Within WithinYear End +/- 5% +/-10% +/- 25%
2001 13% 23% 51%
2002 11% 32% 64%
2003 24% 39% 77%
2004 29% 49% 80%
2005 24% 55% 88%
2006 22% 48% 87%
2007 21% 52% 92%
2008 35% 71% 98%
2009 60% 82% 98%
Slide 17
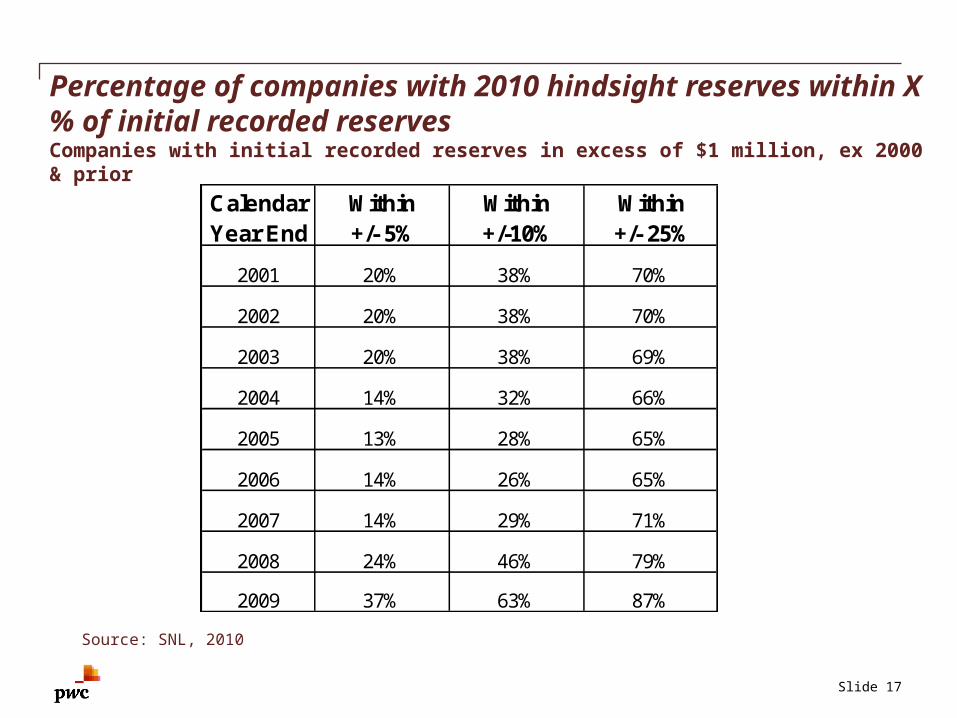
Percentage of companies with 2010 hindsight reserves within X% of initial recorded reservesCompanies with initial recorded reserves in excess of $1 million, ex 2000 & prior
Source: SNL, 2010
Calendar Within Within WithinYear End +/- 5% +/-10% +/- 25%
2001 20% 38% 70%
2002 20% 38% 70%
2003 20% 38% 69%
2004 14% 32% 66%
2005 13% 28% 65%
2006 14% 26% 65%
2007 14% 29% 71%
2008 24% 46% 79%
2009 37% 63% 87%
Slide 18
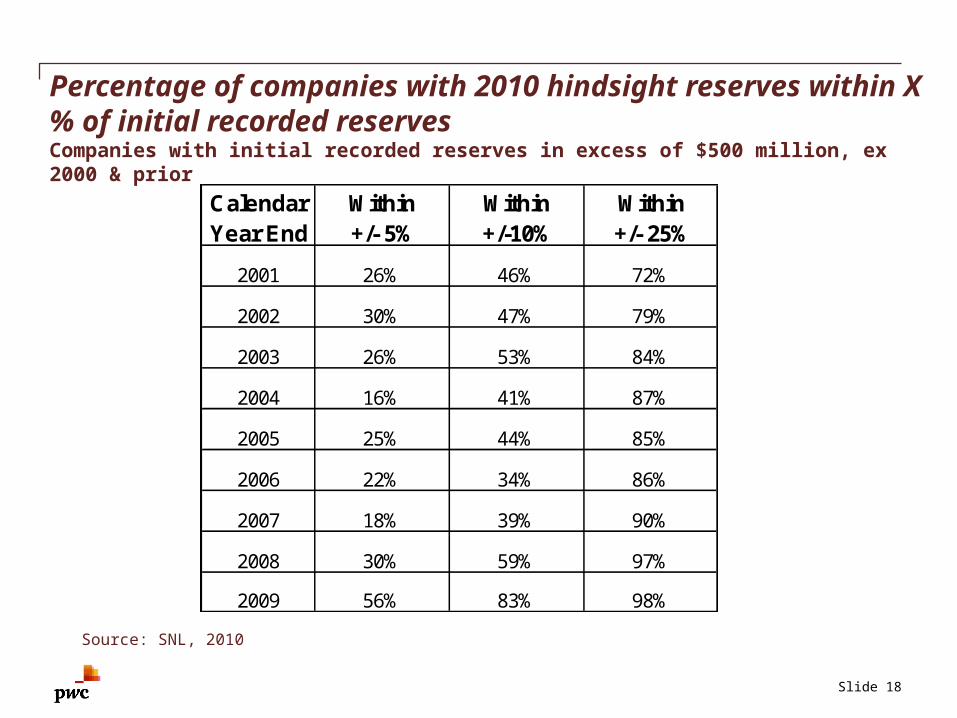
Percentage of companies with 2010 hindsight reserves within X% of initial recorded reservesCompanies with initial recorded reserves in excess of $500 million, ex 2000 & prior
Source: SNL, 2010
Calendar Within Within WithinYear End +/- 5% +/-10% +/- 25%
2001 26% 46% 72%
2002 30% 47% 79%
2003 26% 53% 84%
2004 16% 41% 87%
2005 25% 44% 85%
2006 22% 34% 86%
2007 18% 39% 90%
2008 30% 59% 97%
2009 56% 83% 98%
Slide 19
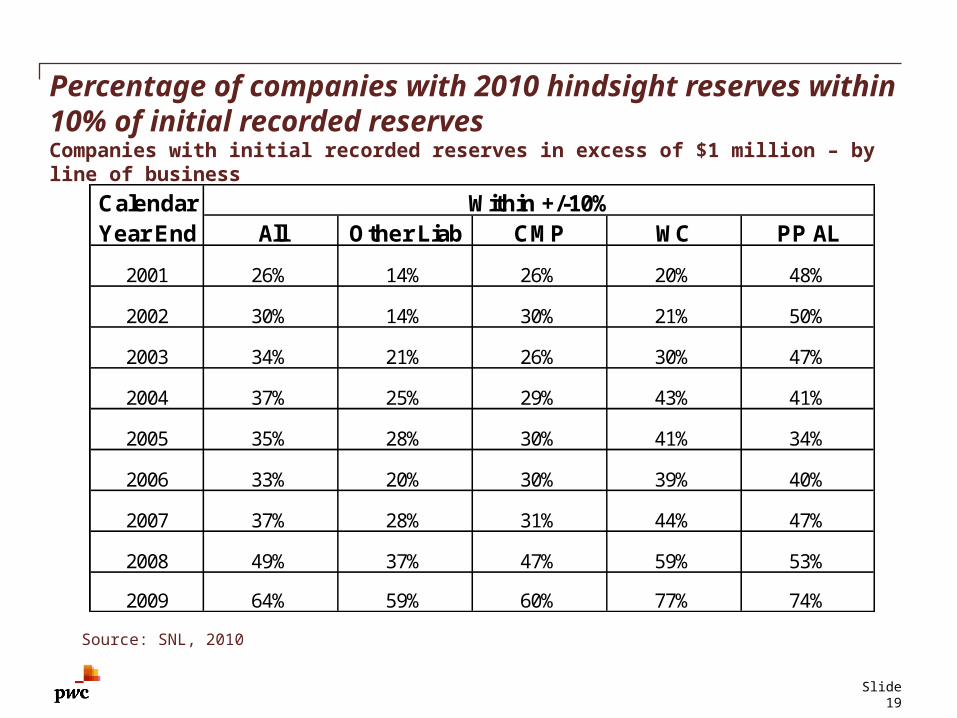
Percentage of companies with 2010 hindsight reserves within 10% of initial recorded reservesCompanies with initial recorded reserves in excess of $1 million – by line of business
Source: SNL, 2010
Calendar Within +/-10%Year End All Other Liab CMP WC PP AL
2001 26% 14% 26% 20% 48%
2002 30% 14% 30% 21% 50%
2003 34% 21% 26% 30% 47%
2004 37% 25% 29% 43% 41%
2005 35% 28% 30% 41% 34%
2006 33% 20% 30% 39% 40%
2007 37% 28% 31% 44% 47%
2008 49% 37% 47% 59% 53%
2009 64% 59% 60% 77% 74%
Slide 20
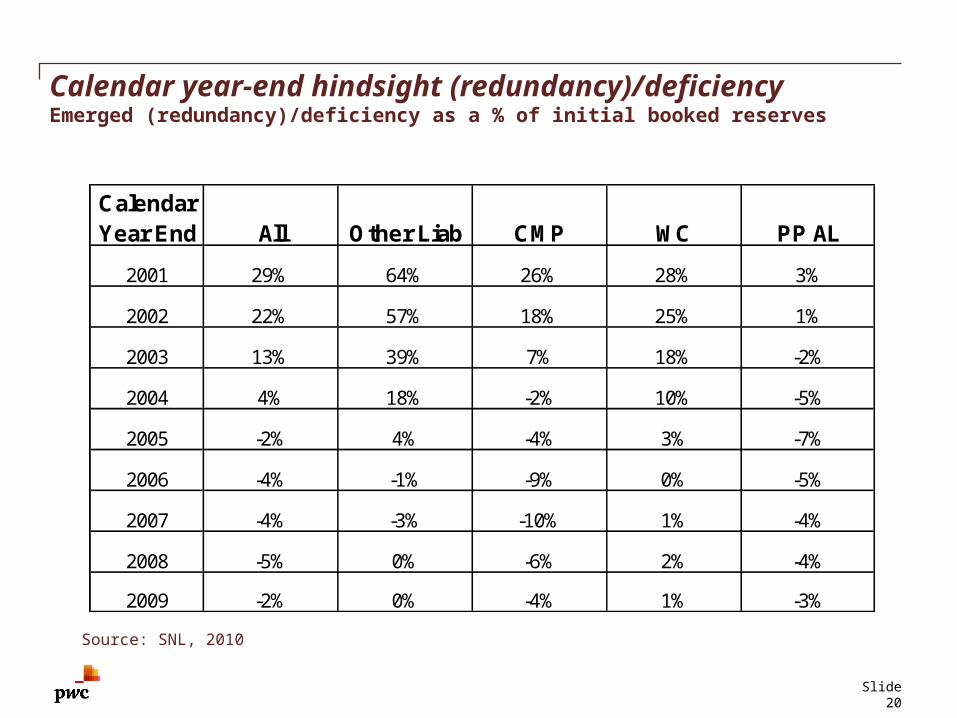
Calendar year-end hindsight (redundancy)/deficiencyEmerged (redundancy)/deficiency as a % of initial booked reserves
Source: SNL, 2010
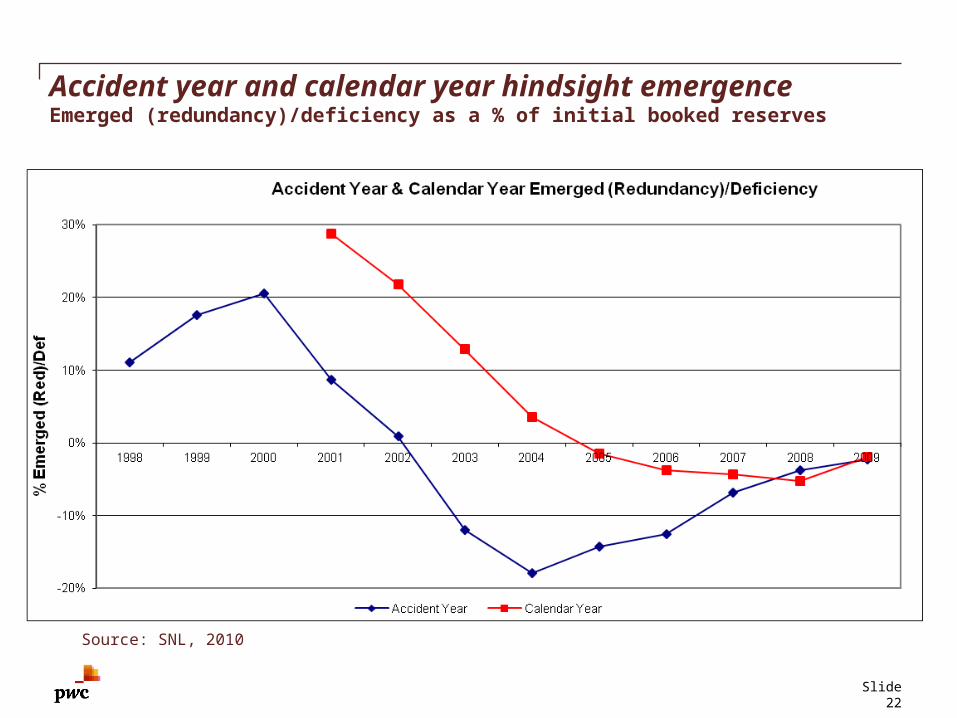
CalendarYear End All Other Liab CMP WC PP AL
2001 29% 64% 26% 28% 3%
2002 22% 57% 18% 25% 1%
2003 13% 39% 7% 18% -2%
2004 4% 18% -2% 10% -5%
2005 -2% 4% -4% 3% -7%
2006 -4% -1% -9% 0% -5%
2007 -4% -3% -10% 1% -4%
2008 -5% 0% -6% 2% -4%
2009 -2% 0% -4% 1% -3%
Slide 21
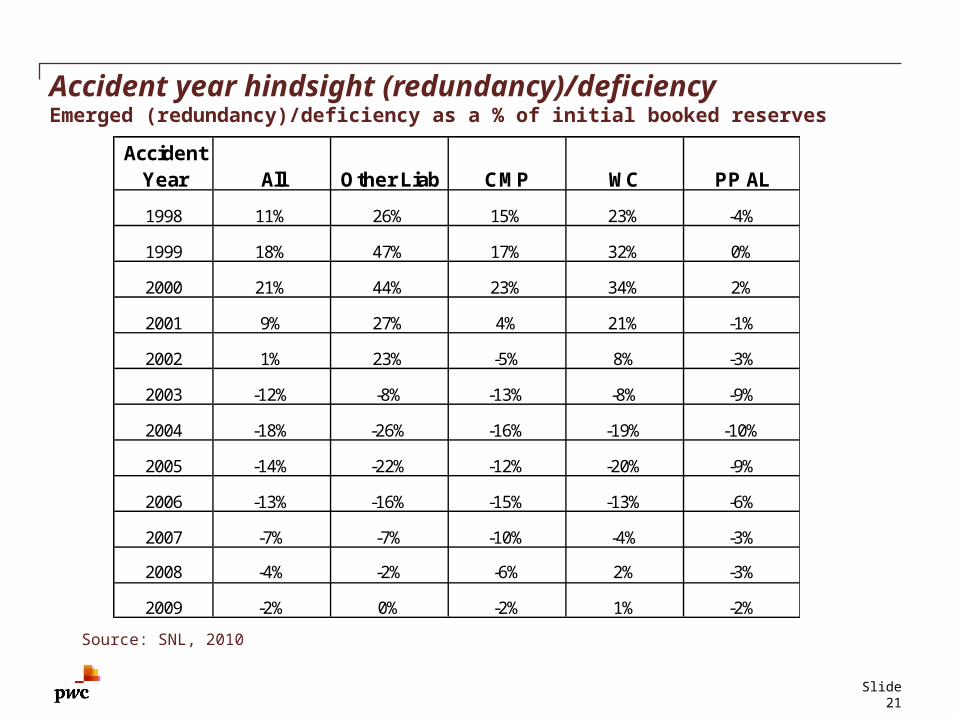
Accident year hindsight (redundancy)/deficiencyEmerged (redundancy)/deficiency as a % of initial booked reserves
Source: SNL, 2010
AccidentYear All Other Liab CMP WC PP AL
1998 11% 26% 15% 23% -4%
1999 18% 47% 17% 32% 0%
2000 21% 44% 23% 34% 2%
2001 9% 27% 4% 21% -1%
2002 1% 23% -5% 8% -3%
2003 -12% -8% -13% -8% -9%
2004 -18% -26% -16% -19% -10%
2005 -14% -22% -12% -20% -9%
2006 -13% -16% -15% -13% -6%
2007 -7% -7% -10% -4% -3%
2008 -4% -2% -6% 2% -3%
2009 -2% 0% -2% 1% -2%
Slide 22
Accident year and calendar year hindsight emergenceEmerged (redundancy)/deficiency as a % of initial booked reserves
Source: SNL, 2010

Implications on profitability
Slide 23
Slide 24
The current market
• Lengthy soft market
• Potentially inadequate rates on recent accident years
• Possible optimistic pricing & reserving
• 5 consecutive years of reserve take-downs
• Calendar year operating results propped up by prior year releases
• Releases mask accident year profitability issues
• Erosion of reserve redundancies
• Weak macro-economic environment
• Low investment income
Slide 25
What drives the move from a soft to hard market?
According to the III, need the confluence of 4 criteria
1.Sustained period of large underwriting losses
2.Material decline in surplus/capacity
3.Tight reinsurance market
4.Renewed underwriting & pricing discipline
Slide 26
Prospective implications of underwriting cycle
•Is trouble ahead?
• Several consecutive years of inadequate rates
• Reserve redundancies used up?
• Low investment returns
•Market reactions before turn?
• M&A
• Coverage modifications
Slide 27
PwC Actuarial & Insurance Management Solutions
Scott Cederburg, FCAS, [email protected](678) 419-1539
© 2011 PricewaterhouseCoopers LLP. All rights reserved. In this document, “PwC” refers to PricewaterhouseCoopers LLP, which is a member firm of PricewaterhouseCoopers International Limited, each member firm of which is a separate legal entity.
Thank you