1 UNDERWRITING COMES FIRST EFFECTIVELY BALANCE RISK AND RETURN OPERATE NIMBLY THROUGH THE CYCLE...
39
1 www.lancashiregroup.com UNDERWRITING COMES FIRST EFFECTIVELY BALANCE RISK AND RETURN OPERATE NIMBLY THROUGH THE CYCLE Investor Presentation Q4 2014
-
Upload
joel-alexander -
Category
Documents
-
view
214 -
download
0
Transcript of 1 UNDERWRITING COMES FIRST EFFECTIVELY BALANCE RISK AND RETURN OPERATE NIMBLY THROUGH THE CYCLE...
1
www.lancashiregroup.com
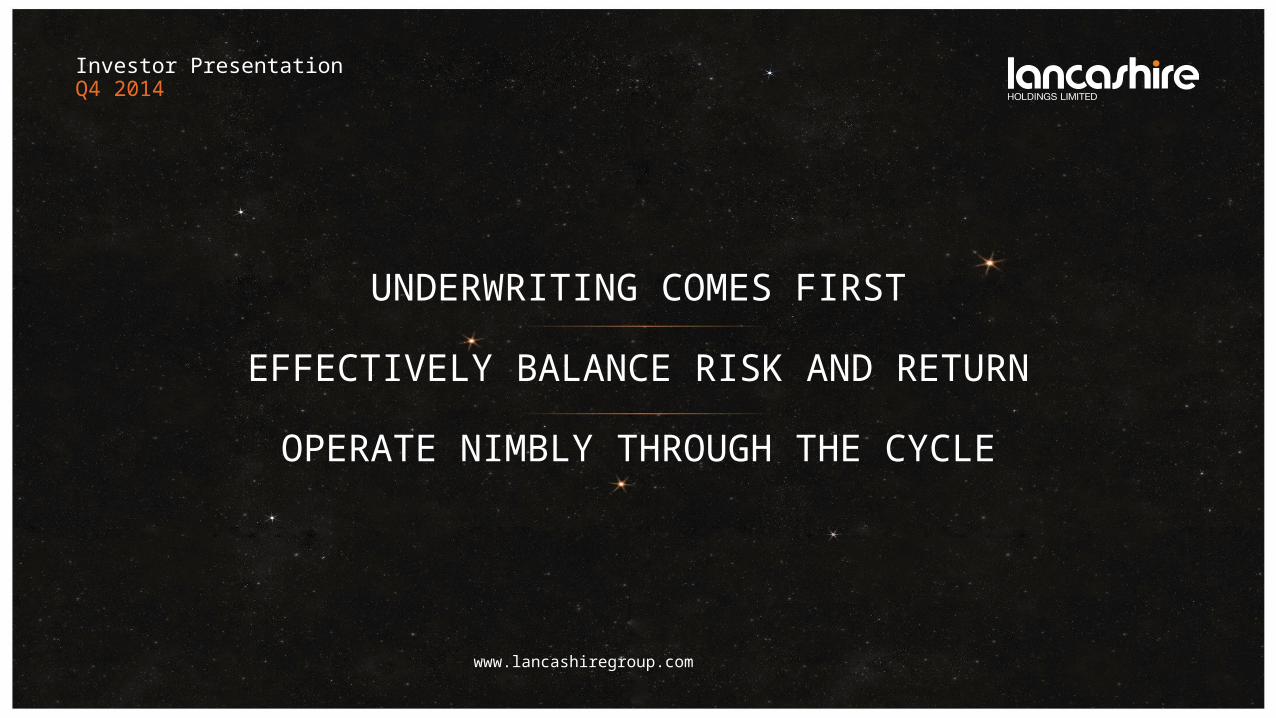
UNDERWRITING COMES FIRST
EFFECTIVELY BALANCE RISK AND RETURN
OPERATE NIMBLY THROUGH THE CYCLE
Investor PresentationQ4 2014

2
SAFE HARBOUR STATEMENTS
CERTAIN STATEMENTS AND INDICATIVE PROJECTIONS (WHICH MAY INCLUDE MODELED LOSS SCENARIOS) MADE IN THIS RELEASE OR OTHERWISE THAT ARE NOT BASED ON CURRENT OR HISTORICAL FACTS ARE FORWARD-LOOKING IN NATURE INCLUDING, WITHOUT LIMITATION, STATEMENTS CONTAINING THE WORDS “BELIEVES”, “ANTICIPATES”, “PLANS”, “PROJECTS”, “FORECASTS”, “GUIDANCE”, “INTENDS”, “EXPECTS”, “ESTIMATES”, “PREDICTS”, “MAY”, “CAN”, “WILL”, “SEEKS”, “SHOULD”, OR, IN EACH CASE, THEIR NEGATIVE OR COMPARABLE TERMINOLOGY. ALL SUCH STATEMENTS OTHER THAN STATEMENTS OF HISTORICAL FACTS INCLUDING, WITHOUT LIMITATION, THE GROUP’S FINANCIAL POSITION, RESULTS OF OPERATIONS, PROSPECTS, GROWTH, CAPITAL MANAGEMENT PLANS AND EFFICIENCIES, ABILITY TO CREATE VALUE, DIVIDEND POLICY, OPERATIONAL FLEXIBILITY, COMPOSITION OF MANAGEMENT, BUSINESS STRATEGY, PLANS AND OBJECTIVES OF MANAGEMENT FOR FUTURE OPERATIONS (INCLUDING DEVELOPMENT PLANS AND OBJECTIVES RELATING TO THE GROUP’S INSURANCE BUSINESS) ARE FORWARD LOOKING STATEMENTS. SUCH FORWARD-LOOKING STATEMENTS MAY INVOLVE KNOWN AND UNKNOWN RISKS, UNCERTAINTIES AND OTHER IMPORTANT FACTORS THAT COULD CAUSE THE ACTUAL RESULTS, PERFORMANCE OR ACHIEVEMENTS OF THE GROUP TO BE MATERIALLY DIFFERENT FROM FUTURE RESULTS, PERFORMANCE OR ACHIEVEMENTS EXPRESSED OR IMPLIED BY SUCH FORWARD-LOOKING STATEMENTS.
THESE FACTORS INCLUDE, BUT ARE NOT LIMITED TO: THE GROUP’S ABILITY TO INTEGRATE ITS BUSINESSES AND PERSONNEL, THE SUCCESSFUL RETENTION AND MOTIVATION OF THE GROUP’S KEY MANAGEMENT; THE INCREASED REGULATORY BURDEN FACING THE GROUP; THE NUMBER AND TYPE OF INSURANCE AND REINSURANCE CONTRACTS THAT THE GROUP WRITES OR MAY WRITE; THE PREMIUM RATES WHICH MAY BE AVAILABLE AT THE TIME OF SUCH RENEWALS WITHIN ITS TARGETED BUSINESS LINES; THE POSSIBLE LOW FREQUENCY OF LARGE EVENTS; POTENTIALLY UNUSUAL LOSS FREQUENCY; THE IMPACT THAT THE GROUP’S FUTURE OPERATING RESULTS, CAPITAL POSITION AND RATING AGENCY AND OTHER CONSIDERATIONS MAY HAVE ON THE EXECUTION OF ANY CAPITAL MANAGEMENT INITIATIVES OR DIVIDENDS; THE POSSIBILITY OF GREATER FREQUENCY OR SEVERITY OF CLAIMS AND LOSS ACTIVITY THAN THE GROUP’S UNDERWRITING, RESERVING OR INVESTMENT PRACTICES HAVE ANTICIPATED; THE RELIABILITY OF, AND CHANGES IN ASSUMPTIONS TO, CATASTROPHE PRICING, ACCUMULATION AND ESTIMATED LOSS MODELS; THE EFFECTIVENESS OF ITS LOSS LIMITATION METHODS; THE POTENTIAL LOSS OF KEY PERSONNEL; A DECLINE IN THE GROUP’S OPERATING SUBSIDIARIES’ RATING WITH A.M. BEST, STANDARD & POOR’S, MOODY’S OR OTHER RATING AGENCIES, INCLUDING A RATING DOWNGRADE OF LLOYD’S; INCREASED COMPETITION ON THE BASIS OF PRICING, CAPACITY, COVERAGE TERMS OR OTHER FACTORS; CYCLICAL DOWNTURNS OF THE INDUSTRY; THE IMPACT OF A DETERIORATING CREDIT ENVIRONMENT FOR ISSUERS OF FIXED INCOME INVESTMENTS; THE IMPACT OF SWINGS IN MARKET INTEREST RATES AND SECURITIES PRICES; A RATING DOWNGRADE OF, OR A MARKET DECLINE IN, SECURITIES IN ITS INVESTMENT PORTFOLIO; CHANGES IN GOVERNMENTAL REGULATIONS OR TAX LAWS IN JURISDICTIONS WHERE THE GROUP CONDUCTS BUSINESS; ANY OF LANCASHIRE’S BERMUDIAN SUBSIDIARIES BECOMING SUBJECT TO INCOME TAXES IN THE UNITED STATES OR THE UNITED KINGDOM; THE INAPPLICABILITY TO THE GROUP OF SUITABLE EXCLUSIONS FROM THE UK CFC REGIME; AND ANY CHANGE IN THE UK GOVERNMENT OR UK GOVERNMENT POLICY WHICH IMPACTS THE CFC REGIME .
ALL FORWARD-LOOKING STATEMENTS IN THIS RELEASE SPEAK ONLY AS AT THE DATE OF PUBLICATION. LANCASHIRE EXPRESSLY DISCLAIMS ANY OBLIGATION OR UNDERTAKING (SAVE AS REQUIRED TO COMPLY WITH ANY LEGAL OR REGULATORY OBLIGATIONS INCLUDING THE RULES OF THE LONDON STOCK EXCHANGE) TO DISSEMINATE ANY UPDATES OR REVISIONS TO ANY FORWARD-LOOKING STATEMENTS TO REFLECT ANY CHANGES IN THE GROUP’S EXPECTATIONS OR CIRCUMSTANCES ON WHICH ANY SUCH STATEMENT IS BASED.

3
LANCASHIRE GROUP
STICKING TO THE STRATEGY, MANAGING THE CYCLE
– “Lancashire's strategy since day one has always been to write the most exposure in a hard market and the least in a soft one. There are now abundant reinsurance and retrocession opportunities that allow us to maintain our core insurance and reinsurance portfolios, whilst significantly reducing net exposures and enhancing risk adjusted returns. From our peak exposures in April 2012, when losses had driven substantial market hardening, we have reduced exposures across the board. We will stick to our strategy in the knowledge that when an event comes, we are well prepared through all three of our platforms to take advantage of subsequent opportunity”
Alex Maloney, Q2 2014 results
– Lancashire’s strategy is designed to be robust across all phases of the market cycle and with the addition of the Kinesis and Cathedral platforms there are multiple ways to maintain or enhance the portfolio

4
STICKING TO THE STRATEGY, MANAGING THE CYCLE
– Multi-platform able to offer full spread of security to clients as they look to different options – rated company, Lloyd’s, collateralised
– Diversified across classes and between specialist insurance/reinsurance classes no reliance on a single dominant source of revenue or profit
– Disciplined underwriting – LICL/LUK have the daily UMCC call, Cathedral daily exception reporting, incentives linked to Group performance and profit
– Sticking to strategy – least net exposure in soft market – but able to retain most of core inwards portfolio through outwards optimisation
– Weighting to non-attritional classes key to cycle management
– Investment stance still aiming to be neutral but with a bias to risk-on in current environment
– Growth of fee income and future profit commission from Kinesis, Cathedral Names and consortium arrangements for aviation war

5
AN ESTABLISHED AND SUCCESSFUL MARKET LEADER
– Positive RoE in 33 out of 34 quarters, and in every financial year (6)
– Combined ratio below 100% in 33 out of 34 quarters, and in every financial year (6)
SUMMARY
INCEPTION TO DATE (1) 2012 2013 H1 2014
RETURN ON EQUITY 19.0% (2) 16.7% 18.9% 6.4%
NET PREMIUMS WRITTEN $589.3m (3) $576.1m $557.6m $494.9m
COMBINED RATIO (INCLUDING G&A) 61.1% 63.9% 70.2% 70.6%
LOSS RATIO 31.4% 29.9% 33.1% 34.5%
TOTAL INVESTMENT RETURN 3.6% (4) 3.1% 0.3% 0.9%
TOTAL SHAREHOLDER RETURN 422.1% 21.6% 21.3% (19.8%)
CAPITAL MANAGEMENT $1,898.4m of capital returned; 194.0% of original IPO capital raised returned (5)
$201.4m of dividends paid; $130m of debt
issued; No share repurchases
$325.6m of dividends paid; Issued 16.8m
common shares;No share repurchases
$72.7m of dividends paid (5); No share
repurchases
1. Period from December 13, 2005 to June 30, 2014 unless otherwise stated2. Compound annual rate of return on equity3. Average annual net premiums written to December 31, 20134. Average annual return on investments to December 31, 20135. Includes dividends of approximately $9.5 million declared in July 20146. Excludes period from the date of incorporation to December 31, 2005

6
OUR CROSS-CYCLE PERFORMANCE IS THE MOST CONSISTENT IN OUR PEER GROUP (1)
ROE RANKING IN PEER GROUP (1)
COMPANY (2) 2009 2010 2011 2012 20135YR AVG
LANCASHIRE
7 1 1 4 5 1
REN RE 2 2 10 3 4 2
BEAZLEY 12 5 2 1 1 3
AXIS 4 4 7 5 9 4
MONTPELIER 3 6 11 2 6 5
HISCOX 10 8 3 7 3 6
ENDURANCE 1 3 8 12 11 7
VALIDUS 6 11 4 8 8 8
AMLIN 5 9 12 6 2 9
CATLIN 9 10 6 9 7 10
ASPEN 8 7 5 11 12 11
ARGO 11 12 9 10 10 12 Lanc
ashi
re
Ren R
e
Beazley
Axis
Montp
elie
r
Avera
ge
Hiscox
Endu
ranc
e
Valid
us
Amlin
Catlin
Aspen
Argo
0%
5%
10%
15%
20%
25%
5 YEAR COMPOUND ANNUAL ROE (3)
1. Peer group as defined by the Board. Source: Company reports.2. Companies listed in order of average annual RoE ranking for the years 2009 - 2013.
Average ranking calculated as the sum of annual rankings for each year divided by five years.3. Compound annual returns for Lancashire and peers are from January 1, 2009 through December 31, 2013.

7
COMPOUND ANNUAL GROWTH RATE (CAGR) AND VOLATILITY CONSISTENT ACROSS THE CYCLE
– Lancashire shows limited volatility and strong consistency of results since 2008 including major loss years (2008, 2011) and benign years
– Risk averse investment stance means Lancashire missed the big swings of losses and subsequent gains in 2008 and 2009
– In 2008 with Hurricane Ike in the Gulf of Mexico and in 2011 with an unprecedented frequency of international property catastrophe losses, Lancashire still made profits

8
UNDERWRITING COMES FIRST

9
DIVERSIFIED PORTFOLIO AND PLATFORMS
68% insurance 32% reinsurance 35% nat-cat exposed 65% other
retrocession3%
terrorism8%
political risk4%
property cat13%
property other3%
GoM energy7%
offshore WW energy17%
energy other5%
aviation AV52 4%
aviation satellite1%
marine hull3%
marine other3%
property reinsurance12%
property D&F9%
marine cargo3%aviation and satellite
3%other Lloyd's2%
DIVERSIFIED PORTFOLIO AND PLATFORMS
Based on 2014 reforecast as of July 22, 2014. Estimates could change without notice in response to several factors, including trading conditions.
ENERGY 29% PROPERTY 31%AVIATION 5% MARINE 6% LLOYD’S 29%

10
CONSISTENCY - STRONGLY DIVERSIFIED BASE OF UNDERWRITING PROFIT
Underwriting income by line of business
– Lancashire has a broad base of profitable lines with strong weightings to low attrition classes
– The Group has multiple uncorrelated sources of income and is able to smooth individual event impacts
2006 2007 2008 2009 2010 2011 2012 2013 H1 2014
Property catastrophe Property terrorism Property political risk Property all othersEnergy WW offshore Energy GOM Energy all others Marine
POS
ITIV
EN
EG
A-
TIV
E
11
PROFITABILITY
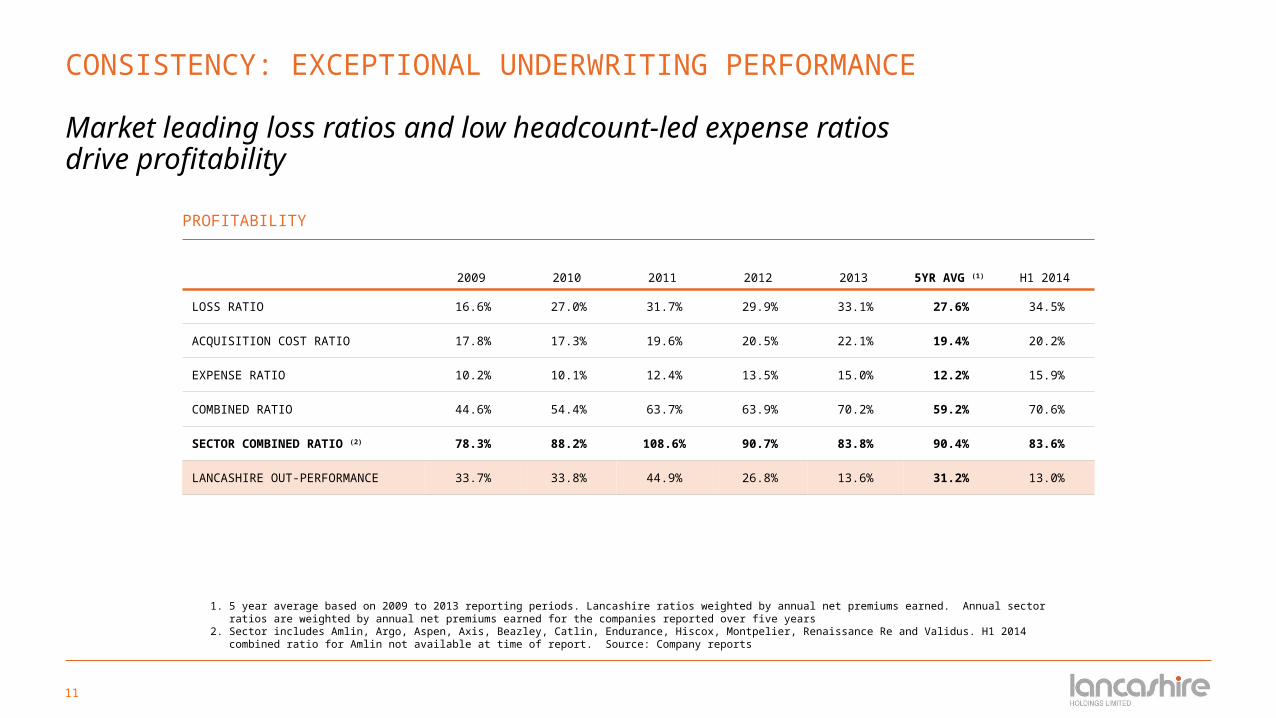
2009 2010 2011 2012 2013 5YR AVG (1) H1 2014
LOSS RATIO 16.6% 27.0% 31.7% 29.9% 33.1% 27.6% 34.5%
ACQUISITION COST RATIO 17.8% 17.3% 19.6% 20.5% 22.1% 19.4% 20.2%
EXPENSE RATIO 10.2% 10.1% 12.4% 13.5% 15.0% 12.2% 15.9%
COMBINED RATIO 44.6% 54.4% 63.7% 63.9% 70.2% 59.2% 70.6%
SECTOR COMBINED RATIO (2) 78.3% 88.2% 108.6% 90.7% 83.8% 90.4% 83.6%
LANCASHIRE OUT-PERFORMANCE 33.7% 33.8% 44.9% 26.8% 13.6% 31.2% 13.0%
1. 5 year average based on 2009 to 2013 reporting periods. Lancashire ratios weighted by annual net premiums earned. Annual sector ratios are weighted by annual net premiums earned for the companies reported over five years
2. Sector includes Amlin, Argo, Aspen, Axis, Beazley, Catlin, Endurance, Hiscox, Montpelier, Renaissance Re and Validus. H1 2014 combined ratio for Amlin not available at time of report. Source: Company reports
CONSISTENCY: EXCEPTIONAL UNDERWRITING PERFORMANCE
Market leading loss ratios and low headcount-led expense ratios drive profitability
12
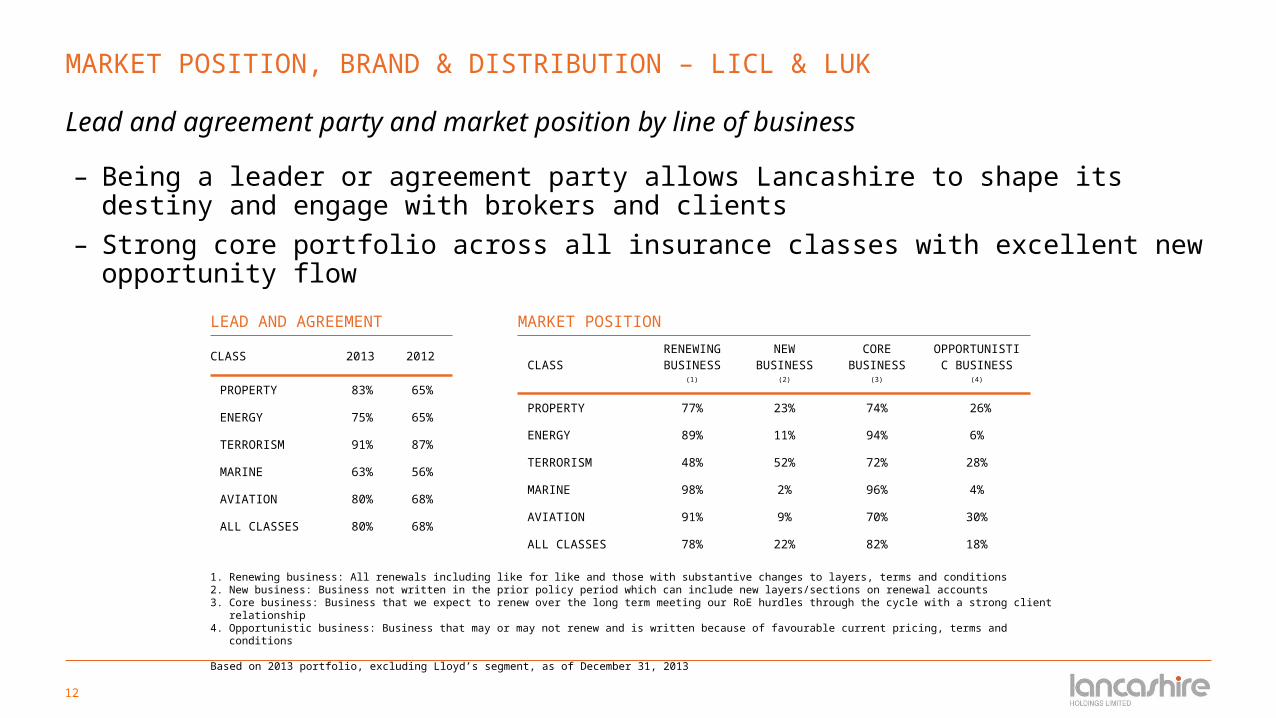
LEAD AND AGREEMENT
CLASS 2013 2012
PROPERTY 83% 65%
ENERGY 75% 65%
TERRORISM 91% 87%
MARINE 63% 56%
AVIATION 80% 68%
ALL CLASSES 80% 68%
1. Renewing business: All renewals including like for like and those with substantive changes to layers, terms and conditions2. New business: Business not written in the prior policy period which can include new layers/sections on renewal accounts3. Core business: Business that we expect to renew over the long term meeting our RoE hurdles through the cycle with a strong client relationship4. Opportunistic business: Business that may or may not renew and is written because of favourable current pricing, terms and conditions
Based on 2013 portfolio, excluding Lloyd’s segment, as of December 31, 2013
MARKET POSITION, BRAND & DISTRIBUTION – LICL & LUK
Lead and agreement party and market position by line of business
MARKET POSITION
CLASSRENEWING BUSINESS (1)
NEWBUSINESS
(2)
COREBUSINESS
(3)
OPPORTUNISTIC BUSINESS (4)
PROPERTY 77% 23% 74% 26%
ENERGY 89% 11% 94% 6%
TERRORISM 48% 52% 72% 28%
MARINE 98% 2% 96% 4%
AVIATION 91% 9% 70% 30%
ALL CLASSES 78% 22% 82% 18%
– Being a leader or agreement party allows Lancashire to shape its destiny and engage with brokers and clients
– Strong core portfolio across all insurance classes with excellent new opportunity flow

13
2013: MARKET POSITION, BRAND & DISTRIBUTION – LICL & LUK
Since inception, Lancashire has believed it is key that we are recognised as a major market and expert within our product lines
2009 2010 2011 2012 20130
10
20
30
40
50
60
NUMBER OF BROKERS WE DO BUSINESS WITH
– Lancashire writes a limited number of classes with a well defined appetite in each e.g. energy – worldwide offshore and Gulf of Mexico wind; marine – high-value fleets, war, mortgagees cover, etc
– Cultivates strong relationships with leading brokers in its niche areas– Brokers want to deal with market leaders, and Lancashire’s capacity ensures that we see business
early on when placements are being structured
Aon Benfield26%
Marsh14%
Willis13%
JLT12%
Guy Carpenter8%
Lloyd & Partners7%
Miller5%
Berry Palmer Lyle3%
Price Forbes & Partners
2%
AAA2%
Other8%
2013 BROKER INCOME

14
2013: MARKET POSITION, BRAND & DISTRIBUTION – CATHEDRAL
Each line of business uses specialist niche brokers
2009 2010 2011 2012 20130
10
20
30
40
50
60
70
80
90
100
NUMBER OF BROKERS WE DO BUSINESS WITH
– Diversity of producers means Cathedral holds more power than if writing just Aon, Marsh, Willis books– Niche focus of underwriting reflected in distribution channels– Cathedral has historically had a wide base of brokers producing its business. Although the major
brokers appear among the larger producers in many of the accounts, none have a controlling position on the portfolio
Aon Benfield23%
Marsh17%
Willis13%Towers Watson
5%
JLT3%Bowood
Partners2%
Robert Flemming
2%
Bell & Clements2%
Thompson2%
Gallagher2%
Others - over 1%
13%
Others - under 1%
16%
2013 BROKER INCOME

15
2013: GEOGRAPHIC DISTRIBUTION
– U.S. remains top source of income, as appropriate for market with largest insurance market and reinsurance spend– Good spread of risk worldwide, especially with LUK energy offshore, terrorism, Cathedral D&F binder and developing
LICL international property catastrophe excess of loss– Lloyd’s licensing will help Syndicate 3010 to support development of new areas such as Canada or Brazil for
terrorism and energy
Worldwide Offshore
34%
Worldwide, including
25%
U.S. and Canada
19%
Far East7%
Europe4%
Worldwide, excluding3%
Middle East3%
Rest of World
3%
LANCASHIRE GEOGRAPHIC PREMIUM ANALYSIS BY RISK LOCATION
U.K.16%
U.S.43%
Other EU member states
9%
Rest of World32%
CATHEDRAL GEOGRAPHIC PREMIUM ANALYSIS BY RISK LOCATION
1. Worldwide, including the U.S. and Canada, comprises insurance and reinsurance contracts that insure or reinsure risks in more than one geographic area2. Worldwide, excluding the U.S. and Canada, comprises insurance and reinsurance contracts that insure or reinsure risks in more than one geographic area, but that specifically exclude the U.S. and Canada.

16
KINESIS
MEAN LOSS SCENARIOS (10% EL) NO LOSS SCENARIOS
LIMIT OF $500M (1)
LIMIT OF $1B (1)
LIMIT OF $500M (1)
LIMIT OF $1B (1)
LANCASHIRE INVESTMENT (2) 38.3 76.5 38.3 76.5
ROL (NET) 23.5% 23.5% 23.5% 23.5%
ROE CONTRIBUTION, EXCLUDING PC (3) 0.5% 1.3% 0.7% 1.7%
ROE CONTRIBUTION, INCLUDING PC (3) 0.9% 2.1% 1.7% 3.6%
CURRENT YEAR EARNINGS ($M) (1)
UNDERWRITING FEES - 8.5% OF NPW 9.4 18.8 9.4 18.8
G&A COSTS (4) (5.7) (6.8) (6.1) (7.7)
LHL EQUITY PICKUP (5) 4.8 9.6 8.8 17.5
NET CY CONTRIBUTION TO LHL, AFTER NCI 7.6 19.6 11.2 26.7
SUBSEQUENT YEAR EARNINGS ($M)
PROFIT COMMISSIONS (6) 6.3 12.7 14.6 29.2
TOTAL PROFIT CONTRIBUTION 13.9 32.3 25.8 55.9
1. (1) Assumes 75% written at 1/1 and 25% at 1/7 from a standing start ie. no run-off earnings from prior years. Earnings patterns reflect the underlying risks attaching ie. not straight line
2. (2) LHL’s investment is 10%, up to a maximum of $100m invested 3. (3) Indicative assuming LHL target cross cycle RoE of 13% over the risk free rate, actual contribution will vary depending on actual RoE produced4. (4) Staff levels increase as limits increase; bonuses increase as total profit contribution increases: bonuses subject to caps5. (5) NPW less UW fees less losses less PC x 10% investment (subject to cap). PC provision is included in Kinesis Re in year 1 but not recognised as income by
KCM until year 2. Equity pickup ignores capital returns to LHL6. (6) Calculated as 16.5% after a 5% capital charge and recognised on a lag depending on loss experience
KINESIS CAPITAL MANAGEMENT INDICATIVE RESULTS

17
EFFECTIVELY BALANCE RISK & RETURN

18
MANAGING THE CYCLE – REDUCING NET EXPOSURES
0100200300400
NET EXPOSURES
01-Apr-12
01-Jul-14
The group has developed the estimates of losses expected from certain catastrophes for its portfolio of property and energy contracts using commercially available catastrophe models, which are applied and adjusted by the group. These estimates include assumptions regarding the location, size and magnitude of an event, the frequency of events, the construction type and damageability of property in a zone, and the cost of rebuilding property in a zone, among other assumptions. Return period refers to the frequency with which losses of a given amount or greater are expected to occur.
Gross loss estimates are net of reinstatement premiums and gross of outward reinsurance, before income tax. Net loss estimates are net of reinstatement premiums and net of outward reinsurance, before income tax.
The estimates of losses above are based on assumptions that are inherently subject to significant uncertainties and contingencies. In particular, modeled loss estimates do not necessarily accurately predict actual losses, and may significantly deviate from actual losses. Such estimates, therefore, should not be considered as a representation of actual losses and investors should not rely on the estimated exposure information when considering investment in the group. The group undertakes no duty to update or revise such information to reflect the occurrence of future events.
– Since April 2012, which was the high-tide mark of the pricing cycle, the Group has reduced PMLs across all key exposures, in spite of the addition of Cathedral
– PMLs are not perfect predictors of losses but they do provide consistent measures of catastrophe risk levels
NET P
ML
($M
)
ZONE (RETURN PERIOD)
19
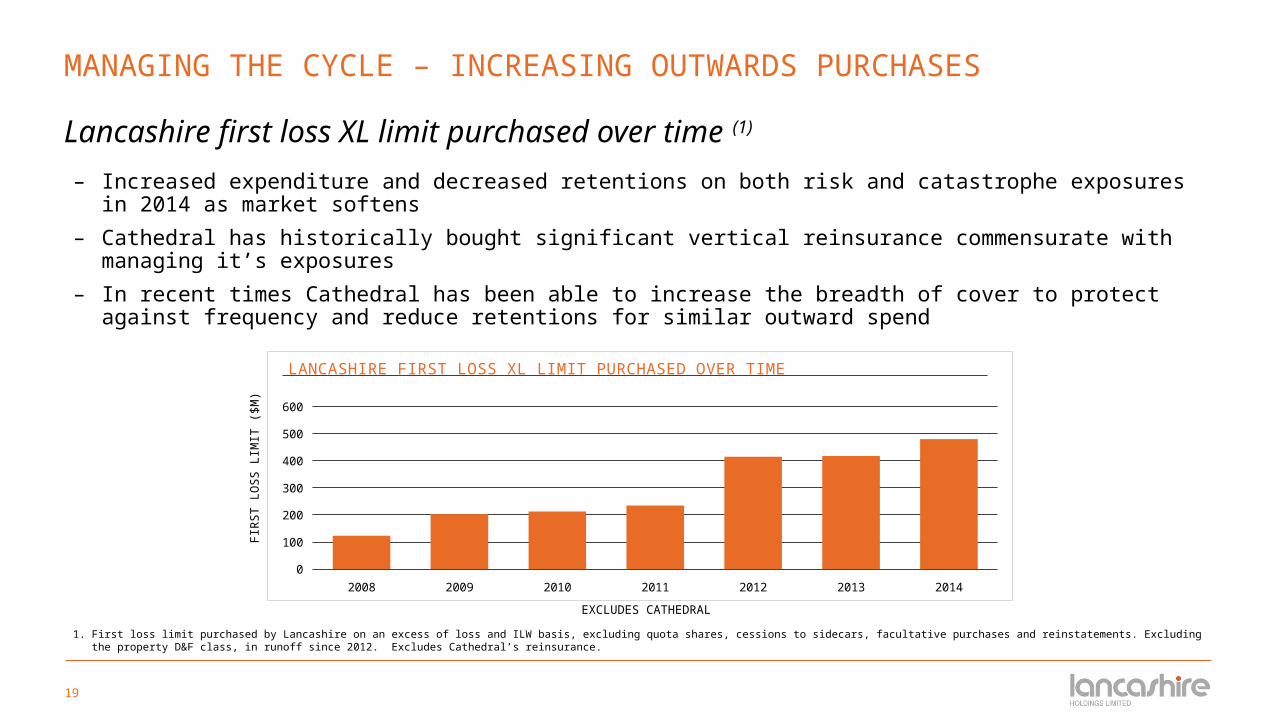
MANAGING THE CYCLE – INCREASING OUTWARDS PURCHASES
Lancashire first loss XL limit purchased over time (1)
2008 2009 2010 2011 2012 2013 20140
100
200
300
400
500
600
LANCASHIRE FIRST LOSS XL LIMIT PURCHASED OVER TIME
– Increased expenditure and decreased retentions on both risk and catastrophe exposures in 2014 as market softens
– Cathedral has historically bought significant vertical reinsurance commensurate with managing it’s exposures
– In recent times Cathedral has been able to increase the breadth of cover to protect against frequency and reduce retentions for similar outward spend
FIR
ST L
OS
S L
IMIT
($
M)
EXCLUDES CATHEDRAL
1. First loss limit purchased by Lancashire on an excess of loss and ILW basis, excluding quota shares, cessions to sidecars, facultative purchases and reinstatements. Excluding the property D&F class, in runoff since 2012. Excludes Cathedral’s reinsurance.

20
MANAGING THE CYCLE – STRONG WEIGHTING TO LOW-ATTRITION CLASSES
Accident year attritional loss ratios – 5 year average
Endu
ranc
e
Argo
Gro
up
Axis Cap
ital
Beazley
Aspen
Amlin
Catlin
Hisco
x
Avera
ge
Mon
tpel
ier R
e
Valid
us
Lanc
ashi
re (e
stim
ated
)
Renai
ssan
ce R
e
Lanc
ashi
re (a
ctua
l)
0%
10%
20%
30%
40%
50%
60%
70%
LOSS RATIOS – 5 YEAR AVERAGE
– Carefully balance classes with known attritional exposure (energy, marine, lower layer cat xl) with low attrition exposures (terrorism, AV52, higher layer cat xl)
– In a softening market Lancashire can absorb price deterioration better than its peers coming from such a low attritional base
Source: D&P and Numis analysis 2009-2013 ratios are as reported adjusted for disclosed catastrophe and prior year reserve development

21
RESERVE ADEQUACY
Ultimate development by accident year – LICL & LUK
4 8 12 16 20 24 28 32 36
2006
2007
2008
2009
2010
2011
2012
2013
DEVELOPMENT QUARTER
ULTIM
ATE
LO
SS
ES

22
RESERVE ADEQUACY
Reserve development - Cathedral
12 24 36 48 60 72 84 96 108 1200
10
20
30
40
50
60
70
80
90
100
2003
2004
2005
2006
2007
2008
2009
2010
2011
2012
DEVELOPMENT MONTH
ULR
%
ULR = Underwriting year net ultimate loss ratio

23
EFFECTIVELY BALANCE RISK AND RETURN – CONSERVATIVE INVESTMENT PHILOSOPHY
– Our market outlook remains subdued:
• While the U.S. continues to generate mostly positive economic data, geo-political headlines are adding volatility
• The Federal Reserve continues to taper their bond purchases, and are expected to begin raising interest rates within the next 12 months
– Preservation of capital continues to be paramount and we will focus on interest rate risk
• Maintain reduced investment portfolio duration, despite low yields
• Mitigate interest rate risk:• Increased exposure to floating rate notes
• Given the increased volatility and longer duration of EMD, a minimal exposure to this asset class is held
• Added a small allocation to a number of hedge funds creating a low volatility hedge fund portfolio and adding diversification to the overall investment portfolio
• Tail risk hedge:• Derivative instruments held to protect the investment portfolio from a rapid rise in short-term interest rates
• Continue monitoring risk/return trade off in the portfolio:• Maintain a balance between interest rate duration and credit spread duration to neutralise the impact of the risk on /risk off trade
• Modest bias to the risk-on trade

24
EFFECTIVELY BALANCE RISK AND RETURN
Capital preservation and interest rate risk management
cash and short term securities;
18%
other govern-
ment bonds and debt; 5%
U.S. gov-ernment
bonds and agency
debt; 17%
corporates and bank
loans; 34%
others; 3%
agency structured products;
9%
non agency structured products;
10%
hedge funds; 4%
ASSET ALLOCATION
AAA24%
AA43%
A17%
BBB9%
BB or below7%
CREDIT QUALITYTotal portfolio at 30 June 2014 = $2,436m
DURATION1.3 YEARS
AVERAGEAA-
2008 2009 2010 2011 2012 20130
5
10
15
20
25
HEDGE FUND PORTFOLIO PRO-FORMA RETURNS
Portfolio has a history of strong performance
Other includes fixed income funds, fixed income - at fair value through profit and loss, equity securities and other investments.

25
OPERATE NIMBLY THROUGH THE CYCLE

26
CAPITAL MANAGEMENT
2007$M
2008$M
2009$M
2010$M
2011$M
2012$M
2013$M
YTD 2014(
5)
$M
TOTAL
$M
SHARE REPURCHASES 100.2 58.0 16.9 136.4 - - - - 311.5
SPECIAL DIVIDENDS (1) 239.1 - 263.0 264.0 152.0 172.6 295.9 42.11,428.
7
ORDINARY DIVIDENDS – INTERIM (1) - - 10.5 9.4 9.5 9.6 10.5 9.5 59.0
ORDINARY DIVIDENDS – FINAL (1) - - - 20.8 18.9 19.2 19.2 21.1 99.2
TOTAL RETURNED CAPITAL 339.3 58.0 290.4 430.6 180.4 201.4 325.6 72.71,898.
4
AVERAGE PRICE OF SHARE REPURCHASE (2)
102.2%
88.4% 98.5% 97.9% N/A N/A N/A N/A 97.6%
PRICE TO BOOK (3) 1.1 0.9 1.0 1.1 1.5 1.6 1.8 1.5 N/A
WEIGHTED AVERAGE DIVIDEND YIELD (4) 15.2% N/A 18.1% 18.0% 8.4% 8.3% 12.3% 3.1% N/A
1. Dividends included in the financial statement year in which they were recorded. 2. Ratio of price paid compared to book value.3. Price to book is calculated as the year end share price divided by the year end book value. 2014 is based on the share price and book value at June 30,
2014.4. Dividend yield is calculated as the total calendar year cash dividends divided by the year end share price. 2014 dividend yield is based on the share price
at June 30, 2014. 5. This includes the dividends of $9.5 million that were declared in July 2014.
OPERATE NIMBLY THROUGH THE CYCLE
proven record of active capital management
194.0% of original IPO share capital has been returned to shareholders (5)

27
FINANCIAL FLEXIBILITY - CAPITAL MANAGEMENT
Constant adjustment of capital
MAR APR MAY JUN JUL AUG SEP OCT NOV DEC JAN FEB
AN EXAMPLE OVER 12 MONTHS
special dividend share repurchases ordinary dividends
regulator min capital internal min capital target headroom
'excess' capital
other factors: capital cost and availability, future opportunities, clarity of trading conditions, time of year, share price
* In the event of eg a major U.S. windstorm, we may raise equity to take advantage of post loss opportunities
EXCESS CAPITAL BUILDS DURING THE YEAR IF
PROFITS EXCEED SHARE REPURCHASES &
ORDINARY DIVIDENDS
OUR TARGET CAPITAL HEADROOM INCREASES IN HURRICANE SEASON ABSENT SIGNIFICANT
LOSSES *
SHARE REPURCHASES
CONTINUOUS IF EXCESS CAPITAL
EXISTS AND PRICE ACCEPTABLE
SPECIAL DIVIDEND IN Q4 IF INSUFFICIENT
OPPORTUNITIES AHEAD SOME CAPITAL
WITHHELD IF OUTLOOK UNCERTAIN
SPECIAL DIVIDEND IN Q1 IF CAPITAL NOT UTILISED AT 1/1 RENEWALS AND
INSUFFICIENT OPPORTUNITIES AHEAD
REVIEW OF STRESS TESTS AND APPROVAL
OF BUSINESS PLAN WITH CAPITAL PROJECTION AT THE NOVEMBER BOARD
MEETINGS

28
MANAGING THE CYCLE - DIVIDEND YIELD (1)
1. Dividend yield is calculated as the total calendar year cash dividends divided by the year end share price. Dividends include recurring dividends, special dividends and B shares issuances. Source: Bloomberg.
2. Sector includes Amlin, Argo, Aspen, Axis, Beazley, Catlin, Endurance, Hiscox, Montpelier, Renaissance Re and Validus. 3. 5 year average based on the 2009 to 2013 reporting periods.
2009 2010 2011 2012 2013 5 year av-er-
age
0%
2%
4%
6%
8%
10%
12%
14%
16%
18%
20%
DIVIDEND YIELD
LHL accident year underwriting income Lancashire ordinary dividend
(3)
(2)

29
CROSS CYCLE CONSISTENCY – ROE
five year standard deviation(1) in RoE
1. Standard deviation is a measure of variability around the mean.2. Compound annual returns for Lancashire and sector are from January 1, 2009 through December 31, 2013. RoE calculated as the internal rate of return of the change in FCBVS in the period plus dividends
accrued. For Amlin, Beazley, Catlin, Hiscox and Ren Re, basic book value per share is used as FCBVS is not reported by these companies. Source: Company reports.
2.5% 5.0% 7.5% 10.0% 12.5% 15.0% 17.5% 20.0%0%
5%
10%
15%
20%
25%
Lancashire
CatlinAmlinHiscox Endurance
Ren Re
Argo
ValidusMontpelierAxis
Beazley
Aspen
5 YEAR STANDARD DEVIATION
FIVE YEAR STANDARD DEVIATION OF ROE
FIV
E Y
EA
R R
OE
(2
)
– Lancashire has one of the best performances and yet the lowest volatility versus peers
– Evidence of adherence to business plan and strong risk management and a proven,
– successful cross-cycle strategy

30
CONCLUSION

31
CONCLUSION
– Lancashire has one of the best performances and yet the lowest volatility in the London and Bermudian markets
– Our strategy is designed to cope with hard and soft markets, managing capital and exposures to provide superior risk-adjusted returns across the cycle
– Group management is fully integrated and has decades of experience in rated company, Lloyd’s and collateralised markets
– Group profitability is not overly dependant on property reinsurance, with strong weightings to speciality classes with proven RoE potential
– A well diversified portfolio across multiple lines and geographies as a base to trade across the cycle
– Opportunities to grow in non or low correlated lines within Syndicate 3010
• This year Lloyd’s has approved and we are trading Lancashire led energy and terror lines in 3010
• Lloyd’s has approved and we are trading in specialty aviation and war (supported by the Lloyd’s consortium) and general specialist aviation business, led by the market leading teams

32
APPENDICES

33
PROPERTY: REINSURANCE
LANCASHIRE GROUP APPROACH
− LANCASHIRE BERMUDA (LICL)
• Cat XL US Portfolio – Built up a core book of nationwide and regional clients attaching at the upper end of programmes
• Cat XL International Portfolio – Core book of excess layers. Will gradually reduce in opportunistic areas such as New Zealand and Asia as pricing reduces to less acceptable levels following post loss pricing
• Retro – Continue to exit portfolio as rating diminishes
• Risk Excess – Small portfolio complementing Cat XL core client portfolio
− CATHEDRAL SYNDICATE 2010
• Cat XL US Portfolio – Lead a core portfolio of Mutual Companies of which half have more than a 20 year relationship with the underwriter(s)
• Cat XL International Portfolio – Emphasis on regional clients in first world countries from small to mega accounts
• Risk Excess – Complements the US Mutual portfolio focused and the upper end of programmes
MARKET OUTLOOK
– Retro – very competitive market with competition from third party capital driving significant reductions in rates and terms and conditions broadening
– Cat XL US Portfolio – rates under continued downward pressure and expect pressure on policy terms and conditions at 1/1
– Cat XL International Portfolio – rates under pressure generally other in small pockets of loss affected regions, such as primary European layers, where rates are seeing small upwards movement
– Risk Excess – gradual softening of rates but underlying rating remains strong
LICL STATISTICSPROPERTY CATASTROPHE REINSURANCE 2006 2007 2008 2009 2010 2011 2012 2013
YTD 201
4 ITD
CUMULATIVE RPI
100 100 97 100 92 100 116 114 99 N/A
COMBINED RATIO EXCL. G&A (%)
20.3 15.6 47.2 14.9 24.4 103.3 44.9 29.4 21.0 42.7
GWP ($M) 0.6 19.3 23.4 76.3 98.1 82.0 96.8 97.5 104.8
598.8

34
PROPERTY: DIRECT & FACULTATIVE
LANCASHIRE GROUP APPROACH
−CATHEDRAL SYNDICATE 2010
• US Binding Authorities – Core book of long standing binders with a commercial bias and an average line size < $1m
• International Binding Authorities – Portfolio of low attritional commercial business in Canada, Australasia and the Caribbean
• US Open Market – Focus of ‘soft’ occupancies with low to mid level excess of loss portfolio and an average line of < $2m. Preference away from typical Fortune 500 client base shielding portfolio from the worst of the rate softening
• International Open Market – Small to midsized general portfolio with a current focus on Mexico, Caribbean and NZ
−LANCASHIRE GROUP
• Retain a small number risks to support terrorism and energy cross class relationship clients
• Retain the ability with the group to respond to market dislocations through syndicate 2010 leadership ability and reputation and Lancashire’s nimbleness in deploying capital
MARKET OUTLOOK
– US Binding Authorities – Stable with some marginal increases in some areas
– International Binding Authorities – Stable with rates a good levels. Some softening in areas such as NZ but coming off post loss peaks and some marginal improvements in areas such as Canada.
– US Open Market – Rates under pressure as competition intensifies albeit areas of the portfolio remain adequately priced
– International Open Market – In general rates under pressure other in than in small pockets of loss affected regions such as Mexico
35
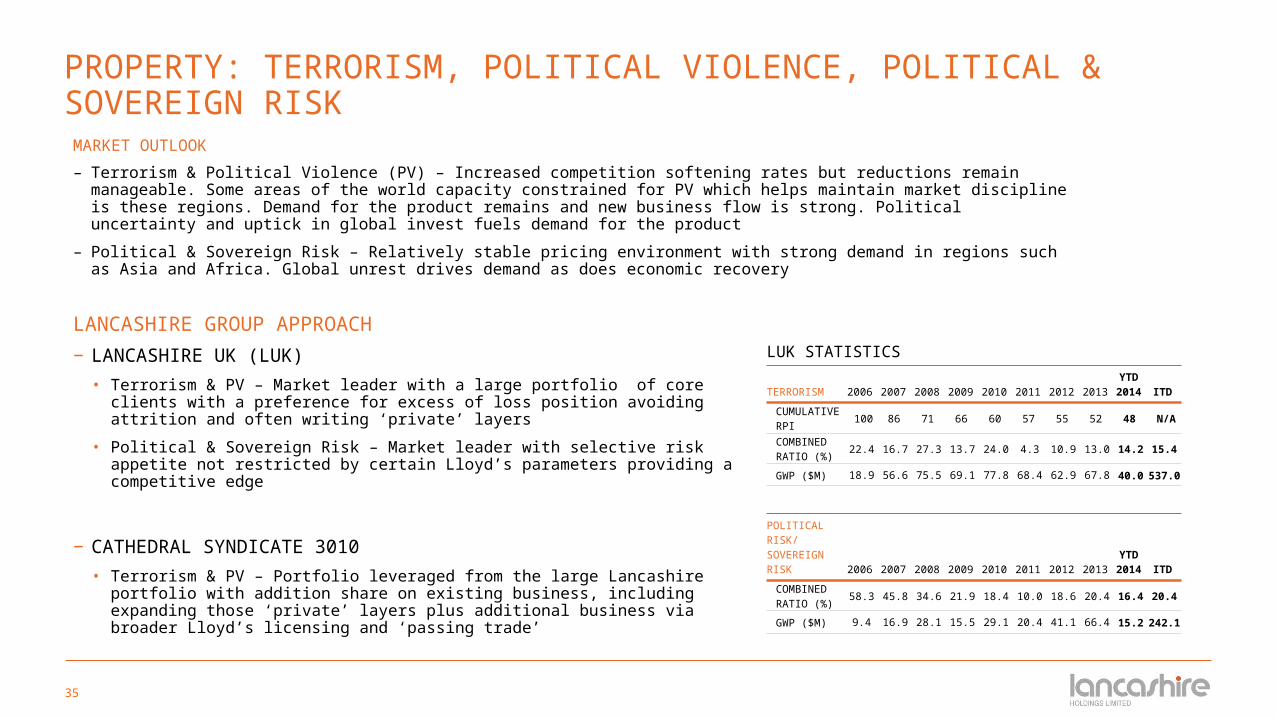
PROPERTY: TERRORISM, POLITICAL VIOLENCE, POLITICAL & SOVEREIGN RISK
LANCASHIRE GROUP APPROACH
−LANCASHIRE UK (LUK)
• Terrorism & PV – Market leader with a large portfolio of core clients with a preference for excess of loss position avoiding attrition and often writing ‘private’ layers
• Political & Sovereign Risk – Market leader with selective risk appetite not restricted by certain Lloyd’s parameters providing a competitive edge
−CATHEDRAL SYNDICATE 3010
• Terrorism & PV – Portfolio leveraged from the large Lancashire portfolio with addition share on existing business, including expanding those ‘private’ layers plus additional business via broader Lloyd’s licensing and ‘passing trade’
MARKET OUTLOOK
– Terrorism & Political Violence (PV) – Increased competition softening rates but reductions remain manageable. Some areas of the world capacity constrained for PV which helps maintain market discipline is these regions. Demand for the product remains and new business flow is strong. Political uncertainty and uptick in global invest fuels demand for the product
– Political & Sovereign Risk – Relatively stable pricing environment with strong demand in regions such as Asia and Africa. Global unrest drives demand as does economic recovery
LUK STATISTICS
TERRORISM 2006 2007 2008 2009 2010 2011 2012 2013
YTD 201
4 ITD
CUMULATIVE RPI
100 86 71 66 60 57 55 52 48 N/A
COMBINED RATIO (%)
22.4 16.7 27.3 13.7 24.0 4.3 10.9 13.0 14.2 15.4
GWP ($M) 18.9 56.6 75.5 69.1 77.8 68.4 62.9 67.8 40.0537.
0
POLITICAL RISK/ SOVEREIGN RISK 2006 2007 2008 2009 2010 2011 2012 2013
YTD 201
4 ITD
COMBINED RATIO (%)
58.3 45.8 34.6 21.9 18.4 10.0 18.6 20.4 16.4 20.4
GWP ($M) 9.4 16.9 28.1 15.5 29.1 20.4 41.1 66.4 15.2242.
1
36
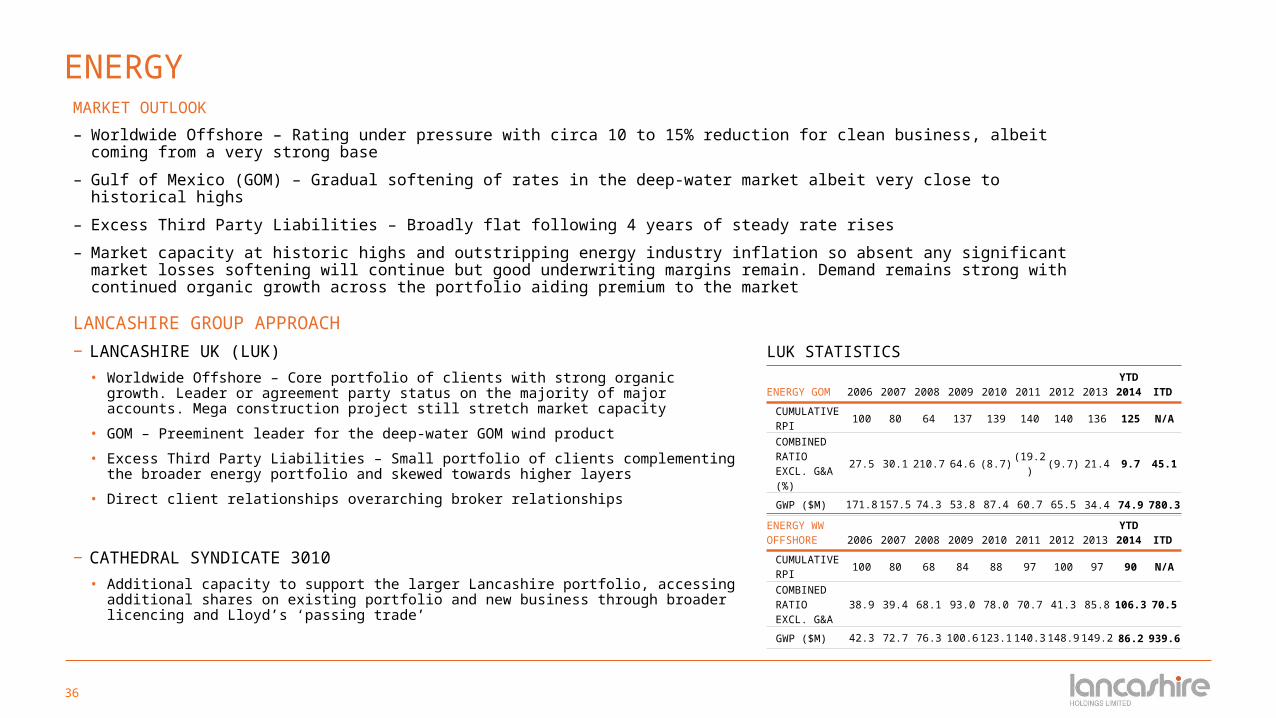
ENERGY
LANCASHIRE GROUP APPROACH
−LANCASHIRE UK (LUK)
• Worldwide Offshore – Core portfolio of clients with strong organic growth. Leader or agreement party status on the majority of major accounts. Mega construction project still stretch market capacity
• GOM – Preeminent leader for the deep-water GOM wind product
• Excess Third Party Liabilities – Small portfolio of clients complementing the broader energy portfolio and skewed towards higher layers
• Direct client relationships overarching broker relationships
−CATHEDRAL SYNDICATE 3010
• Additional capacity to support the larger Lancashire portfolio, accessing additional shares on existing portfolio and new business through broader licencing and Lloyd’s ‘passing trade’
MARKET OUTLOOK
– Worldwide Offshore – Rating under pressure with circa 10 to 15% reduction for clean business, albeit coming from a very strong base
– Gulf of Mexico (GOM) – Gradual softening of rates in the deep-water market albeit very close to historical highs
– Excess Third Party Liabilities – Broadly flat following 4 years of steady rate rises
– Market capacity at historic highs and outstripping energy industry inflation so absent any significant market losses softening will continue but good underwriting margins remain. Demand remains strong with continued organic growth across the portfolio aiding premium to the market
LUK STATISTICS
ENERGY GOM 2006 2007 2008 2009 2010 2011 2012 2013
YTD 201
4 ITD
CUMULATIVE RPI
100 80 64 137 139 140 140 136 125 N/A
COMBINED RATIO EXCL. G&A (%)
27.5 30.1 210.7 64.6 (8.7) (19.2) (9.7) 21.4 9.7 45.1
GWP ($M) 171.8 157.5 74.3 53.8 87.4 60.7 65.5 34.4 74.9780.
3
ENERGY WW OFFSHORE 2006 2007 2008 2009 2010 2011 2012 2013
YTD 201
4 ITD
CUMULATIVE RPI
100 80 68 84 88 97 100 97 90 N/A
COMBINED RATIO EXCL. G&A
38.9 39.4 68.1 93.0 78.0 70.7 41.3 85.8106.
370.5
GWP ($M) 42.3 72.7 76.3 100.6 123.1 140.3 148.9 149.2 86.2939.
6

37
AVIATION & SATELLITE
LANCASHIRE GROUP APPROACH
−LANCASHIRE UK (LUK)
• AV52 – Established market leader with significant capacity writing excess layers
• Satellite – Follow market writing modest lines on open market placements for both launch and in-orbit risks
−CATHEDRAL SYNDICATE 2010 & 3010
• Aviation Reinsurance (2010) – Established market leader with a portfolio of proportional, general aviation XL and aviation war
• Satellite (2010) – Provide capacity to market consortium SATEC
• Aviation War (3010) – New team are the market leaders for all open market war business in London. Backed by a consortium earning over rider and profit commissions.
• General Aviation (3010) – Market leader for small niche areas of the aviation Hull & Liability market with risks such as helicopters and private jets
MARKET OUTLOOK
– AV52 – Continued softening however recent market events could help improve rating environment during the upcoming renewal season. Organic growth from US airlines re-entering the commercial market given uncertainty around US government coverage
– Aviation War – Recent market losses have ‘turned’ the market. Extent of rate rises not yet known given uncertainty around loss quantum and a lack of significant renewals until Q3
– Aviation Reinsurance – Until recent loss activity rates had continued to soften given ample supply of capacity. Reaction to losses will be established later in the year
– General Aviation – More stable market for niche area of the market we target
– Satellite – Losses have yet to materially impact the market. Increases for launch vehicles with losses but softening on those without losses and in-orbit risks
LUK STATISTICS
AVIATION 2006 2007 2008 2009 2010 2011 2012 2013
YTD 201
4 ITD
CUMULATIVE RPI (AV52)
100 80 69 68 62 59 55 49 44 N/A
COMBINED RATIO (%)
19.9 19.5 31.2 22.7 11.7 8.7 29.1 67.2 91.5 29.9
GWP ($M) 64.5 84.2 71.6 61.2 50.8 47.1 45.9 48.9 31.7505.
9

38
MARINE
LANCASHIRE GROUP APPROACH
−LANCASHIRE UK (LUK)
• Marine Hull & Builders Risk – Risk selection is paramount given rating environment. Focus on niche sector of the marine market being high value vessels such as LNG’s and cruise ships and established yards for builders risk
• Marine War – Participate on all the major market line-slips with significant shares
−LANCASHIRE BERMUDA (LICL)
• P&I – Significant provider of capacity of the original placement with capacity skewed towards the top of the programme
−CATHEDRAL SYNDICATE 3010
• Cargo – Established relationship driven portfolio with a diverse global spread providing complementary rather than clashing catastrophe exposure. Elements of special and fine art within the portfolio
MARKET OUTLOOK
– Marine Hull & Builders Risk – Small reduction for loss free hull clients with loss affected risks seeing respectable rate rises. Builders risks remain relatively well rated with good margins
– Marine War – Reduced frequency of losses softening rates
– P&I – Further deterioration of Costa Concordia and other prior year losses will assist market discipline for renewals in February 2015
– Cargo – Ample capacity softening rates for large high profile risks. Some small pockets and regions create niche areas of opportunity with stable rating
LUK & LICL STATISTICS
MARINE 2006 2007 2008 2009 2010 2011 2012 2013
YTD 201
4 ITD
CUMULATIVE RPI
100 88 80 82 80 79 86 89 93 N/A
COMBINED RATIO (%)
55.3 76.6 81.4 68.3 67.4 37.7 104.5 140.2124.
581.0
GWP ($M) 53.0 76.9 78.6 73.7 76.4 76.4 81.0 63.0 48.6627.
6

39
OUR GOAL: TO PROVIDE AN ATTRACTIVE RISK-ADJUSTED TOTAL RETURN TO SHAREHOLDERS OVER THE LONG-TERM
Lancashire total shareholder return vs. major index returns
Dec 0
5
Mar
06
Jun
06
Sep
06
Dec 0
6
Mar
07
Jun
07
Sep
07
Dec 0
7
Mar
08
Jun
08
Sep
08
Dec 0
8
Mar
09
Jun
09
Sep
09
Dec 0
9
Mar
10
Jun
10
Sep
10
Dec 1
0
Mar
11
Jun
11
Sep
11
Dec 1
1
Mar
12
Jun
12
Sep
12
Dec 1
2
Mar
13
Jun
13
Sep
13
Dec 1
3
Mar
14
Jun
14
(100%)
(50%)
0%
50%
100%
150%
200%
250%
300%
350%
400%
450%
500%
S&P 500 FTSE 250 FTSE 350 Insurance
S&P Financials S&P Banking Lancashire
TO
TA
L S
HA
RE
HO
LD
ER
RE
TU
RN