


Languages
Pages
Legal

The National Educational Landscape and the Design of Museum-Based Professional
Development Programs
CILS ILC
October 2003
Inverness Research Associates

Inverness, California

The National Landscape
Informal ScienceEducationInstitutions
The Formal K-16Educational System

How many museums in U.S.?
~16,000 museums (of all types)
• History 25%(4,016)
• Art museums 23%(3,680)
• Historic Home/Site 12% (1,872)
• Natural History/Anthropology 4% (672)
• Science Centers 4% (608)
• Children’s/Youth museums 3% (560)
• Zoos and Aquaria 3% (496)
• Etc…

Subset of US Museums: Science-rich Informal Institutions
Science Centers Planetariums Aquariums and Zoos Children’s Museums Nature Centers Natural History Museums Arboretums and Botanical Gardens

Science-Rich Institutions
Scale• ~ 2000 institutions
(Science Centers, Planetariums, Zoos, Aquaria, Natural History Museums, Children Museums, Nature Centers, Arboretums and Botanical Gardens …)
• 25.8 million schoolchildren served annually (~40% of all U.S. children…)
• Institutions are highly skewed in terms of size and capacity
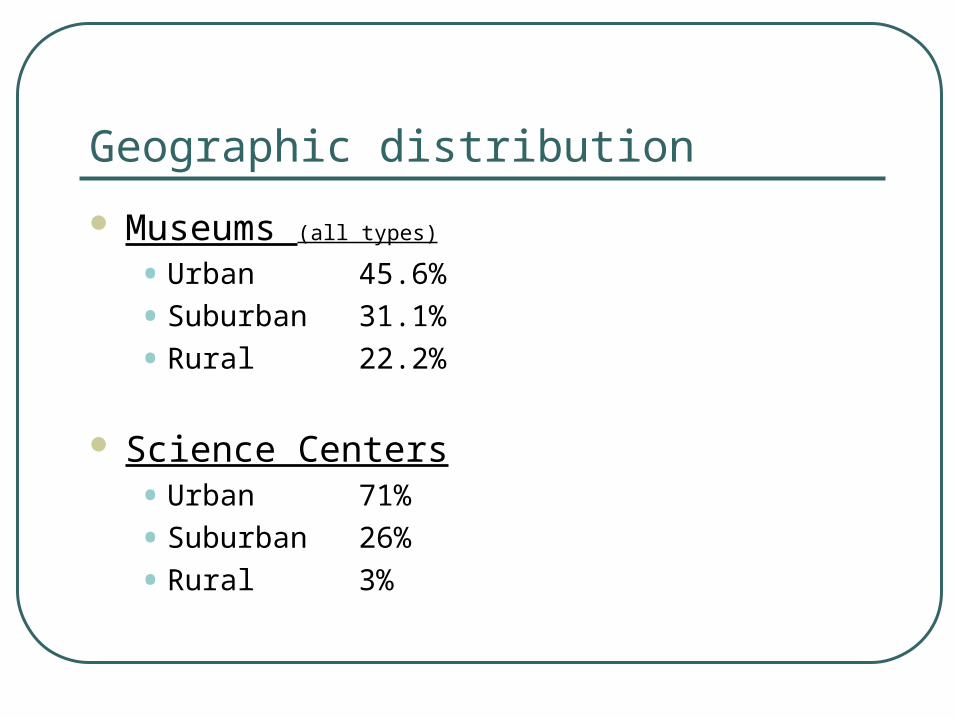
Geographic distribution
Museums (all types)
• Urban 45.6%
• Suburban 31.1%
• Rural 22.2%
Science Centers• Urban 71%
• Suburban 26%
• Rural 3%
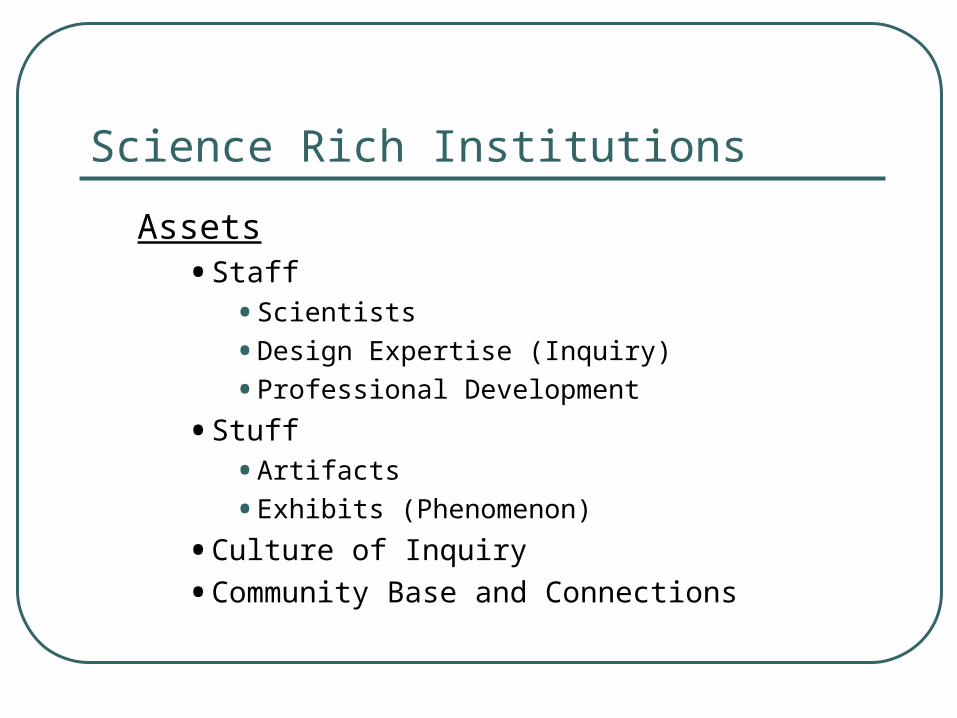
Science Rich Institutions
Assets• Staff
• Scientists
• Design Expertise (Inquiry)
• Professional Development
• Stuff
• Artifacts
• Exhibits (Phenomenon)
• Culture of Inquiry
• Community Base and Connections
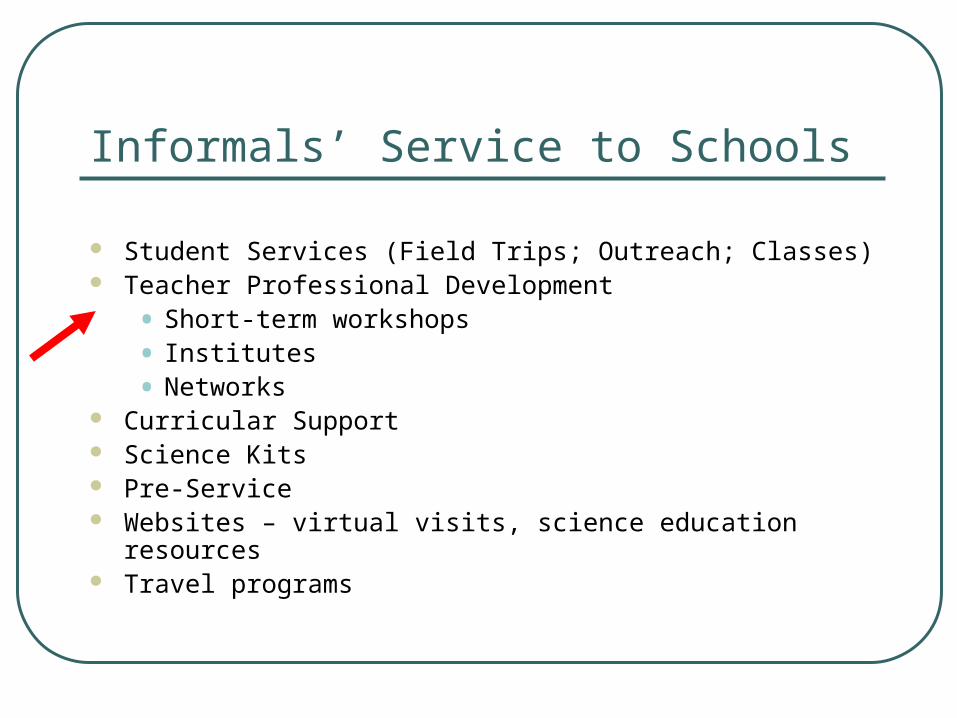
Informals’ Service to Schools
Student Services (Field Trips; Outreach; Classes) Teacher Professional Development
• Short-term workshops
• Institutes
• Networks Curricular Support Science Kits Pre-Service Websites – virtual visits, science education resources Travel programs

The U.S. Education System
Structure, Scale and Issues

THE U.S. EDUCATION SYSTEM
50 states
16,850 school districts
80,000 schools
3 million teachers (FTE)
46 million students (K-12)
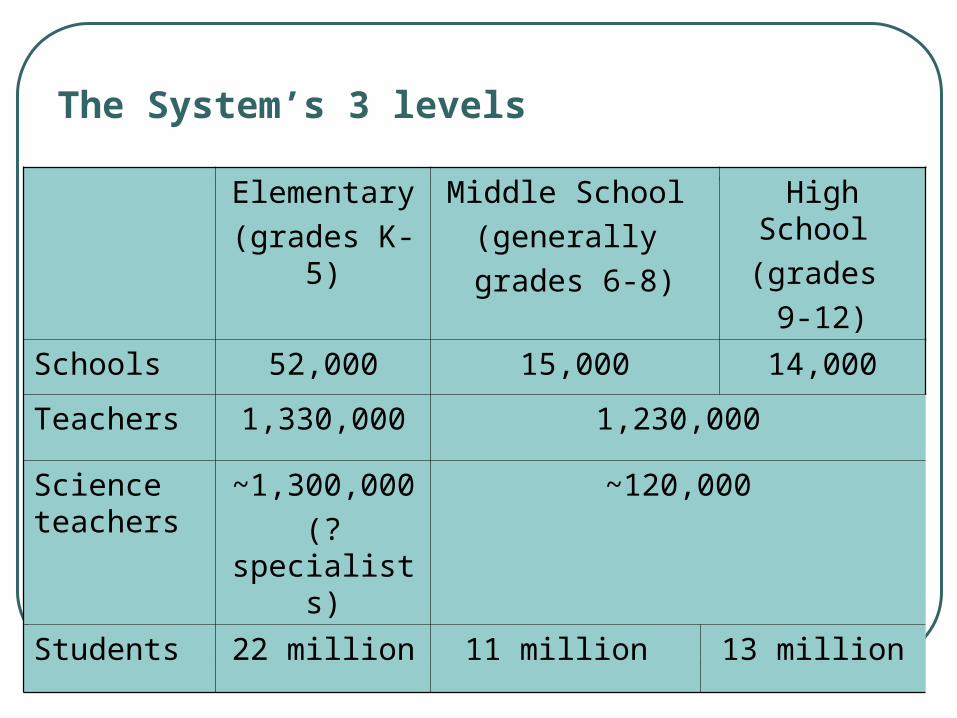
The System’s 3 levels
Elementary(grades K-5)
Middle School (generally grades 6-8)
High School (grades
9-12)
Schools 52,000 15,000 14,000
Teachers 1,330,000 1,230,000
Science teachers
~1,300,000(?
specialists)
~120,000
Students 22 million 11 million 13 million
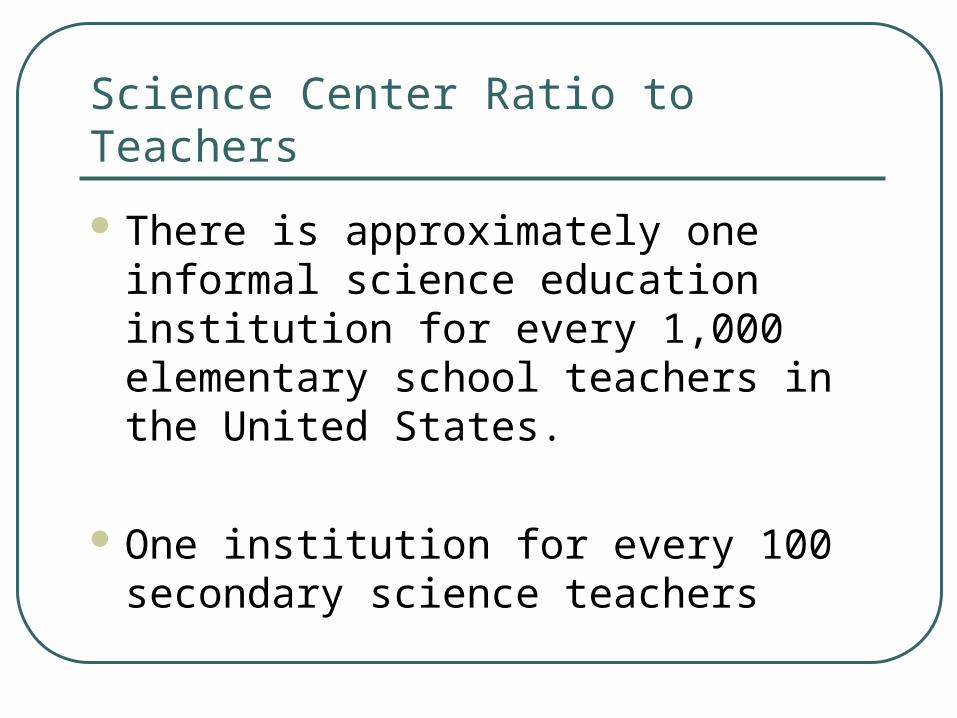
Science Center Ratio to Teachers
There is approximately one informal science education institution for every 1,000 elementary school teachers in the United States.
One institution for every 100 secondary science teachers

50 states

12
12
16
12
7
1
< $5,000 $5,000-$6,000
$6,000-$7,000
$7,000-$8,000
$8,000-$9,000
$9,000-$10,000
>$10,000
Per pupil funding (adjusted for regional cost differences)
N o
f st
ates
States spend between $4,995 and $10,251 per pupil (national average = $7,524)

In about 1 in 3 states, 40% or more students receive free and reduced lunch
1
18
10
12
32
5
< 20% 20% -30%
30% -40%
40% -50%
50% -60%
60% -70%
Notreported
% students receiving free and reduced lunch
N o
f sta
tes

States as the Key Actor in the No Child Left Behind Legislation
Requires state testing in math and reading in grades 3-8 and at least once in high school by the 2005-06 school year.
Science coming on board in next few years.
Schools must make “adequate yearly progress”.
Requires states to certify that all teachers are “highly qualified”.

DISTRICTS AND SCHOOLS

In the United States16,850 districts house 80,000 schools
Districts in just one small state, Kentucky
Nationally, 4 in 5 districts are unified K-12 districts
• 78% Unified • 19% Elementary • 3% High school
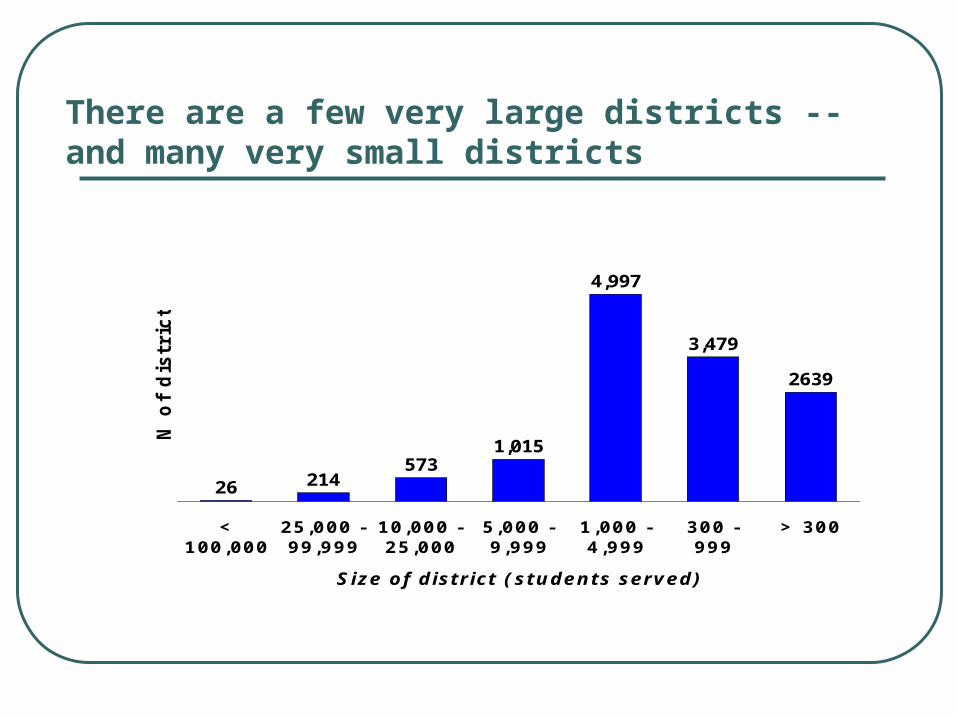
There are a few very large districts -- and many very small districts
26 214573
1,015
4,997
3,479
2639
<100,000
25,000 -99,999
10,000 -25,000
5,000 -9,999
1,000 -4,999
300 -999
> 300
Size of district (students served)
N o
f dis
tric
ts
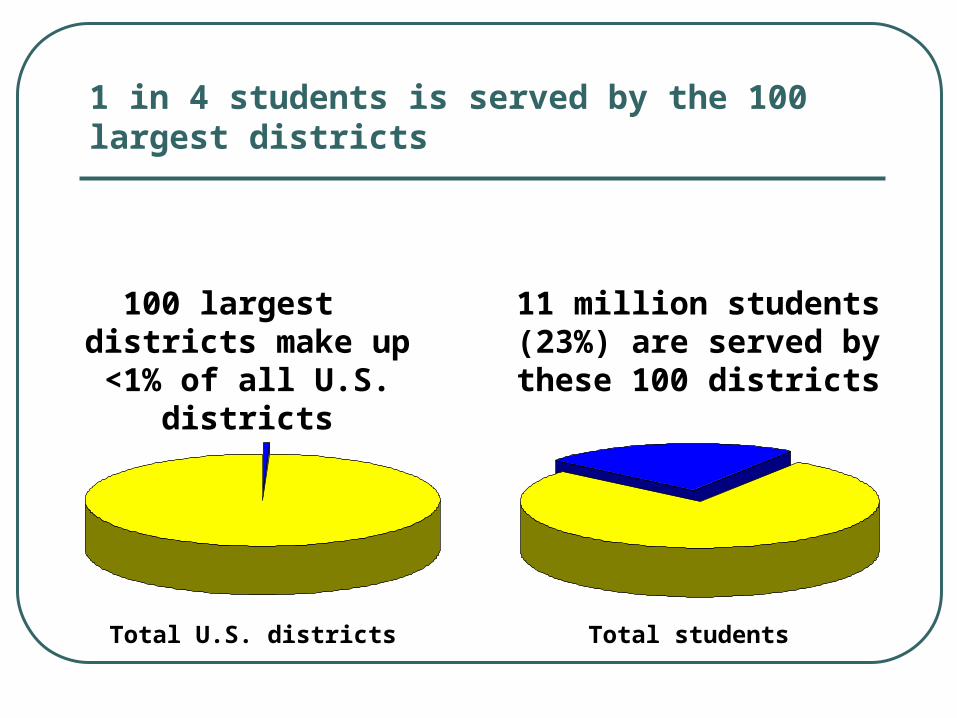
100 largest districts make up
<1% of all U.S. districts
11 million students (23%) are served by these 100 districts
Total U.S. districts
Total students
1 in 4 students is served by the 100 largest districts
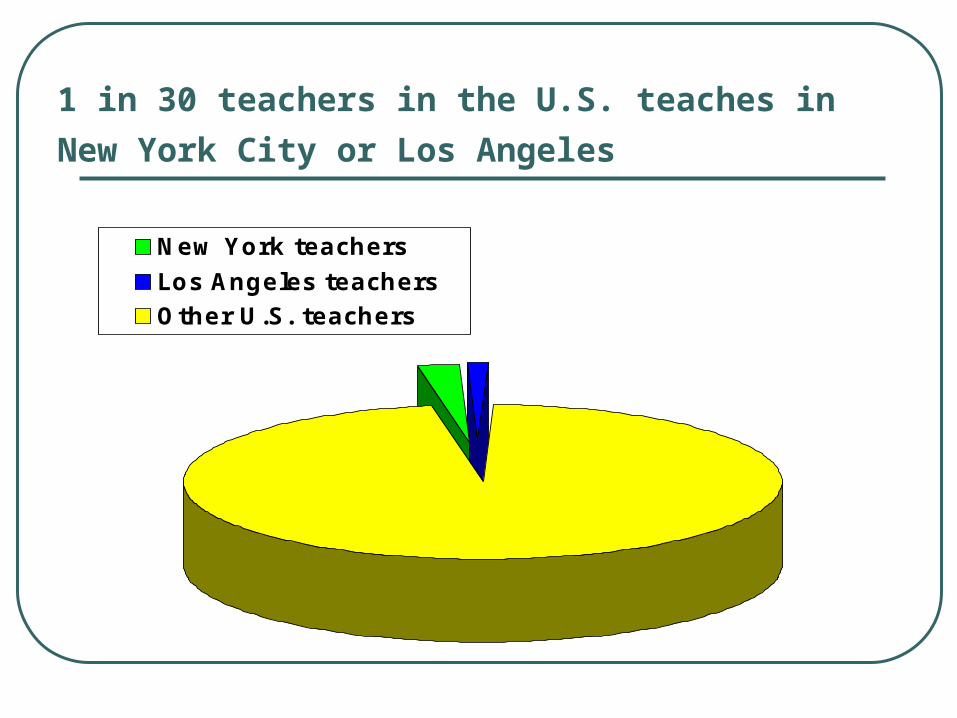
1 in 30 teachers in the U.S. teaches in New
York City or Los Angeles
New York teachers
Los Angeles teachersOther U.S. teachers

About ½ of all schools are in urban or rural settings
95% of major urban districts have an urgent need for math and science teachers
22,000 + rural schools
(27%)
19,000+ schools in large
and midsize cities (24%)*
39,000+ schools in suburbs and small cities
(49%)

Pockets of wealth and poverty (Median household net worth, by ZIP CODE)

TEACHERS

1 in 6 teachers in the U. S. is a “new teacher” (i.e. has taught for 3 years or less)
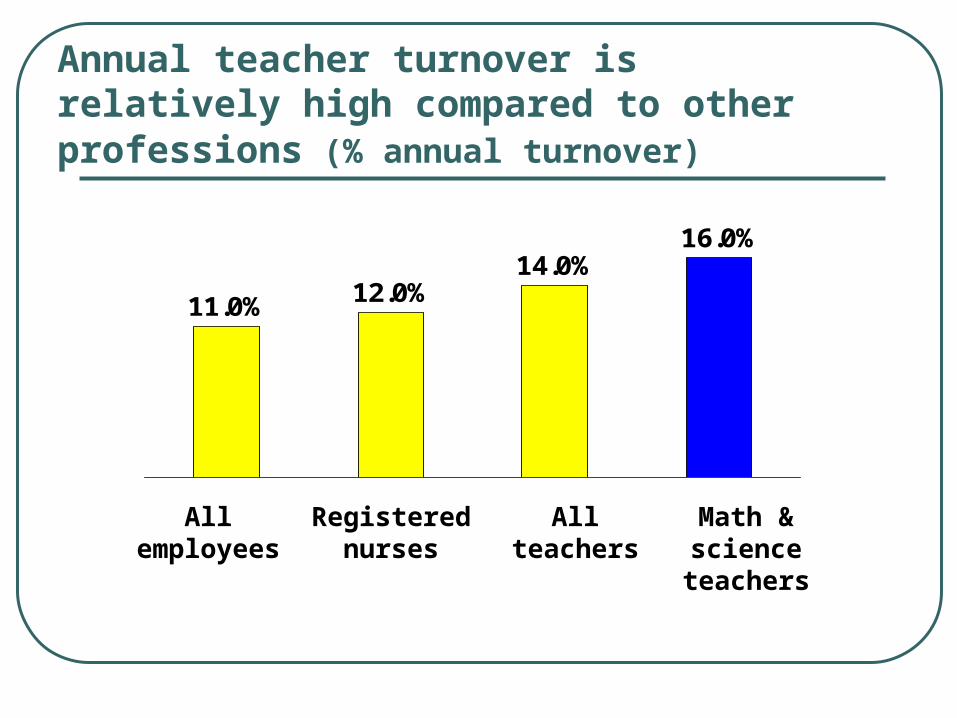
12.0%14.0%
16.0%
11.0%
Annual teacher turnover is relatively high compared to other professions (% annual turnover)
All employees
All teachers
Registered nurses
Math & science
teachers

21%
29%
46%
57%
12%
The most common reasons that math and science teachers give for leaving jobs
Low salary
Student discipline problems
Lack of support from administration
Lack of student motivation
Lack of influence over school decision making
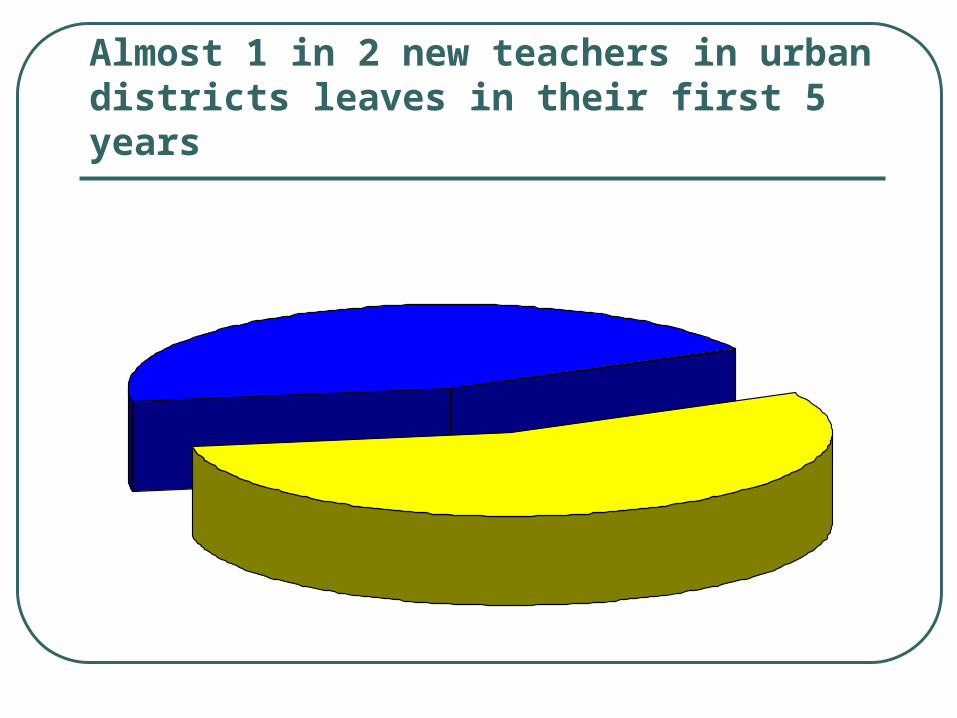
Almost 1 in 2 new teachers in urban districts leaves in their first 5 years
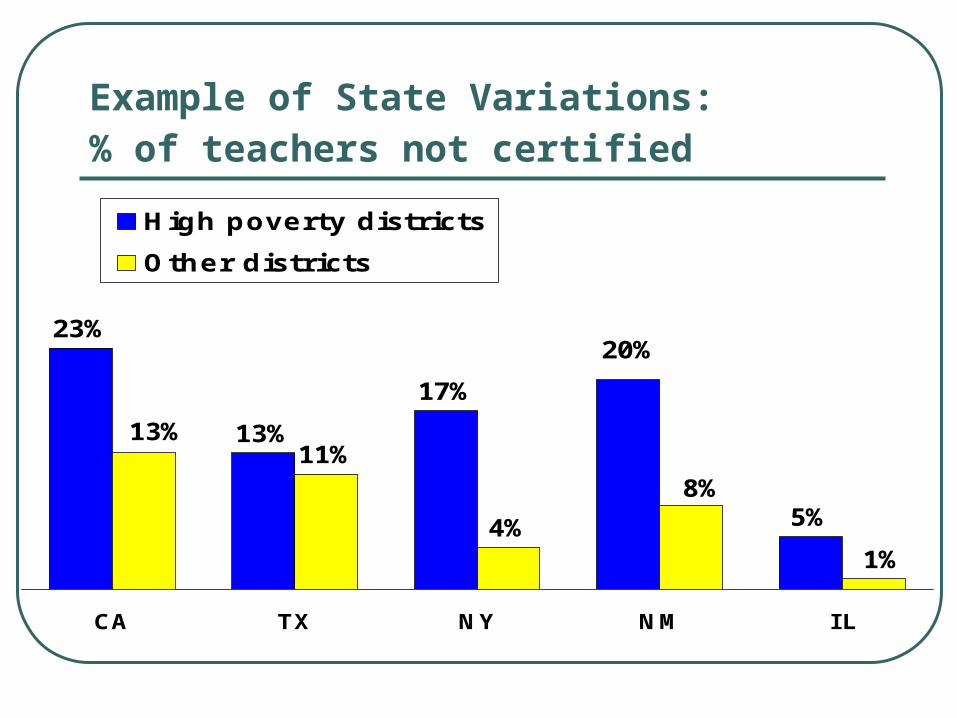
Example of State Variations: % of teachers not certified
23%
13%
17%
5%
11%
4%
20%
1%
8%
13%
CA TX NY NM IL
High poverty districts
Other districts

Secondary students are often taught by teachers with no major and no certification in the course subject area
58% 57%69%
30% 31% 31%
English Science Math
% students taught by teachers with no major or certification in subject area
Middle School High School
The situation is worst in high-poverty and high-minority schools
Students in urban secondary schools have less than a 50% chance of getting a math or science teacher who has at least a college minor in math or science
70% of middle-grade math and science classes in high-poverty and high-minority schools are taught by teachers who lack a math or science minor

Few elementary science teachers consider themselves very well qualified to teach the subject
18%25% 29%
52%60%
76%
Physical science
Earth science
Life science
Social studies
Math Reading/ Language
arts
Museum’s Relationship to the Educational System
(Museum To Students –
3 Degrees Of Separation)
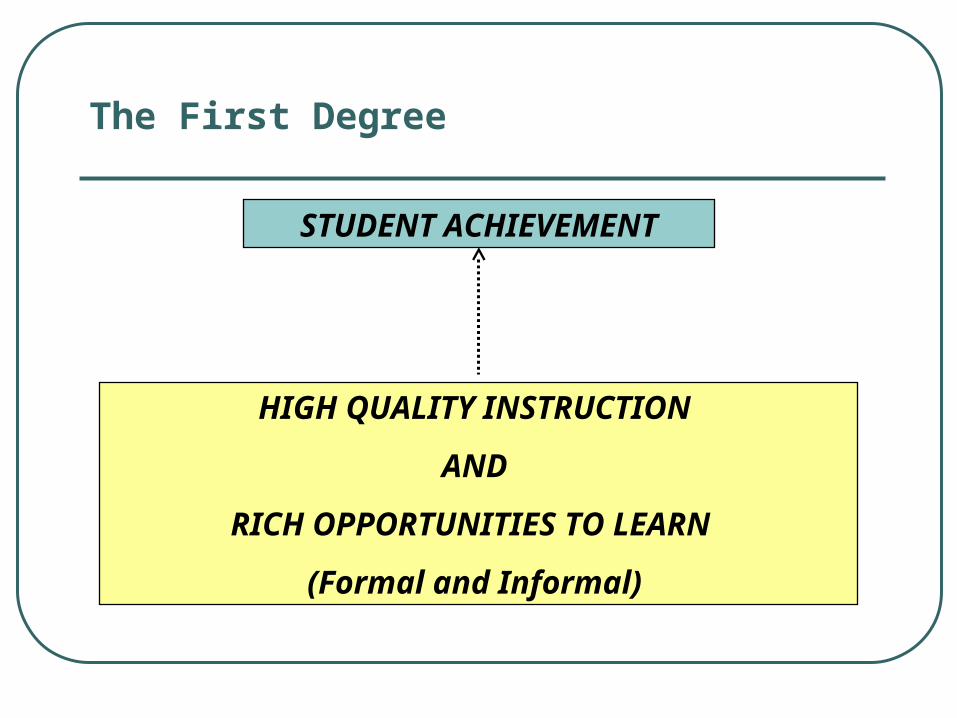
The First Degree
STUDENT ACHIEVEMENT
HIGH QUALITY INSTRUCTION
AND
RICH OPPORTUNITIES TO LEARN
(Formal and Informal)
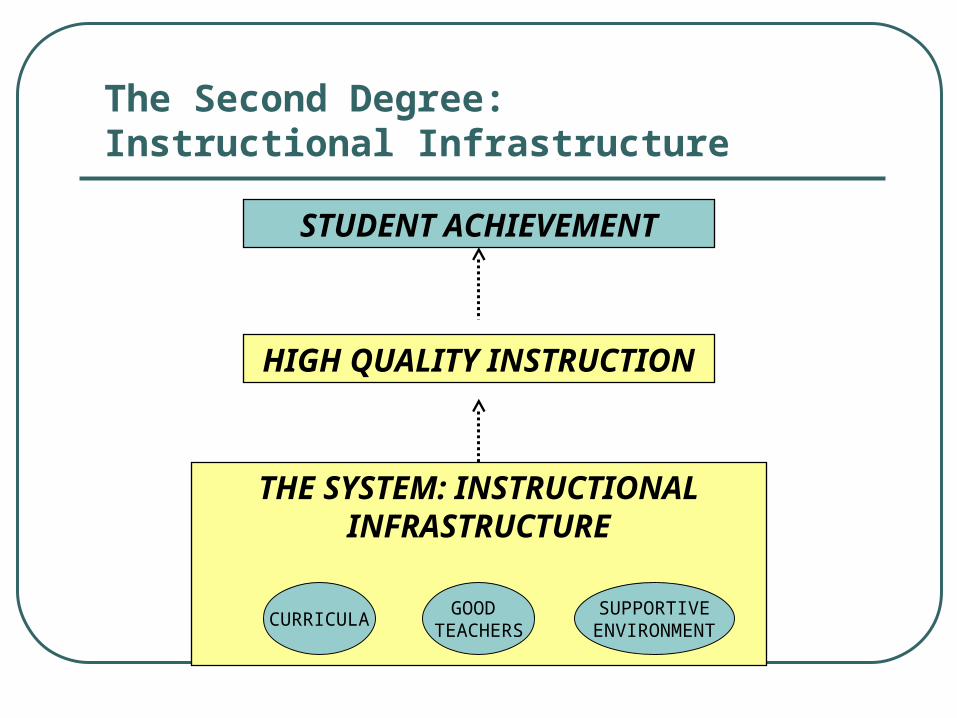
The Second Degree: Instructional Infrastructure
STUDENT ACHIEVEMENT
HIGH QUALITY INSTRUCTION
THE SYSTEM: INSTRUCTIONAL INFRASTRUCTURE
CURRICULAGOOD
TEACHERSSUPPORTIVE
ENVIRONMENT

The Third Degree: The Improvement Infrastructure
IMPROVEMENT INFRASTRUCTURE
STUDENT ACHIEVEMENT
HIGH QUALITY INSTRUCTION
THE SYSTEM: INSTRUCTIONAL INFRASTRUCTURE
CURRICULAGOOD
TEACHERSSUPPORTIVE
ENVIRONMENT
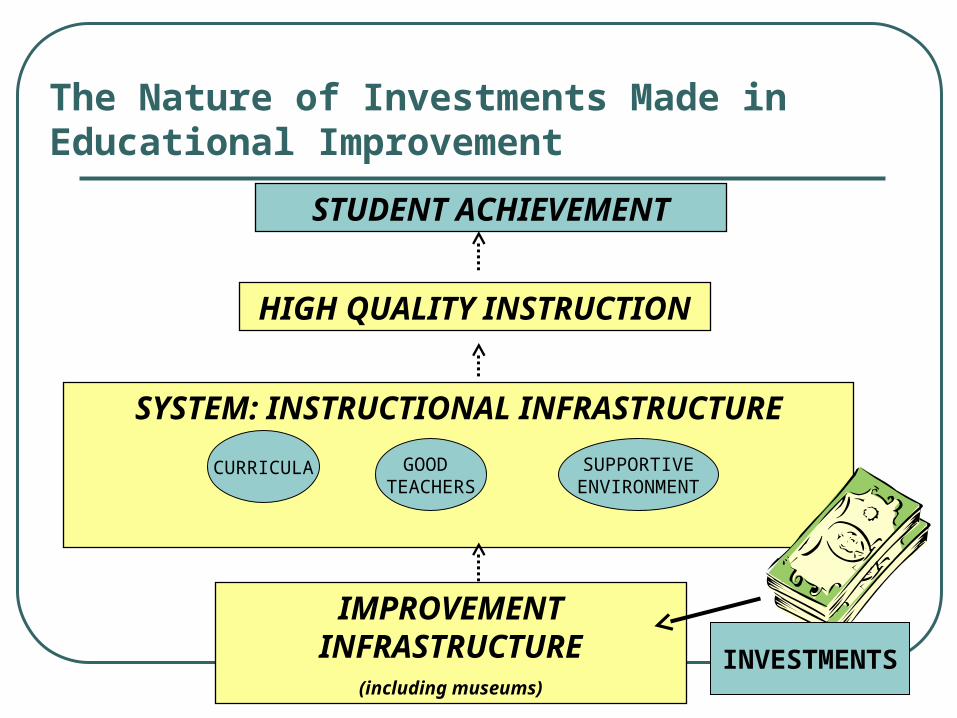
The Nature of Investments Made in Educational Improvement
STUDENT ACHIEVEMENT
HIGH QUALITY INSTRUCTION
SYSTEM: INSTRUCTIONAL INFRASTRUCTURE
IMPROVEMENT INFRASTRUCTURE
(including museums)
CURRICULA GOOD TEACHERS
SUPPORTIVEENVIRONMENT
INVESTMENTS
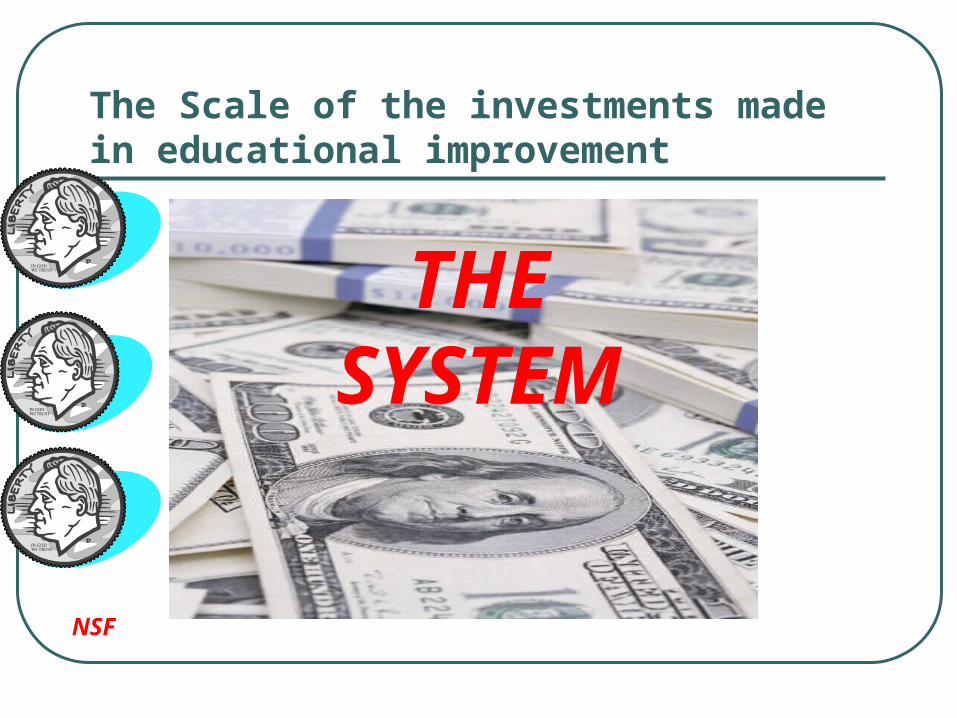
The Scale of the investments made in educational improvement
NSF
THE SYSTE
M
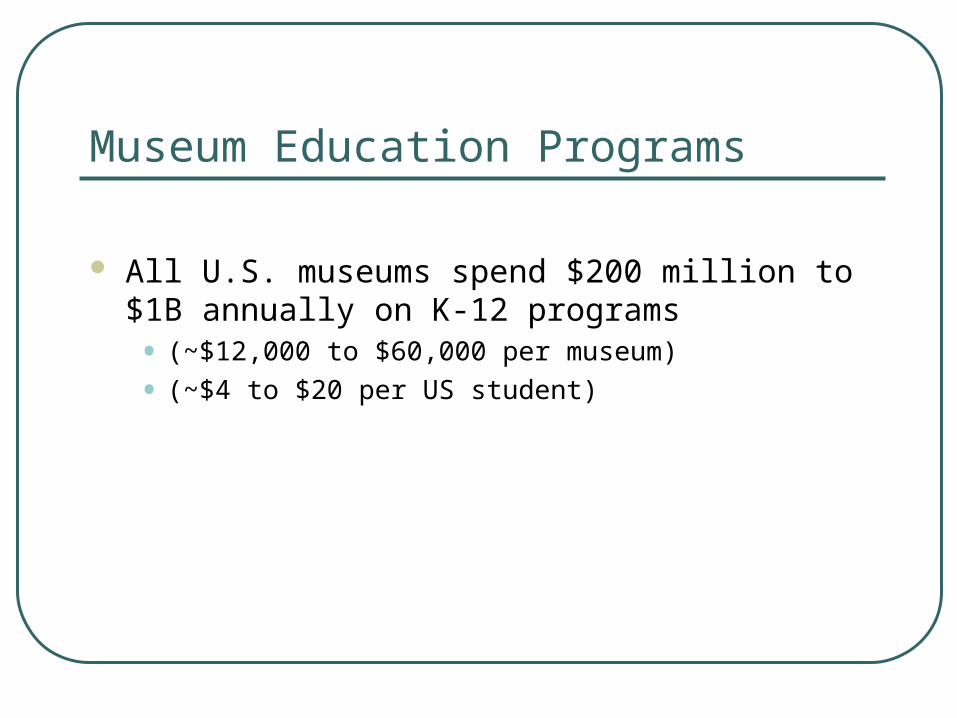
Museum Education Programs
All U.S. museums spend $200 million to $1B annually on K-12 programs • (~$12,000 to $60,000 per museum)
• (~$4 to $20 per US student)
The Design of Professional Development Programs
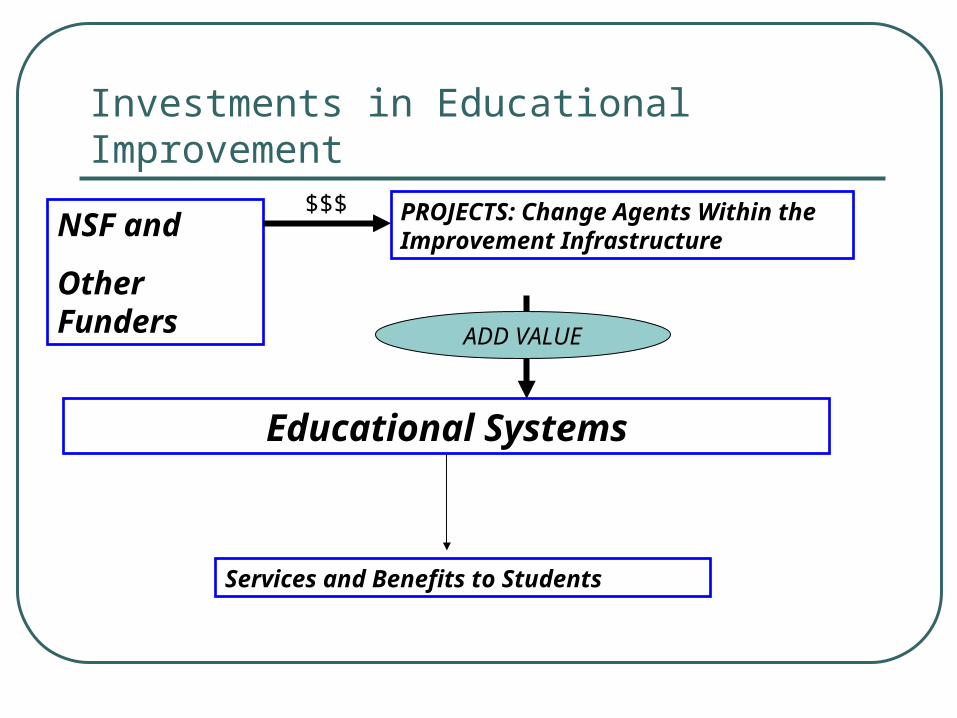
Investments in Educational Improvement
NSF and
Other Funders
PROJECTS: Change Agents Within the Improvement Infrastructure
Educational Systems
Services and Benefits to Students
ADD VALUE
$$$
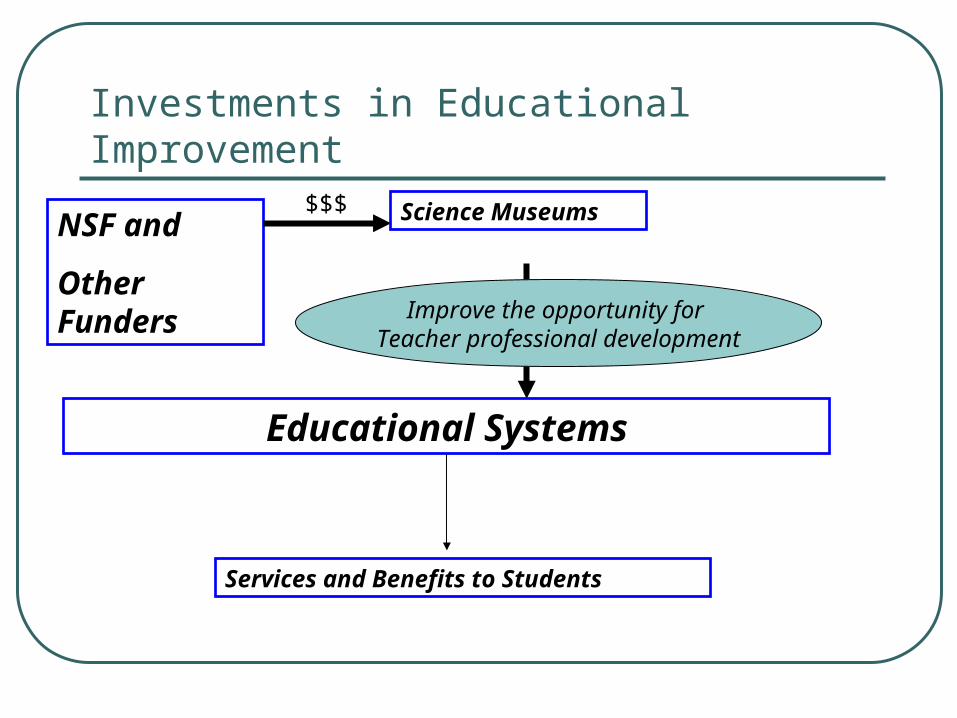
Investments in Educational Improvement
NSF and
Other Funders
Science Museums
Educational Systems
Services and Benefits to Students
Improve the opportunity for Teacher professional development
$$$
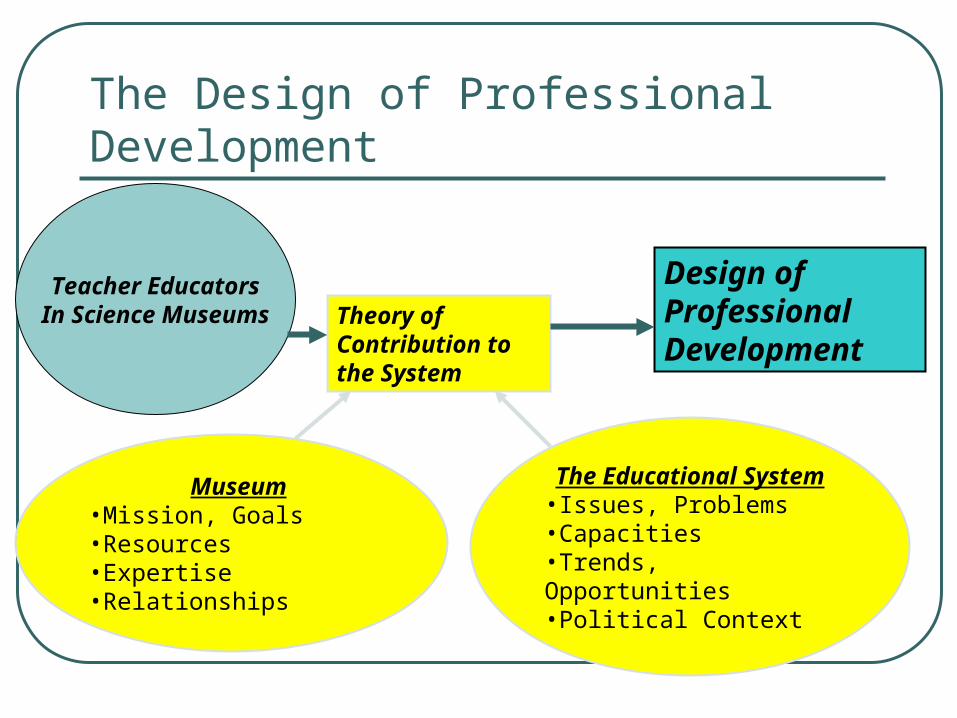
The Design of Professional Development
Teacher EducatorsIn Science Museums Theory of
Contribution to the System
Design of Professional Development
Museum•Mission, Goals•Resources•Expertise•Relationships
The Educational System
•Issues, Problems•Capacities•Trends, Opportunities•Political Context
Top Related