


Languages
Pages
Legal

8/4/2019 Article Meri
http://slidepdf.com/reader/full/article-meri 1/20
ABSTRACT
Content-Based Image Retrieval (CBIR) is a challenging task available techniques uses only low-
level features. May be different in terms of user perception, our objective is to retrieve images based on
color and boundary. For that, we present a new method for comparing images based on combining
between edge detection using comparison method(mean,nighbour) and the image without change using
comparison method .The goal of this research project is to understand the ideas of image retrieval by
content of image, that can provide a large variety of image-distance measures that can be used singly or
in combination for image features. The focus of the work is the development of new algorithm by
combining more features and algorithms to develop effective method to support fast querying of large
collection of image databases with user-specified distance measures. Methods for merging in general,
distance-measure-independent algorithms with other useful techniques. The problem of providing users
with multiple distance measures of many different varieties is being studied. New methods for
combining distance measures and Edge detection method then combine the result to in parallel way to
improve the result.. A prototype system is being implemented to test the developed methods, and
evaluation is being performed on both a large general image database and a smaller controlled database.
The results of this research will be techniques that facilitate rapid retrieval of images by eliminating
many images from database during the search, making content-based retrieval feasible on very large and
growing databases.
Keywords: CBIR,Image Retrieval, Edge Detection ,Query by image and content based image.
INTRODUCTION
Content-Based Image Retrieval(CBIR),also
known as Query By Image Content(QBIC). It is
application of computer vision to the image
retrieval problem .To search for digital image in
large collection of images or databases for
similar image. "Content-based" mean that the
search will analyze the actual contents of the
content refer to the color or texture or shape or
any other information that can be derived from
The image itself to search for similar images
which contain similar features.[1] CBIR systems
Content Based Image Retrieval Using Edge Detection and Color
Khaled Fayez Meri1, Dr. Said Mohammed AbuSha'ar
2
1Department of computer science, Graduate School of Information Technology, University of Palestine,
Gaza,[email protected],
2Information Technology Faculty, Al-Ahliyya Amman University,
Amman, Jordan [email protected]
8/4/2019 Article Meri
http://slidepdf.com/reader/full/article-meri 2/20
demonstrate excellent performance at computing
low-level features from pixel representations but
its output does not reflect the overall desire of
the user. The systems perform poorly in
extracting high-level (semantic) features thatinclude objects and their meanings, actions and
feelings. This phenomenon, referred to as the
semantic gap, has necessitated current research
in CBIR systems towards retrieving images by
the type of object or scene depicted. [2]
Feature Extraction Is one of the most
important components in a content-based
retrieval system. Since a human is usually
judging the results of the query, extracted
features should mimic the human visual
perception as much as possible. In broad sense,
features may be divided into low-level features
(such as color, texture, shape, and spatial layout)
and high-level semantics (such as concepts and
keywords). Use of only low-level features might
not always give satisfactory results, and
therefore, high-level semantics should be added
to improve the query whenever possible. High-
level semantics can be either annotated
manually or constructed automatically from
low-level featuresImage Histogram An image histogram is a
histogram of the values of the pixels in a digital
image. Image editors have provisions to create
an image histogram of the image being edited.
The histogram plots the number of pixels in the
image (vertical axis) with a particular brightness
value (horizontal axis). Algorithms in the digital
editor allow the user to visually adjust the
brightness value of each pixel and to
dynamically display the results as adjustments
are made Improvements in picture brightnessand contrast can thus be obtained[55].
Edge Detection is one of the most important
tasks in image processing and scene analysis
systems and computer vision . particularly in
within the areas of feature detection and feature
extraction, to refer to algorithms which aim at
identifying points in a digital image at which the
image brightness changes sharply or more
formally has discontinuities. It denotes the
procedure of detecting meaningful
discontinuities (edges) of the image function.
The accuracy in detecting these discontinuities
and efficiency in implementing these operations
are important criteria for using an algorithm[65].
Edges in gray-level images can be thought of as
pixel locations of abrupt gray-level change. Achange in the image function can be described
by a gradient that points in the direction of the
largest growth of the image fuction. Therefore,
one edge detection technique is to measure the
gradient vector magnitude at pixel locations.
Fundamental difference between color images
and gray-level image is that, in a color image, a
color vector which generally consists of three
components is assigned to a pixel, while a scalar
gray-level is assigned to a pixel of a gray-level
image. Thus, in color image processing vector-
valued image functions are treated instead of
scalar image functions. The techniques used for
this can be subdivided on the basis of their
principle procedures into two classes.[60]
Monochromatic-based techniques: methods in
this category treat information from the
individual color channels or color vector
components first separately and then combine
together the individual results gained.
Vector-valued techniques: vector-valuedtechniques treat the color information as color
vectors in a vector space provided with a vector
norm.
Edges are commonly defined as significant local
changes in an image. Edge provides an
indication of the physical extent of objects in the
image. Edge detection is viewed as an
information reduction process that provides
boundary information of regions by filtering out
unnecessary information for the next steps of
processes in a computer vision system. Thus, edge detection is one of the most essential steps
for extracting structural features for human and
machine perception. The success of high-level
computer vision processes heavily relies on the
good output from the lower level processes such
as edge detection. Many edge detection
algorithms have been proposed in the last 50
years.[60]
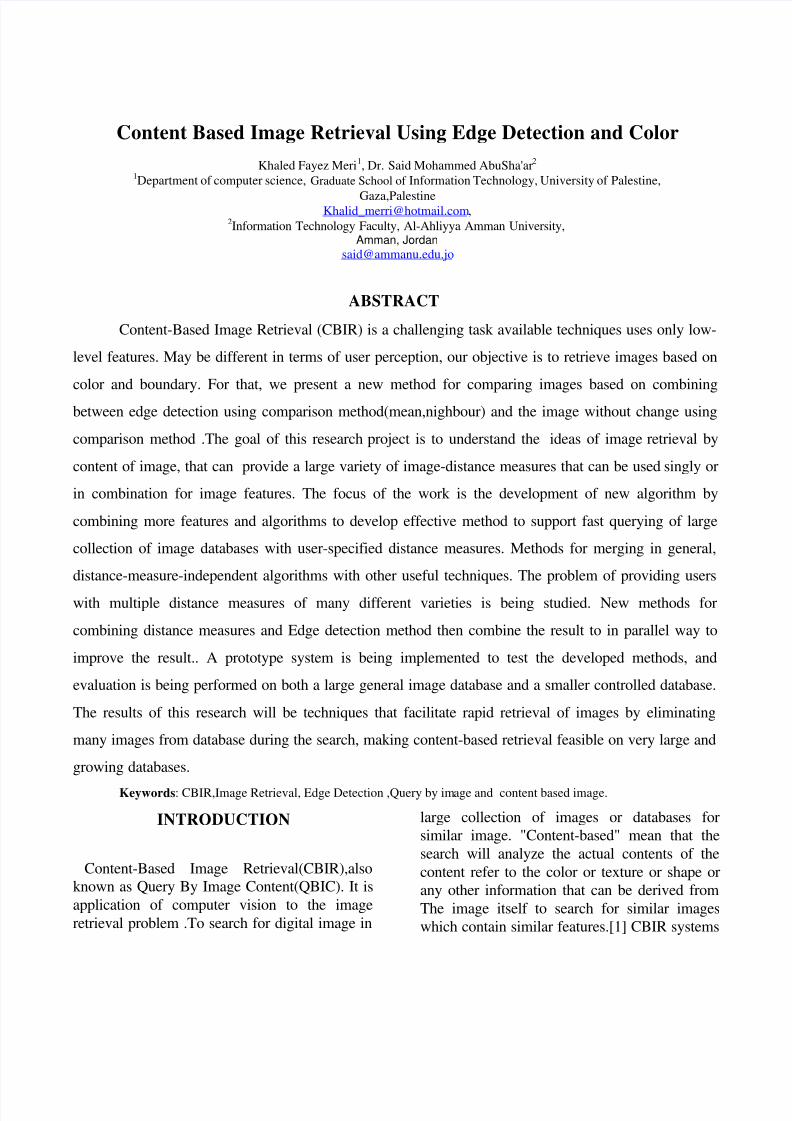
The Sobel operator is used in image
processing, particularly within edge detection
8/4/2019 Article Meri
http://slidepdf.com/reader/full/article-meri 3/20
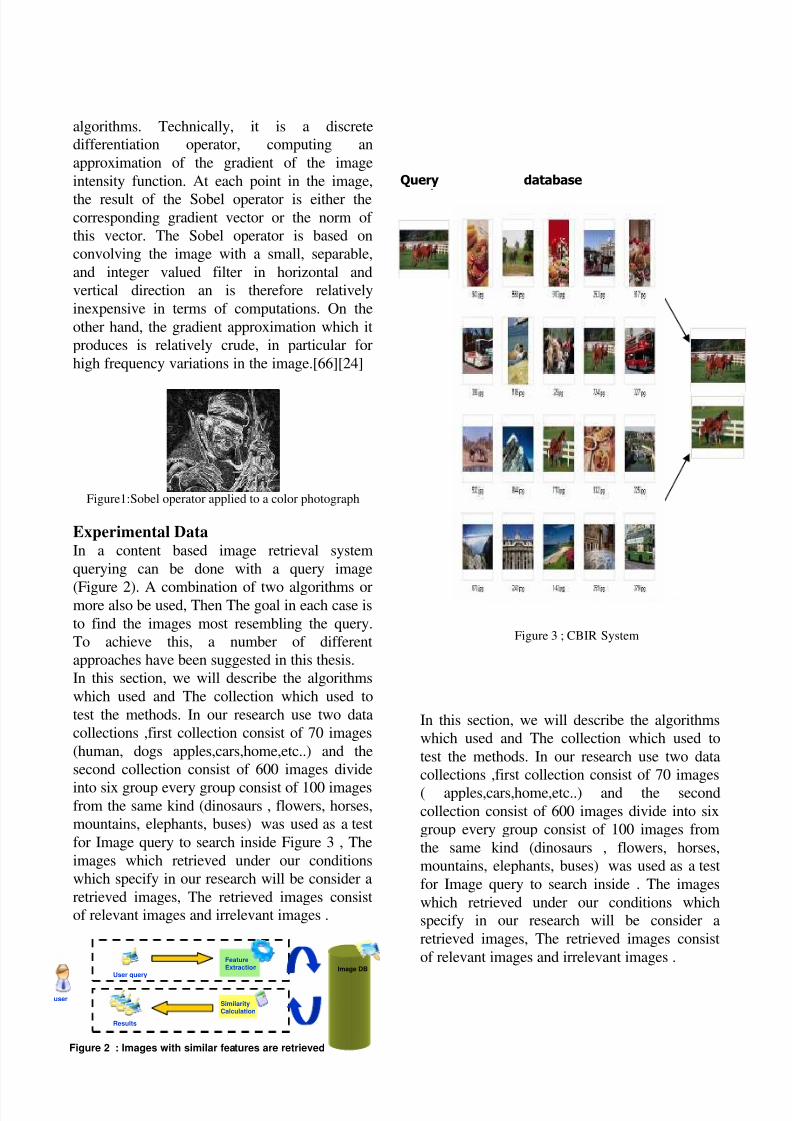
user
Image DB
FeatureExtraction
Results
SimilarityCalculation
Figure 2 : Images with similar features are retrieved
User query
algorithms. Technically, it is a discrete
differentiation operator, computing an
approximation of the gradient of the image
intensity function. At each point in the image,
the result of the Sobel operator is either thecorresponding gradient vector or the norm of
this vector. The Sobel operator is based on
convolving the image with a small, separable,
and integer valued filter in horizontal and
vertical direction an is therefore relatively
inexpensive in terms of computations. On the
other hand, the gradient approximation which it
produces is relatively crude, in particular for
high frequency variations in the image.[66][24]
Figure1:Sobel operator applied to a color photograph
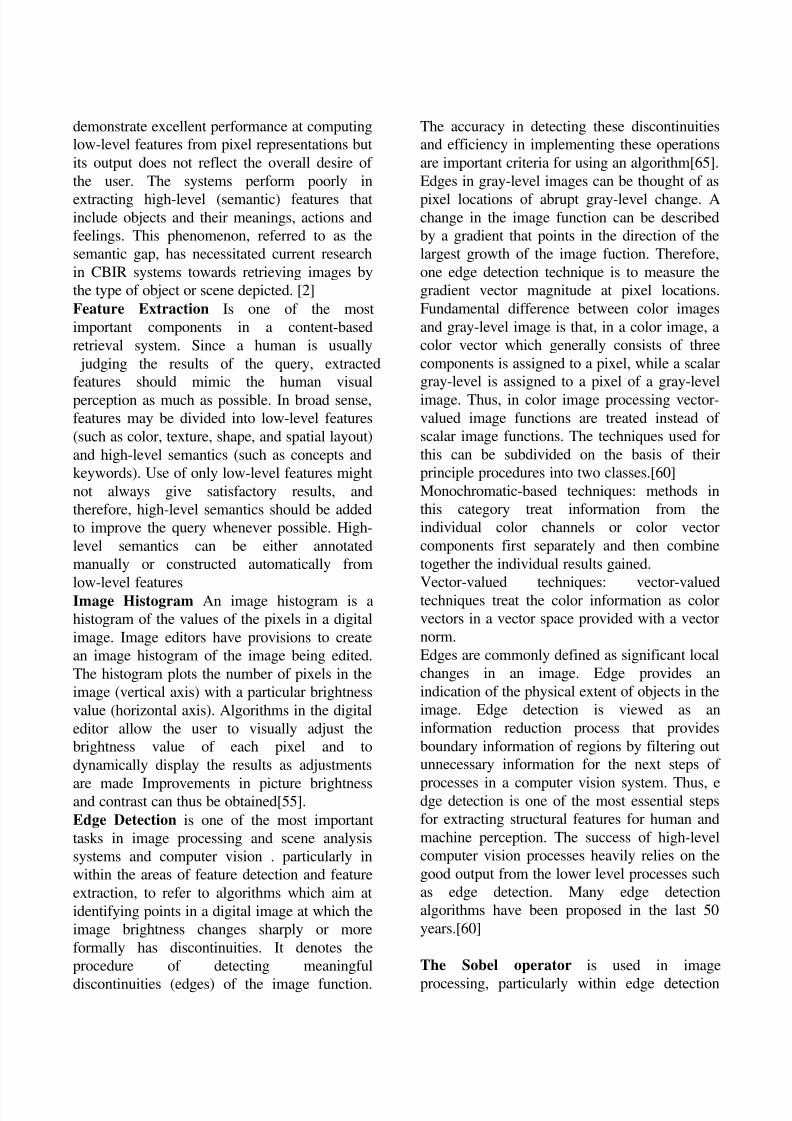
Experimental DataIn a content based image retrieval system
querying can be done with a query image
(Figure 2). A combination of two algorithms ormore also be used, Then The goal in each case is
to find the images most resembling the query.
To achieve this, a number of different
approaches have been suggested in this thesis.
In this section, we will describe the algorithms
which used and The collection which used to
test the methods. In our research use two data
collections ,first collection consist of 70 images
(human, dogs apples,cars,home,etc..) and the
second collection consist of 600 images divide
into six group every group consist of 100 imagesfrom the same kind (dinosaurs , flowers, horses,
mountains, elephants, buses) was used as a test
for Image query to search inside Figure 3 , The
images which retrieved under our conditions
which specify in our research will be consider a
retrieved images, The retrieved images consist
of relevant images and irrelevant images .
In this section, we will describe the algorithms
which used and The collection which used to
test the methods. In our research use two data
collections ,first collection consist of 70 images
( apples,cars,home,etc..) and the second
collection consist of 600 images divide into six
group every group consist of 100 images from
the same kind (dinosaurs , flowers, horses,
mountains, elephants, buses) was used as a test
for Image query to search inside . The images
which retrieved under our conditions which
specify in our research will be consider a
retrieved images, The retrieved images consist
of relevant images and irrelevant images .
Query database
Figure 3 ; CBIR System
8/4/2019 Article Meri
http://slidepdf.com/reader/full/article-meri 4/20
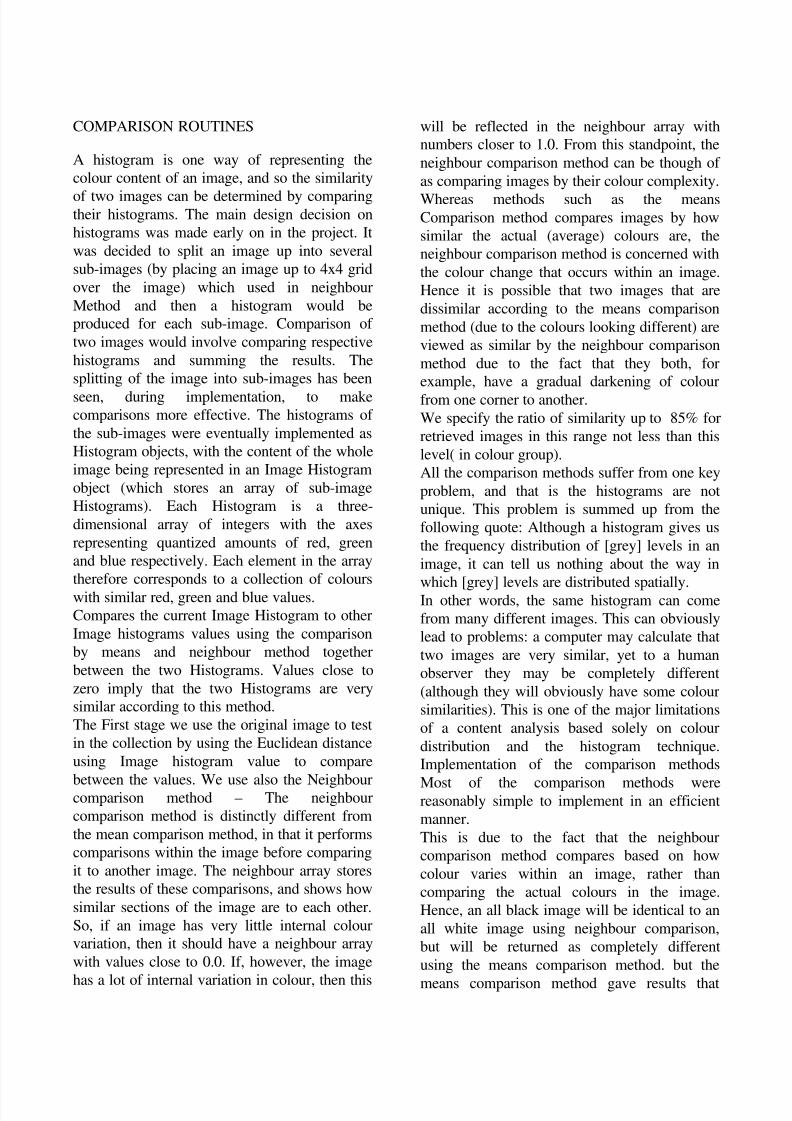
COMPARISON ROUTINES
A histogram is one way of representing the
colour content of an image, and so the similarity
of two images can be determined by comparingtheir histograms. The main design decision on
histograms was made early on in the project. It
was decided to split an image up into several
sub-images (by placing an image up to 4x4 grid
over the image) which used in neighbour
Method and then a histogram would be
produced for each sub-image. Comparison of
two images would involve comparing respective
histograms and summing the results. The
splitting of the image into sub-images has been
seen, during implementation, to makecomparisons more effective. The histograms of
the sub-images were eventually implemented as
Histogram objects, with the content of the whole
image being represented in an Image Histogram
object (which stores an array of sub-image
Histograms). Each Histogram is a three-
dimensional array of integers with the axes
representing quantized amounts of red, green
and blue respectively. Each element in the array
therefore corresponds to a collection of colours
with similar red, green and blue values.
Compares the current Image Histogram to other
Image histograms values using the comparison
by means and neighbour method together
between the two Histograms. Values close to
zero imply that the two Histograms are very
similar according to this method.
The First stage we use the original image to test
in the collection by using the Euclidean distance
using Image histogram value to compare
between the values. We use also the Neighbourcomparison method – The neighbour
comparison method is distinctly different from
the mean comparison method, in that it performs
comparisons within the image before comparing
it to another image. The neighbour array stores
the results of these comparisons, and shows how
similar sections of the image are to each other.
So, if an image has very little internal colour
variation, then it should have a neighbour array
with values close to 0.0. If, however, the image
has a lot of internal variation in colour, then this
will be reflected in the neighbour array with
numbers closer to 1.0. From this standpoint, the
neighbour comparison method can be though of
as comparing images by their colour complexity.
Whereas methods such as the meansComparison method compares images by how
similar the actual (average) colours are, the
neighbour comparison method is concerned with
the colour change that occurs within an image.
Hence it is possible that two images that are
dissimilar according to the means comparison
method (due to the colours looking different) are
viewed as similar by the neighbour comparison
method due to the fact that they both, for
example, have a gradual darkening of colour
from one corner to another.
We specify the ratio of similarity up to 85% for
retrieved images in this range not less than this
level( in colour group).
All the comparison methods suffer from one key
problem, and that is the histograms are not
unique. This problem is summed up from the
following quote: Although a histogram gives us
the frequency distribution of [grey] levels in an
image, it can tell us nothing about the way in
which [grey] levels are distributed spatially.In other words, the same histogram can come
from many different images. This can obviously
lead to problems: a computer may calculate that
two images are very similar, yet to a human
observer they may be completely different
(although they will obviously have some colour
similarities). This is one of the major limitations
of a content analysis based solely on colour
distribution and the histogram technique.
Implementation of the comparison methods
Most of the comparison methods werereasonably simple to implement in an efficient
manner.
This is due to the fact that the neighbour
comparison method compares based on how
colour varies within an image, rather than
comparing the actual colours in the image.
Hence, an all black image will be identical to an
all white image using neighbour comparison,
but will be returned as completely different
using the means comparison method. but the
means comparison method gave results that
8/4/2019 Article Meri
http://slidepdf.com/reader/full/article-meri 5/20
were more intuitive from a human point of view.
Overall, the comparison of images based on
colour distribution produces reasonably good
results. However, the user needs to be aware of
the limitations of the methods. Also, knowledgeof the comparison methods helps to interpret the
order of the results.
The results that we have obtained by
implementing this project have served to
illustrate the complexity of image recognition
which, being an everyday operation for the
human brain, is extremely complicated to
accurately recreate within a computer. The main
way to improve upon the program that has been
produced is to investigate and implement more
powerful comparison techniques, using ideas
such as shape and other teqniques.
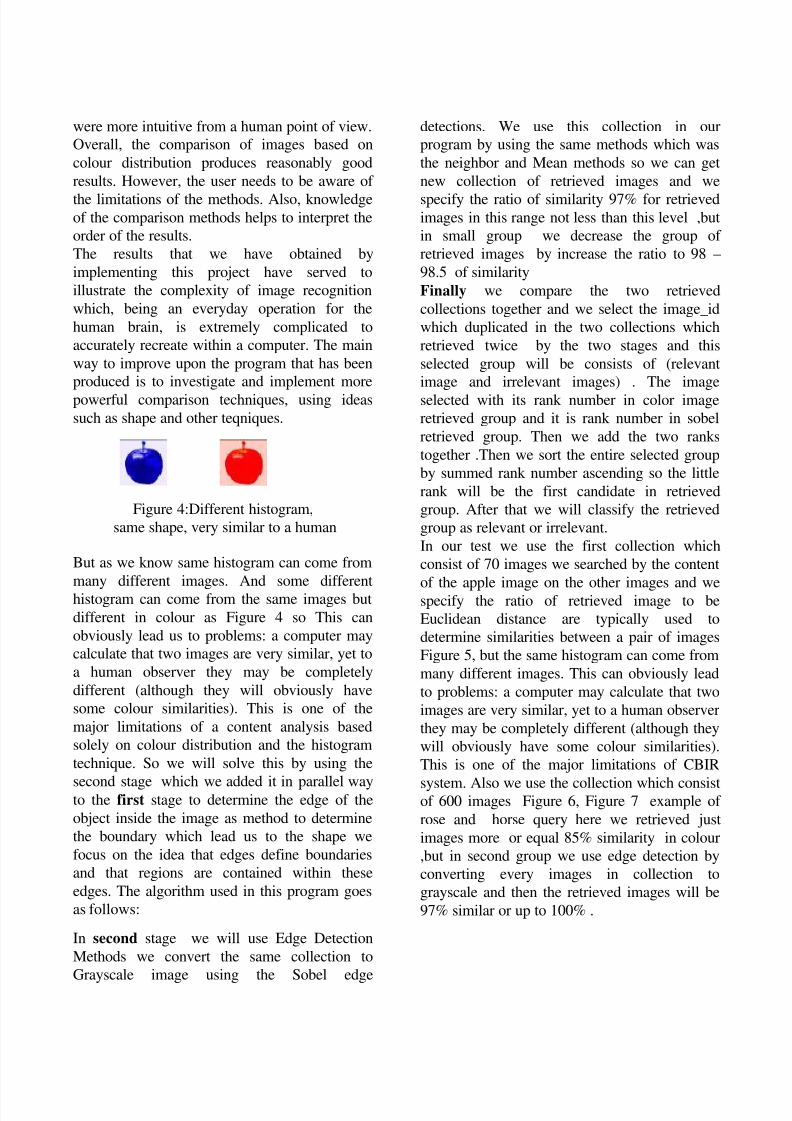
Figure 4:Different histogram,
same shape, very similar to a human
But as we know same histogram can come from
many different images. And some different
histogram can come from the same images but
different in colour as Figure 4 so This can
obviously lead us to problems: a computer may
calculate that two images are very similar, yet to
a human observer they may be completely
different (although they will obviously have
some colour similarities). This is one of the
major limitations of a content analysis based
solely on colour distribution and the histogram
technique. So we will solve this by using the
second stage which we added it in parallel wayto the first stage to determine the edge of the
object inside the image as method to determine
the boundary which lead us to the shape we
focus on the idea that edges define boundaries
and that regions are contained within these
edges. The algorithm used in this program goes
as follows:
In second stage we will use Edge Detection
Methods we convert the same collection to
Grayscale image using the Sobel edge
detections. We use this collection in our
program by using the same methods which was
the neighbor and Mean methods so we can get
new collection of retrieved images and we
specify the ratio of similarity 97% for retrievedimages in this range not less than this level ,but
in small group we decrease the group of
retrieved images by increase the ratio to 98 –
98.5 of similarity
Finally we compare the two retrieved
collections together and we select the image_id
which duplicated in the two collections which
retrieved twice by the two stages and this
selected group will be consists of (relevant
image and irrelevant images) . The image
selected with its rank number in color image
retrieved group and it is rank number in sobel
retrieved group. Then we add the two ranks
together .Then we sort the entire selected group
by summed rank number ascending so the little
rank will be the first candidate in retrieved
group. After that we will classify the retrieved
group as relevant or irrelevant.
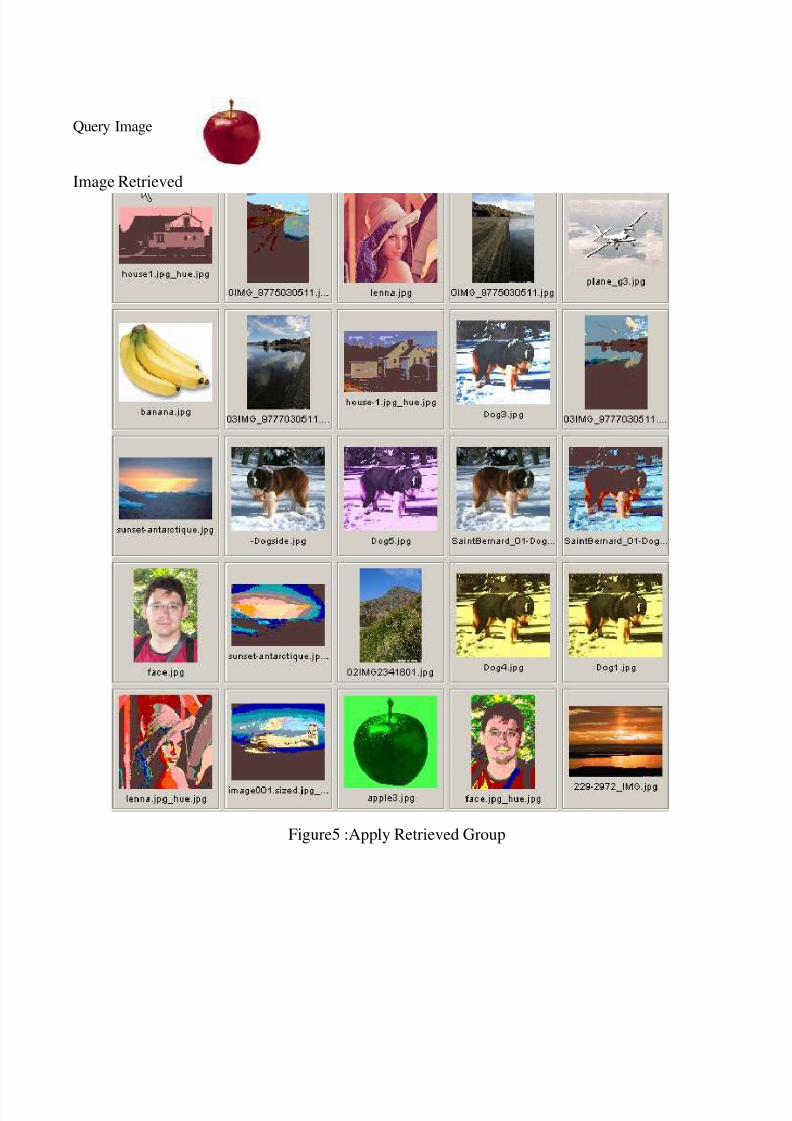
In our test we use the first collection which
consist of 70 images we searched by the content
of the apple image on the other images and wespecify the ratio of retrieved image to be
Euclidean distance are typically used to
determine similarities between a pair of images
Figure 5, but the same histogram can come from
many different images. This can obviously lead
to problems: a computer may calculate that two
images are very similar, yet to a human observer
they may be completely different (although they
will obviously have some colour similarities).
This is one of the major limitations of CBIR
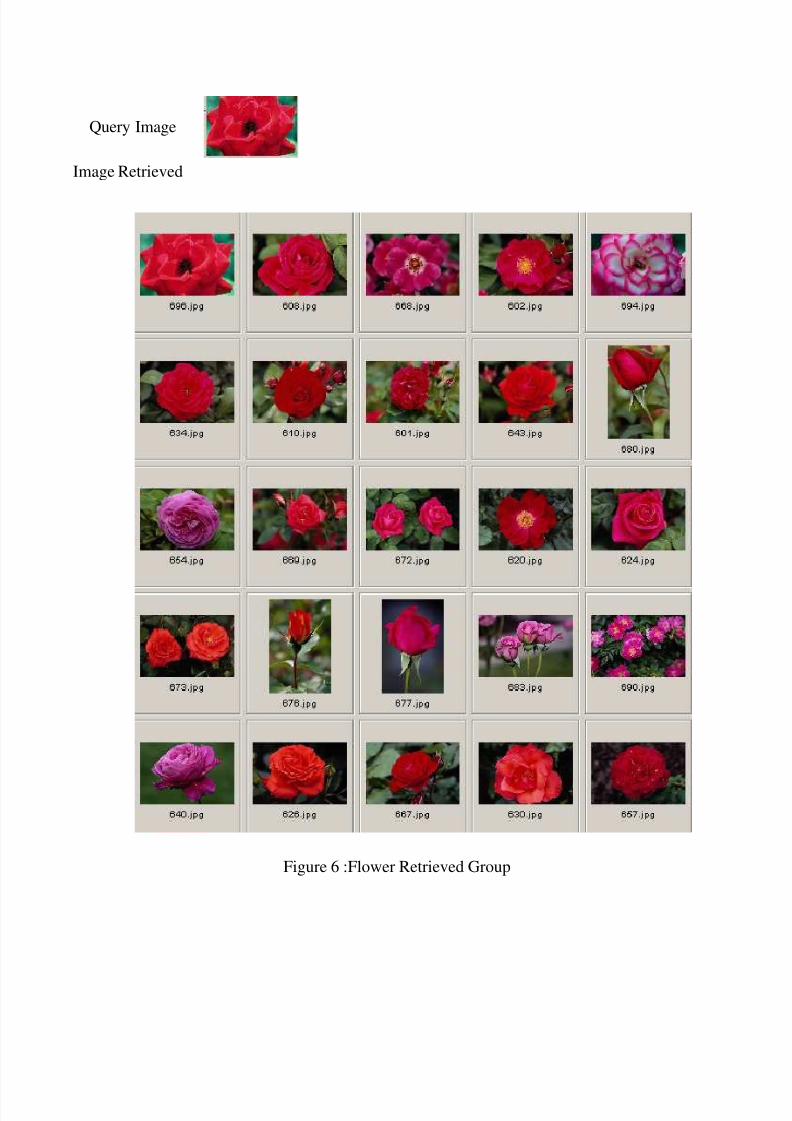
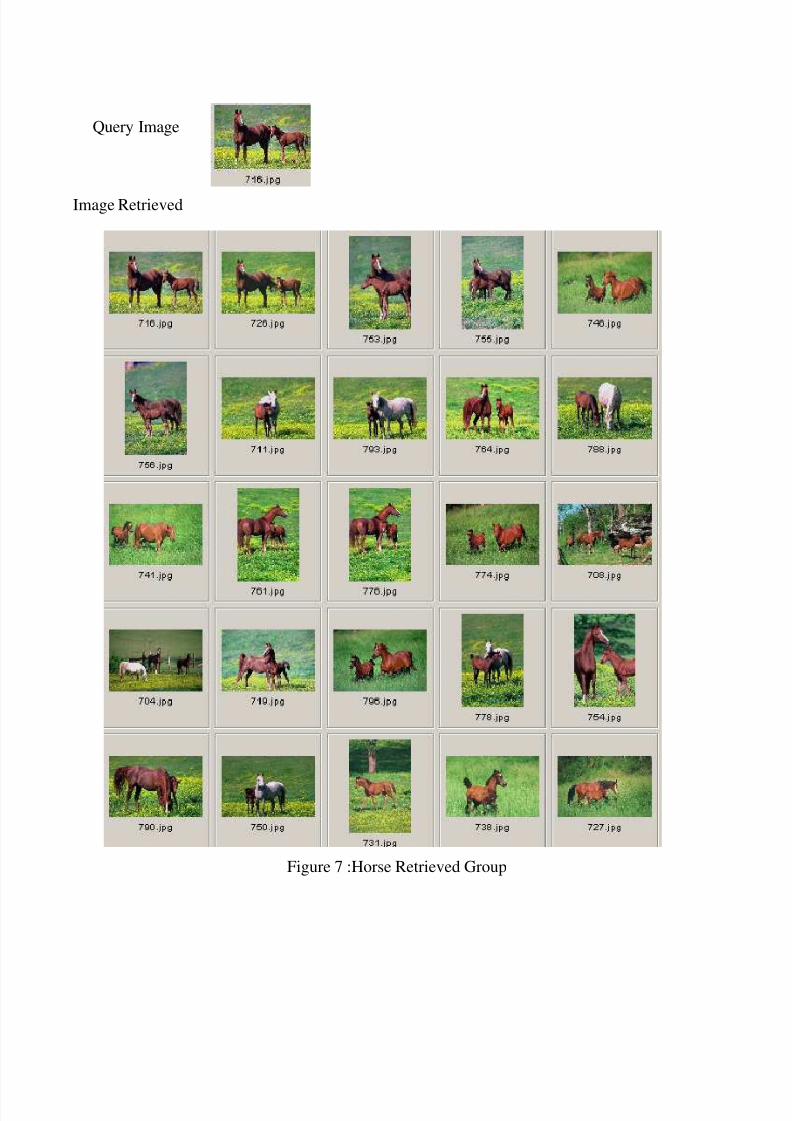
system. Also we use the collection which consistof 600 images Figure 6, Figure 7 example of
rose and horse query here we retrieved just
images more or equal 85% similarity in colour
,but in second group we use edge detection by
converting every images in collection to
grayscale and then the retrieved images will be
97% similar or up to 100% .
8/4/2019 Article Meri
http://slidepdf.com/reader/full/article-meri 6/20
Query Image
Image Retrieved
Figure5 :Apply Retrieved Group
8/4/2019 Article Meri
http://slidepdf.com/reader/full/article-meri 7/20
Query Image
Image Retrieved
Figure 6 :Flower Retrieved Group
8/4/2019 Article Meri
http://slidepdf.com/reader/full/article-meri 8/20
Query Image
Image Retrieved
Figure 7 :Horse Retrieved Group
8/4/2019 Article Meri
http://slidepdf.com/reader/full/article-meri 9/20
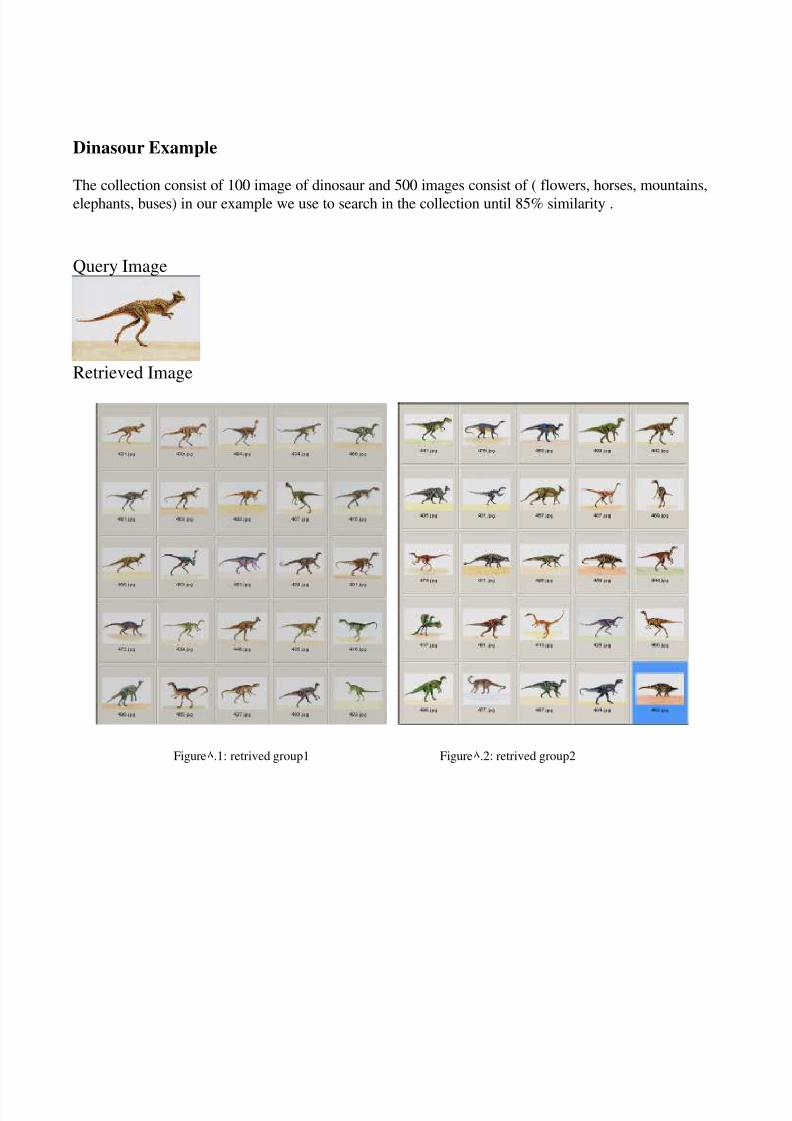
Dinasour Example
The collection consist of 100 image of dinosaur and 500 images consist of ( flowers, horses, mountains,
elephants, buses) in our example we use to search in the collection until 85% similarity .
Query Image
Retrieved Image
Figure٨.1: retrived group1 Figure٨.2: retrived group2
8/4/2019 Article Meri
http://slidepdf.com/reader/full/article-meri 10/20
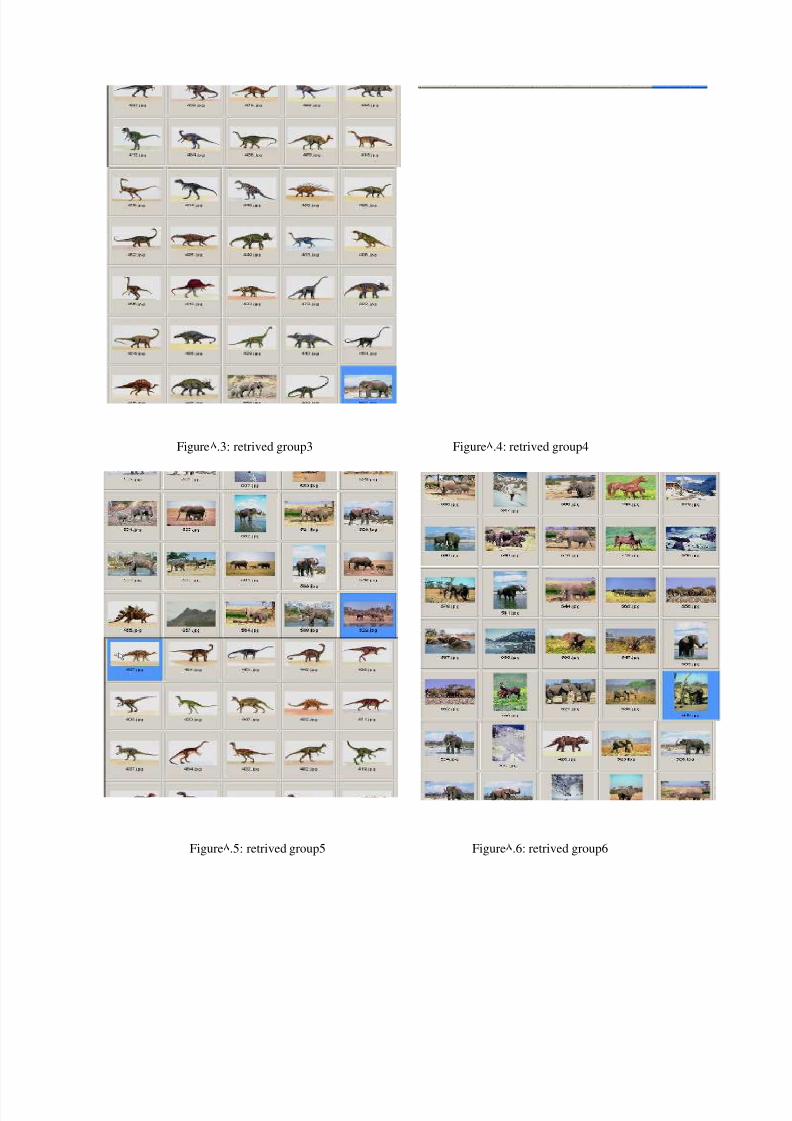
Figure٨.3: retrived group3 Figure٨.4: retrived group4
Figure٨.5: retrived group5 Figure٨.6: retrived group6
8/4/2019 Article Meri
http://slidepdf.com/reader/full/article-meri 11/20
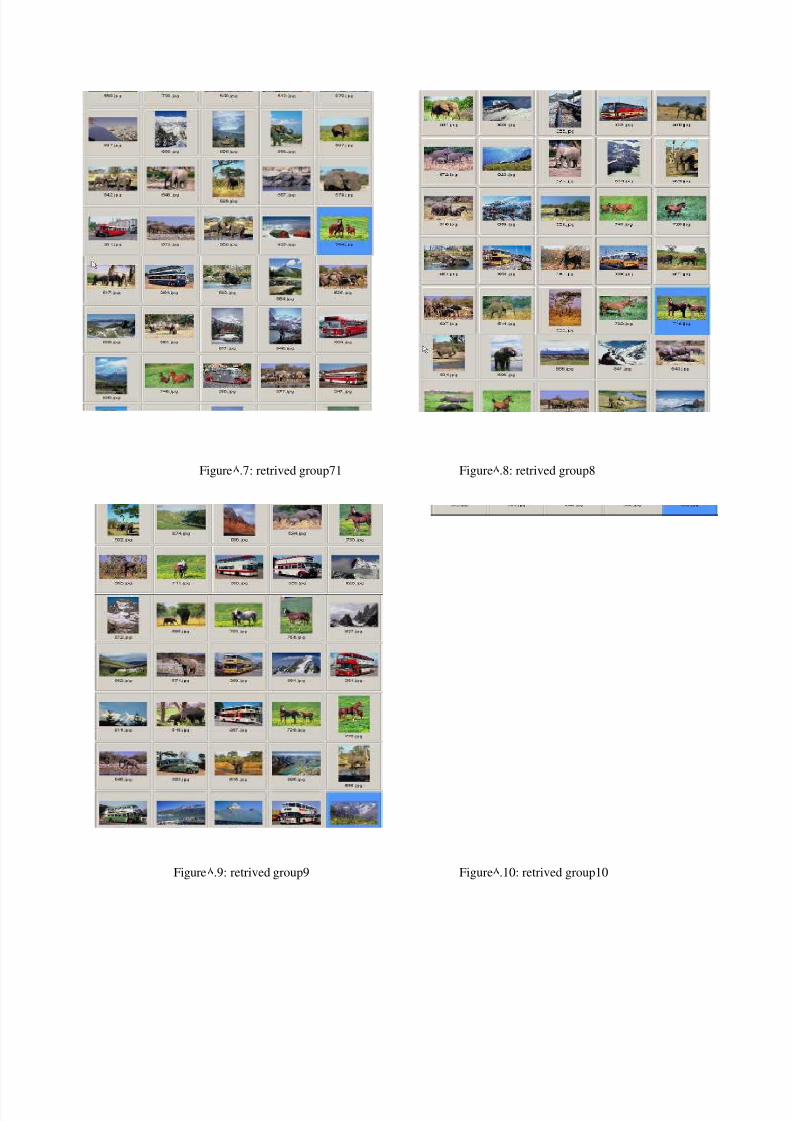
Figure٨.7: retrived group71 Figure٨.8: retrived group8
Figure٨.9: retrived group9 Figure٨.10: retrived group10
8/4/2019 Article Meri
http://slidepdf.com/reader/full/article-meri 12/20
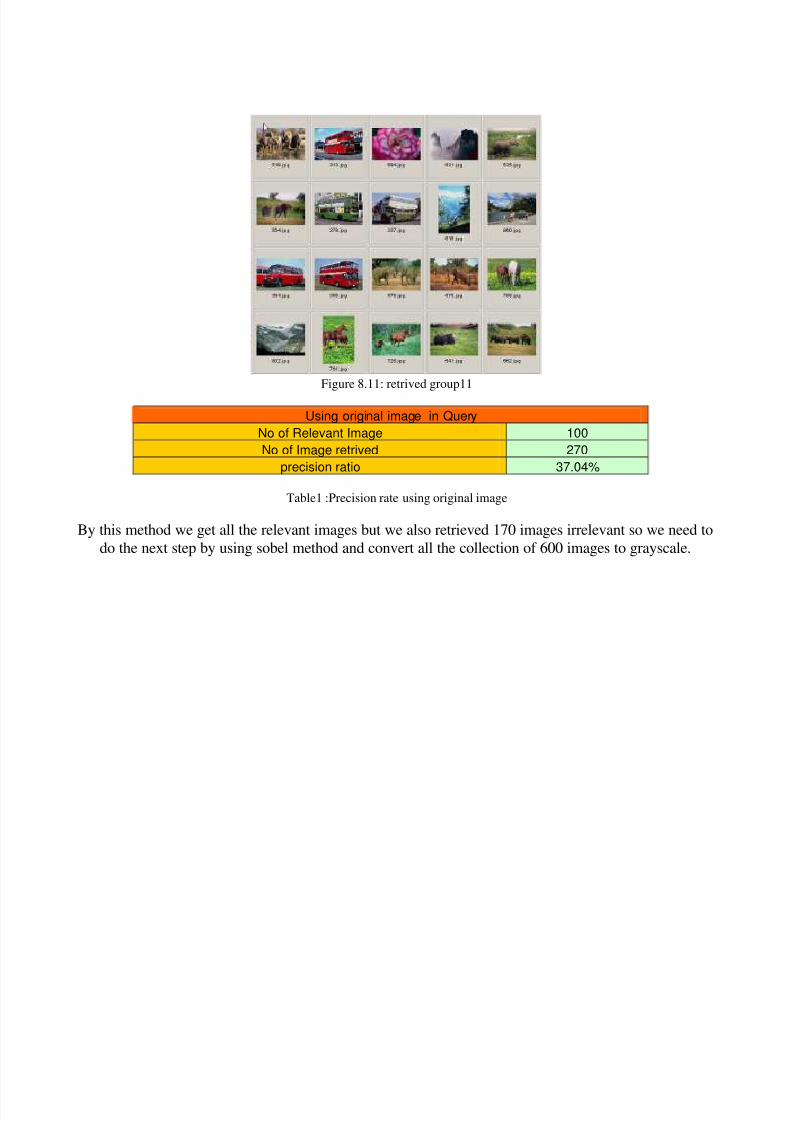
Figure 8.11: retrived group11
Using original image in Query
No of Relevant Image 100
No of Image retrived 270
precision ratio 37.04%
Table1 :Precision rate using original image
By this method we get all the relevant images but we also retrieved 170 images irrelevant so we need to
do the next step by using sobel method and convert all the collection of 600 images to grayscale.
8/4/2019 Article Meri
http://slidepdf.com/reader/full/article-meri 13/20
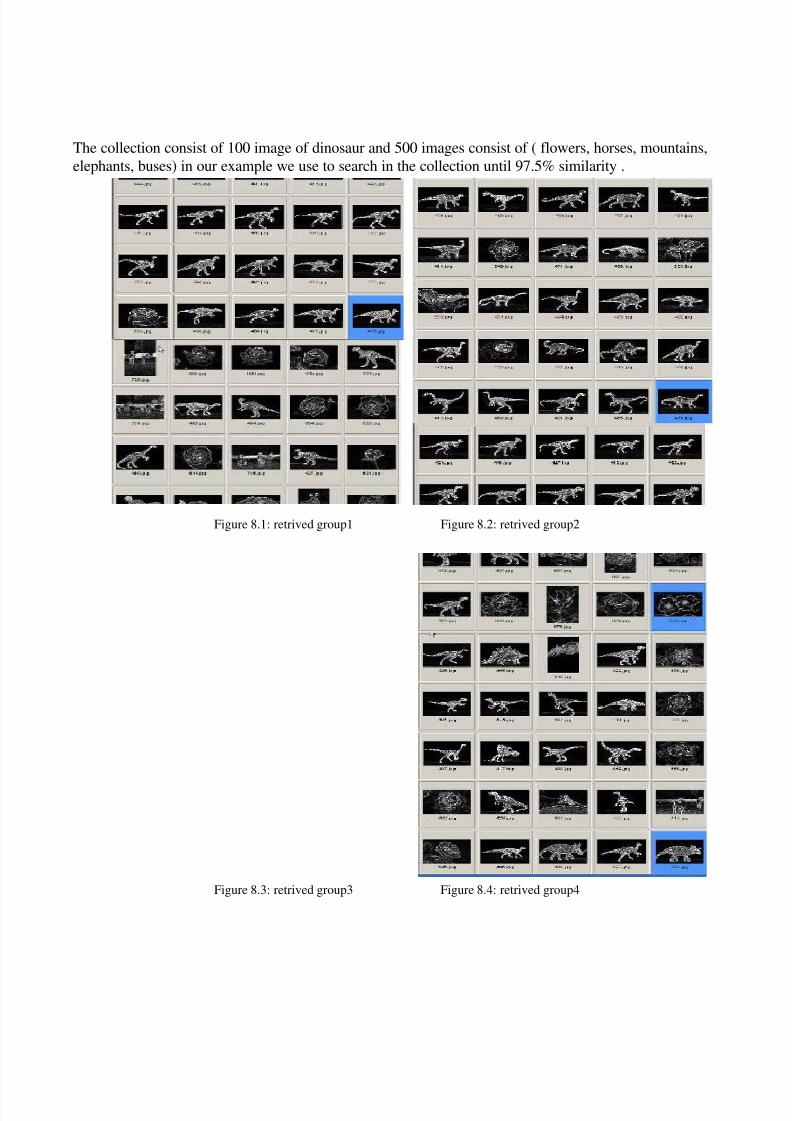
The collection consist of 100 image of dinosaur and 500 images consist of ( flowers, horses, mountains,
elephants, buses) in our example we use to search in the collection until 97.5% similarity .
Figure 8.1: retrived group1 Figure 8.2: retrived group2
Figure 8.3: retrived group3 Figure 8.4: retrived group4
8/4/2019 Article Meri
http://slidepdf.com/reader/full/article-meri 14/20
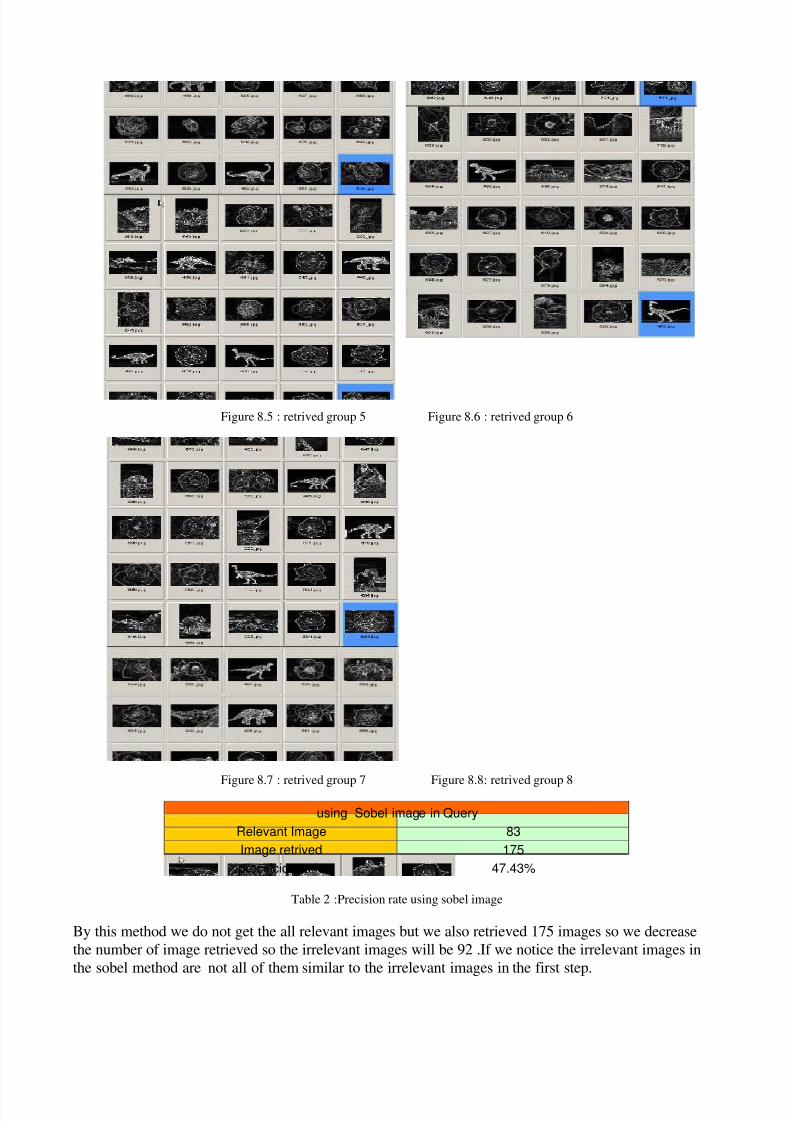
Figure 8.5 : retrived group 5 Figure 8.6 : retrived group 6
Figure 8.7 : retrived group 7 Figure 8.8: retrived group 8
using Sobel image in Query
Relevant Image 83
Image retrived 175
precsicion ratio 47.43%
Table 2 :Precision rate using sobel image
By this method we do not get the all relevant images but we also retrieved 175 images so we decrease
the number of image retrieved so the irrelevant images will be 92 .If we notice the irrelevant images in
the sobel method are not all of them similar to the irrelevant images in the first step.
8/4/2019 Article Meri
http://slidepdf.com/reader/full/article-meri 15/20
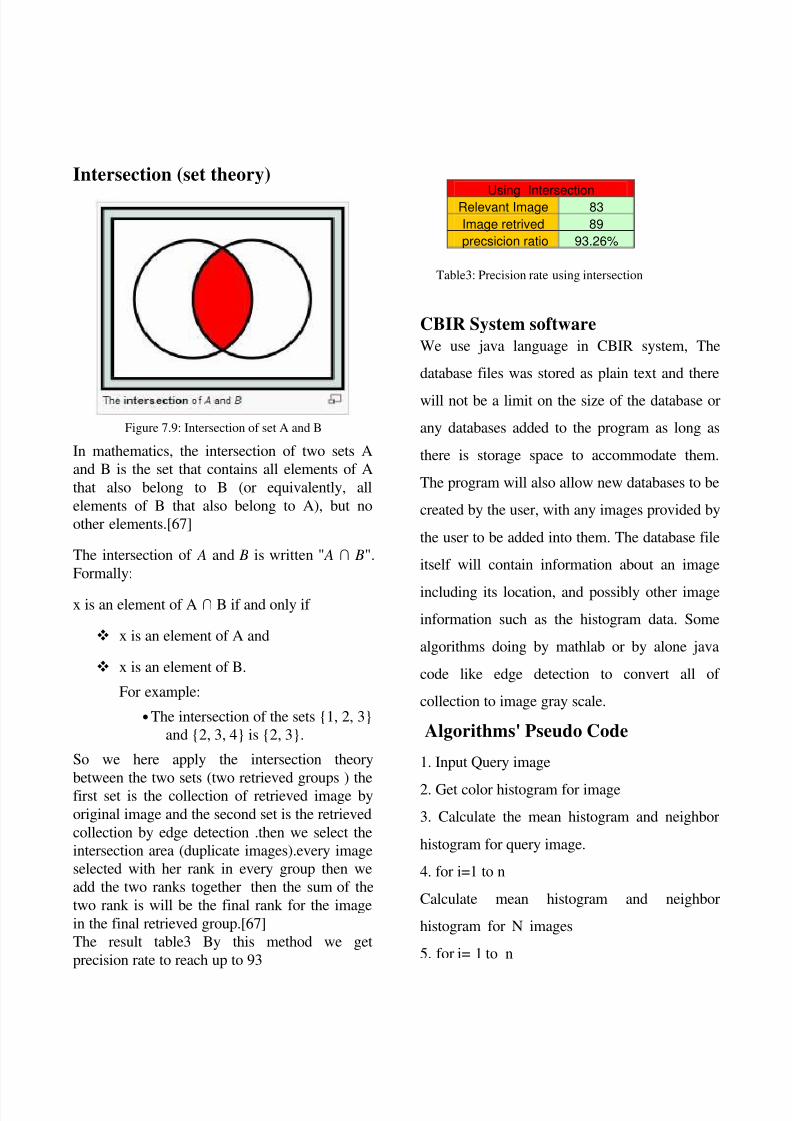
Intersection (set theory)
Figure 7.9: Intersection of set A and B
In mathematics, the intersection of two sets A
and B is the set that contains all elements of A
that also belong to B (or equivalently, all
elements of B that also belong to A), but no
other elements.[67]
The intersection of A and B is written " A ∩ B".
Formally:
x is an element of A ∩ B if and only if
x is an element of A and
x is an element of B.
For example:
• The intersection of the sets {1, 2, 3}
and {2, 3, 4} is {2, 3}.
So we here apply the intersection theory
between the two sets (two retrieved groups ) thefirst set is the collection of retrieved image by
original image and the second set is the retrieved
collection by edge detection .then we select the
intersection area (duplicate images).every image
selected with her rank in every group then we
add the two ranks together then the sum of the
two rank is will be the final rank for the image
in the final retrieved group.[67]
The result table3 By this method we get
precision rate to reach up to 93
Using IntersectionRelevant Image 83
Image retrived 89
precsicion ratio 93.26%
Table3: Precision rate using intersection
CBIR System software
We use java language in CBIR system, The
database files was stored as plain text and there
will not be a limit on the size of the database or
any databases added to the program as long as
there is storage space to accommodate them.
The program will also allow new databases to be
created by the user, with any images provided by
the user to be added into them. The database file
itself will contain information about an image
including its location, and possibly other image
information such as the histogram data. Some
algorithms doing by mathlab or by alone java
code like edge detection to convert all of
collection to image gray scale.
Algorithms' Pseudo Code
1. Input Query image
2. Get color histogram for image
3. Calculate the mean histogram and neighbor
histogram for query image.
4. for i=1 to n
Calculate mean histogram and neighbor
histogram for N images
5. for i= 1 to n
8/4/2019 Article Meri
http://slidepdf.com/reader/full/article-meri 16/20
If(histogram[query_image]-histogram[i]>=0.85)
then
Image_id_percent[i]=100*
(histogram[query_image]-histogram[i])
Else nothing
6.sort For each image_id_percent[1..n]
7.rank(color) every image depend on similarity
8.convert every image in collection to gray scale
using edge detection algotithm(sobel)
9. input Query image (gray scale)
10.get edge histogram for images
11. Calculate the mean histogram and neighbor
histogram for query image.
12. for i= 1 to n
If(histogram[query_image]-histogram[i]>=0.98)
then
Image_id_edge__percent[i]=100*
(histogram[query_image]-histogram[i])
Else nothing
13.sort For each image_id__edge_percent[1..n]
14.rank(edge_image) every image depend on
similarity
15.do intersection between the two retrieved
collection (edge_images and color_images)
16.rank_intersection = rank(edge_image)+
rank(color)
17. Get retrieved images
End.
Conclusions and Future Work
The choice of a feature selection method plays a
critical role in the success of a versatile CBIR
system The main contribution of this thesis is
the design of a new application with new
methodology to generate retrieved images for an
image content And decrease the number of
irrelevant images. The system use options for
feature selection and extraction feature
combination and weighting, and similarity
measures, all available through a GUI We have
also introduced a metric for ranking the results,
based on the comparison of histogram images
between a query image and the image collection.
In Future we intend to be more specific in type
of images that mean to be more specific with
some methodology and algorithms, and trying to
decrease the number of irrelevant of retrieved
group.
REFERENCES
[1] http://en.wikipedia.org/wiki/CBIR
[2] M.E.Osadebey .INTEGRATED CONTENT-BASEDIMAGE RETRIEVAL USING TEXTURE, SHAPE AND
SPATIAL INFORMATION ,February 2006
[3] Flickner, M et al (1995) “Query by image and video
content: the QBIC system” IEEE Computer 28(9), 23-32
[4] Gupta, A et al (1996) “The Virage image search
engine: an open framework for image management” in
Storage and Retrieval for Image and Video Databases IV,
Proc SPIE 2670, pp 76-87
[5] Sutcliffe, A et al (1997) “Empirical studies in
multimedia information retrieval” in Intelligent
Multimedia Information Retrieval (Maybury, M T, ed).
AAAI Press, Menlo Park, CA.
[6] A Del Bimbo, Visual Information Retrieval, Morgan
Kaufmann Ed., 1999
[7] This proverb is a variation of the original sentence:
“One Picture is Worth Ten Thousand Words” actually
8/4/2019 Article Meri
http://slidepdf.com/reader/full/article-meri 17/20
fabricated by an advertising executive in California in
1927 .
[8] Thomas S. Huang, Yong Rui, and Shinh-Fu Chang,
Image retrieval: Past, Present and Future, InternationalSymposium on Multimedia Information Processing, 1997.
[9] P. G. B Enser, Query analysis in a visual information
retrieval context, Journal of Document and Text
Management, pg. 25 -52, 1993
[10] C. C. Venters and M. Cooper, Content-based image
retrieval, Technical Report, JISC Technology Application
Program, 2000
[11] J. R. Smith and S.-F. Chang. An image and video
search engine for the world-wide web. In Proc. of the
SPIE Storage and Retrieval for Image and Video
Databases, volume 3022, pages 85–95, San Jose, CA,
USA,February 1997.
[12]wwwqbic.almaden.ibm.com
[13]http://white.media.mit.edu/vismod/demos/photobook.
[14] A. Pentland, R. W. Picard, and S. Sciaroff.
Photobook: Content-based manipulation of image
databases. International Journal of Computer
Vision,18(3):233–254, 1996
[15]knight.cis.temple.edu/~lakaemper/courses/cis595_200
4/papers/wang2001.pdf
[16]http://www.ee.columbia.edu/ln/dvmm/researchProject
s/MultimediaIndexing/VisualSEEk/VisualSEEk.htm
[17] www.mwlabs.de
[18] J. Laaksonen, M. K oskela, and E. Oja. PicSOM-
Self-Organizing Image
Retrieval with MPEG-7 Content Descriptors. IEEE
Transactions on Neural Networks, 13(4):841–853, July
2002.
[19] J. T. Laaksonen, J. M. Koskela, S. P. Laakso, , and E.
Oja. PicSOM -Content-based Image Retrieval with Self-
Organizing Maps. Pattern Recognition Letters, 21(13–
14):1199–1207, December 2000.
[20]http://www-db.ics.uci.edu/pages/research/mars.shtml.
[21] J. Bach, C. Fuller, A. Gupta, A. Hampapur, B.
Gorowitz, R. Humphrey, R. Jain, and C. Shu. Virage
image search engine: an open framework for image
management. In Proceedings of the SPIE, Storage and
Retrieval for Image and Video Databases IV, San Jose,
CA, pages 76-87, February 1996[22] http://www.science.uva.nl/research/isis/pictoseek/
[23] Theo Gevers and Arnold Smeulders. Pictoseek:
Combining color and shape invariant features for image
retrieval. IEEE Transactions on Image Processing,
9(1):102–119, January 2000.
[24]http://en.wikipedia.org/wiki/Sobel_operator
[25]G. Ciocca, I. Gagliardi, and R. Schettini. Quicklook2:
An integrated multimedia system. International Journal of
Visual Languages and Computing, Special Issue on
Multimedia Databases and Image Communication, in
print.
[26] Ramesh Jain S.N. Jayaram Murthy and Peter L-J.
Chen (Luong Tran), "Similarity Measures for Image
Databases" in Storage and Retrieval for Image and Video
DatabasesIII, SPIE vol. 2420:58-65,1995
[27] B. Ooi, K. Tan, and W. Hsu, “Fast image retrieval
using color-spatial information,” The VLDB Journal, vol.
7, pp. 115–128, 1998.
[28] K. Tan, B. Ooi, and C. Yee, “An evaluation of color-
spatial retrieval techniques for large image databases,”
Multimedia Tools and Applications, vol. 14, no. 1, pp.
55–78, 2001.
[29] X. Wan and C.-C. Kuo, “A new approach to image
retrieval with hierarchical color clustering,”IEEE
Transactions on Circuits and Systems for Video
Technology, vol. 8, no. 5, pp. 628–643,1998.
[30] A. S. T. Gevers, “Content-based image retrieval by
viewpoint-invariant color indexing,” Image and Vision
Computing, vol. 17, no. 7, pp. 475–488, 1999.
[31] Y. Liang, H. Zhai, and P. Chavel, “Fuzzy color-
image retrieval,” Optics Communications, vol.212, no. 4–
6, pp. 247–250, 2002.
[32] J. Han and K.-K. Ma, “Fuzzy color histogram and its
use in color image retrieval,” IEEE Transactions on Image
Processing, vol. 11, no. 8, pp. 944–952, 2002.
8/4/2019 Article Meri
http://slidepdf.com/reader/full/article-meri 18/20
[33] Y. Tao and W. Grosky, “Spatial color indexing using
rotation, translation, and scale invariant anglograms,”
Multimedia Tools and Applications, vol. 15, no. 3, pp.
247–268, 2001.[34] J Huang, S. Kumar, M. Mitra, W. Zhu, and R. Zabih,
“Spatial color indexing and applications,”International
Journal of Computer Vision, vol. 35, no. 3, pp. 245–
268,1999
[35] D. Androutsos, K. N. Plataniotis, and A. N.
Venetsanopoulos, “A novel vector-based approach to
color image retrieval using a vector angular-based
distance measure,” Computer Vision and Image
Understanding, vol. 75, no. 1–2, pp. 46–58, 1999.
[36] D. Yining, B. Manjunath, C. Kenney, M. Moore, and
H. Shin, “An efficient color representation for image
retrieval,” IEEE Transactions on Image Processing, vol.
10, no. 1, pp. 140–147, 2001.
[37] M. Nascimento, V. Sridhar, and X. Li, “Effective and
efficient region-based image retrieval,”Journal of Visual
Languages and Computing, vol. 14, no. 2, pp. 151–179,
2003.Bibliography 122
[38] R. Gonzales and R. Woods, Digital Image
Processing. Addison-Wesley Publishing Company,1992.
[39] P. Huang and S. Dai, “Image retrieval by texture
similarity,” Pattern Recognition, vol. 36,no. 3, pp. 665–
679, 2003.
[40] J. Francos, A. Narasimhan, and J. Woods,
“Maximum likelihood parameter estimation of textures
using a wold-decomposition based model,” IEEE
Transactions on Image Processing, vol. 4, no. 12, pp.
1655–1666, 1995.
[41] F. Liu and R. Picard, “Periodicity, directionality, and
randomness: Wold features for image modeling and
retrieval,” IEEE Transactions on Pattern Analysis and
Machine Intelligence, vol. 18, no. 7, pp. 722–733, 1996.
[42] J. Francos, A. Meiri, and B. Porat, “A unified texture
model based on a 2-d wold-like decomposition,” IEEE
Transactions on Signal Processing, vol. 41, no. 8, pp.
2665–2678, 1993.
[43] R. Sriram, J. Francos, and W. Pearlman, “Texture
coding using a wold decomposition model,”IEEE
Transactions on Image Processing, vol. 5, no. 9, pp.
1382–1386, 1996.[44] I. Elfadel and R. Picard, “Gibbs random fields,
cooccurrences, and texture modeling,” IEEE Transactions
on Pattern Analysis and Machine Intelligence, vol. 16, no.
1, pp. 24–37, 1994.
[45] M. Do and M. Vetterli, “Rotation invariant texture
characterization and retrieval using steerable wavelet-
domain hidden markov models,” IEEE Transactions on
Multimedia, vol. 4, no. 4, pp. 517–527, 2002.
[46] “Wavelet-based texture retrieval using generalized
gaussian density and kullback-leibler distance,” IEEE
Transactions on Image Processing, vol. 11, no. 2, pp.
146–158, 2002.
[47] C.-M. Pun, “Rotation-invariant texture feature for
image retrieval,” Computer Vision andImage
Understanding, vol. 89, no. 1, pp. 24–43, 2003.
Bibliography 123
[48] S. Grigorescu, N. Petkov, and P. Kruizinga,
“Comparison of texture features based on gabor filters,”
IEEE Transactions on Image Processing, vol. 11, no. 10,
pp. 1160–1167, 2002.
[49] B. Mehtre, M. Kankanhalli, and W. Lee, “Shape
measures for content based image retrieval: a
comparison,” Information Processing and Management,
vol. 33, no. 3, pp. 319–337, 1997.
[50] M. Bober, “MPEG-7 visual shape descriptors,” IEEE
Transactions on Circuits and Systems for Video
Technology, vol. 11, no. 6, pp. 716–719, 2001.
[51] D. Zhang and G. Lu, “A comparative study of
curvature scale space ,Fourier descriptors for shape-based
image retrieval,” Journal of Visual Communication and
Image Representation, vol. 14, no. 1, pp. 39–57, 2003.
[52] “Shape-based image retrieval using generic Fourier
descriptor,” Signal Processing: Image Communication,
vol. 17, no. 10, pp. 825–848, 2002.
8/4/2019 Article Meri
http://slidepdf.com/reader/full/article-meri 19/20
[53] S. Abbasi and F. Mokhtarian, “Affine-similar shape
retrieval: application to multiview 3-d object recognition,”
IEEE Transactions on Image Processing, vol. 10, no. 1,
pp. 131–139, 2001.[54] F. Mokhtarian and S. Abbasi, “Shape similarity
retrieval under affine transforms,” Pattern Recognition,
vol. 35, no. 1, pp. 31–41, 2002.
[55] James Z. Wang, "Integrated Region-Based Image
Retrieval", Boston, Kluwr Academic Publishers ,2001
[55] S.S. Iyengar and R.L. Kashyap. Special section on
image database systems. IEEE Transactions on Software
Engineering, 14(5):608–688, May 1988.
[56] Amarnath Gupta and Ramesh Jain. Visual
information retrieval. Communications of ACM,
40(5):71–79, May 1997.
[57]http://www2.cs.fit.edu/~wds/classes/cse5255/cse5255/
davis/text.html
[58] J. R. Smith and S.-F. Chang. " Automated image
retrieval using color and texture", Technical Report
CU/CTR 408-95-14, Columbia University, July 1995.
[59] J. R. Smith and S.-F. Chang. " Tools and techniques
for color image retrieval", In Symposium on Electronic
Imaging: Science and Technology - Storage & Retrieval
for Image and Video Databases IV, volume 2670, San
Jose, CA, February 1996. IS&T/SPIE.
[60] en.wikipedia.org/wiki/Edge_detection
[61] J. R. Smith and S.-F. Chang. "VisualSEEk: a fully
automated content-based image query system.", ACM
Multimedia '96, November, 1996.
[62] J. R. Smith and S.-F. Chang. " Automated image
retrieval using color and texture", Technical Report
CU/CTR 408-95-14, Columbia University, July 1995.
[63]http://scien.stanford.edu/class/psych221/projects/02/s
ojeong/
[64] A Chalechale AND Alfred "Mertins Image
Representation Based on Edge Pixel Neighborhood
Information (EPNI) " January 2002
[65]http://en.wikipedia.org/wiki/Edge_detection
[66]http://homepages.inf.ed.ac.uk/rbf/HIPR2/sobel.htm
[67]http://en.wikipedia.org/wiki/Intersection_(set_theory).
[68]Fumikazu Kanehara, Shin’ichi Satoh, and Takashi
Hamada. A flexible image retrieval using explicit visual
instruction. In Proceedings of the ThirdnternationalConference on Document Analysis Recognition,
Montreal, Canada, August ’95, pages 175–178, 1995

8/4/2019 Article Meri
http://slidepdf.com/reader/full/article-meri 20/20
الحدود واأللواناكتشافاسترجاع الصورة عن طريق محتوياتها باستخدام
٢ شعرأبو سعيد محمد. ،د١ خالد فايز ميري.أ١ةعماج نيطسلف ،، ايلعلا تاساردلا مسق يجولونكت ا تامولعملانيطسلف ، ةزغ،. ٢ةعماج ، ةيلهألا نامعةيلك ، نامع ، تامولعملا ايجولونكت ندرألا
ملخصال
الصور عـن طريـق وانطالقا من محتوى استرجاع صعبة مهمةاسترجاع الصور عن طريق محتوياتها هيإن
هدفنا فـي. منخفض السماتال مستوىال تستخدم التقنيات المتاحة فقط علىهي مهمة صعبة و) )CBIRمحتوياتها
الـدمج ولذلك قدمنا منهجية المقارنة بين الصور باستخدامالبحث هو استخدام البحث عن طريق األلوان والحدود
ط وسـ ال ك وتطبيق الخوارزميـات المعروفـة فـي المقارنـاتاأللواناكتشاف الحدود والمقارنة باستخدام بين
التي يمكن أن توفر مجموعة كبيرة من الصور وعلى الصور األصلية والصور بعد تغييرها.الجوار وخوارزمية
هـو تطـوير تركيزنا في هذا البحث. لمسافات التدابير التي يمكن استخدامها منفردة أو مجتمعة لمالمح الصورة
لتطوير طريقة فعالة لدعم االستعالمالمقارنة خوارزمية جديدة عن طريق الجمع بين أكثر السمات وخوارزميات
تطبيق لالتدابير مسافة محددة من باستخدام مجموعة من الصور مع قواعد البيانات للمستخدمين بين بسرعة كبيرة
ثم تطبيقها على الصور بعد تحويلهـا باسـتخدام حتى نسبة معينة ومنالخوارزمية على الصور الملونة كما هي
الوسط والجوار على الصور المحولة ومن ثم اسـتخدام خوارزميـة التقـاطع بـيناستخدام و خوارزمية سوبل
تم تطبيق نظـام الختبـار األسـاليب. وذلك لتحسين النتائجالمجموعتين وذلك لحذف الصور الغير مرغوب بها
الصور الصغيرةعلى مجموعة قاعدة بيانات وأيضاالمطورة وتقييمها على مجموعة قاعدة بيانات الصور الكبيرة
استبعاد الصور غير المرغوب بها فـي نتائج هذا البحث ستكون تقنيات تسهل سرعة استرجاع الصور من خالل
.على قاعدة البيانات المتنامية يمكن تنفيذهالبحث داخل قاعدة البيانات مما يجعل البحث
رة،اكتشاف الحافة ،االستعالم بالصورةاسترجاع الصورة عن طريق محتوياتها ،استرجاع الصو:الكلمات الدالة