


![Glucocorticoid-induced Cell Death Requires …...[CANCER RESEARCH 59, 1378–1385, March 15, 1999] Glucocorticoid-induced Cell Death Requires Autoinduction of Glucocorticoid Receptor](https://static.fdocuments.us/doc/165x107/5e5646d0314f24389e233453/glucocorticoid-induced-cell-death-requires-cancer-research-59-1378a1385.jpg)

Languages
Pages
Legal

A Common Mechanism of CellularDeath Induced by Bactericidal
Antibiotics
Michael A. Kohanski, Daniel J. Dwyer, Boris Hayete,Carolyn A. Lawrence, and James J. Collins
Boston University, Boston, MA
Cell. 2007 Sept 7;130( 5): 797-810
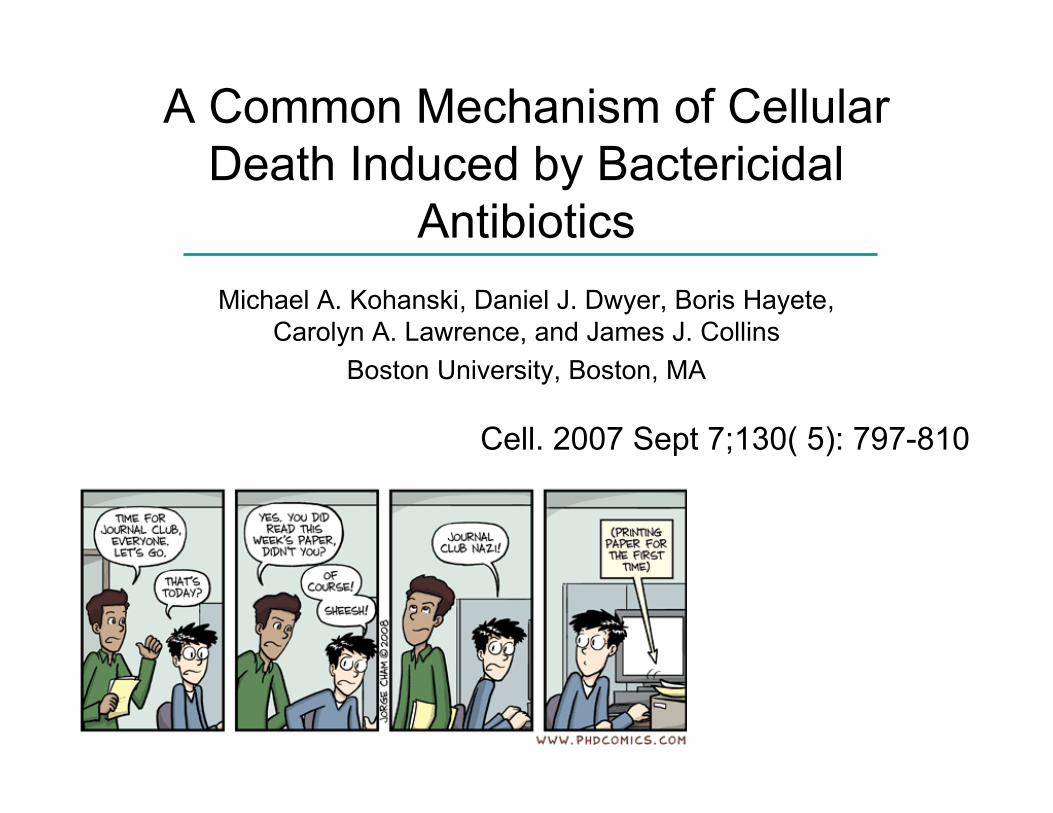
Two Anti-Microbial Therapies
• Bactericidal– Kill >99.9% bacteria– Specific Drug-Target interactions
• Bacteriostatic– Inhibit growth of bacteria
• Sometimes not a clear line between twoclasses. High concentrations ofbacteriostatic can result in killing.
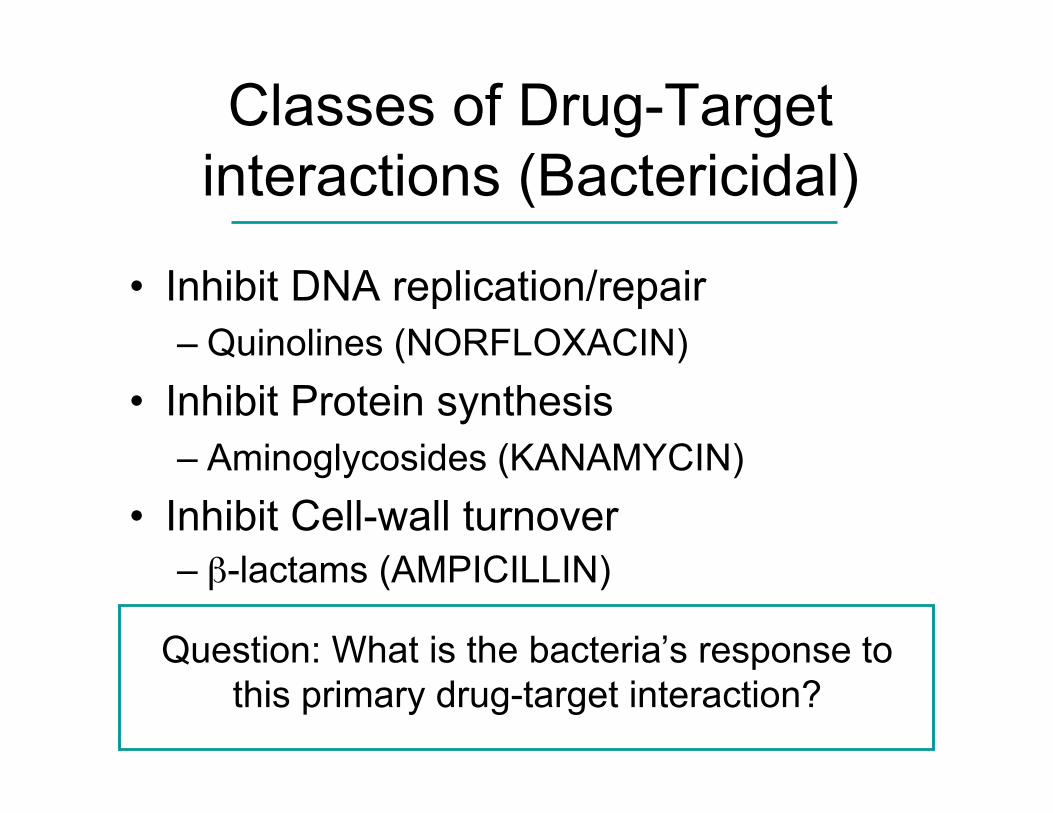
Classes of Drug-Targetinteractions (Bactericidal)
• Inhibit DNA replication/repair– Quinolines (NORFLOXACIN)
• Inhibit Protein synthesis– Aminoglycosides (KANAMYCIN)
• Inhibit Cell-wall turnover– β-lactams (AMPICILLIN)
Question: What is the bacteria’s response tothis primary drug-target interaction?
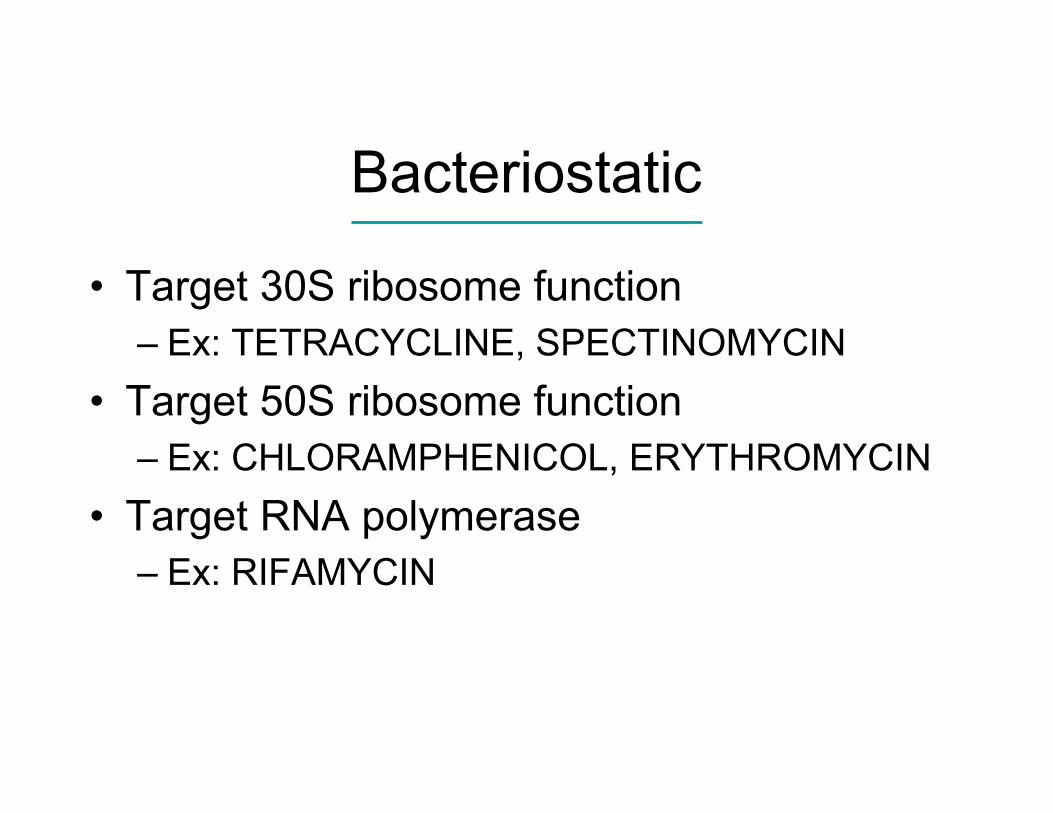
Bacteriostatic
• Target 30S ribosome function– Ex: TETRACYCLINE, SPECTINOMYCIN
• Target 50S ribosome function– Ex: CHLORAMPHENICOL, ERYTHROMYCIN
• Target RNA polymerase– Ex: RIFAMYCIN
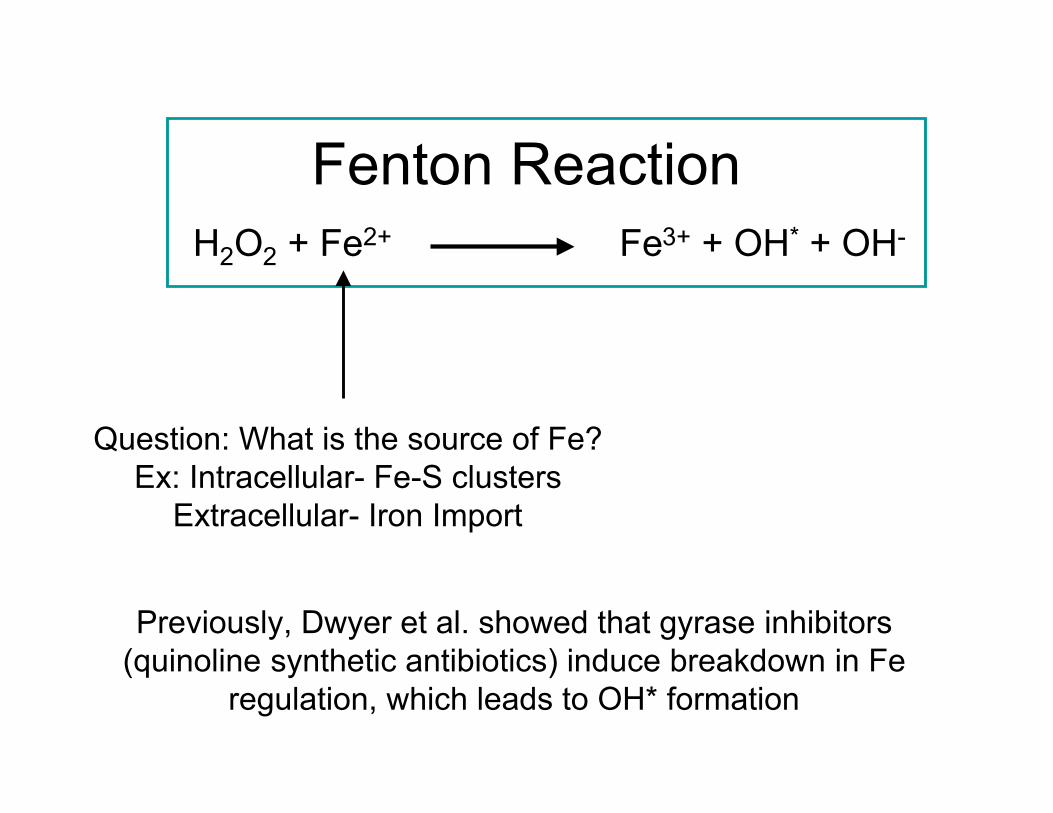
Fenton ReactionH2O2 + Fe2+ Fe3+ + OH* + OH-
Previously, Dwyer et al. showed that gyrase inhibitors(quinoline synthetic antibiotics) induce breakdown in Fe
regulation, which leads to OH* formation
Question: What is the source of Fe?Ex: Intracellular- Fe-S clusters
Extracellular- Iron Import
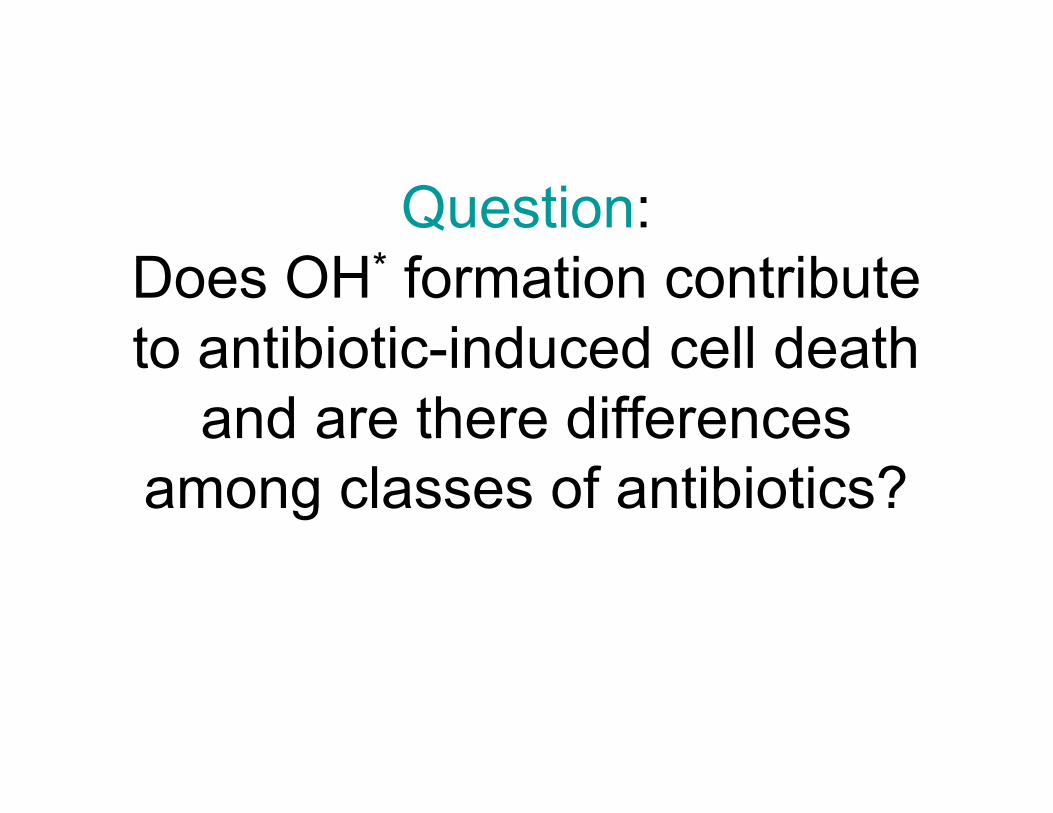
Question:Does OH* formation contributeto antibiotic-induced cell death
and are there differencesamong classes of antibiotics?
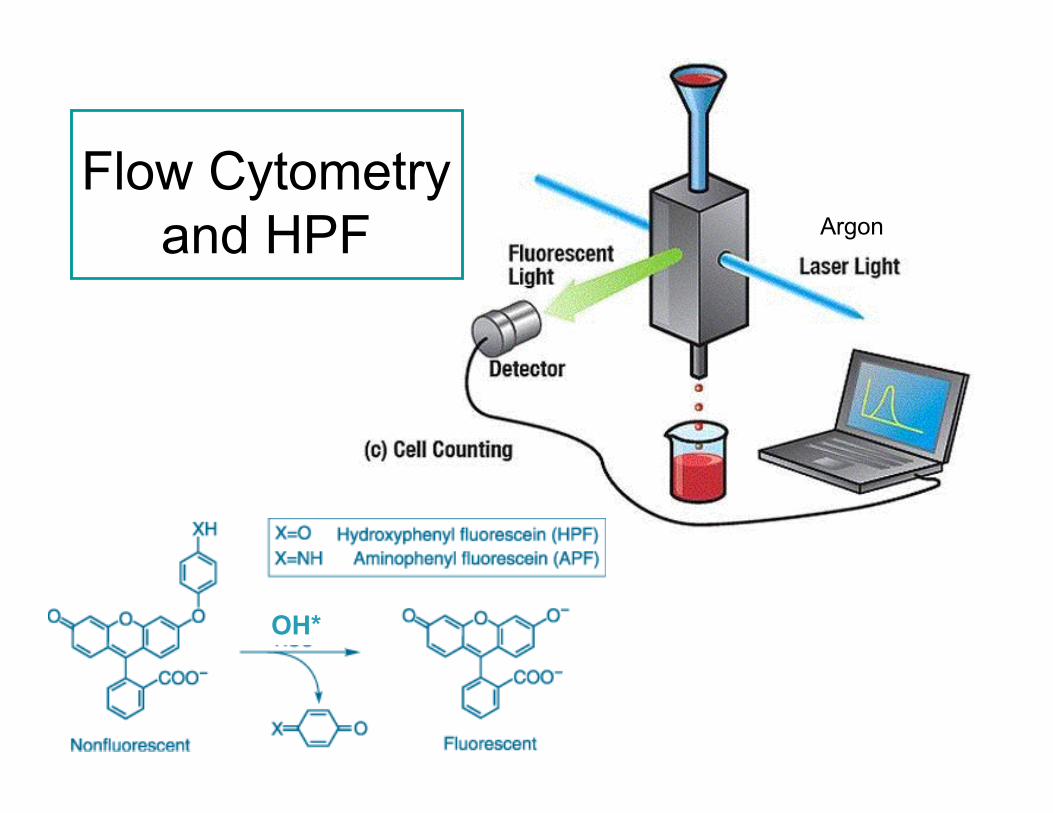
OH*
Flow Cytometryand HPF
OH*
Argon
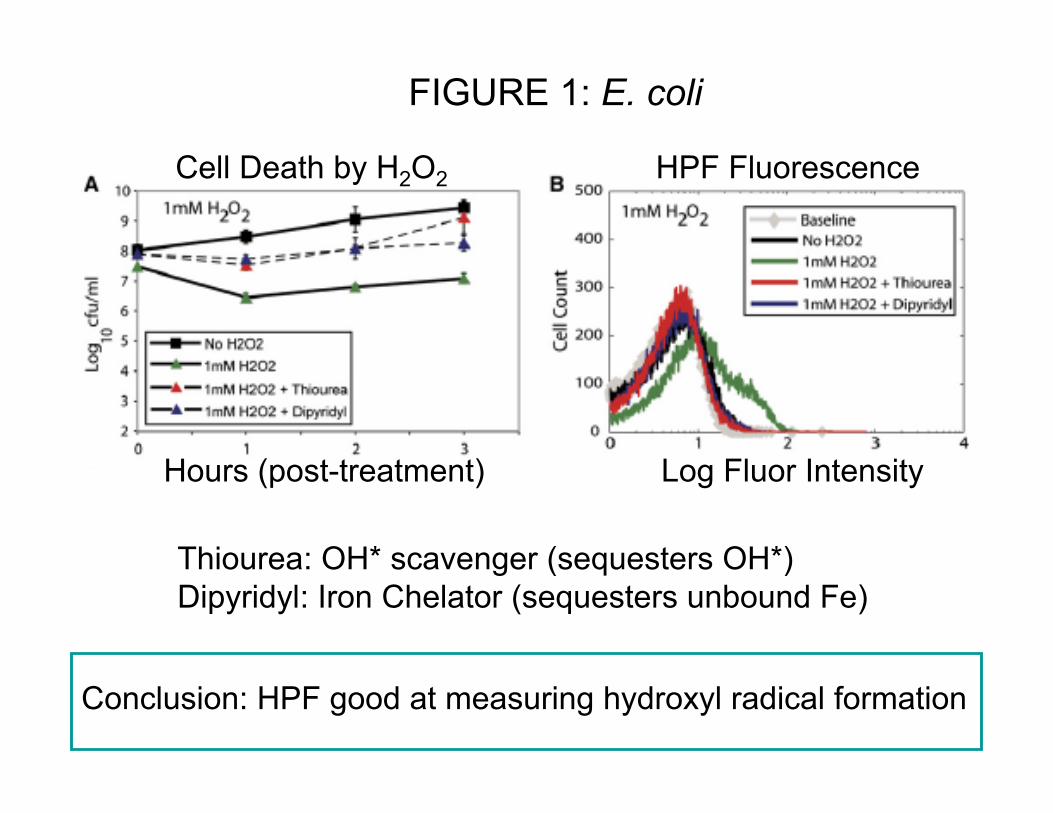
Thiourea: OH* scavenger (sequesters OH*)Dipyridyl: Iron Chelator (sequesters unbound Fe)
Cell Death by H2O2 HPF Fluorescence
Hours (post-treatment) Log Fluor Intensity
Conclusion: HPF good at measuring hydroxyl radical formation
FIGURE 1: E. coli
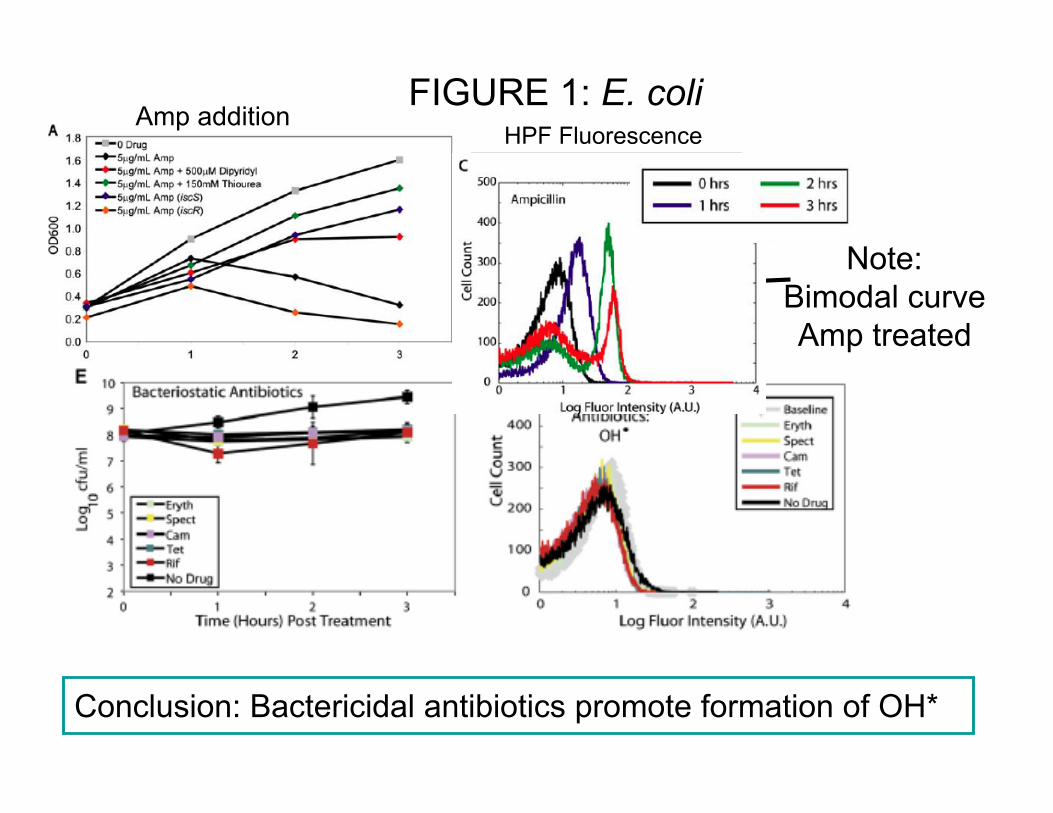
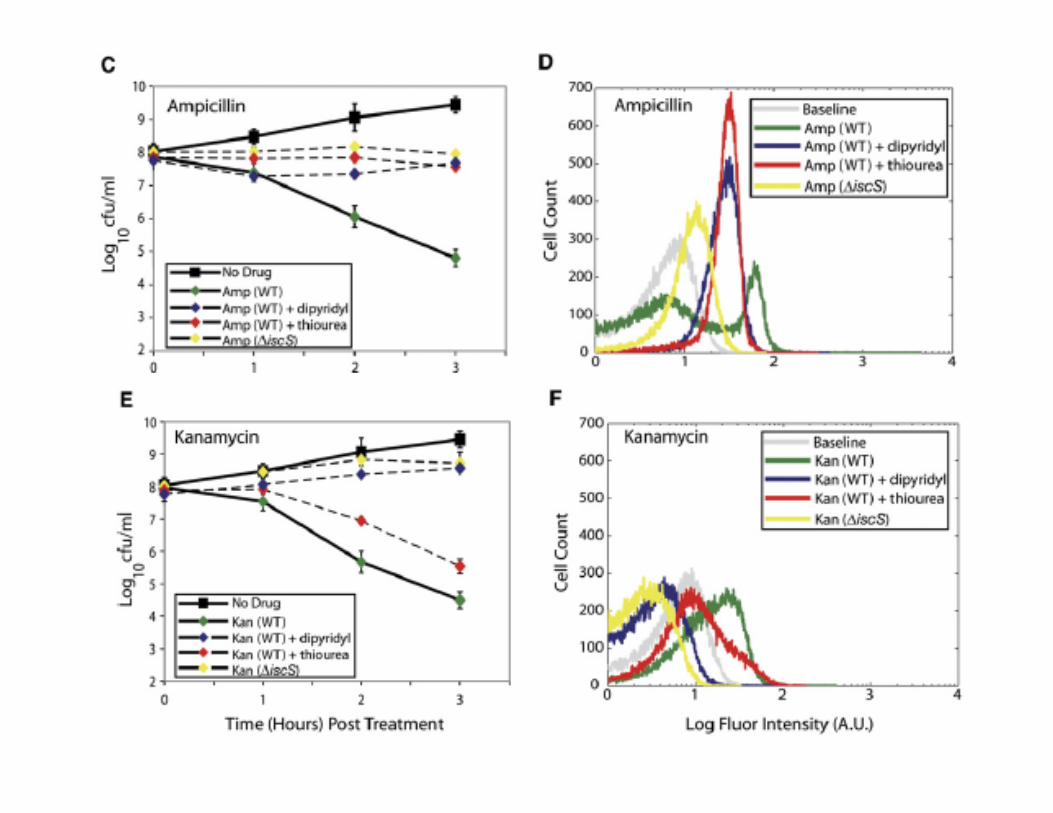
Cell Death by Bactericidals HPF Fluorescence
Note:Bimodal curveAmp treated
FIGURE 1: E. coli
Conclusion: Bactericidal antibiotics promote formation of OH*
Amp addition
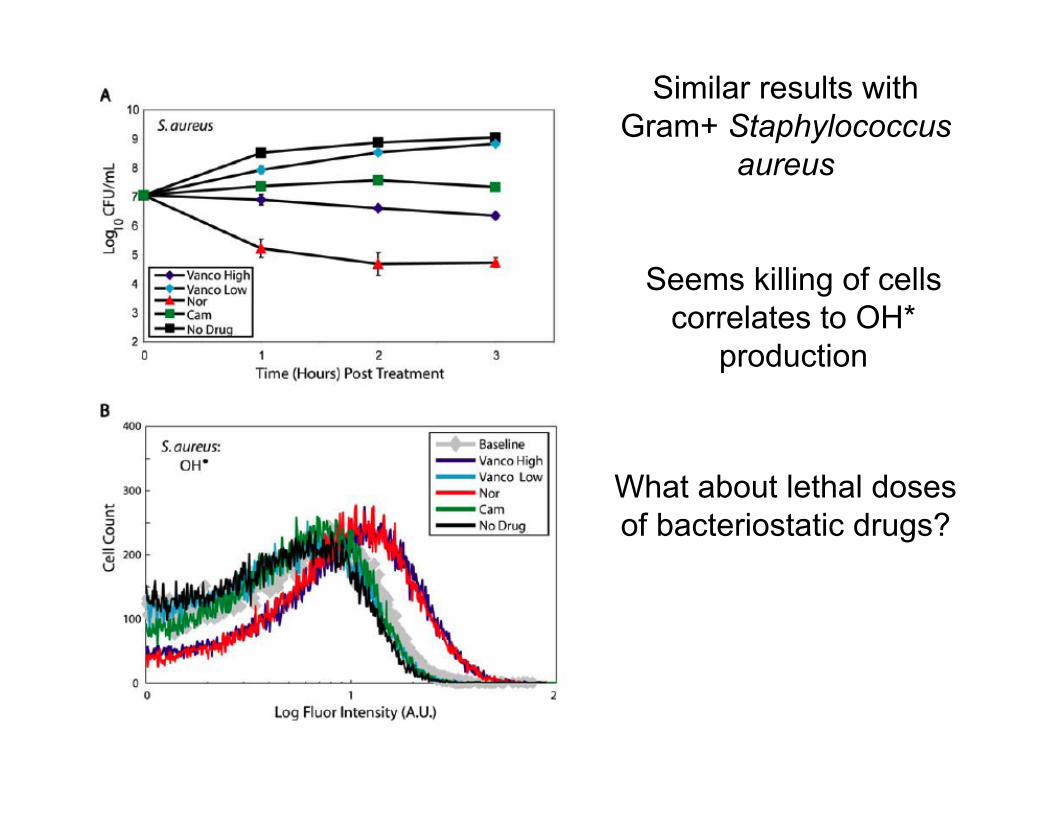
Similar results withGram+ Staphylococcus
aureus
Seems killing of cellscorrelates to OH*
production
What about lethal dosesof bacteriostatic drugs?
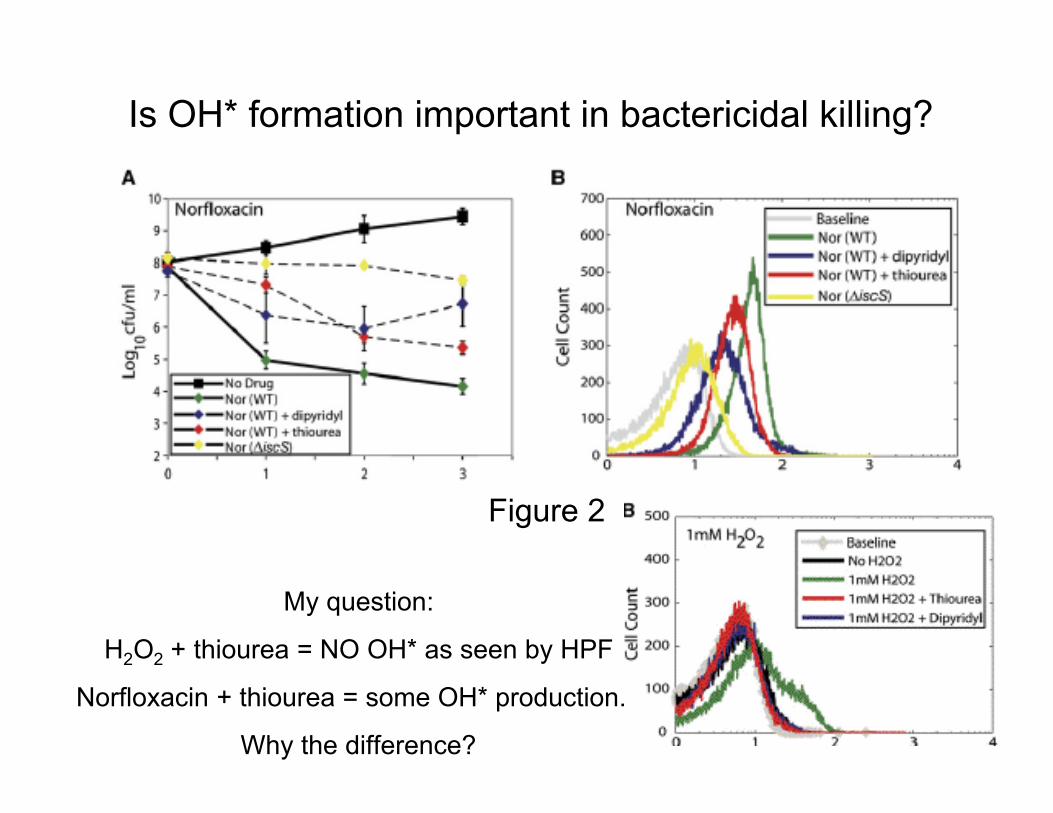
Is OH* formation important in bactericidal killing?
Figure 2
My question:
H2O2 + thiourea = NO OH* as seen by HPF
Norfloxacin + thiourea = some OH* production...
Why the difference?
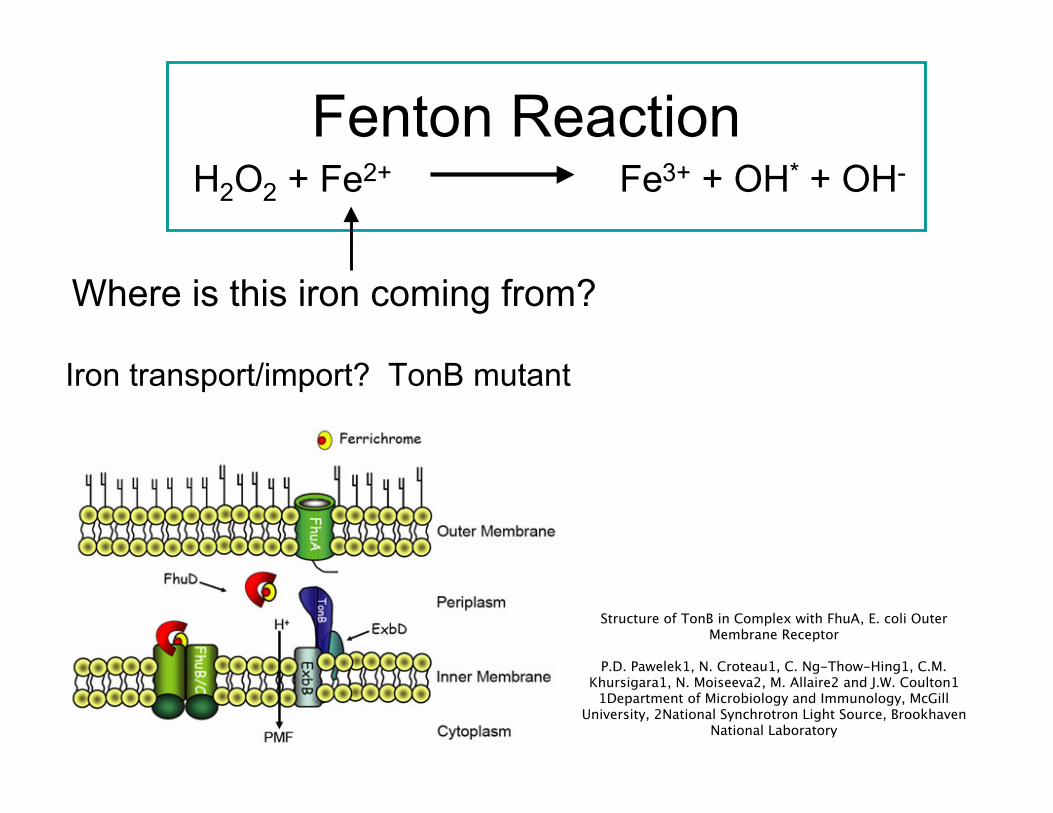
Fenton ReactionH2O2 + Fe2+ Fe3+ + OH* + OH-
Where is this iron coming from?
Iron transport/import? TonB mutant
Structure of TonB in Complex with FhuA, E. coli OuterMembrane Receptor
P.D. Pawelek1, N. Croteau1, C. Ng-Thow-Hing1, C.M.Khursigara1, N. Moiseeva2, M. Allaire2 and J.W. Coulton1
1Department of Microbiology and Immunology, McGillUniversity, 2National Synchrotron Light Source, Brookhaven
National Laboratory
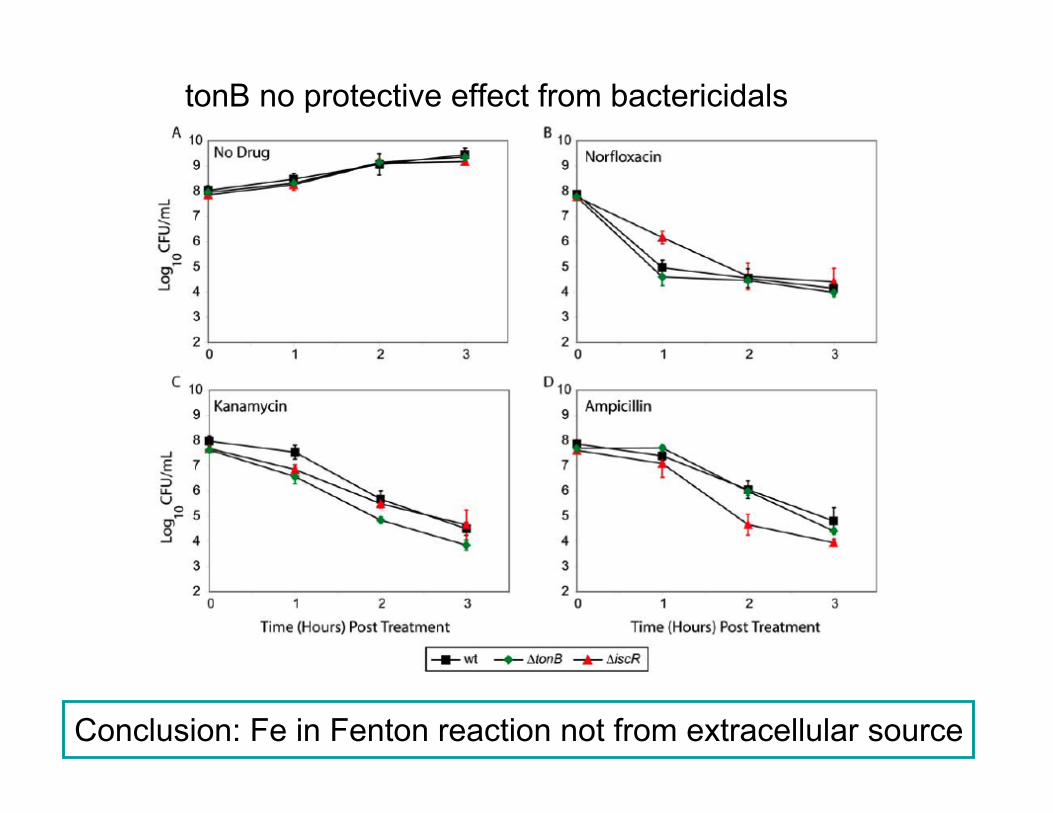
tonB no protective effect from bactericidals
Conclusion: Fe in Fenton reaction not from extracellular source
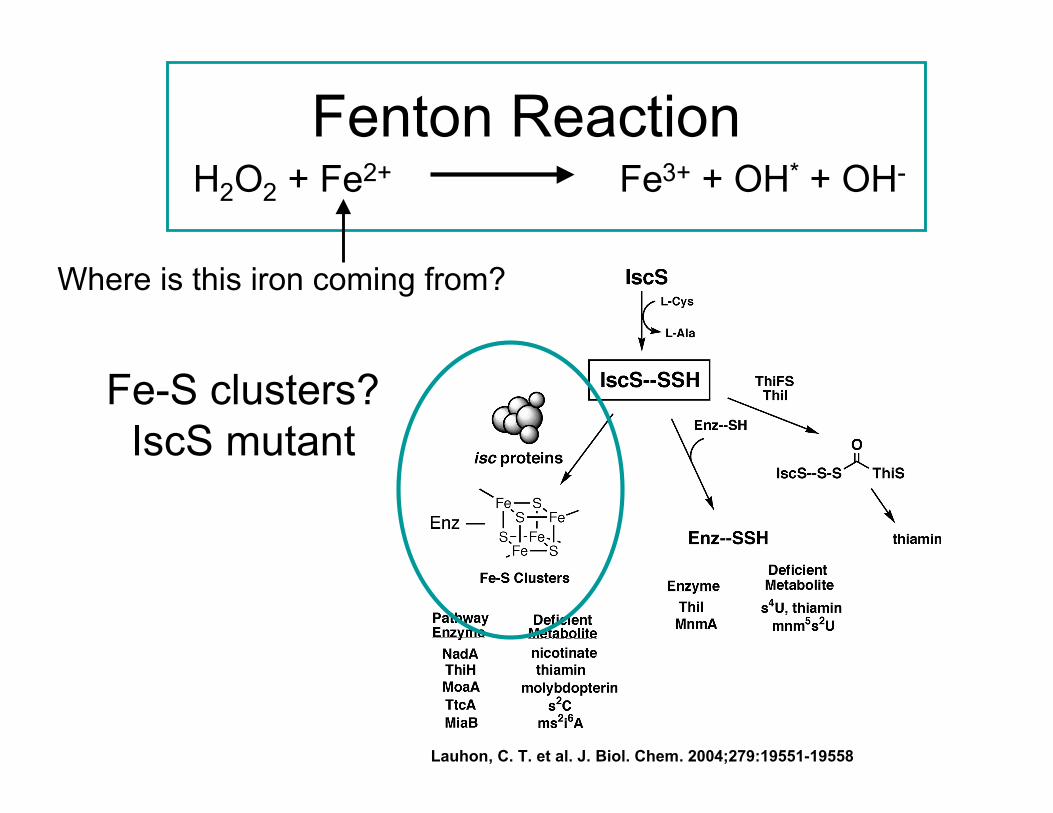
Fenton ReactionH2O2 + Fe2+ Fe3+ + OH* + OH-
Where is this iron coming from?
Fe-S clusters?IscS mutant
Lauhon, C. T. et al. J. Biol. Chem. 2004;279:19551-19558
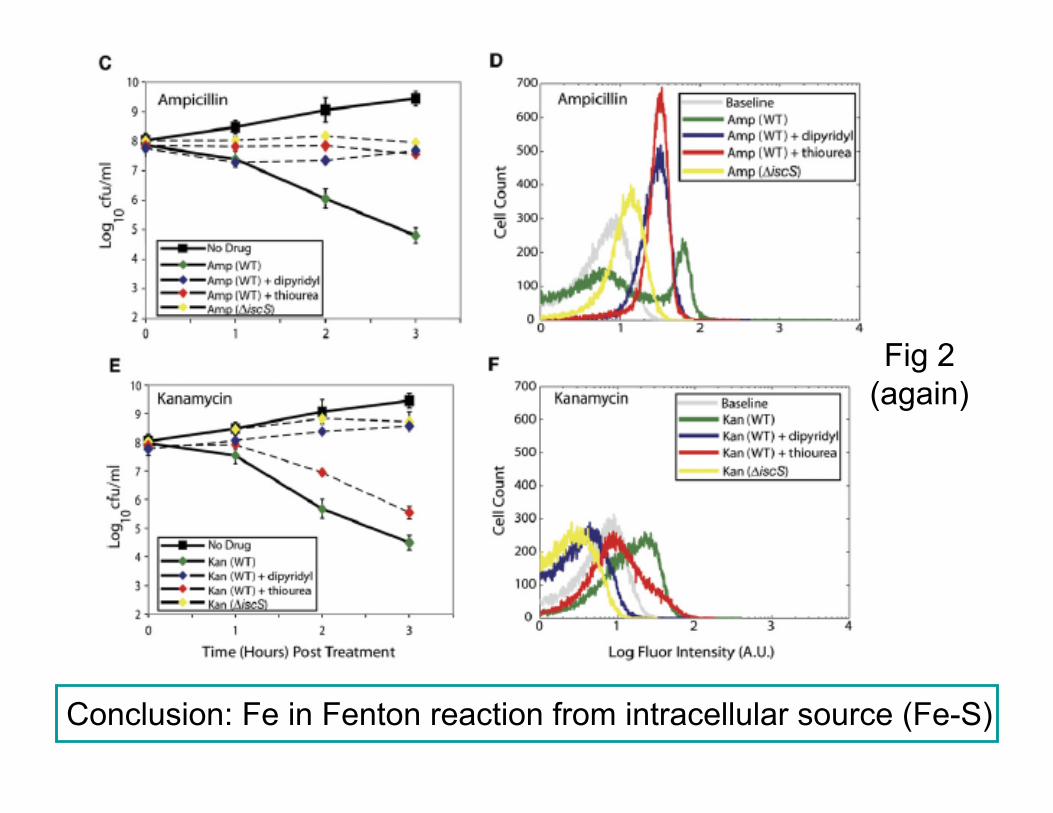
Conclusion: Fe in Fenton reaction from intracellular source (Fe-S)
Fig 2(again)
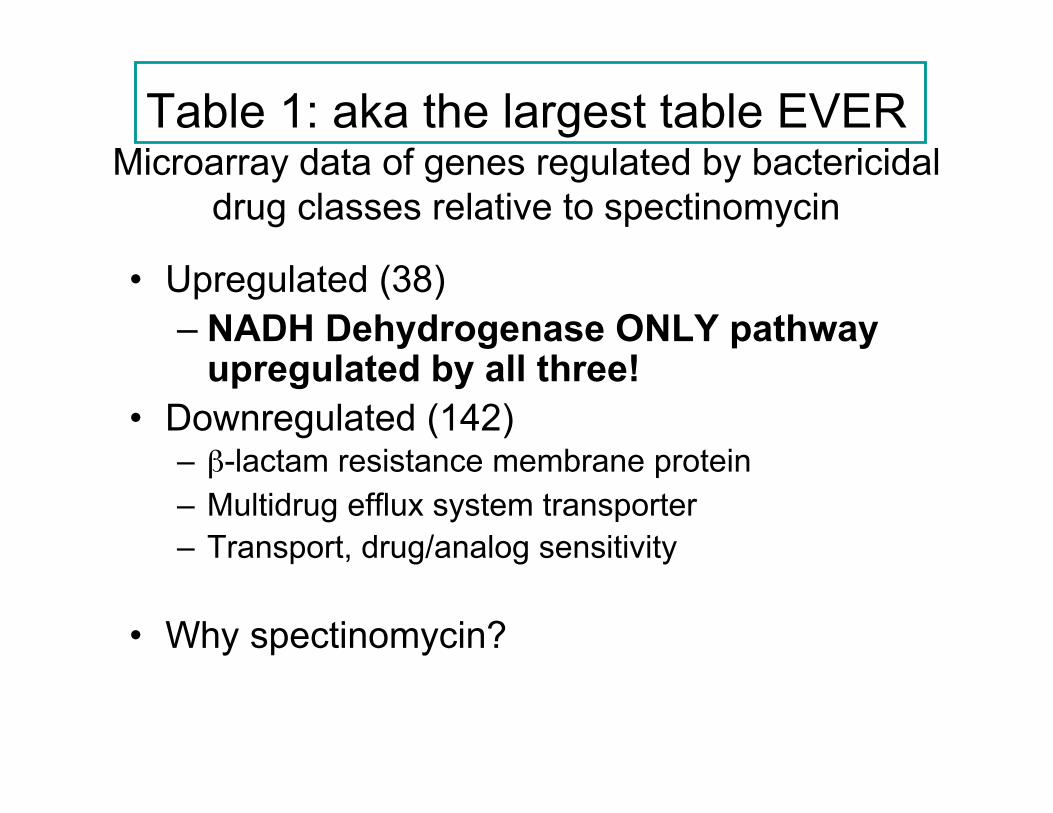
Table 1: aka the largest table EVERMicroarray data of genes regulated by bactericidal
drug classes relative to spectinomycin
• Upregulated (38)– NADH Dehydrogenase ONLY pathway
upregulated by all three!• Downregulated (142)
– β-lactam resistance membrane protein– Multidrug efflux system transporter– Transport, drug/analog sensitivity
• Why spectinomycin?
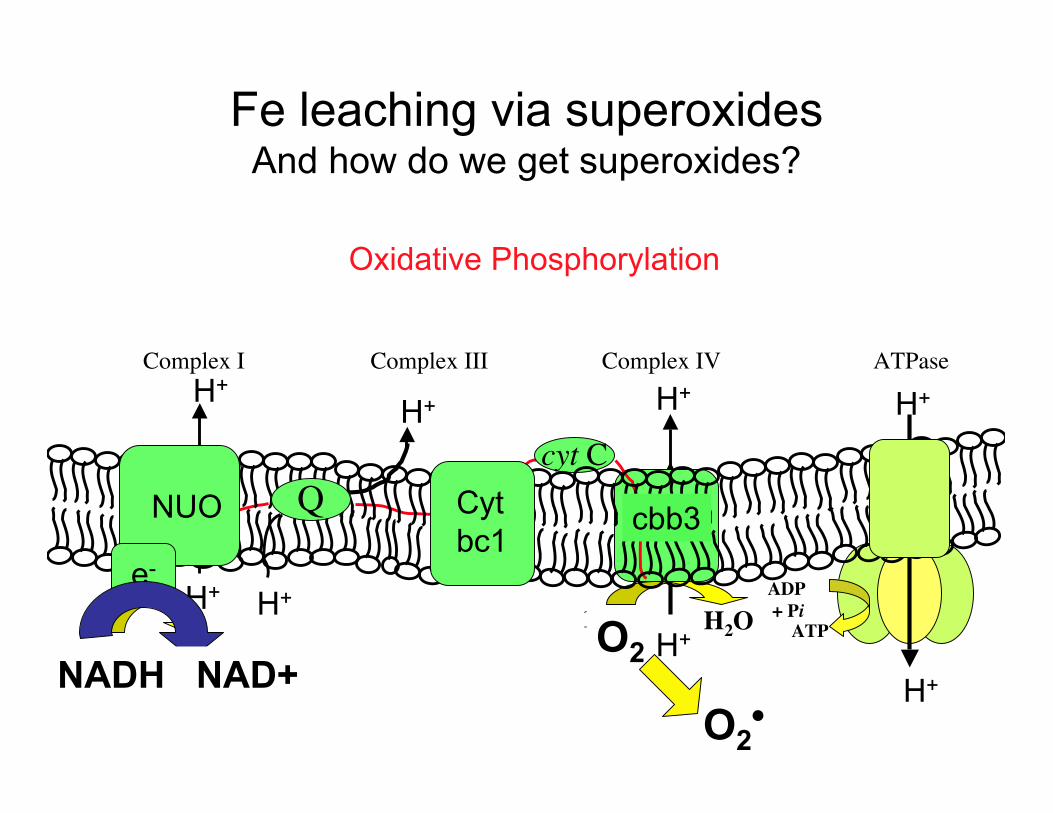
Fe leaching via superoxidesAnd how do we get superoxides?
Oxidative Phosphorylation
Complex I Complex III Complex IV ATPase
nuo
H+
H+ H+
H+H+
H+
H+
H+
ADP + Pi
ATPH2O1/2 O2
NADH NAD+
e-
cyt C
cyt bc1
cyt aa3cbb3Q Cyt
bc1e-
NUO
NADH NAD+O2
O2•
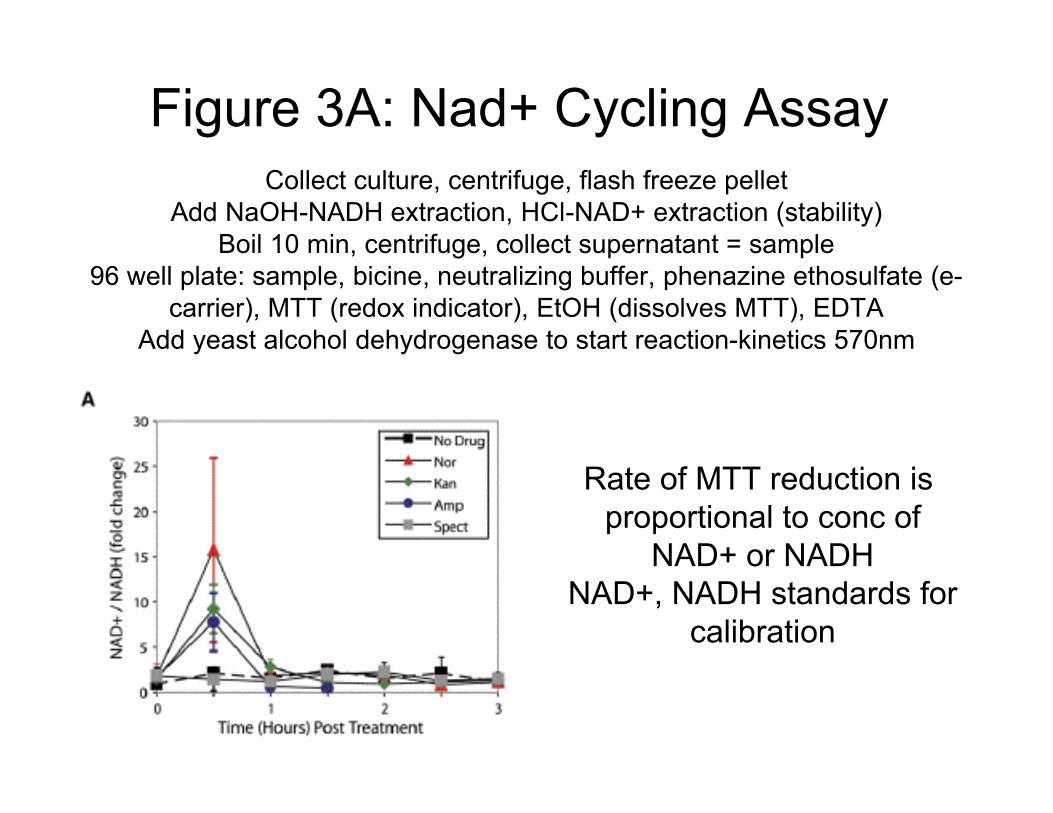
Figure 3A: Nad+ Cycling AssayCollect culture, centrifuge, flash freeze pellet
Add NaOH-NADH extraction, HCl-NAD+ extraction (stability)Boil 10 min, centrifuge, collect supernatant = sample
96 well plate: sample, bicine, neutralizing buffer, phenazine ethosulfate (e-carrier), MTT (redox indicator), EtOH (dissolves MTT), EDTA
Add yeast alcohol dehydrogenase to start reaction-kinetics 570nm
Rate of MTT reduction is proportional to conc of
NAD+ or NADHNAD+, NADH standards for
calibration
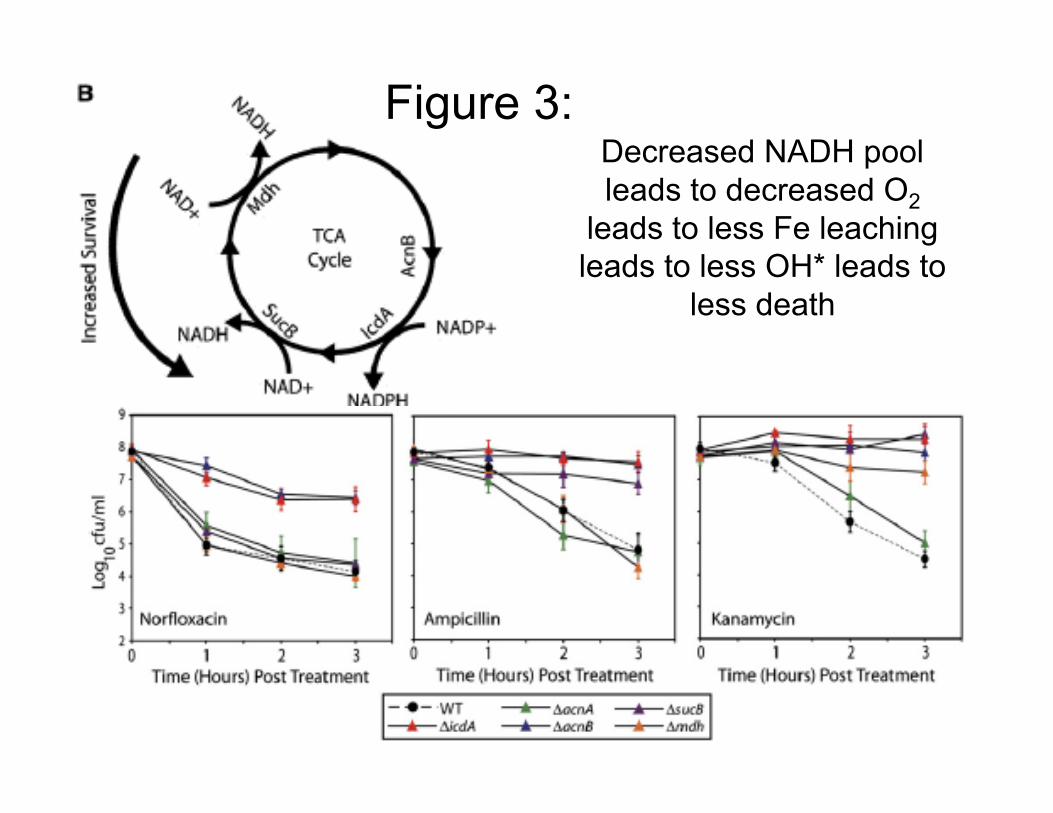
Decreased NADH poolleads to decreased O2
leads to less Fe leachingleads to less OH* leads to
less death
Figure 3:
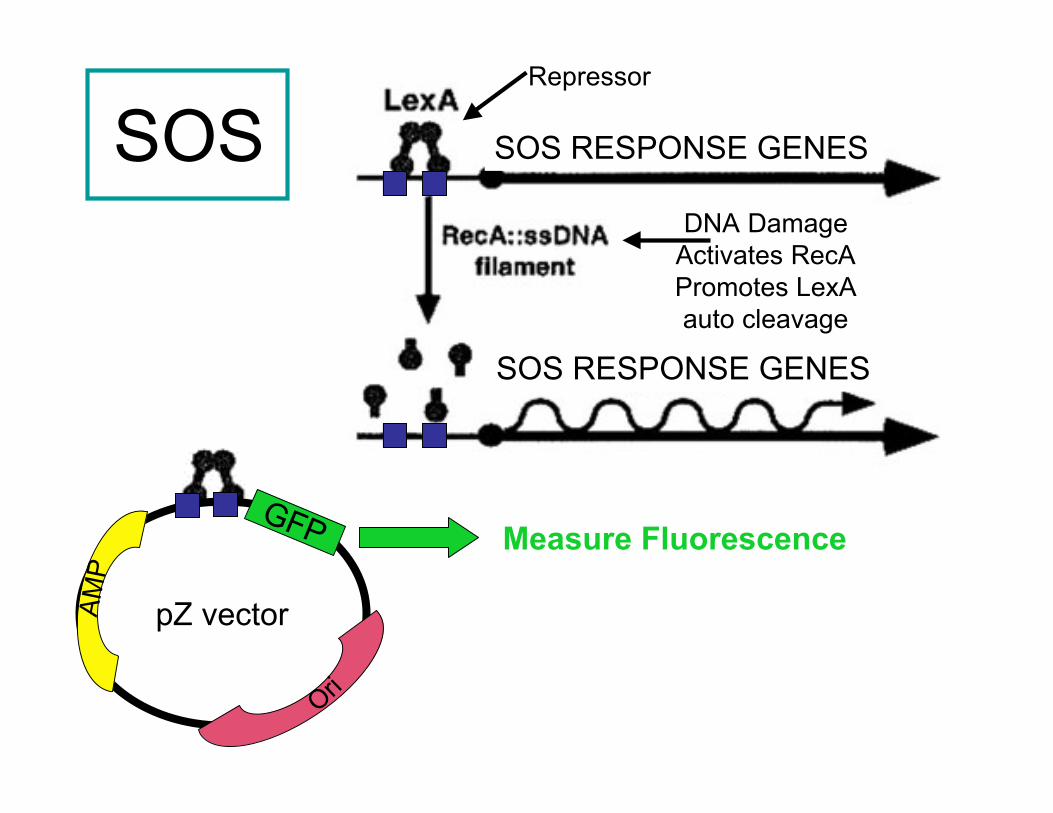
SOS RESPONSE GENES
SOS RESPONSE GENES
Repressor
DNA DamageActivates RecAPromotes LexAauto cleavage
SOS
GFP
pZ vectorAM
P
Ori
Measure Fluorescence
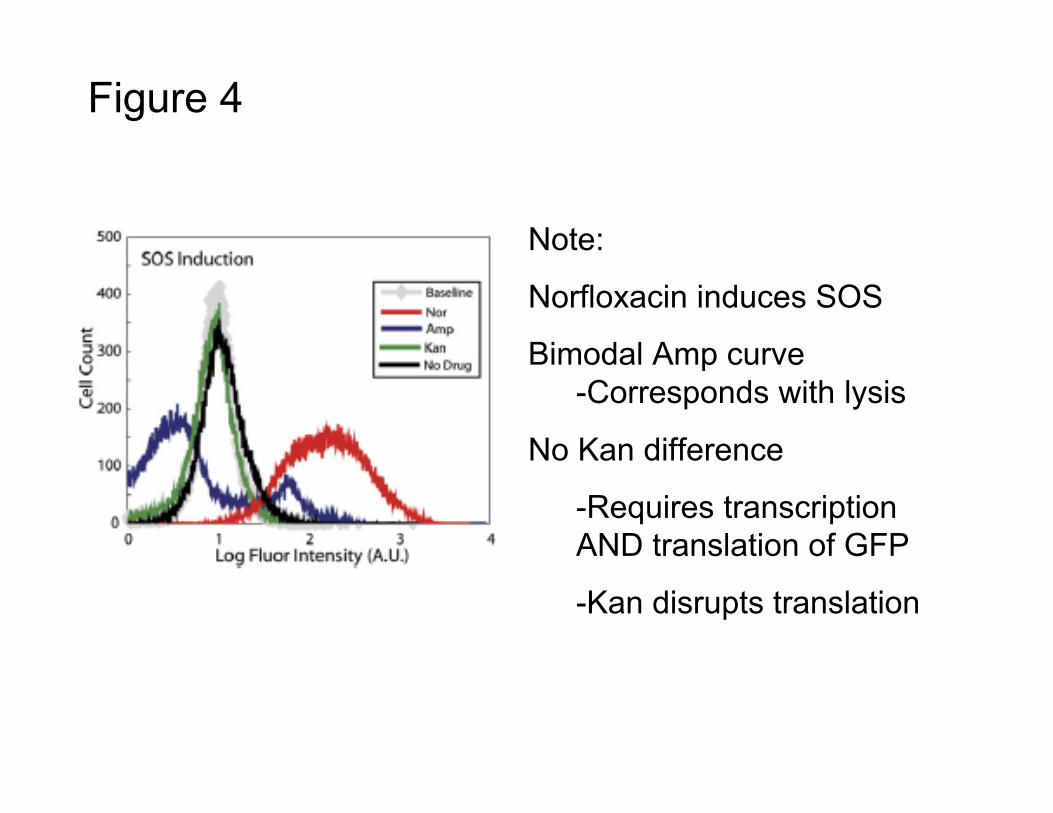
Figure 4
Note:
Norfloxacin induces SOS
Bimodal Amp curve-Corresponds with lysis
No Kan difference
-Requires transcriptionAND translation of GFP
-Kan disrupts translation
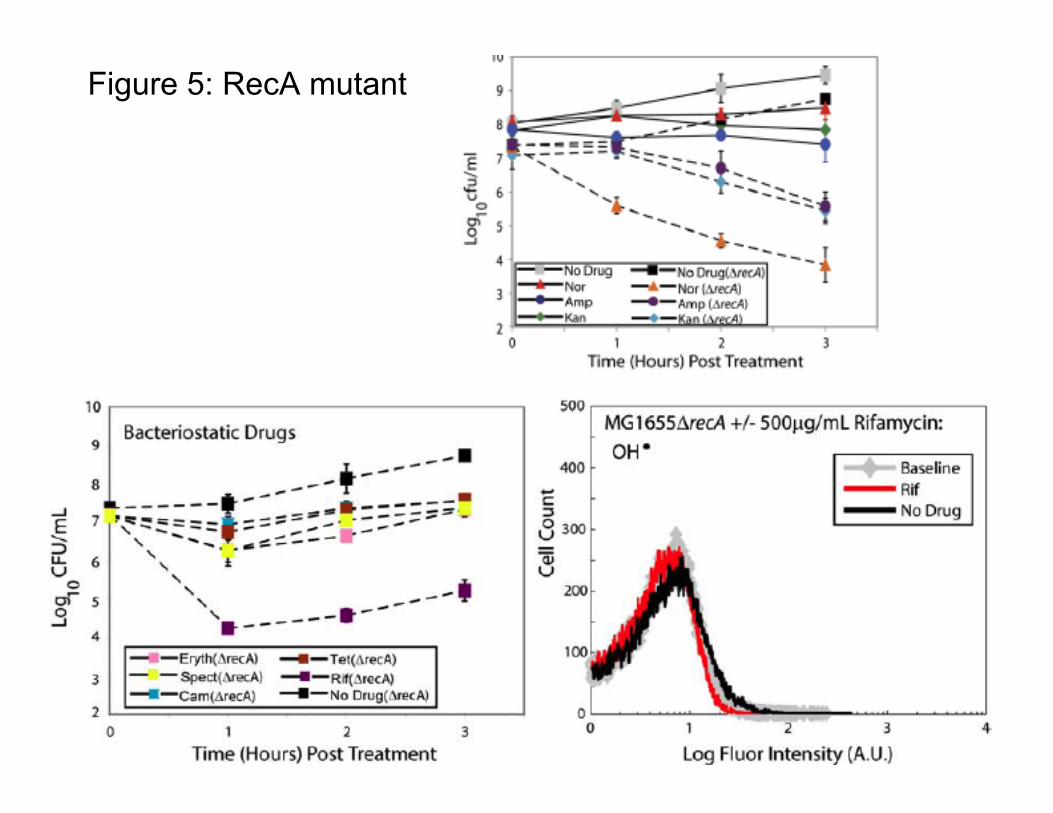
Figure 5: RecA mutant
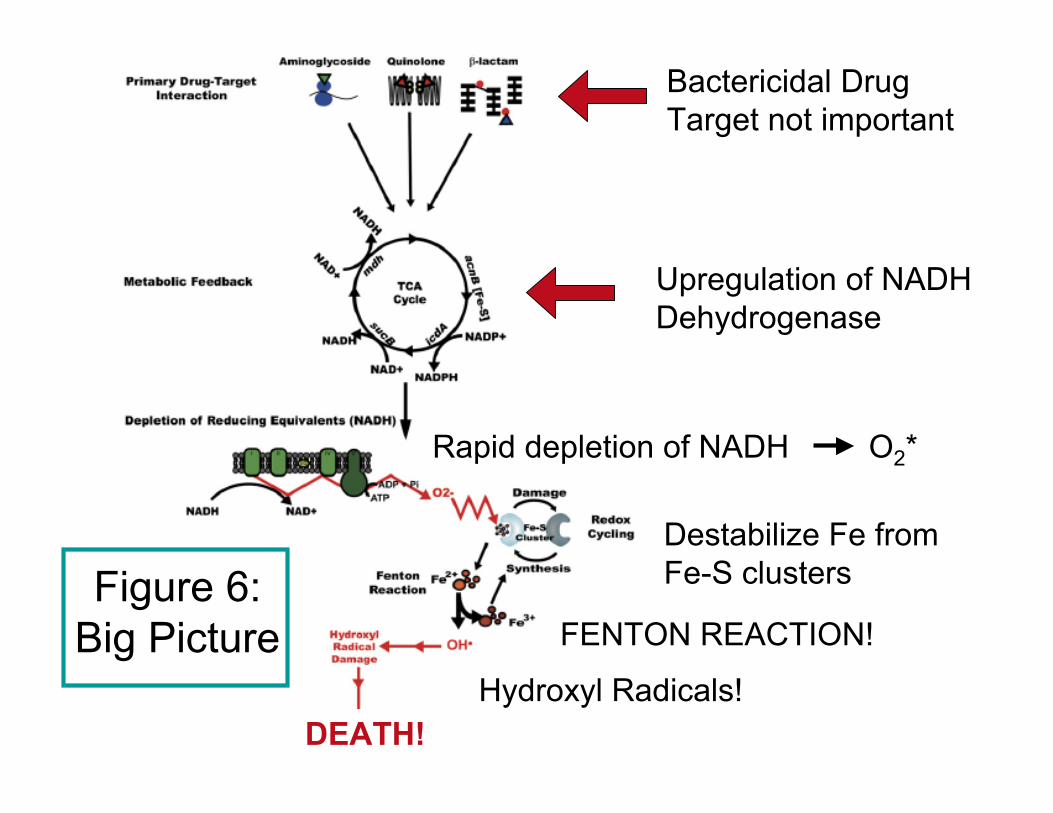
Figure 6:Big Picture
Bactericidal DrugTarget not important
Upregulation of NADHDehydrogenase
Destabilize Fe fromFe-S clusters
Rapid depletion of NADH O2*
FENTON REACTION!
Hydroxyl Radicals!DEATH!
Final Comments?
Top Related