
ZoneSmart 2015 –It [s all About the Maps! - Farms.com Ag 2016/ZoneSmart - Farms com... ·...
40
ZoneSmart 2015 – It’s all About the Maps! Nicole Rabe (Land Resource Specialist – OMAFRA) Mike Duncan (NSERC Precision Ag Research Chair – Niagara College) Dan Breckon (Woodrill Farms)
Transcript of ZoneSmart 2015 –It [s all About the Maps! - Farms.com Ag 2016/ZoneSmart - Farms com... ·...

ZoneSmart 2015 – It’s all About the Maps!
Nicole Rabe (Land Resource Specialist – OMAFRA)
Mike Duncan (NSERC Precision Ag Research Chair – Niagara College)
Dan Breckon (Woodrill Farms)

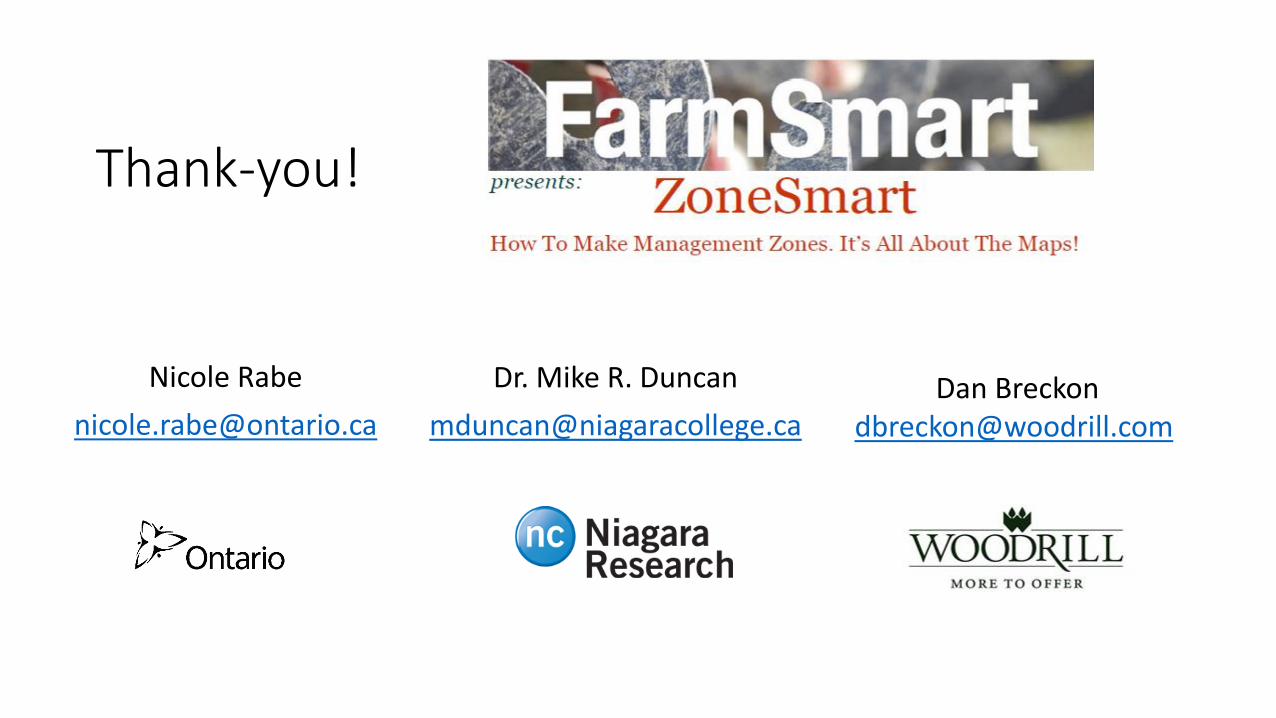
Where and How do we start Precision Ag Approach?
Hydrologic Slope
ValueHigh : 1.0 peak or ridge, dry
Low : 0.0 stream channel or pit (wet)
Yield Elevation
Soil
Sept 4, 2013
Soybeans
Remote Sensing
Image Source: Sensefly - eBee
• D. Aspinall 2015
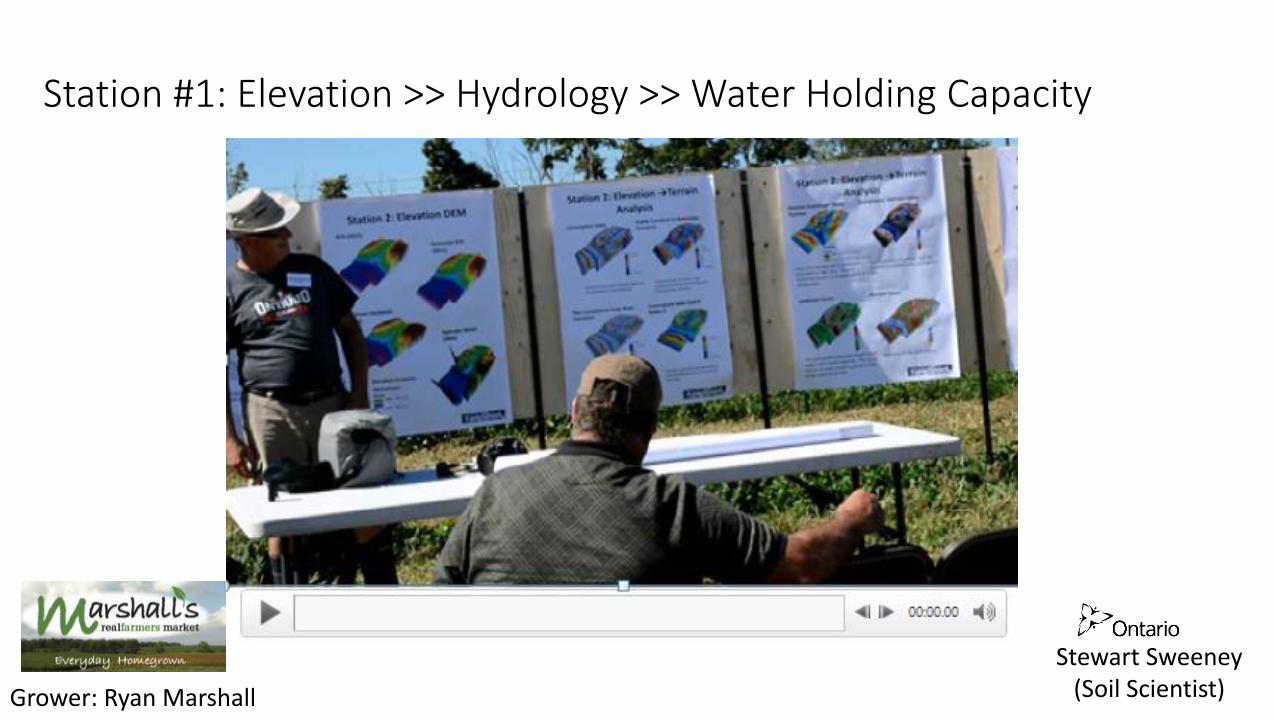
Station #1: Elevation >> Hydrology >> Water Holding Capacity
Stewart Sweeney(Soil Scientist)Grower: Ryan Marshall

PDSM
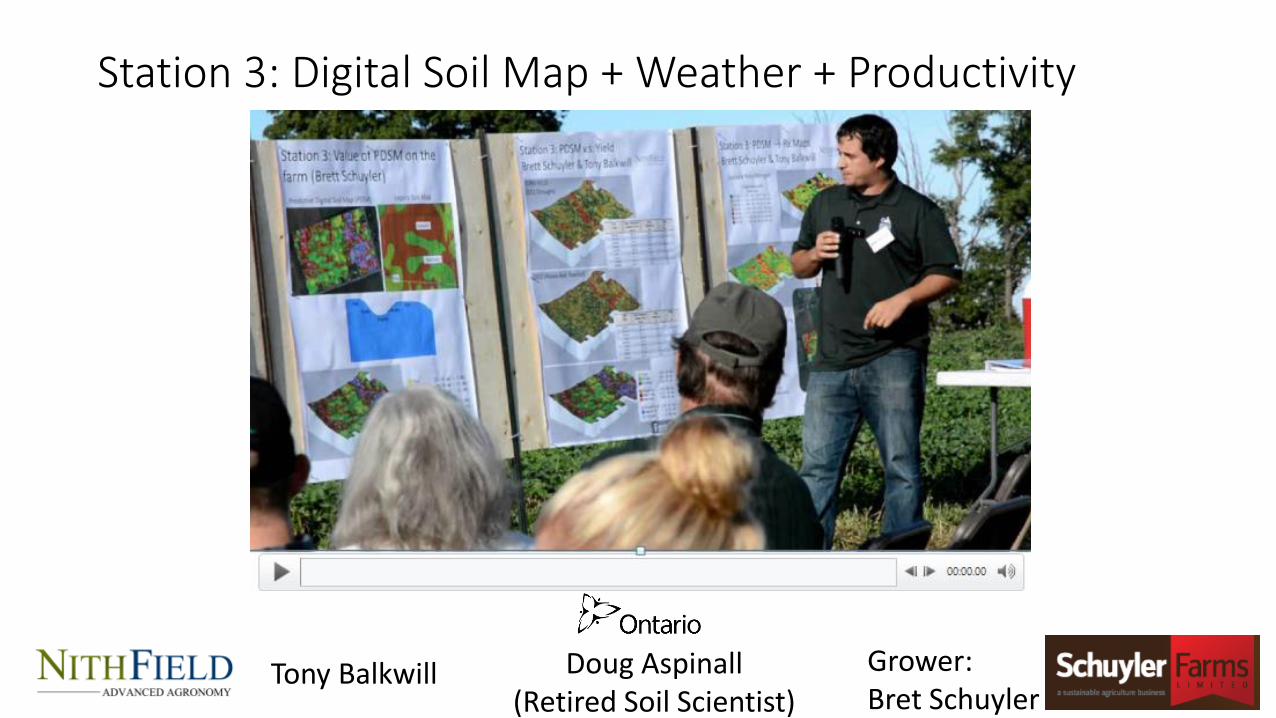
Station 3: Digital Soil Map + Weather + Productivity
Tony Balkwill Grower:Bret Schuyler
Doug Aspinall(Retired Soil Scientist)

Same Content40%
More Content51%
Less Advanced9%
Should a ZoneSmart be held next year?
Ian D. McDonaldApplied Research Coordinator
OMAFRA - Field Crops
519.824.4120 x56707519.239.3473 [email protected]
Late August37%
Early September61%
Late September2%
When should FUTURE ZoneSmart be held?
- Before the Canadian Outdoor Farm Show- After the kids go back to school!
- Move next time to “Does it Pay?” - Economics….

Update on theCrop Portal: Moving BeyondMulti-YearYield AnalysisDr. Mike R. Duncan, Ph.D.
Sarah Lepp
Inspired by Doug Aspinall

The Portal ‘Data Pipeline’
Upload CleaningGridding/Mapping
(Kriging)
YI
Elevation
YPI/YPZones
YCI
EC Partitioning
Analytics
Yield
Elevation
Soil Type
ChemistryNutrients
Velocities, direction,
boundaries, etc…
Inputs
VRx
RRx
DARx
Variable Rate
Sampling
Measurement
Test Plots
FieldWork
The Team “Think of the NC Team as a room full of programmers wanting to get some experience programming real-world problems prior to joining the workforce.”

RAW RAW
Cleaned Cleaned
Visualization is central to the portal vision….

The Vision – It’s NOT about Academics…
• New Tools that help the farmer make more money by better controlling the farm business.• Its not just about managing field crops.• Its about managing weather, markets, fuel costs, fertilizer costs, diseases, equipment
evolution, new technologies, but we will start somewhere recognizable – crop management.
• Make sure the farmer is always in control.
• Make Ag tools available to everyone and explain how they work and what assumptions are being made.
• As long as you have a browser you can play.• No need for your own IT setup.
• Remove the hassle of file handling from data driven farming.• In the most advanced version of this vision the data moves from machine to cloud, to cloud,
back to machine.• The farmer never need see a file (although they can get all the files if they want them).

Frozen Turbulence and Farm Fields
Turbulent fields are impossible to predict but fortunately can be characterized.
The Geological timescales that these fields follow means that patterns will persist for decades.

Visualizing Data
• Turbulent statistics tend to defy normal mathematics, as the original researchers in VR learned about data 20 years ago.
• Trying to characterize patterns leads to more useful and generalizable results.• For example Doug Aspinall observations about tops of knolls and gulleys.• The color differences on images suggest different levels of organic matter• Which then suggest different levels of nutrients• Which then suggests different levels of yield• And suddenly you have a hypothesis that is generalizable to most fields…
• Looking at generic stats and thresholded yield maps will gain farmers nothing.

But first tidy the data…..
Clipping the distribution to remove high and low outliers.
Function removes << 1% of the data most of the time.
Not the best way to do business.
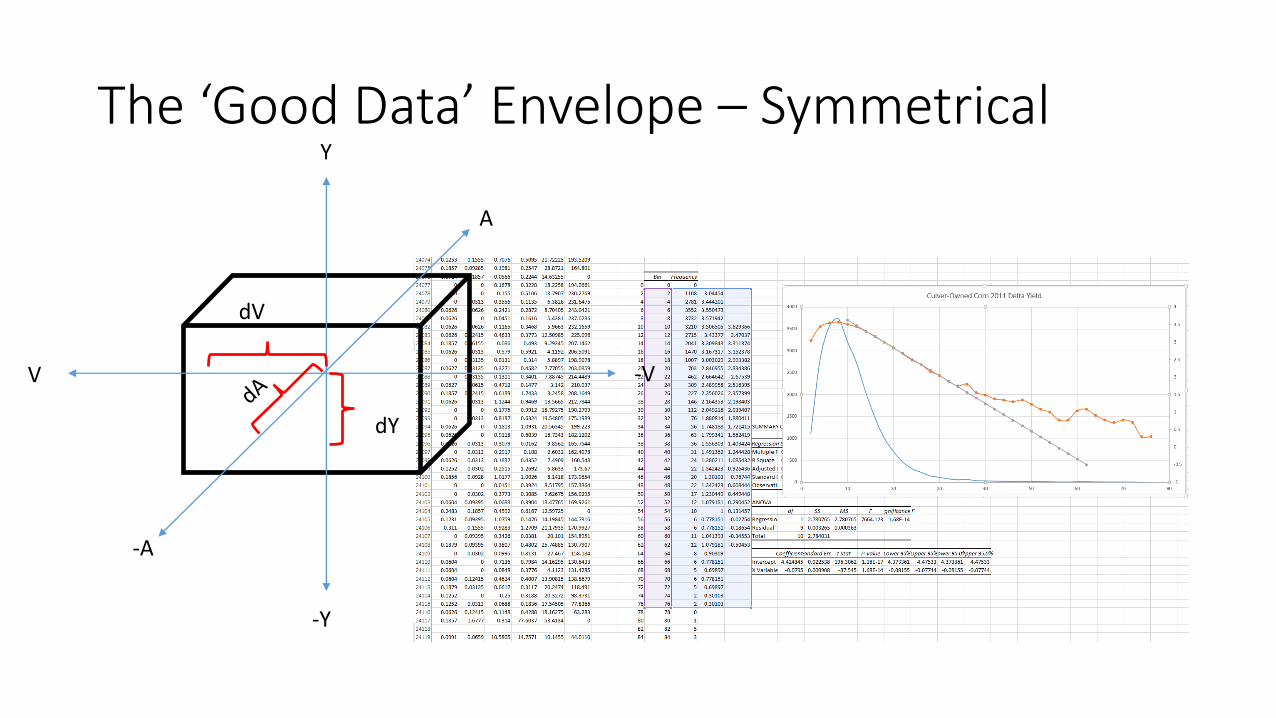
The ‘Good Data’ Envelope – SymmetricalY
-Y
V -V
A
-A
dY
dV
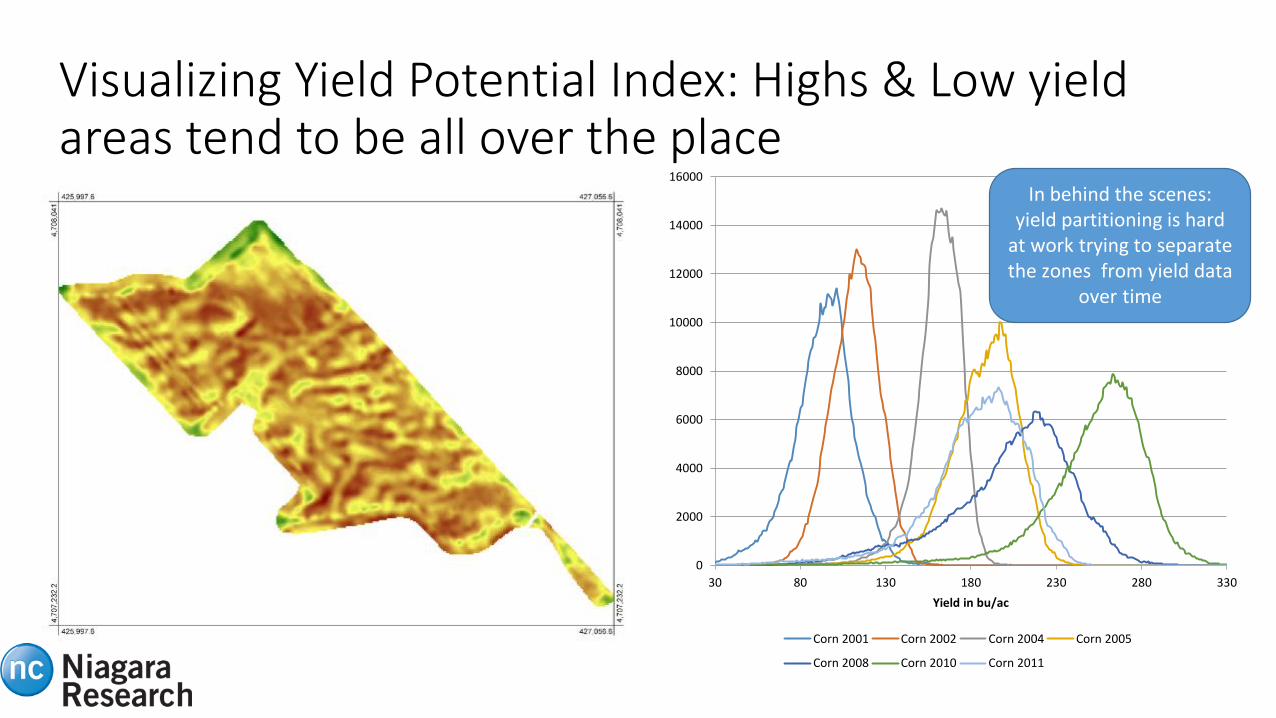
Visualizing Yield Potential Index: Highs & Low yield areas tend to be all over the place
0
2000
4000
6000
8000
10000
12000
14000
16000
30 80 130 180 230 280 330
Yield in bu/ac
Corn 2001 Corn 2002 Corn 2004 Corn 2005
Corn 2008 Corn 2010 Corn 2011
In behind the scenes: yield partitioning is hard
at work trying to separate the zones from yield data
over time
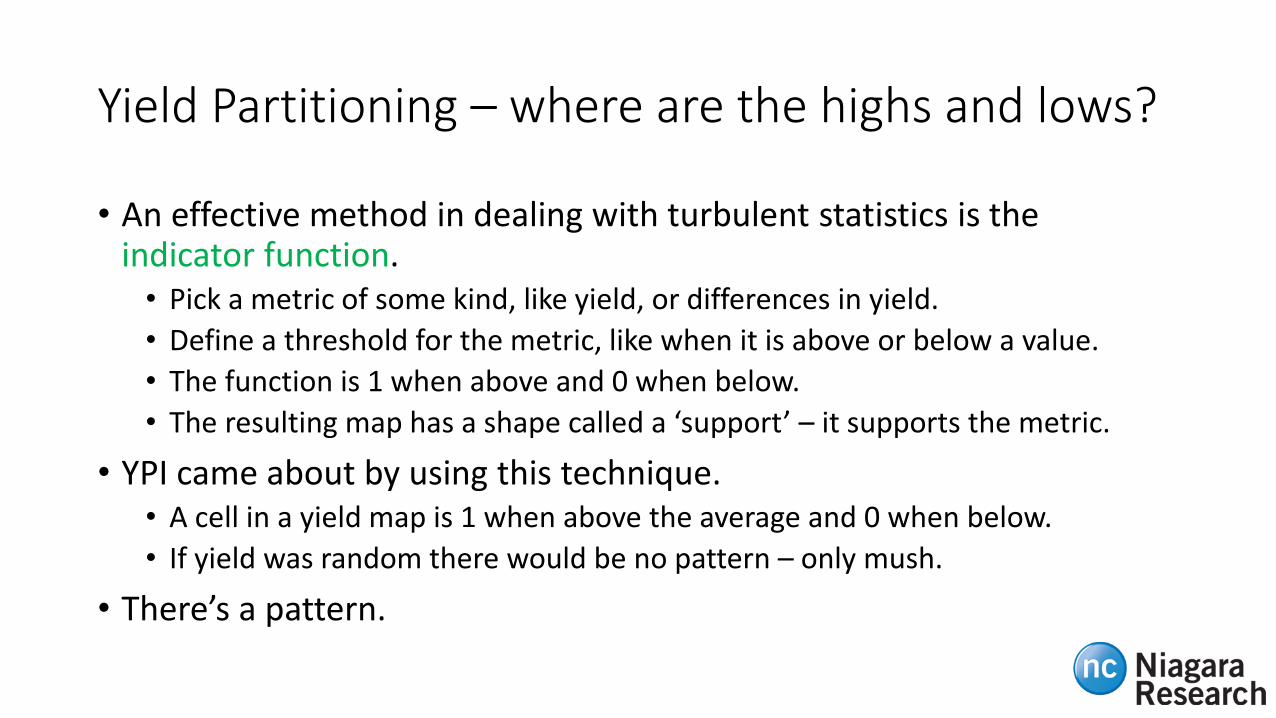
Yield Partitioning – where are the highs and lows?
• An effective method in dealing with turbulent statistics is the indicator function.• Pick a metric of some kind, like yield, or differences in yield.
• Define a threshold for the metric, like when it is above or below a value.
• The function is 1 when above and 0 when below.
• The resulting map has a shape called a ‘support’ – it supports the metric.
• YPI came about by using this technique.• A cell in a yield map is 1 when above the average and 0 when below.
• If yield was random there would be no pattern – only mush.
• There’s a pattern.

Advanced YPI Properties• The distributions of yield index are semi-overlapping which means that they can allow for
the fact that tops of knolls produce high yields and gulleys produce low yields.
• There is no a priori reason that YPI levels would cluster together (they could easily be totally random), but they do.
• High and low yield areas of a farm field are organized into Management Zones.
0
2000
4000
6000
8000
10000
12000
110 130 150 170 190 210
Yield in bu/ac
P=6&7
P=3&4&5
P=0&1&2
Three blankets instead of one...
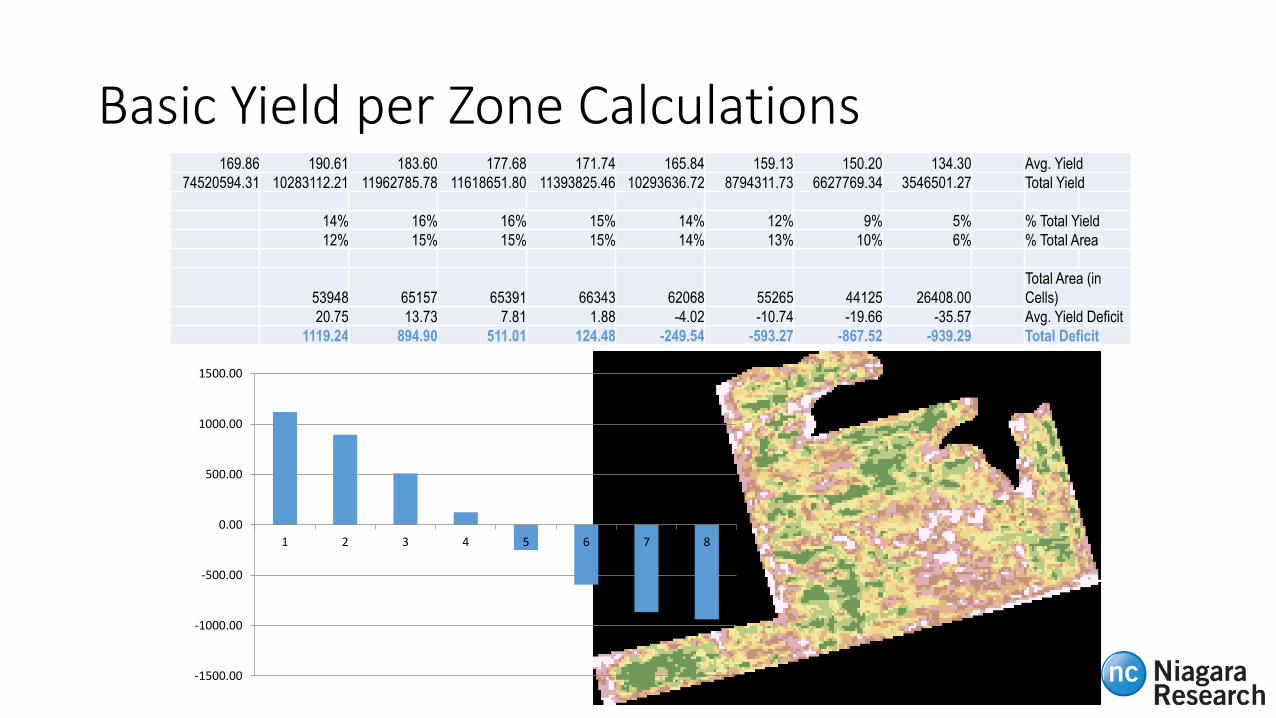
Basic Yield per Zone Calculations169.86 190.61 183.60 177.68 171.74 165.84 159.13 150.20 134.30 Avg. Yield
74520594.31 10283112.21 11962785.78 11618651.80 11393825.46 10293636.72 8794311.73 6627769.34 3546501.27 Total Yield
14% 16% 16% 15% 14% 12% 9% 5% % Total Yield
12% 15% 15% 15% 14% 13% 10% 6% % Total Area
53948 65157 65391 66343 62068 55265 44125 26408.00
Total Area (in
Cells)
20.75 13.73 7.81 1.88 -4.02 -10.74 -19.66 -35.57 Avg. Yield Deficit
1119.24 894.90 511.01 124.48 -249.54 -593.27 -867.52 -939.29 Total Deficit
-1500.00
-1000.00
-500.00
0.00
500.00
1000.00
1500.00
1 2 3 4 5 6 7 8

Yield Cascade Index:Intensify highs & lows
The circled area shows that the highest and lowest yields in the field are right next to each other.
I have seen this in at least two fields.
YCI Algorithm;
Instead of adding normalized yield maps together, multiply them. Values below one go towards zero fast, and values above one go towards large numbers.
from YPI to YCI….

Low Performing areas only
High Performing Areas only

…and the pattern follows
topography.
It’s an index into the probability that the yield will be above the average.
Beyond Yield Data:
2011 2012 2013

RAW
Cleaned
Elevation
Landforms
Beyond Yield Datato elevation
then Landform Classes…

5 Layer Yield Performance Zone Map v.s. 16 Class Landform Map
Elevation data is modelled into a landform class map that represents all topographic variables (e.g. slope, curvature, etc)
Beyond Yield and Topography (Landform Classes):

Electromagnetic Induction Mapping (EMI) or Electrical Conductivity (EC) Mapping
-100
0
100
200
300
400
500
600
700
800
900
0 0.2 0.4 0.6 0.8 1 1.2 1.4 1.6 1.8
2005 Corn Yield Partitioning Using EC DataCul-Owned Field, Simcoe, Ontario
ECS & ECD = 0 ECS & ECD = 1 ECS & ECD = 2
EC Partitions Yield into semi-overlapping histograms
VERIS EC
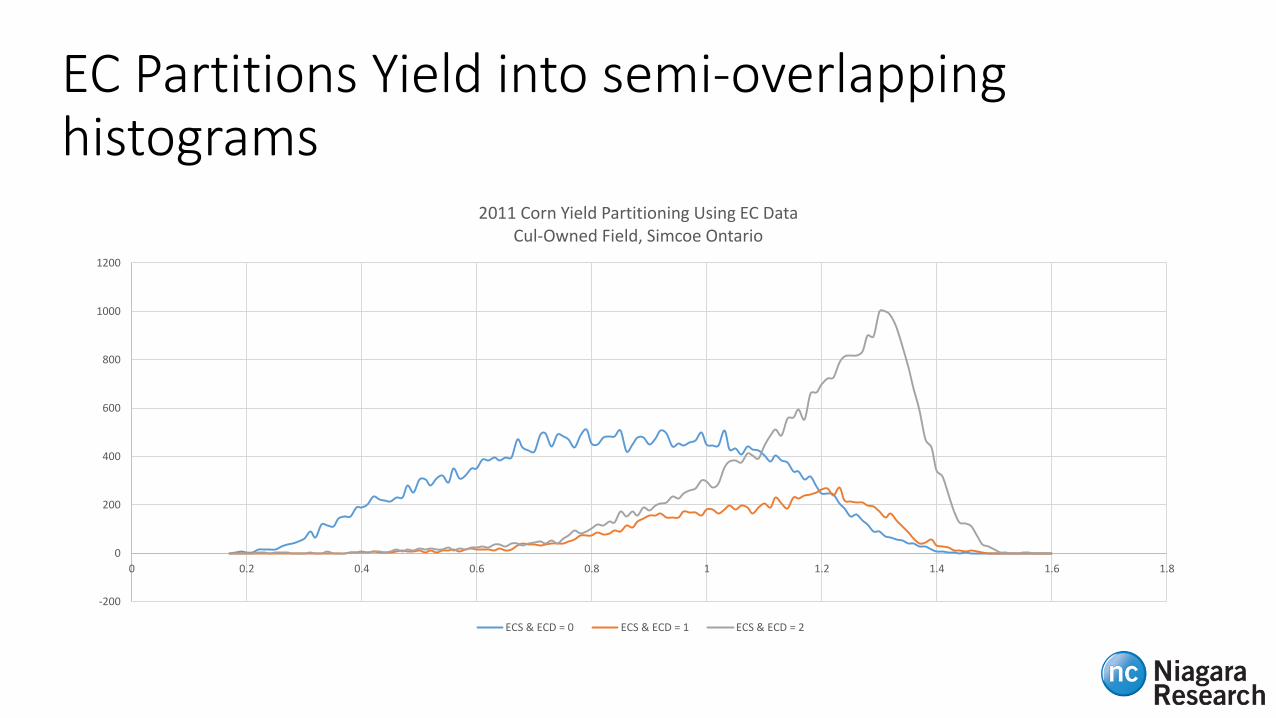
-200
0
200
400
600
800
1000
1200
0 0.2 0.4 0.6 0.8 1 1.2 1.4 1.6 1.8
2011 Corn Yield Partitioning Using EC DataCul-Owned Field, Simcoe Ontario
ECS & ECD = 0 ECS & ECD = 1 ECS & ECD = 2
EC Partitions Yield into semi-overlapping histograms
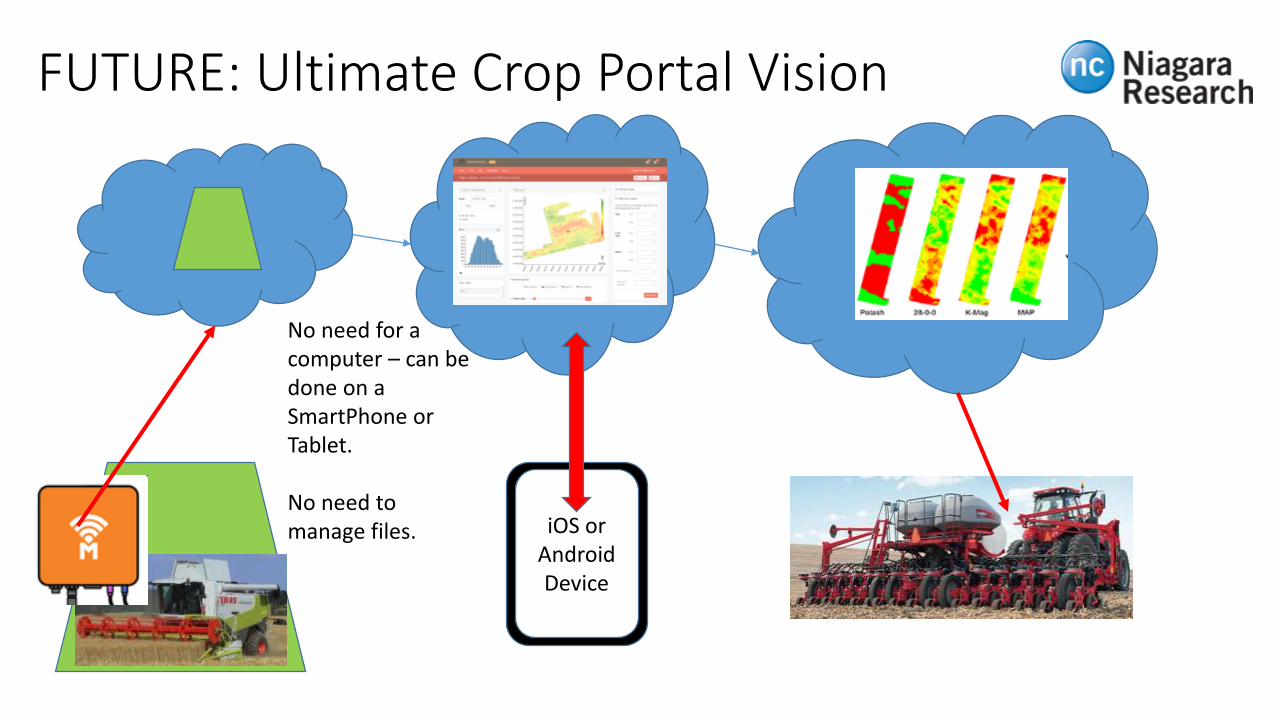
iOS or Android Device
FUTURE: Ultimate Crop Portal Vision
No need for a computer – can be done on a SmartPhone or Tablet.
No need to manage files.

Profitability Mapping: X-Factor ~ Magnitude of Yield Variability
X-Factor = 75/15 -> 5
X-Factor = 300/39.5 -> 7.6
X-Factor is a guide as to the potential profitability of using a variable rate scheme. X below 2 doesn’t seem worthwhile.

VRx
Breaks up the ‘blanket’ application into smaller blankets, but with the same average application volume.
FuturePortalSteps
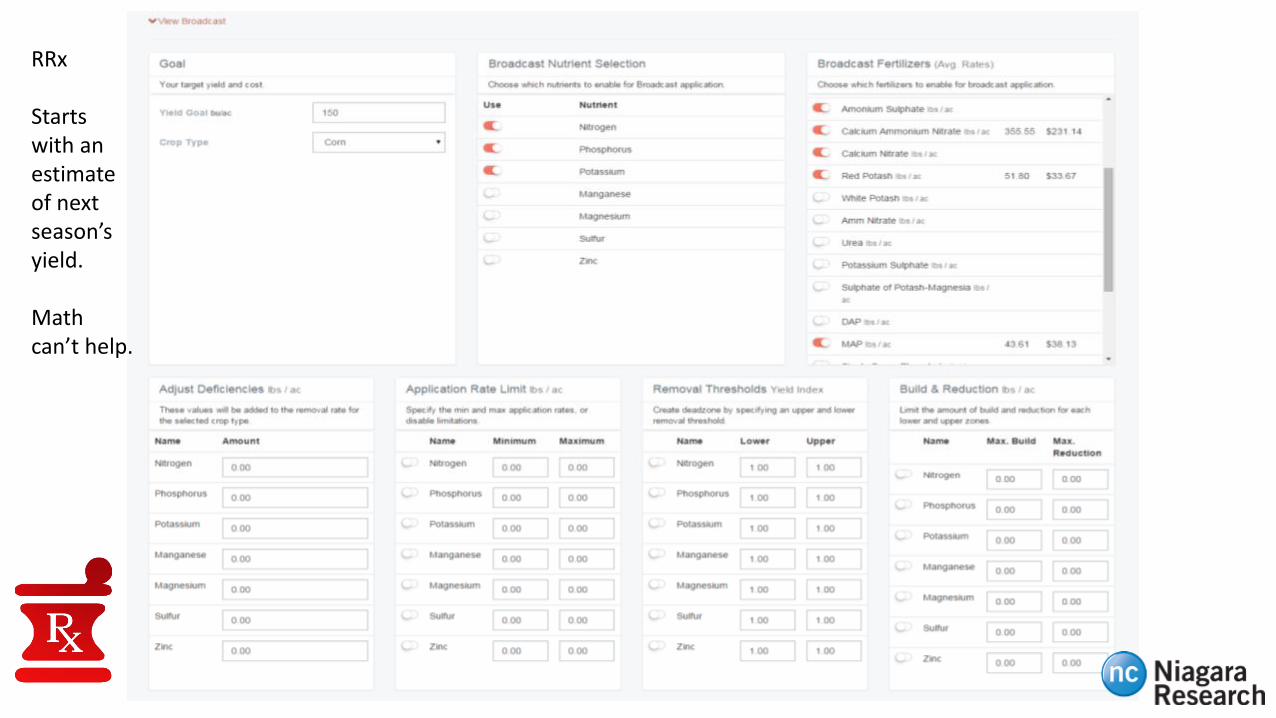
RRx
Starts with an estimate of next season’s yield.
Math can’t help.

Zonesmart Case Study:Linders Field

Woodrill
• We have lots of tools to adapt different management practices in
mgmt. zones
• High resolution soil type maps are an objective tool to implement
precision zone management
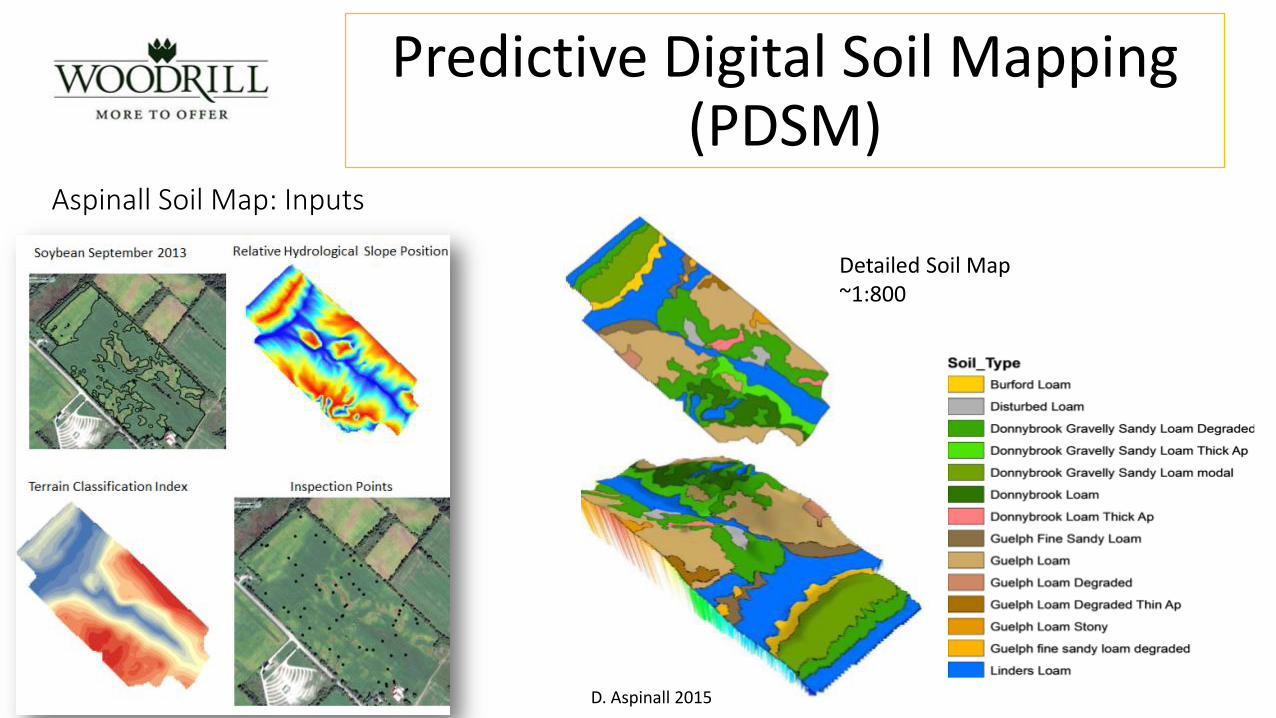
Predictive Digital Soil Mapping(PDSM)
Detailed Soil Map~1:800
D. Aspinall 2015
Aspinall Soil Map: Inputs
Detailed Soil Map~1:800
• D. Aspinall 2015
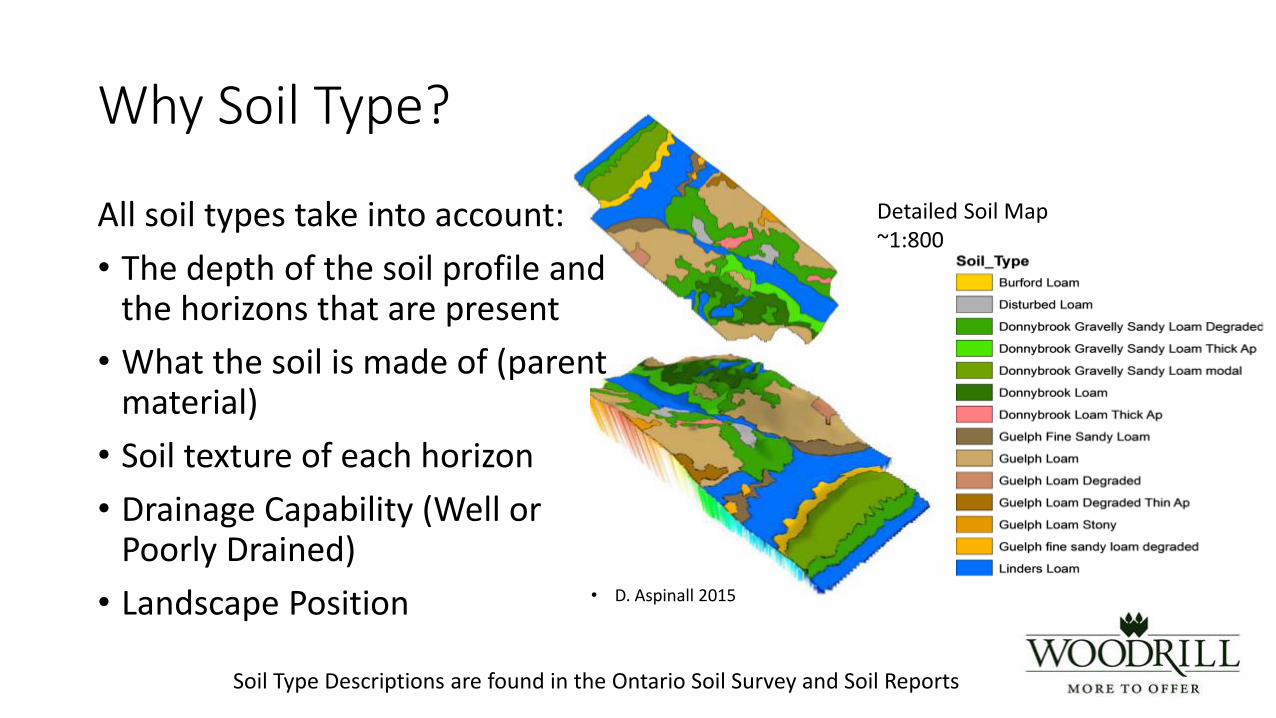
Why Soil Type?
All soil types take into account:
• The depth of the soil profile and the horizons that are present
• What the soil is made of (parent material)
• Soil texture of each horizon
• Drainage Capability (Well or Poorly Drained)
• Landscape Position
Soil Type Descriptions are found in the Ontario Soil Survey and Soil Reports

Soil Type Zone Performance
2013 Soybean Yield
Dougs Soil Map
Yield Index(4 years wheat, 3 years soys)

Management Decisions – by Soil Type
Donnybrook Guelph Loam
• Lower corn seed population
• Multiple Nitrogen applications
• Continuous no till
• Apply higher rate of compost/manure
• Higher corn seed populations
• Lower Nitrogen rates
• Full tillage 1 out of 4 years
• Lower rate of compost/manure

Soil type 2005 2006 2008 2010 2012 2013 2014 2015
SB WW WW WW WW SB SB WW
GPH.l #230 35.9 59.0 46.8 66.9 40.0 55.0 51.5 80.4
DBK.lcs #267 18.0 47.5 41.1 35.9 26.6 29.9 42.6 46.0
LDR.l #190 38.1 69.3 56.6 68.2 46.8 56.3 50.2 83.6
Field Avg 31.2 59.3 46.9 54.2 38.3 48.9 46.3 76.1
Soil type WW SB
GPH.l 58.6 47.5
DBK.lcs 39.4 30.1
LDR.l 64.9 48.2
Field 54.9 42.1
Soil Type& Productivity(Yield Data) Over time…
On average over 25 bu/ac difference between
Donnybrook and the Linders’LoamIn a 10 year period….

Tillage Prescription – Fall 2015
•No Tillage
•Tillage

Spring 2016: VR-Population Corn MapValidation
“mini-strips”Built into Rx
Map
To decide:“was it the
correct seedingrate for this
zone?”
Allows for optional
response curves in each zone…