Wiki Culture & Collaboration Presented by: Faria Sami Quratulain Shattari Munim Ahmed Zaid Nizami.
Upload
khawarsherCategory
view
237download
0
7/28/2019 Zaid Nizami
http://slidepdf.com/reader/full/zaid-nizami 1/18
INSTITUTE OF BUSINESS ADMINISTRATIOIN
Bicycle Exercise - WAC
Advanced & Applied Business Research
Submitted by:
Zaid Nizami
ERP #01069
Submitted to:
Dr. Shahid Qureshi
Dated:
31st
December 2012

7/28/2019 Zaid Nizami
http://slidepdf.com/reader/full/zaid-nizami 2/18
Exercise A
1. What is the market share of each brand?
Brand in use
Frequency Percent Valid Percent Cumulative Percent
Valid Sohrab 39 47.6 47.6 47.6
Eagle 12 14.6 14.6 62.2
Falcon 11 13.4 13.4 75.6
Imported 20 24.4 24.4 100.0
Total 82 100.0 100.0
Sohrab is market leader as it has the highest market share of 47.6% while Falcon has the lowest
market share of 13.4%. Eagle has a market share of 14.6% and Imported bicycles have a
considerable market share in bicycle industry of 24.4%.
2. Develop an income profile of Sohrab user i.e. % of Sohrab users who will fall in each
income category.
Brand in use * Income Crosstabulation
Income
TotalStudent Below 5000
b/w 5000-
10000
b/w 10000-
15000
More than
15000
Brand in use Sohrab Count 7 17 14 1 0 39
% within Brand in use 17.9% 43.6% 35.9% 2.6% .0% 100.0%
% within Income 87.5% 63.0% 51.9% 16.7% .0% 47.6%
% of Total 8.5% 20.7% 17.1% 1.2% .0% 47.6%
Eagle Count 0 5 7 0 0 12
% within Brand in use .0% 41.7% 58.3% .0% .0% 100.0%
% within Income .0% 18.5% 25.9% .0% .0% 14.6%
% of Total .0% 6.1% 8.5% .0% .0% 14.6%
Falcon Count 0 4 4 2 1 11
% within Brand in use .0% 36.4% 36.4% 18.2% 9.1% 100.0%
% within Income .0% 14.8% 14.8% 33.3% 7.1% 13.4%
% of Total .0% 4.9% 4.9% 2.4% 1.2% 13.4%
Imported Count 1 1 2 3 13 20
% within Brand in use 5.0% 5.0% 10.0% 15.0% 65.0% 100.0%
% within Income 12.5% 3.7% 7.4% 50.0% 92.9% 24.4%
% of Total 1.2% 1.2% 2.4% 3.7% 15.9% 24.4%
Total Count 8 27 27 6 14 82
% within Brand in use 9.8% 32.9% 32.9% 7.3% 17.1% 100.0%
% within Income 100.0% 100.0% 100.0% 100.0% 100.0% 100.0%
% of Total 9.8% 32.9% 32.9% 7.3% 17.1% 100.0%
7/28/2019 Zaid Nizami
http://slidepdf.com/reader/full/zaid-nizami 3/18
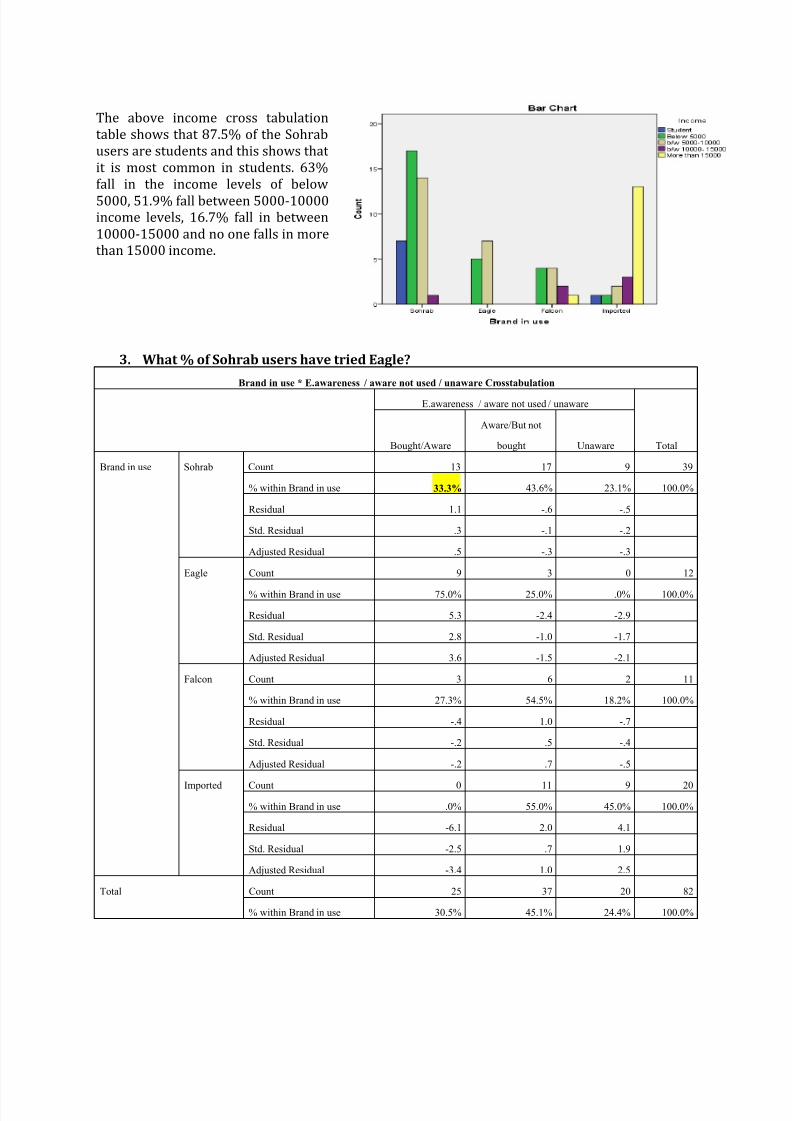
The above income cross tabulation
table shows that 87.5% of the Sohrab
users are students and this shows that
it is most common in students. 63%
fall in the income levels of below
5000, 51.9% fall between 5000-10000income levels, 16.7% fall in between
10000-15000 and no one falls in more
than 15000 income.
3. What % of Sohrab users have tried Eagle?
Brand in use * E.awareness / aware not used / unaware Crosstabulation
E.awareness / aware not used / unaware
TotalBought/Aware
Aware/But not
bought Unaware
Brand in use Sohrab Count 13 17 9 39
% within Brand in use 33.3% 43.6% 23.1% 100.0%
Residual 1.1 -.6 -.5
Std. Residual .3 -.1 -.2
Adjusted Residual .5 -.3 -.3
Eagle Count 9 3 0 12
% within Brand in use 75.0% 25.0% .0% 100.0%
Residual 5.3 -2.4 -2.9
Std. Residual 2.8 -1.0 -1.7
Adjusted Residual 3.6 -1.5 -2.1
Falcon Count 3 6 2 11
% within Brand in use 27.3% 54.5% 18.2% 100.0%
Residual -.4 1.0 -.7
Std. Residual -.2 .5 -.4
Adjusted Residual -.2 .7 -.5
Imported Count 0 11 9 20
% within Brand in use .0% 55.0% 45.0% 100.0%
Residual -6.1 2.0 4.1
Std. Residual -2.5 .7 1.9
Adjusted Residual -3.4 1.0 2.5
Total Count 25 37 20 82
% within Brand in use 30.5% 45.1% 24.4% 100.0%
7/28/2019 Zaid Nizami
http://slidepdf.com/reader/full/zaid-nizami 4/18
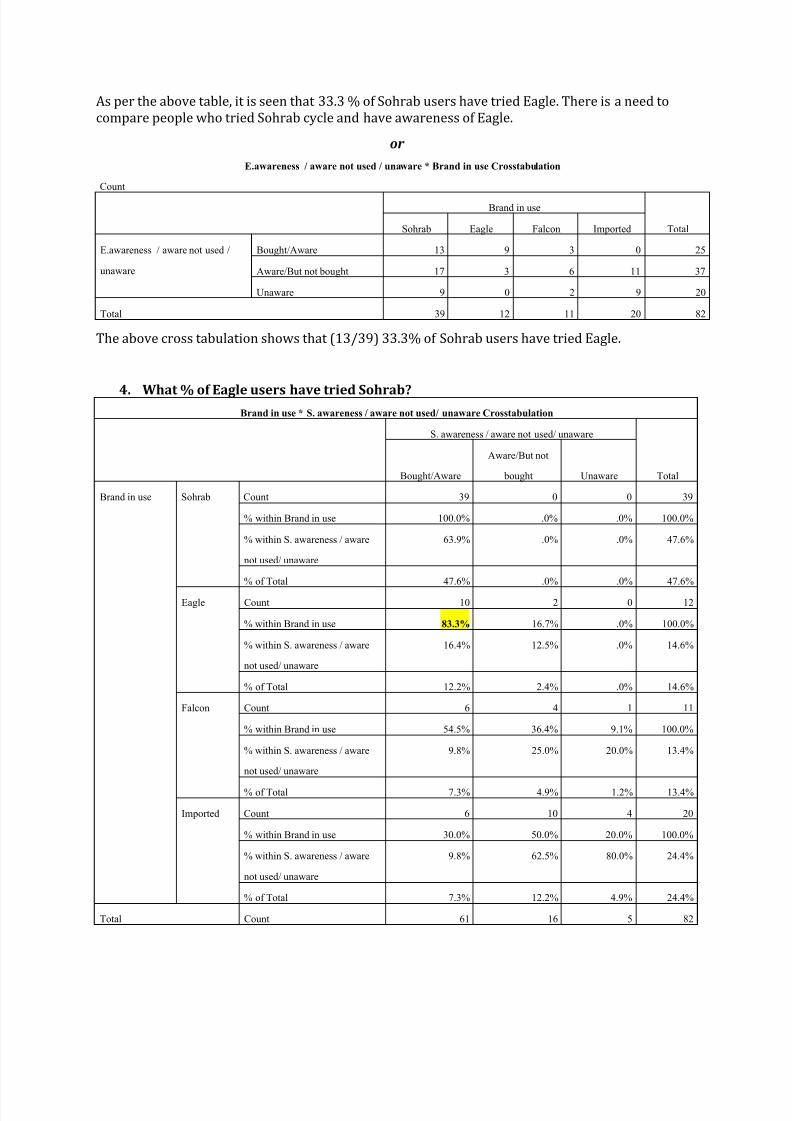
As per the above table, it is seen that 33.3 % of Sohrab users have tried Eagle. There is a need to
compare people who tried Sohrab cycle and have awareness of Eagle.
or
E.awareness / aware not used / unaware * Brand in use Crosstabulation
Count
Brand in use
TotalSohrab Eagle Falcon Imported
E.awareness / aware not used /
unaware
Bought/Aware 13 9 3 0 25
Aware/But not bought 17 3 6 11 37
Unaware 9 0 2 9 20
Total 39 12 11 20 82
The above cross tabulation shows that (13/39) 33.3% of Sohrab users have tried Eagle.
4. What % of Eagle users have tried Sohrab?Brand in use * S. awareness / aware not used/ unaware Crosstabulation
S. awareness / aware not used/ unaware
TotalBought/Aware
Aware/But not
bought Unaware
Brand in use Sohrab Count 39 0 0 39
% within Brand in use 100.0% .0% .0% 100.0%
% within S. awareness / aware
not used/ unaware
63.9% .0% .0% 47.6%
% of Total 47.6% .0% .0% 47.6%
Eagle Count 10 2 0 12
% within Brand in use 83.3% 16.7% .0% 100.0%
% within S. awareness / aware
not used/ unaware
16.4% 12.5% .0% 14.6%
% of Total 12.2% 2.4% .0% 14.6%
Falcon Count 6 4 1 11
% within Brand in use 54.5% 36.4% 9.1% 100.0%
% within S. awareness / aware
not used/ unaware
9.8% 25.0% 20.0% 13.4%
% of Total 7.3% 4.9% 1.2% 13.4%
Imported Count 6 10 4 20
% within Brand in use 30.0% 50.0% 20.0% 100.0%
% within S. awareness / aware
not used/ unaware
9.8% 62.5% 80.0% 24.4%
% of Total 7.3% 12.2% 4.9% 24.4%
Total Count 61 16 5 82

7/28/2019 Zaid Nizami
http://slidepdf.com/reader/full/zaid-nizami 5/18
% within Brand in use 74.4% 19.5% 6.1% 100.0%
% within S. awareness / aware
not used/ unaware
100.0% 100.0% 100.0% 100.0%
% of Total 74.4% 19.5% 6.1% 100.0%
As per the above table, it is seen that 83.3 % of Eagle users have tried Eagle. There is a need to
compare people who tried Eagle cycle and have awareness of Sohrab.
OR
S. awareness / aware not used/ unaware * Brand in use Crosstabulation
Count
Brand in use
TotalSohrab Eagle Falcon Imported
S. awareness / aware not used/
unaware
Bought/Aware 39 10 6 6 61
Aware/But not bought 0 2 4 10 16
Unaware 0 0 1 4 5
Total 39 12 11 20 82
The above cross tabulation shows that (10/12) 83.3% of Eagle users have tried Sohrab.

7/28/2019 Zaid Nizami
http://slidepdf.com/reader/full/zaid-nizami 6/18
5. What are three attributes of which users consider most important when purchasing a
bicycle?Report
brand
name
peers
advic
e
salesm
an
recom.
per.
experie
nce
quali
ty
appeara
nce color frame
Price/va
lue of
money
durability /
reliabil
ity
weigh
t
streng
th
light
drive
comforta
ble seat
warranty /
guarant
ee
Mean 5.5000 5.0000 4.7683 5.5854 6.5122 4.0976 4.4512 6.0488 5.7683 6.0122 5.5366 5.7561 5.9634 5.4512 6.3171
N 82 82 82 82 82 82 82 82 82 82 82 82 82 82 82
Std.
Deviati
on
1.565
44
1.586
98
1.8479
1
1.64768 .689
32
1.63004 1.588
17
1.004
96
1.22019 1.2619
2
1.362
60
1.212
70
1.082
35
1.05588 .76784
There are three main attributes Quality, frame and warranty.
OR
Descriptive Statistics
N Minimum Maximum Mean Std. Deviation
brand name 82 1.00 7.00 5.5000 1.56544
peers advice 82 1.00 7.00 5.0000 1.58698
salesman recom. 82 1.00 7.00 4.7683 1.84791
per. experience 82 1.00 7.00 5.5854 1.64768
quality 82 4.00 7.00 6.5122 .68932
appearance 82 1.00 7.00 4.0976 1.63004
color 82 2.00 7.00 4.4512 1.58817
frame 82 3.00 7.00 6.0488 1.00496
Price/value of money 82 3.00 7.00 5.7683 1.22019
durability / reliability 82 3.00 7.00 6.0122 1.26192
weight 82 2.00 7.00 5.5366 1.36260
strength 82 2.00 7.00 5.7561 1.21270
light drive 82 2.00 7.00 5.9634 1.08235
comfortable seat 82 3.00 7.00 5.4512 1.05588
warranty / guarantee 82 3.00 7.00 6.3171 .76784
Valid N (listwise) 82
We can see from the above table that Quality is the most important attribute in purchasing a bicycle
as it has the highest mean of 6.5122. It is followed by warranty/guarantee with 6.3171 and frame
with 6.0488 mean

7/28/2019 Zaid Nizami
http://slidepdf.com/reader/full/zaid-nizami 7/18
6. What are the three attributes which users of a foreign brand consider most important
when purchasing bicycle?
Report
Brand in use
bran
d
name
peers
advic
e
salesman
recom
.
per.
experie
nce
qual
ity
appeara
nce color
fram
e
Price/v
alue of
money
durability /
reliabi
lity
weig
ht
stren
gth
light
drive
comfort
able
seat
warranty /
guara
ntee
Sohra
b
Mean 5.79
49
5.12
82
5.025
6
5.7436 6.53
85
3.8718 4.20
516.38
46
6.1026 6.205
1
4.53
85
5.74
36
5.66
67
5.0513 6.435
9
N 39 39 39 39 39 39 39 39 39 39 39 39 39 39 39
Std.
Deviat
ion
1.23
926
1.45
420
1.441
62
1.1634
3
.719
87
1.5075
2
1.39
886
.781
88
1.0710
3
1.055
80
1.21
061
1.27
151
1.22
116
.99865 .8206
2
Eagle Mean 5.7500
5.8333
5.5000
6.1667 6.8333
2.5833 2.8333
6.2500
6.0833 6.0000
6.50
00
6.50
00
6.4167
5.2500 6.666
7
N 12 12 12 12 12 12 12 12 12 12 12 12 12 12 12
Std.
Deviat
ion
1.76
455
1.80
067
2.276
36
1.5859
2
.389
25
.66856 .834
85
.621
58
1.0836
2
1.414
21
.797
72
.674
20
.668
56
.86603 .4923
7
Falcon
Mean 5.6364
4.9091
3.9091
4.3636 6.18
18
4.0909 4.6364
5.9091
5.2727 5.5455
6.18
18
5.4545
5.7273
5.2727 5.818
2
N 11 11 11 11 11 11 11 11 11 11 11 11 11 11 11Std.
Deviat
ion
1.12
006
1.22
103
2.256
30
2.5796
4
.873
86
1.5782
6
1.80
404
1.13
618
1.2720
8
1.572
49
.750
76
1.63
485
1.19
087
1.00905 .9816
5
Impor ted
Mean 4.7000
4.3000
4.3000
5.6000 6.45
00
5.4500 5.8000
5.3500
5.2000 5.9000
6.55
00
5.5000
6.4000
6.4500 6.1500
N 20 20 20 20 20 20 20 20 20 20 20 20 20 20 20
Std.
Deviat
ion
2.00
263
1.68
897
1.894
59
1.6670
2
.604
81
1.3168
9
1.00
525
1.18
210
1.3218
8
1.372
67
.604
81
.945
91
.680
56
.60481 .4893
6
Total Mean 5.5000
5.0000
4.7683
5.5854 6.5122
4.0976 4.4512
6.0488
5.7683 6.0122
5.5366
5.7561
5.9634
5.4512 6.3171
N 82 82 82 82 82 82 82 82 82 82 82 82 82 82 82
Std.
Deviat
ion
1.56
544
1.58
698
1.847
91
1.6476
8
.689
32
1.6300
4
1.58
817
1.00
496
1.2201
9
1.261
92
1.36
260
1.21
270
1.08
235
1.05588 .7678
4
The three main attributes are:
Sohrab Users: Frame, Guarantee, Quality
Eagle Users: Strength, Weight, Guarantee
Falcon Users: Guarantee, Quality, Weight
Imported Users: Comfortable Seat, Quality, Weight
OR

7/28/2019 Zaid Nizami
http://slidepdf.com/reader/full/zaid-nizami 8/18
We can see from the above compare means table that Weight is the most important attribute when
considering a foreign brand with a mean of 6.55. It is followed by Comfortable seat and quality with
the same mean of 6.45.

7/28/2019 Zaid Nizami
http://slidepdf.com/reader/full/zaid-nizami 9/18
Exercise B
1. Compare brand loyalty:
2. Develop an awareness, trial, usage diagram:
Crosstab
S. awareness / aware not used/ unaware
TotalBought/Aware
Aware/But not
bought Unaware
Brand in use Sohrab Count 39 0 0 39
% within Brand in use 100.0% .0% .0% 100.0%
% within S. awareness / aware
not used/ unaware
63.9% .0% .0% 47.6%
% of Total 47.6% .0% .0% 47.6%
Eagle Count 10 2 0 12
% within Brand in use 83.3% 16.7% .0% 100.0%
% within S. awareness / aware
not used/ unaware
16.4% 12.5% .0% 14.6%
% of Total 12.2% 2.4% .0% 14.6%
Falcon Count 6 4 1 11
% within Brand in use 54.5% 36.4% 9.1% 100.0%
% within S. awareness / aware
not used/ unaware
9.8% 25.0% 20.0% 13.4%
% of Total 7.3% 4.9% 1.2% 13.4%
Imported Count 6 10 4 20
% within Brand in use 30.0% 50.0% 20.0% 100.0%
% within S. awareness / aware
not used/ unaware
9.8% 62.5% 80.0% 24.4%
% of Total 7.3% 12.2% 4.9% 24.4%
Total Count 61 16 5 82
% within Brand in use 74.4% 19.5% 6.1% 100.0%
% within S. awareness / aware
not used/ unaware
100.0% 100.0% 100.0% 100.0%
% of Total 74.4% 19.5% 6.1% 100.0%
Sohrab
Percentage of people aware: [61+16]/82=94%
Percentage of trial among aware:61/ [61+16]=80%
Percentage of current users among trial users:39/61=64%
7/28/2019 Zaid Nizami
http://slidepdf.com/reader/full/zaid-nizami 10/18
Crosstab
E.awareness / aware not used / unaware
TotalBought/Aware
Aware/But not
bought Unaware
Brand in use Sohrab Count 13 17 9 39
% within Brand in use 33.3% 43.6% 23.1% 100.0%
% within E.awareness / aware
not used / unaware
52.0% 45.9% 45.0% 47.6%
% of Total 15.9% 20.7% 11.0% 47.6%
Eagle Count 9 3 0 12
% within Brand in use 75.0% 25.0% .0% 100.0%
% within E.awareness / aware
not used / unaware
36.0% 8.1% .0% 14.6%
% of Total 11.0% 3.7% .0% 14.6%
Falcon Count 3 6 2 11
% within Brand in use 27.3% 54.5% 18.2% 100.0%
% within E.awareness / aware
not used / unaware
12.0% 16.2% 10.0% 13.4%
% of Total 3.7% 7.3% 2.4% 13.4%
Imported Count 0 11 9 20
% within Brand in use .0% 55.0% 45.0% 100.0%
% within E.awareness / aware
not used / unaware
.0% 29.7% 45.0% 24.4%
% of Total .0% 13.4% 11.0% 24.4%
Total Count 25 37 20 82
% within Brand in use 30.5% 45.1% 24.4% 100.0%
% within E.awareness / aware
not used / unaware
100.0% 100.0% 100.0% 100.0%
% of Total 30.5% 45.1% 24.4% 100.0%
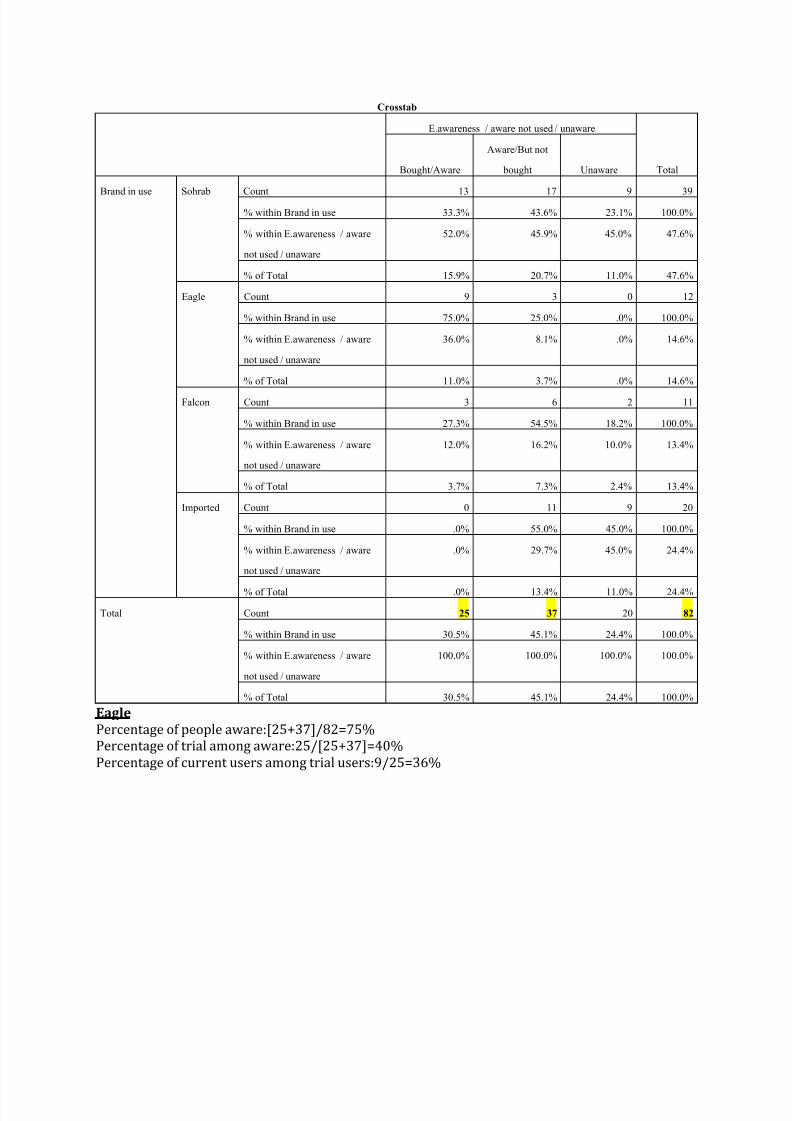
Eagle
Percentage of people aware:[25+37]/82=75%
Percentage of trial among aware:25/[25+37]=40%
Percentage of current users among trial users:9/25=36%

7/28/2019 Zaid Nizami
http://slidepdf.com/reader/full/zaid-nizami 11/18
3. Conclusion regarding bicycle purchase behavior?
Eagle has a lesser awareness than Sohrab among the people i.e. 75% comparison to 94%.
Among the people who are aware of these brands Eagle is tried by 40% while Sohrab is tried by
80%. There are 36% Eagle users while 64% Sohrab users. Eagle’s image is negatively impacted
by weight as it requires more force to balance the cycle when the weight is heavy. Eagle user
retention is due to weight, strength and guarantee while Sohrab user retention is due to frame,guarantee and quality.
4. Develop a profile analysis:Report
Brand in use
brand
name
peers
advic
e
salesman
recom
.
per.
experie
nce
qual
ity
appeara
nce color
fram
e
Price/v
alue of
money
durability /
reliabi
lity
weig
ht
stren
gth
light
drive
comfort
able seat
warranty /
guaran
tee
Sohra
b
Mean 5.794
9
5.128
2
5.025
6
5.7436 6.53
85
3.8718 4.205
1
6.384
6
6.1026 6.2051 4.538
5
5.743
6
5.666
7
5.0513 6.4359
N 39 39 39 39 39 39 39 39 39 39 39 39 39 39 39
Std.Deviat
ion
1.23926
1.45420
1.44162
1.16343
.71987
1.50752 1.39886
.78188
1.07103 1.05580
1.21061
1.27151
1.22116
.99865 .82062
Eagle Mean 5.750
0
5.833
3
5.500
0
6.1667 6.83
33
2.5833 2.833
3
6.250
0
6.0833 6.0000 6.500
0
6.500
0
6.416
7
5.2500 6.6667
N 12 12 12 12 12 12 12 12 12 12 12 12 12 12 12
Std.
Deviat
ion
1.764
55
1.800
67
2.276
36
1.5859
2
.389
25
.66856 .8348
5
.6215
8
1.08362 1.4142
1
.7977
2
.6742
0
.6685
6
.86603 .49237
Falco
n
Mean 5.636
4
4.909
1
3.909
1
4.3636 6.18
18
4.0909 4.636
4
5.909
1
5.2727 5.5455 6.181
8
5.454
5
5.727
3
5.2727 5.8182
N 11 11 11 11 11 11 11 11 11 11 11 11 11 11 11
Std.Deviat
ion
1.12006
1.22103
2.25630
2.57964
.87386
1.57826 1.80404
1.13618
1.27208 1.57249
.75076
1.63485
1.19087
1.00905 .98165
Impor
ted
Mean 4.700
0
4.300
0
4.300
0
5.6000 6.45
00
5.4500 5.800
0
5.350
0
5.2000 5.9000 6.550
0
5.500
0
6.400
0
6.4500 6.1500
N 20 20 20 20 20 20 20 20 20 20 20 20 20 20 20
Std.
Deviation
2.002
63
1.688
97
1.894
59
1.6670
2
.604
81
1.31689 1.005
25
1.182
10
1.32188 1.3726
7
.6048
1
.9459
1
.6805
6
.60481 .48936
Total Mean 5.500
0
5.000
0
4.768
3
5.5854 6.51
22
4.0976 4.451
2
6.048
8
5.7683 6.0122 5.536
6
5.756
1
5.963
4
5.4512 6.3171
N 82 82 82 82 82 82 82 82 82 82 82 82 82 82 82
Std.Deviat
ion
1.56544
1.58698
1.84791
1.64768
.68932
1.63004 1.58817
1.00496
1.22019 1.26192
1.36260
1.21270
1.08235
1.05588 .76784

7/28/2019 Zaid Nizami
http://slidepdf.com/reader/full/zaid-nizami 12/18
For Sohrab and Eagle brand name
has same significance. Appearance
and color hinder the people to buy
Eagle cycle as they are the least
among all brands. On the other hand
the remaining attributes are similar
to Sohrab.
5. Profile Analysis:

7/28/2019 Zaid Nizami
http://slidepdf.com/reader/full/zaid-nizami 13/18
Users are differentiated on
the basis income brackets
though the line graph. People
who are in more than 15000
income bracket do not think
much about the brand name
however they need all the
other attributes having higher
percentages. While the
people in Below 5000 income
bracket desire a famous brand
but have negligible
significance for color,
appearance and comfortable
seat.
6. Factor Analysis:
Image is the name of x-axis and Functioning is the name of y-axis. On the rotated space plot, Image
is comprised of variables qq8a, q8b, q8c, q8d, q8e, q8h, q8i, q8j, q8l, q8o i.e. quality, reliability,
warranty etc. Light drive/less effort, weight and comfortable seats i.e.q8n,q8m,q8k are the
variables in pedaling that effect the Functioning of bicycle. So these Functioning attributes must
have a positive effect on performance of the bicycle.
F
U
N
C
T
I
O
N
I
N
G
IMAGE

7/28/2019 Zaid Nizami
http://slidepdf.com/reader/full/zaid-nizami 14/18
7. Preference Map:
The following variables have highest
significance:
Peer advice & Salesman Recomm: 62.7%
Color & Appearance: 80.8%
Making 2 new variables:Compute Recommendation=(q8b+q8c)/82.
EXECUTE.
Compute Image=(q8g+q8f)/82.
EXECUTE.
While comparing Eagle and Sohrab we note
that Eagle is recommended higher but it is
not actually bought because of it is low on
image than Sohrab.
Imported bicycles are rated more on Image
than the local brands but are not
recommended due to their high prices.
8. Profile analysis:
Report
Brand in use Recommendation Image
Sohrab Mean .1238 .0985
N 39 39
Std. Deviation .03184 .03385
Eagle Mean .1382 .0661
N 12 12
Std. Deviation .04573 .01321
Falcon Mean .1075 .1064
N 11 11
Std. Deviation .03527 .03974
Imported Mean .1049 .1372
N 20 20
Std. Deviation .04043 .02403
Total Mean .1191 .1043
N 82 82
Std. Deviation .03781 .03731
.0000
.0500
.1000
.1500
.0000 .0500 .1000 .1500 R e c o m m e n d a t i o n
Image
Sohrab
Eagle
Falcon
Imported

7/28/2019 Zaid Nizami
http://slidepdf.com/reader/full/zaid-nizami 15/18
It is seen from the line graph,
people in income bracket of Rs.
5000-10000 give a higher rating
to Sohrab on all attributesmaking them equally important.
9. Perceptual Map
Making of 2 new variables:
COMPUTE
SohrabAppearance=(q9a3+q9
a2)/78.
EXECUTE.
COMPUTE
SohrabRidingExcitment=(q9
a9+q9a10)/78.
EXECUTE.
Sohrab’s image in people in the
income bracket Rs.5000-10000
have the highest preference for
Appearance andRidingExcitement. People in
income bracket below 5000
have 2nd
highest preference.
The remaining follow.
Report
IncomeSohrabAppeara
nceSohrabRidingEx
citement
Student Mean .12 .13
N 8 8
Std. Deviation .038 .038
Below 5000 Mean .14 .14
N 26 26
Std. Deviation .040 .035
b/w 5000-10000 Mean .15 .15
N 26 26
Std. Deviation .025 .032
b/w 10000- 15000 Mean .12 .11
N 5 5Std. Deviation .065 .070
More than 15000 Mean .10 .10
N 13 13
Std. Deviation .043 .038
Total Mean .13 .13
N 78 78
Std. Deviation .042 .042

7/28/2019 Zaid Nizami
http://slidepdf.com/reader/full/zaid-nizami 16/18
10. Segment Bicycle User:
Number of Cases in each
Cluster
Cluster 1 41.000
2 41.000
Valid 82.000
Missing .000
Cluster 1 and Cluster have been developed, comprising of 41 variables.
Report
Cluster Number of Case
Primary
transport
Loading
Purpose
Ridingfun
Stylish
Rides
Riding
Comf ort
Conven.
shortdistances
Conven.
longdistances
Saferide
Bicycle
Thef t
Qlty.Pak.Bicy
cles
Better Qlty.Imp.
Lightweig
htbicycles
highmar ketprices
1 3.8537
2.1463
5.0000
4.3171
4.3659
5.3171
2.8780
3.0488
4.2439
4.2683 5.4390
5.4634
4.7805
2 6.8537
6.1707
4.9024
5.3171
6.0488
6.3415
5.4146
5.2195
6.1707
5.8780 6.2683
6.0976
5.4390
Total 5.3537
4.1585
4.9512
4.8171
5.2073
5.8293
4.1463
4.1341
5.2073
5.0732 5.8537
5.7805
5.1098
People in Cluster 1 give a higher rating to all the attributes than people in cluster 2 but there is one
common attitude i.e. Riding Fun.
Clust
er Num
ber
of Case
bran
dnam
e
peer
sadvi
ce
salesmanr
ecom.
per.
experience
qual
ity
appear
ance
colo
r
fra
me
Price/v
alue of money
durabi
lity /reliabi
lity
wei
ght
stren
gth
ligh
tdriv
e
comfort
ableseat
warra
nty /guara
ntee
1 5.07
32
4.48
78
4.0488 4.7561 6.31
71
4.7561 5.12
20
5.78
05
5.2683 5.707
3
5.78
05
5.26
83
6.07
32
5.7073 6.146
3
2 5.9268
5.5122
5.4878 6.4146 6.7073
3.4390 3.7805
6.3171
6.2683 6.3171
5.2927
6.2439
5.8537
5.1951 6.4878
Total 5.50
00
5.00
00
4.7683 5.5854 6.51
22
4.0976 4.45
12
6.04
88
5.7683 6.012
2
5.53
66
5.75
61
5.96
34
5.4512 6.317
1
.0000
1.00002.00003.00004.00005.00006.00007.00008.0000
1
2
7/28/2019 Zaid Nizami
http://slidepdf.com/reader/full/zaid-nizami 17/18
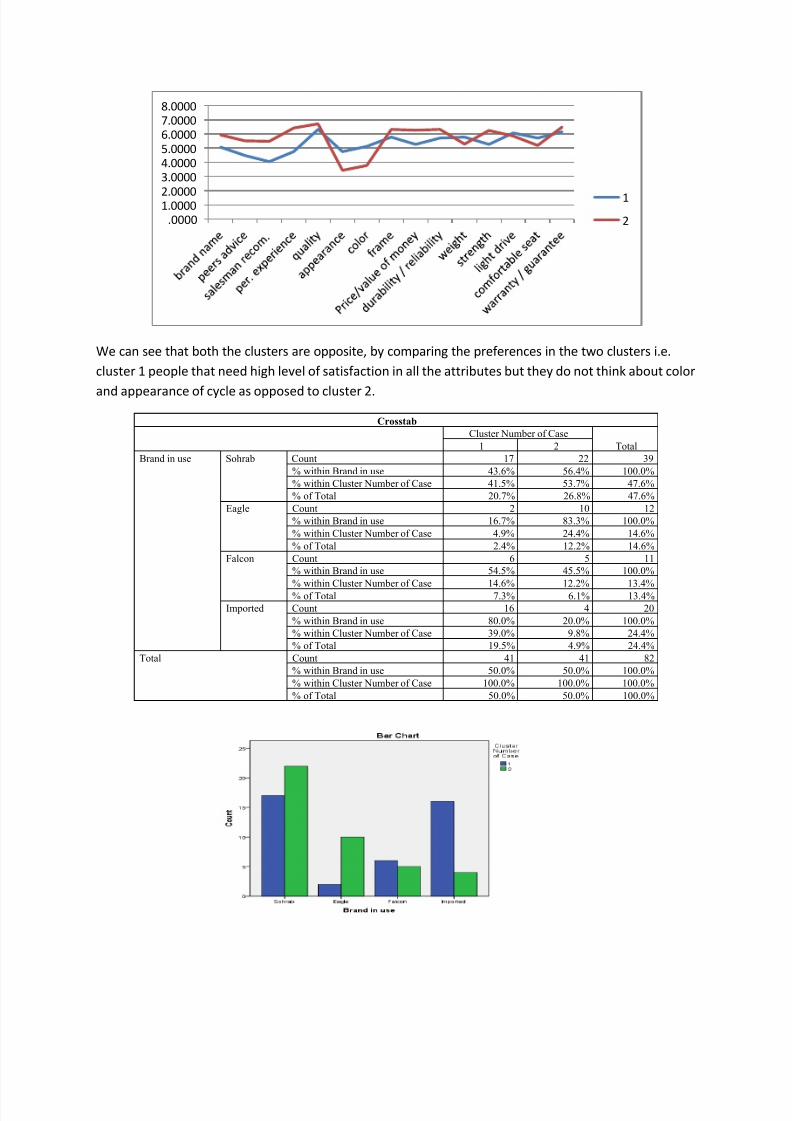
We can see that both the clusters are opposite, by comparing the preferences in the two clusters i.e.
cluster 1 people that need high level of satisfaction in all the attributes but they do not think about color
and appearance of cycle as opposed to cluster 2.
Crosstab
Cluster Number of Case
Total1 2
Brand in use Sohrab Count 17 22 39
% within Brand in use 43.6% 56.4% 100.0%
% within Cluster Number of Case 41.5% 53.7% 47.6%
% of Total 20.7% 26.8% 47.6%
Eagle Count 2 10 12
% within Brand in use 16.7% 83.3% 100.0%
% within Cluster Number of Case 4.9% 24.4% 14.6%
% of Total 2.4% 12.2% 14.6%
Falcon Count 6 5 11
% within Brand in use 54.5% 45.5% 100.0%
% within Cluster Number of Case 14.6% 12.2% 13.4%
% of Total 7.3% 6.1% 13.4%
Imported Count 16 4 20
% within Brand in use 80.0% 20.0% 100.0%
% within Cluster Number of Case 39.0% 9.8% 24.4%
% of Total 19.5% 4.9% 24.4%
Total Count 41 41 82
% within Brand in use 50.0% 50.0% 100.0%
% within Cluster Number of Case 100.0% 100.0% 100.0%
% of Total 50.0% 50.0% 100.0%
.0000
1.00002.0000
3.0000
4.0000
5.0000
6.0000
7.0000
8.0000
1
2

7/28/2019 Zaid Nizami
http://slidepdf.com/reader/full/zaid-nizami 18/18
Crosstab
Cluster Number of Case
Total1 2
Income Student Count 7 1 8
% within Income 87.5% 12.5% 100.0%
% within Cluster Number of Case 17.1% 2.4% 9.8%
% of Total 8.5% 1.2% 9.8%
Below 5000 Count 11 16 27
% within Income 40.7% 59.3% 100.0%% within Cluster Number of Case 26.8% 39.0% 32.9%
% of Total 13.4% 19.5% 32.9%
b/w 5000-10000 Count 7 20 27
% within Income 25.9% 74.1% 100.0%
% within Cluster Number of Case 17.1% 48.8% 32.9%
% of Total 8.5% 24.4% 32.9%
b/w 10000- 15000 Count 4 2 6
% within Income 66.7% 33.3% 100.0%
% within Cluster Number of Case 9.8% 4.9% 7.3%
% of Total 4.9% 2.4% 7.3%
More than 15000 Count 12 2 14
% within Income 85.7% 14.3% 100.0%
% within Cluster Number of Case 29.3% 4.9% 17.1%
% of Total 14.6% 2.4% 17.1%
Total Count 41 41 82
% within Income 50.0% 50.0% 100.0%
% within Cluster Number of Case 100.0% 100.0% 100.0%
% of Total 50.0% 50.0% 100.0%
11. Conclusion:
Segmentation on basis of Income: There are same overall percentages of people who buy bicycle in the
income segments below Rs. 5000 and Rs. 5000-10000.
Segmentation on basis of Brand: Sohrab has higher market share compared to its competitors because it
is the most popular brand. If we look at the shares: Cluster1 = 44% and Cluster2 = 56%.