You have interviewed 5 persons in this household, and you need to complete the relationship table...
14
You have interviewed 5 persons in this household, and you need to complete the relationship table for person 5. Person 1: Husband Person 2: Wife Person 3: Female Child Person 4: Male Child Person 5: Mother of Person 1 How will you complete the table in relation to Person 5? Improving the Collection of Household Relationship Data the boxes to choose each relationship, then click SUBMIT SUBMIT
-
Upload
kathlyn-murphy -
Category
Documents
-
view
215 -
download
2
Transcript of You have interviewed 5 persons in this household, and you need to complete the relationship table...

You have interviewed 5 persons in this household, and you need to complete the relationship table for person 5.
Person 1: HusbandPerson 2: WifePerson 3: Female ChildPerson 4: Male ChildPerson 5: Mother of Person 1
How will you complete the table in relation to Person 5?
Improving the Collection of Household Relationship Data
Click the boxes to choose each relationship, then click SUBMIT SUBMIT

You have interviewed 5 persons in this household, and you need to complete the relationship table for person 5.
Person 1: WifePerson 2: HusbandPerson 3: GrandmotherPerson 4: SisterPerson 5: Brother
How will you complete the table in relation to Person 5?
That’s correct!
Person 1: HusbandPerson 2: WifePerson 3: Female ChildPerson 4: Male ChildPerson 5: Mother of Person 1
To the Grandmother (Person 5):1. Person 1 is her Son2. Person 2 is her daughter-in-law3. Person 3 is her granddaughter4. Person 4 is her grandson
Click NEXT
X
X
X X
Improving the Collection of Household Relationship Data

Obscuring the Truth
Communication Problems
Inadequate Definitions and Concepts
Erroneous Wording of Questions
Selecting the Wrong Respondent
Using the Wrong Enumerator
Typical Causes of Gender Bias in Use of Questionnaires
Click each tab to explore the causes.
In this case, the respondent selected is not in a position to report correctly either on the people belonging to the household, or the people working in the business or on the agricultural holding.
For example, male respondents may report women who are actually working on an agricultural holding as not economically active.

Micro datasets
Pre-processed datasets
Policy Makers
Indicator-based formats
Data Formats Vary For Different Users
Drag and drop each data format onto the most likely user group. Click and release the datasets to see an example and brief description.
General Public
Statisticians
DATA FORMATS DATA USERS
Brief description of micro datasets goes here.
IMAGE OF A MICRO DATASET WOULD GO HERE

Micro datasets
Pre-processed datasets
Policy MakersIndicator-based formats
Data Formats Vary For Different Users
General Public
Statisticians
DATA FORMATS DATA USERS
Rationale goes here…lfkgjdl glfd ldkgjlfk jldkldkj ld ldj ldfdlfgk jflk dlfkdfl kfd fkj lfdk gdfkj ldkfj ldkdlgldkjgdf lkjldlfkg ldfkjdlkfjdlkfj ldkf jlfdkldgd gldkf dkf gldkfjg ldkl

You are creating a survey, and you need to understand which persons are employed at any level.
The response is intended to capture persons who were employed at least one hour during the survey reference week.
What is the most effective way to formulate your survey question to get the response you want?
What were you doing most of last week – working, keeping house, or something else?
1
2
3
4
Last week, did you do any work for pay or profit?
Do you work on a regular basis?
Do you have a job outside of your home?SUBMIT

You are creating a survey, and you need to understand which persons are employed at any level.
The response is intended to capture persons who were employed at least one hour during the survey reference week.
What is the most effective way to formulate your survey question to get the response you want?
What were you doing most of last week – working, keeping house, or something else?
1
2
3
4
Last week, did you do any work for pay or profit?
Do you work on a regular basis?
Do you have a job outside of your home?
That’s correct!
“Last week, did you do any work for pay or profit?”
The goal is to understand how many people are employed for pay at any level. Non-remunerated work would be captured in another way, such as through time-use surveys.
Click NEXT

Moving towards gender equality step by step…
1975: 1st Women’s Conference, Mexico City/International Women’s Year
1979: Adoption of CEDAW
1980: 2nd Women’s Conference, Copenhagen
1985: 3rd Women’s Conference, Nairobi
1990: A World’s Women first published
1995: 4th World Conference, Beijing. Beijing Platform for Action
2000: Millenium Development Goals (MDGs)
2012: Rio + 20
2014: 9th African Regional Conference on Women
2015: SDG
2030: Gender Equality Target Date
TBD…
2063: African Agenda 2063
Moving towards gender equality step by step…
DATE : TITLE OF THE EVENT GOES HERE
Engaging descriptive text about how this event moved gender equality forward goes here.
1975: 1st Women’s Conference, Mexico City/International Women’s Year

You have done the analysis, and identified the statistics that are needed for your research.
What’s next?
Present your findings in charts and tables1
2
3
4
Define the study population
Assess their availability and quality
Begin collecting information
SUBMIT
Sample Quiz Question
You have done the analysis, and identified the statistics that are needed for your research.
What’s next?
Present your findings in charts and tables1
2
3
4
Define the study population
Assess their availability and quality
Begin collecting information
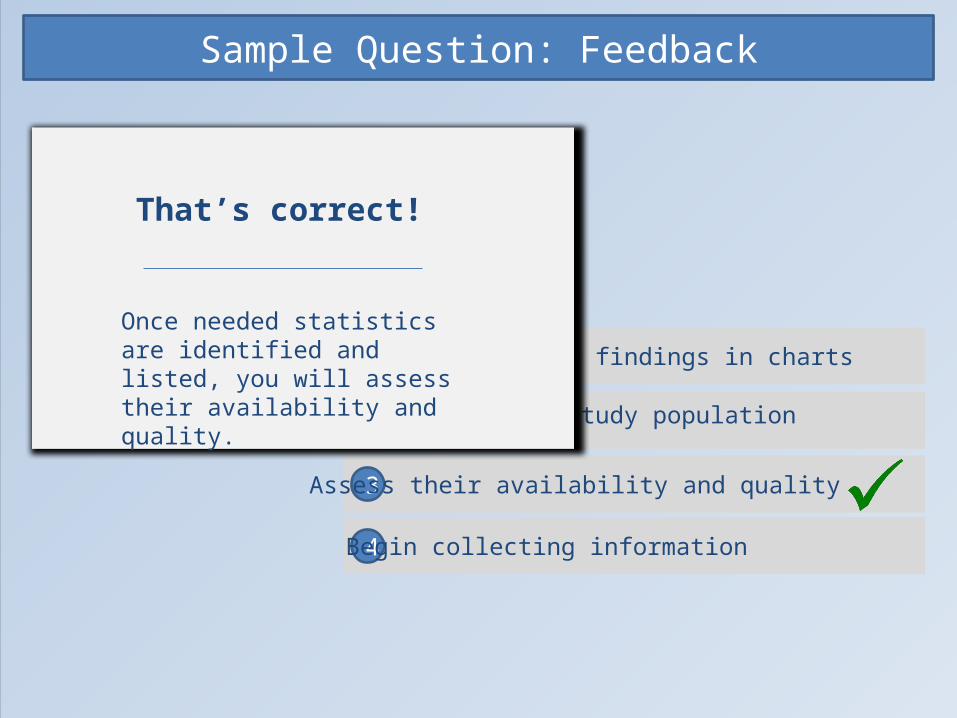
That’s correct!
Once needed statistics are identified and listed, you will assess their availability and quality.
Sample Question: Feedback

Drag the different activities for creating a survey into the correct order, then click SUBMIT.
Activity 2A
B
C
D
Activity 4
Activity 3
Activity 1
SUBMIT
Sample Sequencing Question

Activity11
2
3
4
Activity 2
Activity 3
Activity 4
You have done the analysis, and identified the statistics that are needed for your research.
What’s next?
That’s correct!
You placed the activities for creating a survey in the correct order.
Sample Sequencing Question: Feedback