Www.globaliia.org 2013: Time to Seize the Opportunity.
23
www.globaliia.org 2013: Time to Seize the Opportunity
-
Upload
winfred-benson -
Category
Documents
-
view
217 -
download
3
Transcript of Www.globaliia.org 2013: Time to Seize the Opportunity.

www.globaliia.org
2013: Time to Seize the Opportunity

www.globaliia.org
• Conducted February 2013– 5th consecutive year– 37% of organizations earn
$1 billion USD or more in annual revenue
– 63% of respondents work in public or private companies
• 1700 Responses– 74% of respondents are audit
managers or above– 63% are CAEs
• Geographic Distribution of Survey Respondents– 33% North America– 29% Europe– 17% Latin America– 9% Asia Pacific– 9% Africa
2013 Global Survey Demographics

www.globaliia.org
Four Key Trends Emerging in 2013
1
•Elevating Our Stature
2
•Standing Our Ground
3
•Doing More With More
4
•Changing Our Game

www.globaliia.org
Elevating Our Stature

www.globaliia.org
Internal Audit’s Stature• Often reflected by:
– How internal audit is perceived– How the function is used– To whom the chief audit executive
(CAE) reports
• Reporting relationships– Administrative reporting relationship– Functional reporting relationship
• Has consistently migrated upward over the past decade
Source: The IIA Audit Executive Center

www.globaliia.org
Chief Financial Officer (CFO) – 21%
Other – 14.5%
Internal Audit Administrative Reporting Relationships
Chief Executive Officer (CEO) – 43%
Audit Committee (AC) – 9%
Board of Directors (BoD) – 8%
Chief Compliance Officer – 1.5%
General Council – 3%
Source: “The Pulse of the Profession: © 2013 The IIA Audit Executive Center

www.globaliia.org
Internal Audit Administrative Reporting Relationships
CEO – 33%CFO – 37%
CEO – 51%CFO – 12%
CEO – 56%CFO – 22%
CEO – 50%CFO – 13%
Source: “The Pulse of the Profession: © 2013 The IIA Audit Executive Center
CEO – 52%CFO – 12%

www.globaliia.org
CFO – 6%
Other 10%
Internal Audit Functional Reporting Relationships
CEO – 18% Audit Committee – 54%
Full BoD – 12%
Source: “The Pulse of the Profession: © 2013 The IIA Audit Executive Center

www.globaliia.org
Internal Audit Functional Reporting Relationships
AC – 73%Full BoD – 3%
CEO – 10%
AC – 37%Full BoD – 20%
CEO – 28%
AC – 77%Full BoD – 2%
CEO – 11%
AC – 41%Full BoD – 21%
CEO – 22%
Source: “The Pulse of the Profession: © 2013 The IIA Audit Executive Center
AC – 62%Full BoD – 7%
CEO – 21%

www.globaliia.org
Standing Our Ground

www.globaliia.org
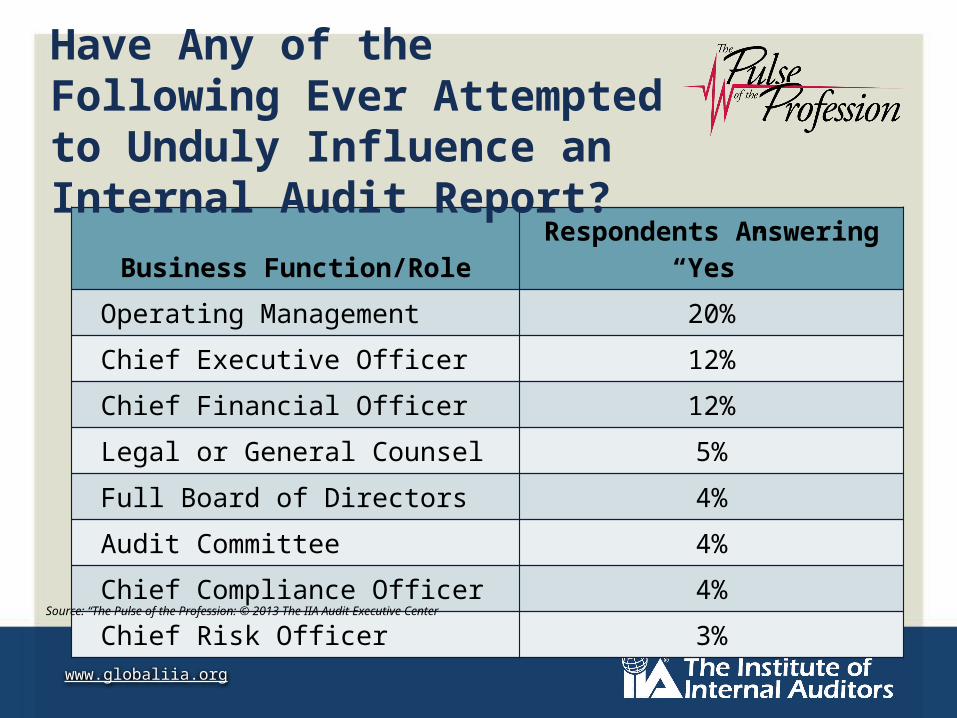
Standing Our Ground
• Our stakeholders look to us for:– Objective assurance on risk and controls– Insight on business risks – Advise and assistance as warranted
• Stakeholders also look for us to:– Demonstrate courage– Deliver difficult news when warranted– Call it like it is– Not change or conceal results under duress
• Survey indicates we are “standing our ground”
www.globaliia.org
Business Function/Role Respondents Answering “Yes”Operating Management 20%
Chief Executive Officer 12%
Chief Financial Officer 12%
Legal or General Counsel 5%
Full Board of Directors 4%
Audit Committee 4%
Chief Compliance Officer 4%
Chief Risk Officer 3%
Source: “The Pulse of the Profession: © 2013 The IIA Audit Executive Center
Have Any of the Following Ever Attempted to Unduly Influence an Internal Audit Report?

www.globaliia.org
Report to: PercentageAudit Committee 52%
Chief Executive Officer 19%
Full Board of Directors 18%
Chief Financial Officer 1%
Legal or General Counsel 1%
Other/Unsure 9%
Source: “The Pulse of the Profession: © 2013 The IIA Audit Executive Center
23% of Respondents Believed Internal Audit Would Be More Independent if It Reported to:

www.globaliia.org
Doing More With More

www.globaliia.org
Positioned for Success
• Financial crisis impact on internal audit resources was swift and noteworthy in the areas of • Staffing• Budgets
• By 2011, more than 40% of internal audit functions reported reduced staffing
• After a sluggish recovery, 2013 is poised to be the strongest year since 2007

www.globaliia.org
The Outlook for Global Internal Audit Resources is Strong
• Budgets:
• Staffing:
Increase Stable Decrease
Overall 33% 55% 12%
Change from 2012–2013
Increase Stable Decrease
Overall 22% 69% 9%
Change from 2012–2013
Source: “The Pulse of the Profession: © 2013 The IIA Audit Executive Center

www.globaliia.org
The Outlook for Global Internal Audit Budgets by Region
+39%- 11%
+48%- 3%
+47%- 7%
+19%- 14%
+47%- 10%
Source: “The Pulse of the Profession: © 2013 The IIA Audit Executive Center

www.globaliia.org
The Outlook for Global Internal Audit Staffing by Region
+23%- 7%
+24%- 4%
+20%- 6%
+17%- 10%
+22%- 6%
Source: “The Pulse of the Profession: © 2013 The IIA Audit Executive Center

www.globaliia.org
Changing Our Game

www.globaliia.org
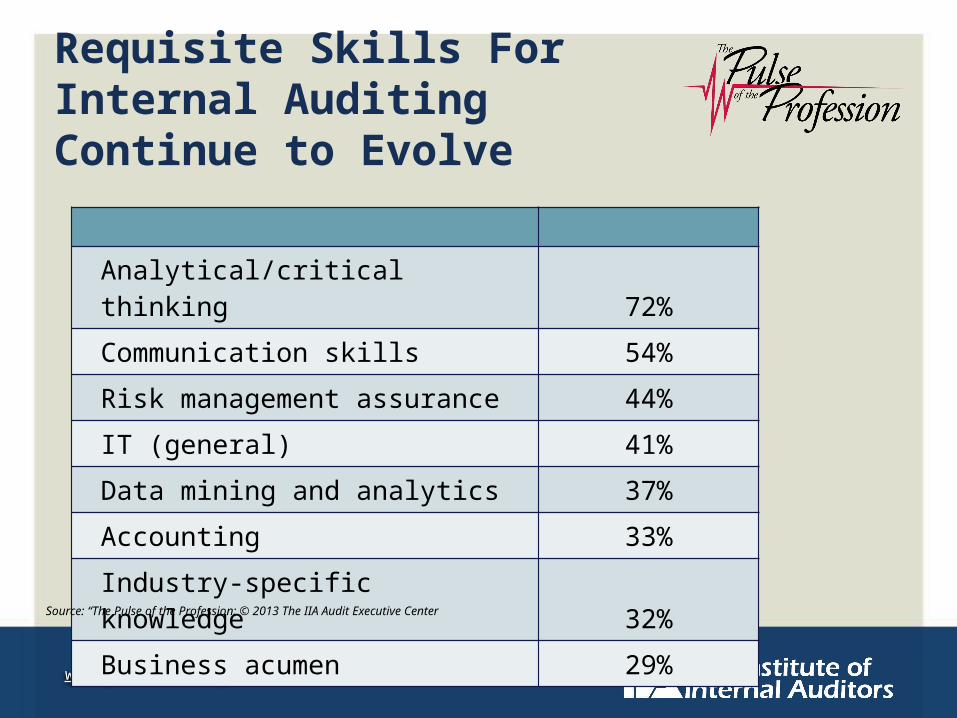
Changing Our Game
• Rebalancing of internal audit plans has been ongoing for several years. Driven by:
- Changing risks and expectations- Compliance burdens- Risk management assurance- Technology
• Requisite skills must evolve and broaden to address emerging risks
• Successful CAEs must have prescience: the ability to “see around corners”

www.globaliia.org
Fraud – 5%
Operational (OP)–28%
Financial (FIN) – 21%
Compliance (COMP) 14%
Strategic/Business – 5%
Other – 11%Risk Management
Assurance 7%
IT – 9%
Distribution of Typical Internal Audit Coverage in 2013
Source: “The Pulse of the Profession: © 2013 The IIA Audit Executive Center

www.globaliia.org
Distribution of Typical Internal Audit Coverage in 2013
OP - 27%FIN – 27%*
COMP – 15%
OP - 29%FIN – 18%
COMP – 13%
OP - 27%FIN – 19%
COMP – 14%
OP - 31%FIN – 15%
COMP – 14%
Source: “The Pulse of the Profession: © 2013 The IIA Audit Executive Center* Inclusive of Sarbanes-Oxley work
OP - 29%FIN – 19%
COMP – 12%
www.globaliia.org
Analytical/critical thinking 72%
Communication skills 54%
Risk management assurance 44%
IT (general) 41%
Data mining and analytics 37%
Accounting 33%
Industry-specific knowledge 32%
Business acumen 29%
Source: “The Pulse of the Profession: © 2013 The IIA Audit Executive Center
Requisite Skills For Internal Auditing Continue to Evolve