
WWE INVESTOR NETWORK PRESENTATION...
15
WWE INVESTOR NETWORK PRESENTATION – APRIL 3, 2017
Transcript of WWE INVESTOR NETWORK PRESENTATION...

W W E I N V E S T O R N E T W O R K P R E S E N TAT I O N – A P R I L 3 , 2 0 1 7

This presentation contains forward-looking statements pursuant to the safe harbor provisions of the Securities Litigation Reform Act of 1995, which are subject to various
risks and uncertainties. These risks and uncertainties include, without limitation, risks relating to: WWE Network (including the risk that we are unable to attract, retain and
renew subscribers); major distribution agreements; our need to continue to develop creative and entertaining programs and events; the possibility of a decline in the
popularity of our brand of sports entertainment; the continued importance of key performers and the services of Vincent K. McMahon; possible adverse changes in the
regulatory atmosphere and related private sector initiatives; the highly competitive, rapidly changing and increasingly fragmented nature of the markets in which we operate
and greater financial resources or marketplace presence of many of our competitors; uncertainties associated with international markets; our difficulty or inability to promote
and conduct our live events and/or other businesses if we do not comply with applicable regulations; our dependence on our intellectual property rights, our need to protect
those rights, and the risks of our infringement of others’ intellectual property rights; the complexity of our rights agreements across distribution mechanisms and geographical
areas; potential substantial liability in the event of accidents or injuries occurring during our physically demanding events including, without limitation, claims relating to CTE;
large public events as well as travel to and from such events; our feature film business; our expansion into new or complementary businesses and/or strategic investments;
our acquisitions; our computer systems and online operations; privacy norms and regulations; a possible decline in general economic conditions and disruption in financial
markets; our accounts receivable; our indebtedness; litigation; our potential failure to meet market expectations for our financial performance, which could adversely affect
our stock; Vincent K. McMahon exercises control over our affairs, and his interests may conflict with the holders of our Class A common stock; a substantial number of
shares are eligible for sale by the McMahons and the sale, or the perception of possible sales, of those shares could lower our stock price; and the relatively small public
“float” of our Class A common stock. In addition, our dividend is dependent on a number of factors, including, among other things, our liquidity and historical and projected
cash flow, strategic plan (including alternative uses of capital), our financial results and condition, contractual and legal restrictions on the payment of dividends (including
under our revolving credit facility), general economic and competitive conditions and such other factors as our Board of Directors may consider relevant. Forward-looking
statements made by the Company speak only as of the date made and are subject to change without any obligation on the part of the Company to update or revise them.
Undue reliance should not be placed on these statements. For more information about risks and uncertainties associated with the Company’s business, please refer to the
“Management’s Discussion and Analysis of Financial Condition and Results of Operations” and “Risk Factors” sections of the Company’s SEC filings, including, but not
limited to, our annual report on Form 10-K and quarterly reports on Form 10-Q.
This presentation contains non-GAAP financial information, including OIBDA, Adjusted OIBDA, Net Debt and Free Cash Flow. We define OIBDA as operating income
before depreciation and amortization, excluding feature film and television production amortization and related impairments. OIBDA is a non-GAAP financial measure and
may be different than similarly-titled non-GAAP financial measures used by other companies. A limitation of OIBDA is that it excludes depreciation and amortization, which
represents the periodic charge for certain fixed assets and intangible assets used in generating revenues for the Company's business. In addition, we define Free Cash Flow
as net cash provided by operating activities less cash used for capital expenditures. We believe that operating income is the most directly comparable GAAP financial
measure to OIBDA and Adjusted OIBDA, Total Debt is the most directly comparable GAAP financial measure to Net Debt, and net cash provided by operating activities is
the most directly comparable GAAP financial measure to Free Cash Flow. Neither OIBDA, Adjusted OIBDA, Net Debt nor Free Cash Flow should be regarded as an
alternative to the most directly comparably GAAP financial measure as an indicator of operating performance, or to the statement of cash flows as a measure of liquidity, nor
should either metric be considered in isolation or as a substitute for financial measures prepared in accordance with GAAP. See the Appendix at the end of this presentation
for a reconciliation of the non-GAAP measures presented herein. Reconciliations of non-GAAP measures presented herein can be found in the Appendix at the end of this
presentation or in the Company’s earnings release dated February 9, 2017.
Forward-Looking Statements
2

WWE Network Highlights
2017 WWE Business Outlook
Key Topics
3

WWE Network Subscriber Highlights1
WWE Network reached a record 1.95 million total subscribers as of April 3, 20172
Total domestic subscribers increased 4% to 1.45 million; total international subscribers increased 15% to 497,000
from April 4, 2016 – the day after WrestleMania last year
Paid subscribers reached 1.66 million (+14%), including 1.24 million domestic (+12%) and 424,000 international
(+23%) subscribers as of April 3, 2017
WrestleMania Engagement Milestones
WrestleMania broke the attendance record for the Orlando Citrus Bowl with 75,245 fans from all 50 States and 62
countries. As part of the week-long WrestleMania celebration, WWE will have an unprecedented five consecutive
nights of sellouts at the Citrus Bowl and Amway Center
WWE Network subscribers viewed 22.5 million hours during WrestleMania Week or 13 hours per subscriber during
the week. This compares to 21.7 million hours last year, a 4% year-over-year increase
For the first time, WrestleMania was made available in China on a pay-per-view basis via PPTV’s digital platform
Digital and social media video views reached 133 million (Facebook, Twitter, Instagram, Snapchat, and YouTube),
representing a 105% increase over last year
WrestleMania garnered a record 18 million social media fan engagements3, up 66% year over year
Highlights & Milestones
4
1. Definitions of subscriber metrics above are provided on page 12 2. Total subscribers following WrestleMania exclude pay-per-view buys with cable and satellite providers3. Social media fan engagements are defined as the cumulative fan response to WWE content measured by the number of likes, comments, shares, reactions, mentions, favorites,
screenshots, and replies across Facebook, Twitter, Instagram and Snapchat

WWE 2017 Business Outlook
5
Q1 2017: Based upon preliminary data, WWE Network attracted an average of approximately 1.49 million paidsubscribers over the first quarter 2017, representing a 16% increase from the first-quarter 2016 average. The first-quarter 2017 average was in-line with guidance of 1.48 million (+/- 2%)
During the first quarter 2017, the rise in WWE’s stock price resulted in an increase in stock compensation expense.Based on this increase and the timing of other items impacting our results, the Company currently expects (subject tothe completion of its quarterly close process) that its Adjusted OIBDA for the first quarter 2017 will be $3 million to $5million below the previously estimated range of $23 million to $27 million. The Company anticipates that these timingelements will reverse over the coming months and is maintaining its full year Adjusted OIBDA target
WWE is unable to provide a reconciliation of first quarter guidance to GAAP measures as, at this time, WWE cannotaccurately determine all of the adjustments that would be required. The Company is evaluating certain items for the firstquarter 2017 including film impairments which (subject to the completion of its quarterly close process) may result inreconciling adjustments. Further information regarding such reconciliations can be found on page 14 of thispresentation
Q2 2017: If the acquisition and retention of subscribers driven by WresltleMania is consistent with the subscriberactivity associated with the prior year event, the range of average paid subscribers for the second quarter 2017 wouldbe 1.63 million (+/- 2%), representing an increase of approximately 8% from the second quarter 2016. As futuresubscriber performance may differ from prior activity, this range is provided for perspective rather than as guidance
2017: WWE management continues to expect the Company to achieve another year of record revenue and hastargeted Adjusted OIBDA of $100 million, which would be an all-time record (up approximately 25% from 2016 AdjustedOIBDA of $80.1 million)*
* Q1 2017 and 2017 Adjusted OIBDA represents the Company’s business outlook for the quarter ending 03/31/17 and full year ending 12/31/17, respectively. The definition of Adjusted OIBDA can be
found on page 15 of this presentation. WWE is unable to provide a reconciliation of forward looking guidance to GAAP measures as, at this time, WWE cannot accurately determine the adjustments
that would be required. Further information regarding the reconciliation of Adjusted OIBDA to Operating income can be found on page 14 of this presentation
- Definitions of subscriber metrics above are provided on page 12
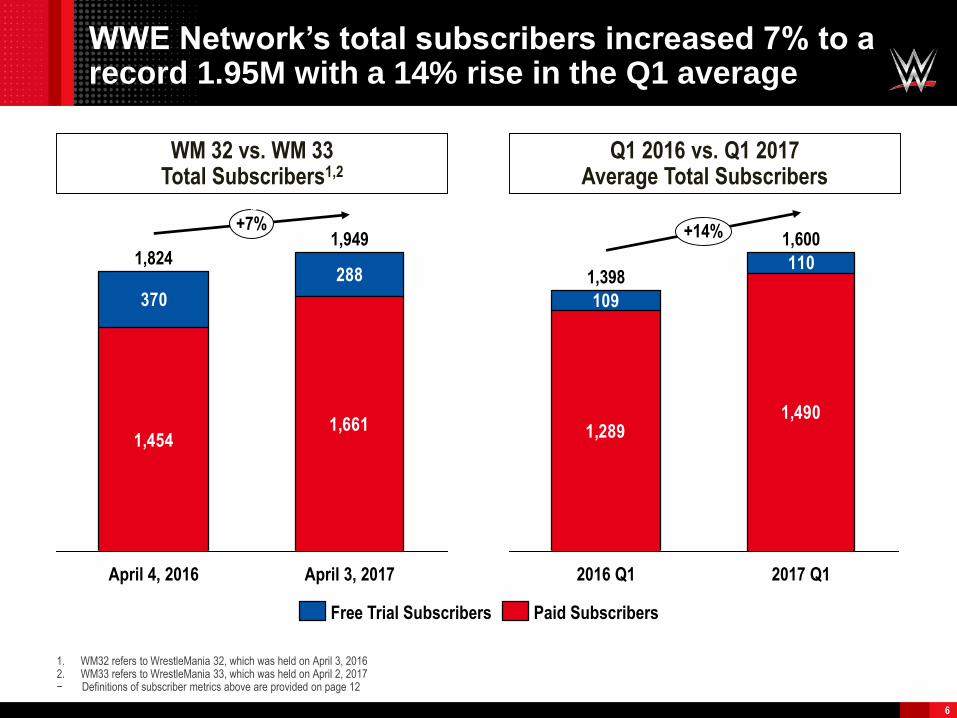
1,4541,661
370
2881,824
+7%
April 3, 2017
1,949
April 4, 2016
WWE Network’s total subscribers increased 7% to a record 1.95M with a 14% rise in the Q1 average
6
WWE Free Video on Demand1
(in billions)
Social Media Followers2
(average, in millions)
1,2891,490
109
110
+14%
2017 Q1
1,600
2016 Q1
1,398
WM 32 vs. WM 33 Total Subscribers1,2
Q1 2016 vs. Q1 2017 Average Total Subscribers
Free Trial Subscribers Paid Subscribers
1. WM32 refers to WrestleMania 32, which was held on April 3, 20162. WM33 refers to WrestleMania 33, which was held on April 2, 2017− Definitions of subscriber metrics above are provided on page 12

1,1091,237
281215
1,452
April 4, 2016
1,390
+4%
April 3, 2017
7
WWE Free Video on Demand1
(in billions)
Social Media Followers2
(average, in millions)
9851,098
75
2017 Q1
+11%1,177
79
2016 Q1
1,060
WM 32 vs. WM 33 Total Domestic Subscribers1,2
Q1 2016 vs. Q1 2017 Average Total Domestic Subscribers
Paid SubscribersFree Trial Subscribers
WWE Network’s total domestic subscribers increased 4% with a 11% rise in the Q1 average
1. WM32 refers to WrestleMania 32, which was held on April 3, 20162. WM33 refers to WrestleMania 33, which was held on April 2, 2017− Definitions of subscriber metrics above are provided on page 12

If WrestleMania related subscriber activity is consistent with 2016, average total subs in Q2’17 would rise 6%
8
WWE Free Video on Demand1
(in billions)
Social Media Followers2
(average, in millions)
1,5171,636
156139
+6%
2017 Q2 Potential*
1,775 (+/- 2%)
2016 Q2
1,673
1,143 1,211
116103
+4%
2017 Q2 Potential*
1,314 (+/- 2%)
2016 Q2
1,259
Q2 2016 vs. Q2 2017 Average Total Subscribers
Q2 2016 vs. Q2 2017 Average Total Domestic Subscribers
Paid SubscribersFree Trial Subscribers
* Q2 2017 average total subscribers would be in an approximate range of +/- 2% from the figures shown above if the acquisition and retention of subscribers associated with WrestleMania in 2017 are consistent with the subscriber activity associated with the prior year event. As future subscriber performance may differ from prior activity, this range is provided as a benchmark rather than as guidance
− Definitions of subscriber metrics above are provided on page 12

9
WWE Free Video on Demand1
(in billions)
WWE Network’s total subscribers achieved a record of 1.95M post WrestleMania
816731700495
123
288
112
Q4Q3
1,217
1,272
1,469
Q1
49
1,511
1,327
1,327
Q4
816
70
1,697
1,574
1,4731,560
Q2
73
Q2
1,227
1,233
1,949
1,661
1,486
1,306
1,403
Q1
71
1,156
1,444
Q1Q4Q3
495
Q1
700
Q2
731
42
55
Q3
1,357
Apr. 3,
2017
2014 2017
Paid SubscribersFree Trial Subscribers
Total Subscribers (000s)
2015 2016
- Definitions of subscriber metrics above are provided on page 12

10
WWE Free Video on Demand1
(in billions)
WWE Network’s total subscribers reached 1.95M with record domestic and international levels
495700 703 772
997 983
196230
258 289
362394
384 391
440
497
Apr. 3,
2017
1,306
1,048
Q2
1,227
Q1
1,327
1,131 1,102
Q3 Q4
1,4731,469
Q1
495
Q2
1,560
1,166
1,486
Q1
1,452
1,697
1,257
1,949
700
1,107
28
Q3
731
Q3
44
Q2 Q4
1,082
Q1Q4
1,272
816
Total Domestic SubscribersTotal International Subscribers
Total Subscribers (000s) - International & Domestic
2014 20172015 2016
- Definitions of subscriber metrics above are provided on page 12

11
WWE Free Video on Demand1
(in billions)
927721723700
147
156
109
63762
41
Q3Q2
700
Q1
147
Q1
1,398
51
1,2161,458
62
Q4
1,407
71
1,600
1,490
1101,478
1,267
Q1Q3Q2
1,520
Q1
990
Q2
95
1,173
723
1,268
Q3
72
1,237
1,309
Q4
1,2891,517
1,673
Q4
Average Total Subscribers (000s)
Paid SubscribersFree Trial Subscribers
WWE Network’s average total subscribers reached 1.6M
2014 20172015 2016
- Definitions of subscriber metrics above are provided on page 12

Footnotes – Definition of Subscriber Metrics
12
1. Subscriber metrics reflect direct-to-consumer subscribers of WWE Network and subscribers reported under
licensed partner agreements, which have different economic terms for the network. The impact of these
subscribers on WWE Network financial results is reflected in the network’s average revenue per subscriber
(ARPU)
2. Total subscribers reflect all active subscribers over the relevant time period. These include WWE Network
customers who have activated a free trial of the network and those who have made payments
3. Free trial subscribers refer to WWE Network customers who received a free trial upon activating network service,
and were still within their promotion period as of the date reported. Subscribers are eligible to receive a free trial
upon their initial service activation, or upon reactivation (i.e. following a period of discontinued service) if they did
not previously receive a free trial
4. Average paid subscribers reflect the sum of the arithmetic daily mean over the relevant period for our direct-to-
consumer subscribers, and the average of the monthly reported subscribers from our license partners (such
reporting is received and recognized on an approximate 30 day lag). Average paid subscribers may differ
substantially from paid subscribers at the end of any period due to the timing of paid subscriber additions
5. Q2 2017 average total subscribers could be in an approximate range of +/- 2% from the figures shown if the
acquisition and retention of subscribers associated with WrestleMania in 2017 are consistent with the subscriber
activity associated with the prior year event. As future subscriber performance may differ from prior activity , this
range is provided as a benchmark rather than as guidance

A P P E N D I X

Reconciliation of Non-GAAP Measures
14
1. Adjusted OIBDA is defined on page 15 of this presentation. Q1 2017 and 2017 Adjusted OIBDA represent the Company’s Business Outlook for the quarter ending 03/31/17 and full year
ending 12/31/17, respectively. Source: The Company’s Business Outlook as of February 9, 2017 is per the Company’s Q4 2016 earnings release, “WWE Q4 2016 Earnings,” 2/9/17
(http://corporate.wwe.com/investors)
2. Because of the nature of the footnoted items, WWE is unable to estimate the amounts of any adjustments for these items for periods after December 31, 2016 due to its inability to forecast if
or when such items will occur. These items, which could be significant, are inherently unpredictable and may not be reliably quantified. The Company is evaluating certain items for the first
quarter 2017, which (subject to the completion at its quarterly close process) may result in reconciling adjustments as provided in the above table
Reconciliation of Adjusted OIBDA to Operating Income
2016 Q1 2017E 2017E Q1 2017E 2017E
Adjusted OIBDA (1) $80.1 $23 - $27 $100
$3-$5 below the
range of $23-$27 $100
Depreciation & Amortization (24.4) (7) (30) Unchanged at (7) (30)
Film impairments (2) - - - 0 - (2)
Unable to estimate
beyond the Q1
2017E of $0-($2)
Asset impairments (2) - - - - -
Gain (losses) on operating assets (2) - - - - -
Restructuring charges (2) - - - - -
Other operating income items (2) - - - 0 - (1)
Unable to estimate
beyond the Q1
2017E of $0-($1)
Operating Income (U.S. GAAP Basis) $55.7 Not estimable Not estimable Not estimable Not estimable
Outlook as of Feb. 9, 2017 Outlook as of Apr. 3, 2017

Notes: Non-GAAP Measures
The Company defines OIBDA as operating income before depreciation and amortization, excluding feature film and
television production amortization and related impairments. OIBDA is a non-GAAP financial measure and may be different
than similarly-titled non-GAAP financial measures used by other companies. A limitation of OIBDA is that it excludes
depreciation and amortization, which represents the periodic charge for certain fixed assets and intangible assets used in
generating revenues for the Company's business. OIBDA should not be regarded as an alternative to operating income or
net income as an indicator of operating performance, or to the statement of cash flows as a measure of liquidity, nor should
it be considered in isolation or as a substitute for financial measures prepared in accordance with GAAP. We believe that
operating income is the most directly comparable GAAP financial measure to OIBDA
Adjusted OIBDA, Adjusted Operating income, Adjusted Net income and Adjusted Earnings per share exclude certain non-
recurring material items, which otherwise would impact the comparability of results between periods. These items include,
but are not limited to, non-cash impairments of film, intangible and fixed assets, gains and losses on asset sales, as well as
material restructuring charges. The adjusted measures should not be considered as an alternative to net income, cash
flows from operations or any other indicator of WWE's performance or liquidity, determined in accordance with U.S. GAAP
The Company believes the presentation of OIBDA and Adjusted OIBDA is relevant and useful for investors because it
allows investors to view our operating performance in the same primary method used by management to evaluate
operating performance. Additionally, The Company believes they provide a meaningful representation of operating cash
flows
15