Workshop of SocioEconomic Issues - DG AGRI Structural ... · Workshop of SocioEconomic Issues - DG...
18
Workshop of SocioEconomic Issues - DG AGRI Structural profiling of bio based sectors in the EU -A SAM Analysis Alfredo Mainar Causape, George Philippidis, Ana I. Sanjuán
-
Upload
nguyenliem -
Category
Documents
-
view
230 -
download
0
Transcript of Workshop of SocioEconomic Issues - DG AGRI Structural ... · Workshop of SocioEconomic Issues - DG...

Workshop of SocioEconomic Issues - DG AGRI Structural profiling of bio based sectors in the EU -A SAM Analysis
Alfredo Mainar Causape, George Philippidis, Ana I. Sanjuán

Overview
• Introduction • Study context • Methodology - SAM Database • Methodology II - SAM Multipliers • Study Aims • Results • Conclusions
2

Introduction
• Global Economy faces socioeconomic challenges • Existing linear ‘take-make-dispose’ models of economic growth
are unsustainable • A solution? Combine the ‘old’ with the ‘new’
• Usage of renewable resources from the earth combined with state-of-the-art 21st century technologies ≈ ‘Circular Economy’
• BioEconomy –18.6 million jobs, 2.2 billion euros turnover.
• How to optimise biomass (food, feed, energy, industrial) to make a meaningful contribution to the notion of a circular economy
• Governing principle : ‘Cascading hypothesis’
3

Study Context
• Within this broad policy debate, this study focuses on the following research questions: • Can we identify structural mechanisms or linkages to
measure the wealth generating potential of bio based activities within the EU macro-economy?
• Can we identify ‘typical’ structural patterns across the Member States?
• What is the employment generation potential of each of the bio based sectors?
• Are there any standout performers amongst the bio based sectors?
• Very few quantitative economy-wide studies to tackle these
questions. • Reason? data driven
4

SAM Data
• Social Accounting Matrices (SAM)
• JRC published the EU-27 (AgroSAMs) for year 2000 (Muller et al., 2008) constructed by MS. Applied to Spain (Cardenete et al., 2012).
• Updated “AgroSAMs” for 2007 (Philippidis et al., 2014) employing Eurostat data and GDP target data. Applied to the EU27
• Current study follows these precedents. Constructs 28 EU MS SAMs for the year 2010. AgroSAM agricultural detail PLUS contemporary bio based sectors – “BioSAMs”
5
http://www.biofuelstp.eu/bioeconomy.html
SAM Multipliers
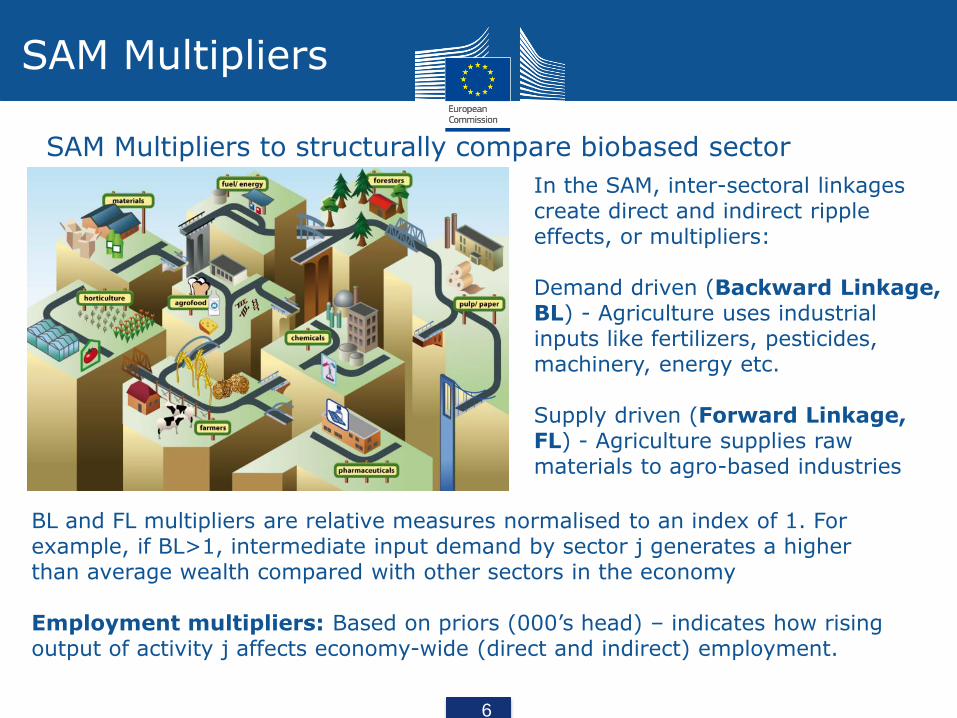
In the SAM, inter-sectoral linkages create direct and indirect ripple effects, or multipliers: Demand driven (Backward Linkage, BL) - Agriculture uses industrial inputs like fertilizers, pesticides, machinery, energy etc. Supply driven (Forward Linkage, FL) - Agriculture supplies raw materials to agro-based industries
BL and FL multipliers are relative measures normalised to an index of 1. For example, if BL>1, intermediate input demand by sector j generates a higher than average wealth compared with other sectors in the economy Employment multipliers: Based on priors (000’s head) – indicates how rising output of activity j affects economy-wide (direct and indirect) employment.
SAM Multipliers to structurally compare biobased sector
6

Study Aims
• Profiling of EU28 bio based activities based on structural classification (i.e., multipliers) analysis and statistical clustering and means comparison tests.
• Four aims:
• Identify and classify EU clusters employing BL and FL multipliers as segmentation variables.
• Statistically profile EU clusters:
• Within cluster statistical tests to examine relative BL and FL multiplier strength of bio based sectors
• Across cluster statistical tests to identify the degree of heterogeneity/homogeneity of bio based sectors
• Calculate employment generation multiplier effects emanating from the bio based sectors
• Detect strategically important bio based sectors ('key sectors').
7

8
• Each EU SAM - 32 bio based and 4 non bio based activities
• 7 cropping activities, 4 livestock activities
• 11 food processing
• 3 bioenergy
• 1G (biodiesel, bioethanol)
• 2G (thermal pathway and biochemical pathway fuel)
• bioelectricity
• 3 biomass: (forestry, energy crops and pellets)
• 3 bio-industrial accounts (textiles, wood and biochemicals)
• Fishing
• Non bio based aggregates
• NatRes, Energy, Manu, Svces
Bio based coverage

Results: Hierarchical cluster classification
9
Cluster Name Composition
Group 1 Northern and
Central
[n=10] Austria, Belgium, Denmark,
Germany, Ireland, Lithuania,
Netherlands, Slovenia, Sweden, United
Kingdom
Group 2 Isles & Lux [n=3] Cyprus, Luxembourg, Malta
Group 3 Mainly Eastern
[n=9] Bulgaria, Croatia, Czech Republic,
Finland, France, Hungary, Poland,
Romania, Slovakia
Group 4 Baltic [n=2] Estonia, Latvia
Group 5 Mediterranean [n= 4] Greece, Italy, Portugal, Spain

Statistical tests I
• Statistical (1% and 5%) one-way Anova tests across EU regional clusters to validate clustering and identify structural heterogeneity by sector (i.e., examine different levels of BL and/or FL wealth generation by sector across five EU clusters)
• Statistical heterogeneity of BLs wealth generation in 29 of the 32 biobased sectors (25 at 1% significance) across regional clusters.
• Statistical heterogeneity of FLs in 22 of the 32 (15 at 1% significance) bio based sectors across regional cluster
10
Crops (7)
Lvsk (4)
Food (11)
Fish (1)
Biomass (3)
Bioene (3)
BioInd (3)
BL 5 4 11 1 3 2 3
FL 5 2 8 0 2 2 3

Statistical tests II
• Paired t-test between BL and FL multiplier means within clusters for each of the 32 bio based activities
• Statistically (1% and 5%) significant ‘backward orientation’ (i.e., BL higher than FL)
• 23 EU MS: ‘Mainly Eastern’ (31 sectors), ‘Mediterranean’ (28 sectors), ‘Northern & Central’ (21 sectors).
• 5 EU MS:’Isles&Lux’ (3 sectors), ‘Baltics’ (4 sectors)
• Highly diversified portfolio of inputs (feeds, fertiliser, energy, veterinary services, machinery, transport) - ripple effects throughout the economy.
• Limited supply driven (FL) multipliers – supply chain less diversified (smaller ripple effects)
• Consistent with previous work (Philippidis et al., 2014)
11

Summary of typologies
12
Frequency (max =32) Mean values
CoV (%)
BL>1 BL>2 FL>1 FL>2 ‘Key’ BL FL BL FL
1. ‘Northern & Central’ 25 5 4 0 4 1.42 0.59 40 55
2. ‘Isles & Lux’ 11 1 1 0 1 0.81 0.40 64 80
3. ‘Mainly Eastern’ 29 14 9 0 9 1.88 0.81 32 51
4. ‘Baltic’ 24 9 6 1 6 1.52 0.70 62 88
5. ‘Mediterranean’ 29 20 10 0 10 2.08 0.81 28 44
• Groups 3 and 5 (4+9 EU MS): Very strong BL (@2) and notable FL (@ 0.8) multipliers. Low variation/stable wealth generation (‘strong’ bio based cluster, 1 in 3 are key sectors)
3. ‘Mainly Eastern’ 29 14 9 0 9 1.88 0.81 32 51
5. ‘Mediterranean’ 29 20 10 0 10 2.08 0.81 28 44
1. ‘Northern & Central’ 25 5 4 0 4 1.42 0.59 40 55
4. ‘Baltic’ 24 9 6 1 6 1.52 0.70 62 88
• Groups 1 and 4 (10+2 EU MS): Strong BL (@1.5) and weaker FL (especially Grp 1). More volatile (especially Baltic) wealth generation (‘moderate’ bio based cluster, 1 in 6 are key sectors)
• Group 2 (3 EU MS): Moderate BL (@0.8), weak FL (@0.4). Highly volatile wealth generation (‘weak’ bio based cluster, 1 key sector)

Key sectors
• Key sector definition: BL > 1 and FL > 1
• 30 examples of key sectors in 21 bio based sectors across the five EU clusters
• All five clusters: ‘raw milk’ (as in Philippidis et al., 2014)
• Four clusters: ‘intensive livestock’
• Three clusters: ‘cereals’, ‘animal feed’, ‘forestry’, ‘wood’ and ‘other food’
• NO key sectors in ‘new’ biobased sectors: 1G & 2G biofuels, bio-chemicals, bioelectricity, biomass from energy crops and pellets NONE are key, although bioelectricity has potential key sector status (BL > 1, [email protected]) in ‘Mainly Eastern’, ‘Baltic’ & ‘Mediterranean’ clusters (15 EU MS).
13

14
AUT
BEL
BGR
CYP
CZE
DEU
DNK
ESP
EST
FIN
FRA
GBR
GRC
HRV
HUN
IRL
ITA
LTU
LUX
LVA
MLT
NLD POL
PRT
ROM
SVK
SVN
SWE
Ranges of employment multiplier:(45,53]
(36,45](28,36](20,28](11,20][3,11]
Employment Multipliers
Aggregate bio based sector employment multipliers by MS

15
EU Clusters NonBio Bio Agric Food BioMass BioEne BioInd
Northern & Central 12 15 19 12 16 13 13
Isles+Lux 7 9 13 6 9 7 8
Mainly Eastern 23 34 46 26 33 23 25
Baltic 28 34 44 24 38 25 31
Mediterranean 15 23 28 20 23 17 18
EU28 16 23 30 18 23 17 18
Employment Multipliers
• Anova – statistical differences in mean EMs across clusters
Isles+Lux 7 9 13 6 9 3 8
Mediterranean 15 23 28 20 23 17 18
EU28 16 23 30 18 23 17 18
• Bio energy is consistently the lowest employment generator, although comparable with non bio based averages.
• Bio based vs. non bio based: former generates higher employment in all clusters.
• Primary agric. is key driver (‘Mainly Eastern’ and ‘Baltic’)
• ‘Mixed’ evidence of correlation between wealth and employment generation.
Mainly Eastern 23 34 46 26 33 23 25
Baltic 28 34 44 24 38 25 31

Conclusions I
• Caveat: Useful profiling of bio based economy within a consistent data framework – BUT 2010 structure of the economy and multipliers are short run indicators (no substitutability, no tech change)
16
• Employment generation in bio based higher (also in Philippidis et al., 2014).
• Careful: quality of labour issue not considered.
• Higher wealth: higher employment correlation: evidence mixed
• BL and FL (i.e, structural indicators) segmentation variables creates five distinct EU clusters
• Across EU clusters, BL (FL) wealth generation by sector is statistically heterogeneous in 29 (22) of 32 bio based sectors.
• Bio based wealth generation remains 'backward' orientated within each EU cluster. Consistent with Philippidis et al. (2014).
• ‘Mainly Eastern’ and ‘Mediterranean’ strong bio based activity.
• ‘Northern & Central’ and ‘Baltic’ moderate bio based activity
• ‘Isles & Lux’ weak bio based activity

17
• Key sectors ‘raw milk’ and ‘intensive livestock’ perform well (wealth and employment). Policy conflict: large non CO2 emitters
• Key Sector frequency higher than previous studies (Cardenete et al., 2012; Philippidis et al., 2014).
• Process of structural change between 2000, 2007 and 2010 possibly accelerated by the financial crisis.
• Bio based economy more resilient resulting in increased relative wealth generation (i.e., many more key sectors)
Conclusions II
• Cascading principle of a ‘last resort’ energy usage for biomass material
• Bioenergy has lower wealth and is lowest generator of employment generation in all bio based sectors.
• From an economists perspective, there is no opportunity cost of forgoing bioenergy applications for other biomass applications.
• This analysis does not enter into conflict with the cascading principle of biomass usage (based on 2010 economic structures)

18
Thank you for your attention