Working Paper No
17
15/003 THE EFFECT OF INCENTIVES ON REAL EFFORT: EVIDENCE FROM THE SLIDER TASK FELIPE AUGUSTO DE ARAUJO, ERIN CARBONE, LYNN CONELL-PRICE, MARLI W. DUNIETZ, ANIA JAROSZEWICZ, DIEGO LAM´ E, RACHEL LANDSMAN, LISE VESTERLUND, STEPHANIE WANG, AND ALISTAIR J. WILSON May 2015
-
Upload
truongkiet -
Category
Documents
-
view
220 -
download
0
Transcript of Working Paper No
15/003
THE EFFECT OF INCENTIVES ON REAL EFFORT: EVIDENCE FROM THE SLIDER TASK
FELIPE AUGUSTO DE ARAUJO, ERIN CARBONE, LYNN CONELL-PRICE, MARLI W. DUNIETZ, ANIA JAROSZEWICZ, DIEGO LAM´ E, RACHEL LANDSMAN, LISE VESTERLUND, STEPHANIE WANG,
AND ALISTAIR J. WILSON
May 2015
THE EFFECT OF INCENTIVES ON REAL EFFORT: EVIDENCE FROM THESLIDER TASK
FELIPE AUGUSTO DE ARAUJO, ERIN CARBONE, LYNN CONELL-PRICE, MARLI W. DUNIETZ,ANIA JAROSZEWICZ, DIEGO LAME, RACHEL LANDSMAN, LISE VESTERLUND, STEPHANIE WANG,
AND ALISTAIR J. WILSON
ABSTRACT. Real-effort experiments are frequently used when examining a response to incentives.For any particular real-effort task to be well-suited for such an exercise subjects’ cost for exertingeffort must result in an interior effort choice. The popular slider task in Gill and Prowse (2012)has been characterized as satisfying this requirement, and the task has been increasingly used to in-vestigate the response to changes in both monetary and non-monetary incentives. However, despiteits increasing use, a simple between-subject examination of the slider task’s response to incentiveshas not been conducted. We provide such an examination with three different piece-rate incentives:half a cent, two cents, and eight cents per slider completed. We find that participants in the threetreatments completed on average 26.1, 26.6 and 27.3 sliders per round, respectively. The one-sliderincrease in observed performance is small, not only relative to the sixteen-fold increase in the in-centives, but also relative to the observed heterogeneity across subjects, rates of learning, and evenidiosyncratic variation. Our paper cautions that the slider task will be underpowered for uncoveringa response to incentives in between-subject designs.
1. INTRODUCTION
Early economic experiments examining labor effort in the lab relied on the stated-effort design(for example: Bull et al., 1987; Schotter and Weigelt, 1992; Nalbantian and Schotter, 1997; Fehret al., 1993). Participants in the role of workers were given an endowment and asked to “pur-chase” a level of effort, which in turn benefited other participants in the role of principals. Whilestated-effort designs provided well-structured controls for participants’ costs of effort, the designswere seen as being abstract and overly distant from the types of labor effort the experiments wereintended to capture.1 Scholars have instead begun to rely on real-effort designs, where participantsare instead paid for performing an actual task in the lab.
Date: May 2015.Augusto de Araujo, Dunietz, Lame, Landsman, Vesterlund, Wang, Wilson: Department of Economics, University ofPittsburgh. Carbone: GSPIA, University of Pittsburgh. Conell-Price, Jaroszewicz: Social and Decision Sciences,Carnegie-Mellon University. This paper was written as a joint classroom project among faculty and students for agraduate course in experimental economics at the University of Pittsburgh.1For example, Charness and Kuhn (2011, p.13) state “the advantage of using real effort is that the task is more in linewith what most people consider labor, and so might be considered to be a better match to the field environment.”
1
Real-effort designs achieve less abstraction by trading off experimental control, as participants’effort costs are no longer directly tied to payoffs. This inability to manipulate the cost placesrestrictions on the types of tasks that can be used to study the response to incentives.
To make things concrete, take a simple decision-theoretic model of a real-effort task. In choosingher effort e, participant i solves the following problem:
e?i (w) = arg maxe∈[0,Ei]
w · e− ci (e) ,
where w denotes a piece-rate payment, ci (e) denotes the (differentiable) cost of effort she bringsinto the lab, and Ei represents the maximum effort level she can choose to exert (due to physi-cal/time constraints). If we are to use a real-effort task to study the response to incentives in thelaboratory, then it must be—at least for the set of incentives considered—that the cost functiongenerates an interior solution to the above maximization problem. For example, a real-effort taskthat individuals see as enjoyable will not satisfy the restriction. If it is satisfying to perform thetask, then the marginal cost is negative, 0 > c′i(e), and the same optimal effort e?(w) = Ei will bechosen for all piece rates where w ≥ 0. Any subject who enjoys anagrams, math problems, sudokupuzzles, and/or throwing a ball into a basket will exert maximum effort on these tasks independentof the offered piece rate. That is, their performance will not respond to incentives.
The experimental community has been quick to develop creative real-effort tasks. In consideringeasily implementable tasks that are short enough to be run repeatedly, the “slider task” has stood outas being sensitive to incentives. Gill and Prowse (2012, hereafter abbreviated to G&P) introducethe slider task in a study on disappointment aversion. Participants are shown a screen with 48sliders, where each slider has a range of positions from 0 to 100. Each slider is solved by usingthe computer’s mouse to move the slider’s marker (initially placed at 0) to the midpoint of 50.Participants are given two minutes to solve as many sliders as possible, with the participant’schosen effort given by the number of sliders correctly positioned at 50 by the end of the twominutes. The task is normally repeated T times—in many experiments T = 10—and cumulativeearnings across the entire experiment are given by
∑Tt=1wt · e?i (wt).
Evidence on sensitivity to the incentives—in particular, that the slope of e?i (wt), assessed througha within-subject design, is positive—has led to the slider task being used more and more frequentlyin papers measuring the incentive effects associated with various mechanisms and work environ-ments. However, in contrast to the sensitivity to monetary incentives uncovered in the initial studyby G&P, more recent slider-task studies (in particular, those using between-subject designs) havefound more modest or non-existent treatment effects. Our paper’s main result, obtained from asimple between-subject experimental design, suggests these recent papers might not be viewed astrue null results, but stemming instead from performance in the slider task not being particularlysensitive to changes in the offered incentives.
2
Where other studies have varied more complex elements of the payoff environment—strategicelements within a game, the nature of feedback, the frame, etc.—ours will be a very simplebetween-subject design, focused only on assessing whether the slider task responds to monetaryincentives.2 Following G&P’s implementation of the slider task as much as possible, we conductthree treatments where we vary the piece-rate payment w that participants receive for each cor-rectly positioned slider—a half cent at the low end, an intermediate two cent treatment, and eightcents at the high end. This sixteen-fold increase in the piece rate corresponds to dramatic differ-ences in participants’ potential earnings, with maximum possible performance payments of $2.40,$9.60 and $38.40, respectively. However, despite substantial differences in the incentives offered,we uncover fairly limited differences in average effort exerted: in order of increasing piece rates,we find that subjects complete 26.1, 26.6, and 27.3 sliders per two-minute round. This one-sliderincrease in performance is limited, not only relative to the order-of-magnitude increase in the in-centives, but also relative to the levels of individual heterogeneity in ability in the task and rate oflearning documented in our data.3
As a real-effort task, the slider task has many attractive characteristics. However, our paperindicates that the task is not well-suited for uncovering responses to incentives in between-subjectdesigns.
2. LITERATURE REVIEW
Real effort has been used as a way of securing participants an earned endowment (Erkal et al.,2011), as a way of controlling for the individual’s ability (Niederle and Vesterlund, 2007), and asa way of examining the response to incentives (G&P). For the latter purpose, the concern in usingreal effort is that the cost of exerting effort is unknown, and so it may be more difficult to gaugethe response to incentives. Indeed, such a response can only be uncovered if the marginal cost ofeffort is positive and sensitive to the level of effort exerted.
While numerous real-effort tasks have been conducted in the laboratory, the ‘slider task’ (G&P)has stood out as being a task with particularly desirable characteristics.4 Gill and Prowse (2015)note that the slider task is easy to implement, does not require pre-existing knowledge, is identicalacross repetitions, involves little randomness, leaves no scope for guessing, provides a finely gra-dated measure of effort within a short time scale, allows for repeated effort and thus controls forunobserved heterogeneity, and finally that the effort exerted responds to incentives. Highlighting2Our emphasis is solely on extrinsic motivation. See Gneezy et al. (2011) for a careful account of the potentialinteraction between intrinsic and extrinsic motivations.3Individual-level heterogeneity can be thought of here as the expected variation with respect to the subject i for themaximal effort Eit, while learning effects can be thought of as within-subject shifts in this variable across time t.4Examples of other real-effort tasks range from simple mental tasks such as solving anagrams (Charness and Villeval,2009), arithmetic problems (Niederle and Vesterlund, 2007), mazes (Gneezy et al., 2003), or optimization problems(Dickinson and Villeval, 2008) to rote physical tasks such as pressing keys on a keyboard (Swenson, 1988), stuffingenvelopes (Carpenter et al., 2010), or squeezing a hand dynamometer (Imas, 2014).
3
that the repeated performance measures make it possible to estimate the individual implicit cost ofeffort, Gill and Prowse (2015, p.4) argue that the task overcomes “the principal drawback of usingreal effort up to now.”
The popularity of the slider task has indeed been impressive. Despite its recent development, thetask has to date been used in more than 40 completed studies. The preeminent feature of the taskis that performance within it is thought to be responsive to incentives, thus making it well-suitedfor studies that aim to examine how effort responds to changes in institutions and mechanisms,and to modifications that might influence the participant’s intrinsic or non-monetary incentives.Surprisingly, the response to treatment has been limited in a number of these studies.
One explanation for the absence of a treatment effect is of course that the effective incentives donot change substantially with the treatments considered by these papers. Another more concerningexplanation is that the slider task is not well suited for detecting a response to such changes inincentive. In particular it is of concern if the slider task is relatively insensitive to incentives.
In reviewing the many papers examining effort in the slider task, we noticed that significantresponses to changes in the incentives offered arise more often in within-subject designs, whereparticipants are aware of the differing incentives being offered. In particular, the original G&Pstudy is within-subject, where subjects have full knowledge of the range of potential incentivesand can judge each realization of the incentives relative to the reference range chosen by the exper-imenter. Similarly, in Besley and Ghatak (2013) subjects are told whether they will receive a highor low piece rate at the beginning of each round, with a clear reference to how the offered incen-tive relates to the other possibility. Bradler et al. (2015) introduce additional reward mechanismssuch as a tournament in the second round after a first round with just a piece-rate payment, andsubjects revert back to the piece rate in the third round. Subjects in the second round know thattheir incentives are higher than in the first round, and in the third round they know that incentiveshave returned to the lower level. Thus, subjects may feel compelled to respond to the treatment andthe control differentially, thinking that the experimenter expects different behavior for the differentincentives.
Furthermore, much of the evidence that the slider task responds to incentives have come fromstudies with strategic externalities, where the subject’s choice of effort affects the payoffs of others.That is monetary incentives along with other-regarding preferences and strategic concerns mightjointly influence choices. In several studies the incentive scheme varies between a piece rate anda tournament where factors like competitiveness must be considered (Besley and Ghatak, 2013;Bradler et al., 2015). In others the treatment manipulates non-monetary incentives that couldaffect the behavior of subjects with other-regarding preferences (Hammermann et al., 2012; Feesset al., 2014), or with concerns for social image (Georganas et al., 2014).5 Studies on the effect of
5A number of studies have used the slider task as a way for subjects to work for their endowment because of some ofits aforementioned positive qualities (for example: Brown et al., 2013; Evdokimov and Rahman, 2014; Kesternich et
4
various tax institutions and tax rates also require that the subjects make a nuanced mapping betweenpolicy and direct monetary incentive differences (Abeler and Jager, forthcoming; Doerrenberg andDuncan, 2014; Doerrenberg et al., 2015).
A number of studies vary the incentive mechanism or institution between subjects, and for themost part they find null results. Buser and Dreber (2014) find that subjects do not complete asignificantly different number of sliders, regardless of whether they are paid by a piece rate, asingle reward from a tournament, or via lottery. Georganas et al. (2014) find that there is only asignificant effect from being observed by others on the number of sliders solved in the first tworounds but not over all rounds. Ibanez and Schaffland (2013) find a treatment effect, and show thatrandomly selected leaders brought from outside the group complete fewer sliders than randomlyselected in-group leaders (leaders only have social incentives, as their effort only increases thepayoff for the other group members). However, when leaders are chosen for being skilled in theslider task, they find no significant treatment difference between in- and out-group leaders. Theyremark (p.13) “This could indicate that skilled participants have an internal motivation to work onthe task (i.e., they enjoyed it more than others, or wanted to increase performance) so their behaviorwas not affected by the treatment.” Imas et al. (forthcoming) also find an effect, with more sliderscompleted when subjects are presented with a loss frame versus a gain frame, though there are nomonetary incentives to perform in their experiment. Dolan et al. (2012) find that neither varyingthe size of the subjects’ initial endowment nor varying whether subsequent payoffs are framed asgains/losses has any effect on the number of sliders completed.
In a few slider-task studies the results indicate a response to incentives, but only for a sub-population or a subset of rounds. For sub-populations, Feess et al. (2014) find that only malesubjects solve different numbers of sliders under different incentive schemes. Georganas et al.(2014) only find a significant effect from social observation in the first two rounds, while Friedl etal. (2014) only find a significant effect of a piece-rate payment versus a flat-rate one in the last fiverounds, after subjects have been exposed to both payment schemes. For studying the response toincentives in the laboratory experimenters ideally want a task that produces an incentive effect formost subjects and for all rounds of the experiment. Such a task would not only reduce the numberof subjects the study needs to have sufficient power, but also reduce concerns that the populationcompositions are comparable across treatments.
Table 1 summarizes studies that have used the slider task to examine the response to incentives.We categorize these studies: by the type of design (within or between subject); by the type ofincentives (monetary or not); and by significance of the response to treatment. For the sevenbetween-subject studies, only two find a significant effect over the effort exerted, and the remainingfive can be broadly categorized as null results. In contrast for the eleven within-subject studies,
al., 2014; Khadjavi, 2014). Other studies have used the slider task to generate a performance measure (for example,Lindner, 2014).
5
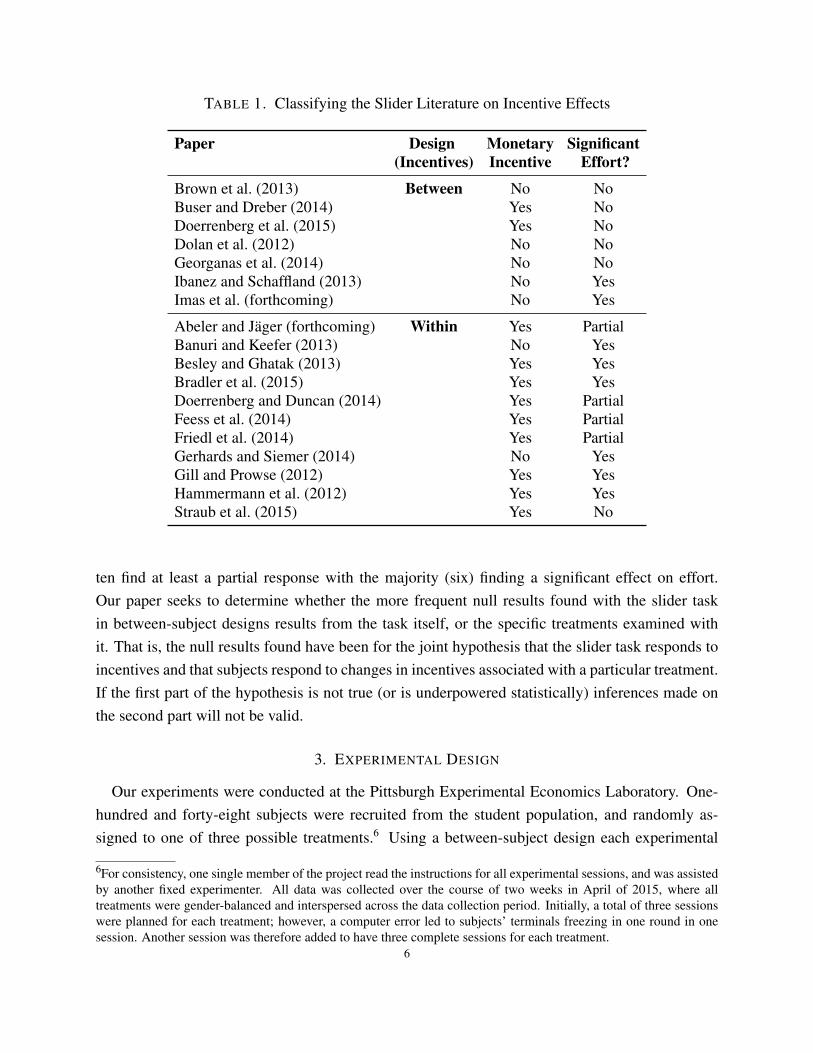
TABLE 1. Classifying the Slider Literature on Incentive Effects
Paper Design Monetary Significant(Incentives) Incentive Effort?
Brown et al. (2013) Between No NoBuser and Dreber (2014) Yes NoDoerrenberg et al. (2015) Yes NoDolan et al. (2012) No NoGeorganas et al. (2014) No NoIbanez and Schaffland (2013) No YesImas et al. (forthcoming) No Yes
Abeler and Jager (forthcoming) Within Yes PartialBanuri and Keefer (2013) No YesBesley and Ghatak (2013) Yes YesBradler et al. (2015) Yes YesDoerrenberg and Duncan (2014) Yes PartialFeess et al. (2014) Yes PartialFriedl et al. (2014) Yes PartialGerhards and Siemer (2014) No YesGill and Prowse (2012) Yes YesHammermann et al. (2012) Yes YesStraub et al. (2015) Yes No
ten find at least a partial response with the majority (six) finding a significant effect on effort.Our paper seeks to determine whether the more frequent null results found with the slider taskin between-subject designs results from the task itself, or the specific treatments examined withit. That is, the null results found have been for the joint hypothesis that the slider task responds toincentives and that subjects respond to changes in incentives associated with a particular treatment.If the first part of the hypothesis is not true (or is underpowered statistically) inferences made onthe second part will not be valid.
3. EXPERIMENTAL DESIGN
Our experiments were conducted at the Pittsburgh Experimental Economics Laboratory. One-hundred and forty-eight subjects were recruited from the student population, and randomly as-signed to one of three possible treatments.6 Using a between-subject design each experimental
6For consistency, one single member of the project read the instructions for all experimental sessions, and was assistedby another fixed experimenter. All data was collected over the course of two weeks in April of 2015, where alltreatments were gender-balanced and interspersed across the data collection period. Initially, a total of three sessionswere planned for each treatment; however, a computer error led to subjects’ terminals freezing in one round in onesession. Another session was therefore added to have three complete sessions for each treatment.
6
session held constant a piece-rate payment, so that each subject i receives a fixed payment perslider of wi ∈ {0.5g, 2.0g, 8.0g}.7 After instructions on the nature of the task each session beganwith a two-minute practice round for subjects to become familiar with the slider task. This wasfollowed by 10 paying rounds, each of which lasted two minutes. In each round subjects see asingle screen displaying 48 sliders of equal length and offset from one another, as per G&P.8 At theend of each round there was a 10-second break during which subjects were reminded of how manyrounds they had completed, the number of sliders completed (Effortit), and their correspondingearnings from that round (wi · Effortit).
Once the ten paying rounds had concluded, subjects were asked to complete a survey.9 Only aftercompleting the survey were respondents informed of their total earnings for the session. Subjectswere then privately paid, receiving a $10 participation payment on top of their earnings across theten rounds Wi =
∑10t=1(wi · Effortit).10
In order to measure the extent to which the slider task responds to incentives, our paper’s designadheres closely to that employed in G&P. There are four main differences: i) The G&P design iswithin subject, where ours is between subject. ii) G&P examine a game between two randomlymatched subjects over a variable prize; ours examines a decision problem, removing any external-ities over payment. iii) The marginal incentives in G&P work through a probability of winninga prize, where each additional slider completed leads to a one percent increase in the probabilityof winning a prize; in our experiment the marginal incentives work through a fixed piece rate perslider completed. iv) In G&P peer effects may be present, as subjects observe the other player’seffort at the end of each round; in our study there is no feedback on others’ effort levels.
4. RESULTS
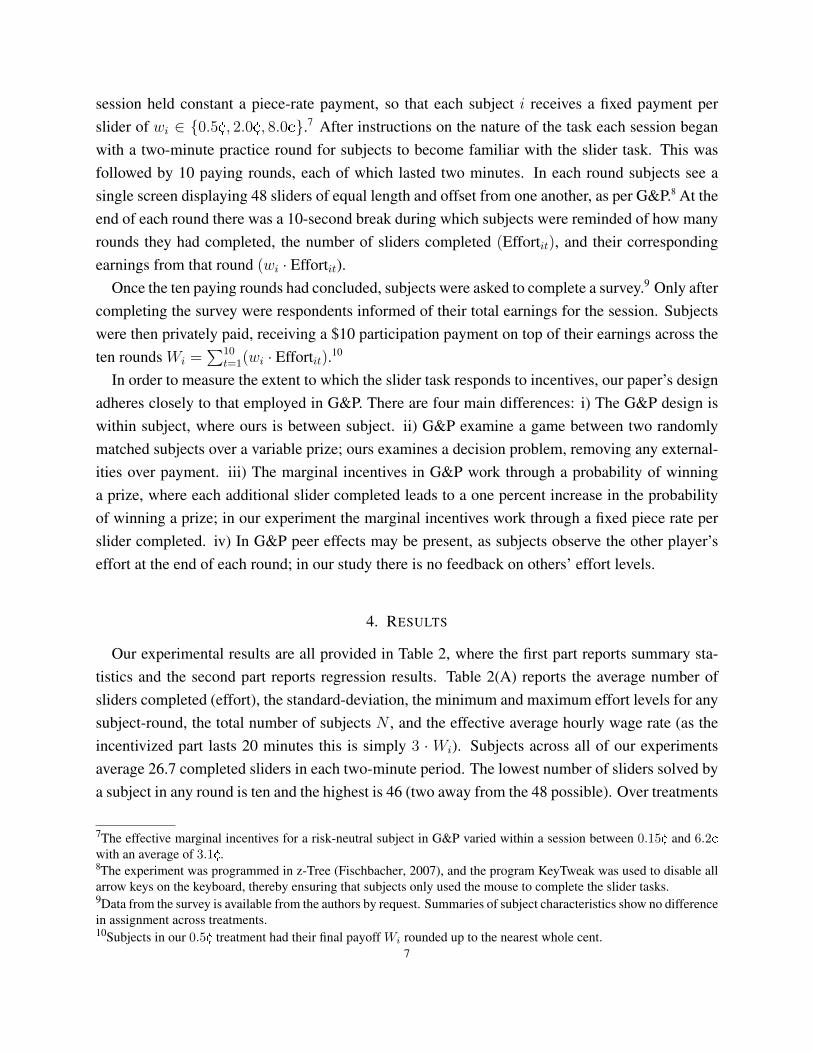
Our experimental results are all provided in Table 2, where the first part reports summary sta-tistics and the second part reports regression results. Table 2(A) reports the average number ofsliders completed (effort), the standard-deviation, the minimum and maximum effort levels for anysubject-round, the total number of subjects N , and the effective average hourly wage rate (as theincentivized part lasts 20 minutes this is simply 3 · Wi). Subjects across all of our experimentsaverage 26.7 completed sliders in each two-minute period. The lowest number of sliders solved bya subject in any round is ten and the highest is 46 (two away from the 48 possible). Over treatments
7The effective marginal incentives for a risk-neutral subject in G&P varied within a session between 0.15g and 6.2gwith an average of 3.1g.8The experiment was programmed in z-Tree (Fischbacher, 2007), and the program KeyTweak was used to disable allarrow keys on the keyboard, thereby ensuring that subjects only used the mouse to complete the slider tasks.9Data from the survey is available from the authors by request. Summaries of subject characteristics show no differencein assignment across treatments.10Subjects in our 0.5g treatment had their final payoff Wi rounded up to the nearest whole cent.
7

0.5¢
2¢
8¢
1 5 1022
24
26
28
30
Period
AverageSlidersSolved
FIGURE 1. Effort across rounds
we see that effort increases with the piece rate: the average effort is 26.1 for the lowest incentive of0.5g, somewhat higher at 26.6 in the middle incentive, and at its highest of 27.4 in the 8g incentive.
Just from the averages in Table 2(A) it is apparent that the size of the incentive effect we observein our data is small: going from a piece-rate of 0.5g to 2g leads to a half-slider increase, and from2g to 8g yields a 0.7-slider increase. Though the range of our incentives represents a substantialincrease—from an effective hourly rate of about half the US Federal minimum to just over $65 anhour11—the average additional effort from this sixteen-fold increase in the incentive is just a singleadditional slider.
We observe substantial learning across treatments and sessions. Figure 1 presents the roundaverages for each of three treatments (where we have additionally provided bars indicating 95percent confidence intervals, given subject variation). In round one the average effort is 24.2 inboth the 0.5g and 2g treatments, and 24.9 in the 8g treatment, though the variation across subjectsis large. Across sessions the effort mostly increases, and the final effort levels in round ten are 28.6in the 0.5g treatments and 28.9 in both the 2g and 8g treatments. While the effort exerted in eachtreatment appears ordered according to incentives, it is noteworthy that the incentive order is onlyfully observed in six of the ten rounds.
11By way of comparison, the average lawyer makes an hourly wage of $64.17 according to the Bureau of LaborStatistics, while the average financial manager makes $62.61.
8
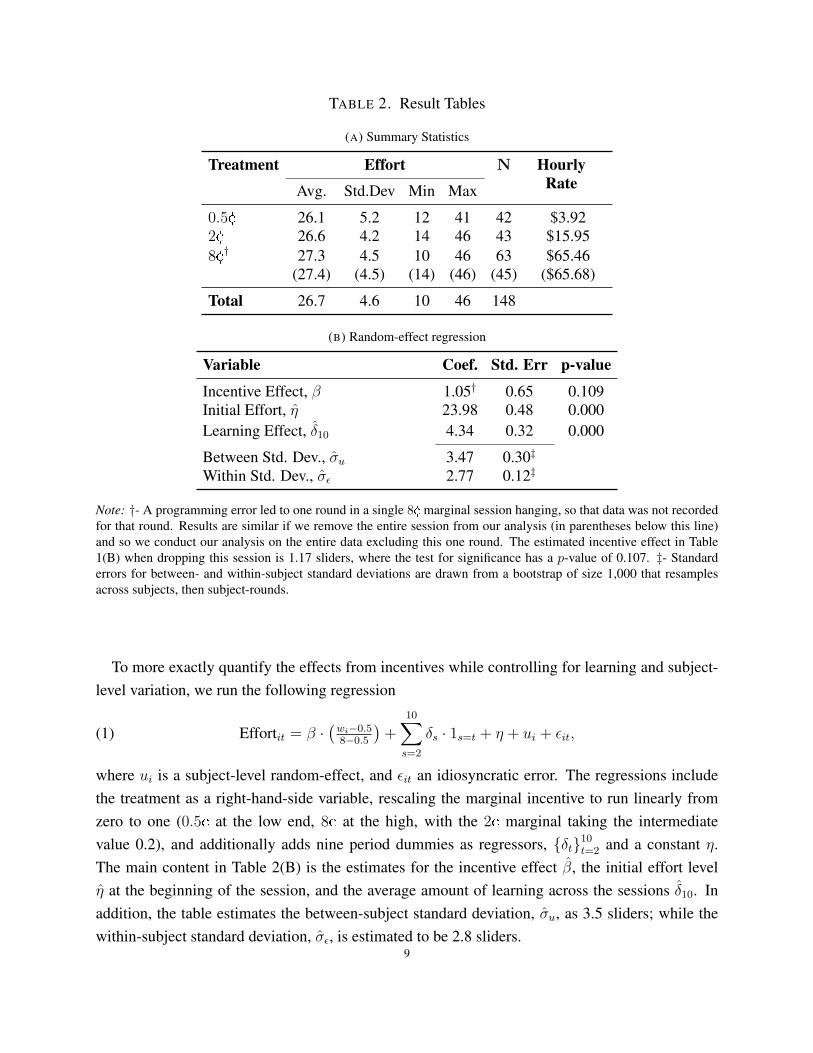
TABLE 2. Result Tables
(A) Summary Statistics
Treatment Effort N HourlyRateAvg. Std.Dev Min Max
0.5g 26.1 5.2 12 41 42 $3.922g 26.6 4.2 14 46 43 $15.958g† 27.3 4.5 10 46 63 $65.46
(27.4) (4.5) (14) (46) (45) ($65.68)
Total 26.7 4.6 10 46 148
(B) Random-effect regression
Variable Coef. Std. Err p-value
Incentive Effect, β 1.05† 0.65 0.109Initial Effort, η 23.98 0.48 0.000Learning Effect, δ10 4.34 0.32 0.000
Between Std. Dev., σu 3.47 0.30‡
Within Std. Dev., σε 2.77 0.12‡
Note: †- A programming error led to one round in a single 8g marginal session hanging, so that data was not recordedfor that round. Results are similar if we remove the entire session from our analysis (in parentheses below this line)and so we conduct our analysis on the entire data excluding this one round. The estimated incentive effect in Table1(B) when dropping this session is 1.17 sliders, where the test for significance has a p-value of 0.107. ‡- Standarderrors for between- and within-subject standard deviations are drawn from a bootstrap of size 1,000 that resamplesacross subjects, then subject-rounds.
To more exactly quantify the effects from incentives while controlling for learning and subject-level variation, we run the following regression
(1) Effortit = β ·(wi−0.58−0.5
)+
10∑s=2
δs · 1s=t + η + ui + εit,
where ui is a subject-level random-effect, and εit an idiosyncratic error. The regressions includethe treatment as a right-hand-side variable, rescaling the marginal incentive to run linearly fromzero to one (0.5g at the low end, 8g at the high, with the 2g marginal taking the intermediatevalue 0.2), and additionally adds nine period dummies as regressors, {δt}10t=2 and a constant η.The main content in Table 2(B) is the estimates for the incentive effect β, the initial effort levelη at the beginning of the session, and the average amount of learning across the sessions δ10. Inaddition, the table estimates the between-subject standard deviation, σu, as 3.5 sliders; while thewithin-subject standard deviation, σε, is estimated to be 2.8 sliders.
9
0 5 10 15 20 25 30 35 40 450
0.05
0.1
0.15
Average Sliders Solved
0.5¢
2¢
8¢
.5
2
8
FIGURE 2. Average Subject EffortNote: Each pdf recovered from a kernel regression with a triangular kernel (bandwidth of 2 sliders).
Unsurprisingly, given the overall averages in Table 2(A), the estimated incentive effect is close toone slider. Once we have controlled for variation between and within subjects, as well as the across-session learning, the response to incentives is only marginally significant.12 Despite a sixteen-foldincrease in the piece-rate the observed increase in effort is small relative to other variations for thetask. In terms of heterogeneity in natural ability, a one-slider increase represents under a third ofthe between-subject standard deviation. In terms of idiosyncratic variation, this increase representsslightly over one-third of the within-subject standard deviation. Across the entire session subjectsseem to learn to complete more than four additional sliders, relative to their effort in round one.The observed incentive effect therefore represents less than a quarter of the average learning effect.
To get a better sense for the subject-level heterogeneity in the data, Figure 2 provides a plot ofthe subject-level averages, expressed as a pdf. The figure is displayed using a kernel-regression(using a triangular kernel of bandwidth 2) to make comparison of the distributions easier to see.A comparison of the gray dotted line and the gray solid line represent a four-fold increase inthe incentives (0.5g to 2g, respectively), while comparing the solid gray and solid black linesrepresents another four-fold increase (from 2g to 8g). The median subject in each distributionis indicated with a small circle on the relevant pdf, where we have additionally indicated the 95percent confidence interval for the median (calculated through resampling). Continuing to look at12Interestingly, even our participants appear to be aware that their performance is not motivated by the payment theyreceived. On a survey at the end of the experiment, we find that three-quarters of the participants do not think thatthere is any lower piece-rate payment at which they would decrease their performance.
10
the median, a one-sided Mann-Whitney test fails to reject equality of medians when comparing the0.5g and 2g treatments (p = 0.239), and when comparing the 2g and 8g treatments (p = 0.101).13
However, we do reject in favor of greater effort when comparing medians of the 0.5g and 8g
treatments(p = 0.024); thus, using non-parametric tests the response to incentives is significant.14
Nonetheless, the magnitude of the effect over the median subject is economically small (1.6 sliders,a six percent increase) while the change in incentives is large (1,500 percent, an order of magnitudelarger).
5. DISCUSSION
Our between-subject design finds only a small effect of a single slider in response to a largeincrease in the incentives. We now examine how this result compares to that of G&P.
In G&P, two players i (a first mover) and j (a second mover) are randomly matched and competeto win a common prize of size 100 ·wit cents, drawn randomly from an interval. The probability ofplayer i winning the prize is given by 1
100(50 + Effortit − Effortjt), so for a risk-neutral participant
the expected marginal incentive is wit.15 The sequencing of the game is such that the first mover’seffort (Effortit) is observed by the second mover j, and the second mover’s response is the mainfocus in G&P. In looking at the response to incentives we follow Gill and Prowse (2015) and lookonly at the first movers.
As noted earlier the first mover’s task in G&P is different from that in our study: i) the session haswithin-subject variation over the incentive wit; ii) the tournament structure has own effort inflictinga negative externality on the other player; iii) payment is incentivized only probabilistically; andiv) there is feedback on other participants’ effort levels. Despite these differences it is still ofinterest to compare the magnitudes of the incentive effect in the two studies.
Paralleling the regression results in Table 2(B), Table 3(A) provides a random-effects regressionper the estimation equation (1) for the N = 60 G&P first-movers.16 The estimated incentive effectβ reflects the G&P prediction for the size of the effect in our experiment: a 3.27 sliders differenceas the marginal incentive is raised from 0.5g to 8g. While our incentive estimate β from Table 2(B)is only marginally significant when compared to zero, it is significantly different from the G&Pestimate β (p = 0.000).
13Looking at the median subject’s response is partly motivated by the fact that there is very little difference in theright-tails of the three distributions. The top quarter of subjects in each treatment are fairly consistently spread acrossaverages between 30 and 40 sliders.14Of the three pairwise comparisons only the 0.5g and 8g distributions are significantly different from one anotherusing a Kolmogorov-Smirnoff test for equality of distribution (p = 0.004).15The raw prizes in G&P are drawn uniformly over {£0.10, £0.20, . . . , £3.90} . We transform these to expected mar-ginal incentives for a risk-neutral agent, and then convert to US cents at a conversion rate of £0.65 = 100g.16To distinguish between estimates on our data and G&P’s we will use the notation β, η, etc., for estimates from ourdata, and β, η, etc., for estimates from the G&P data.
11
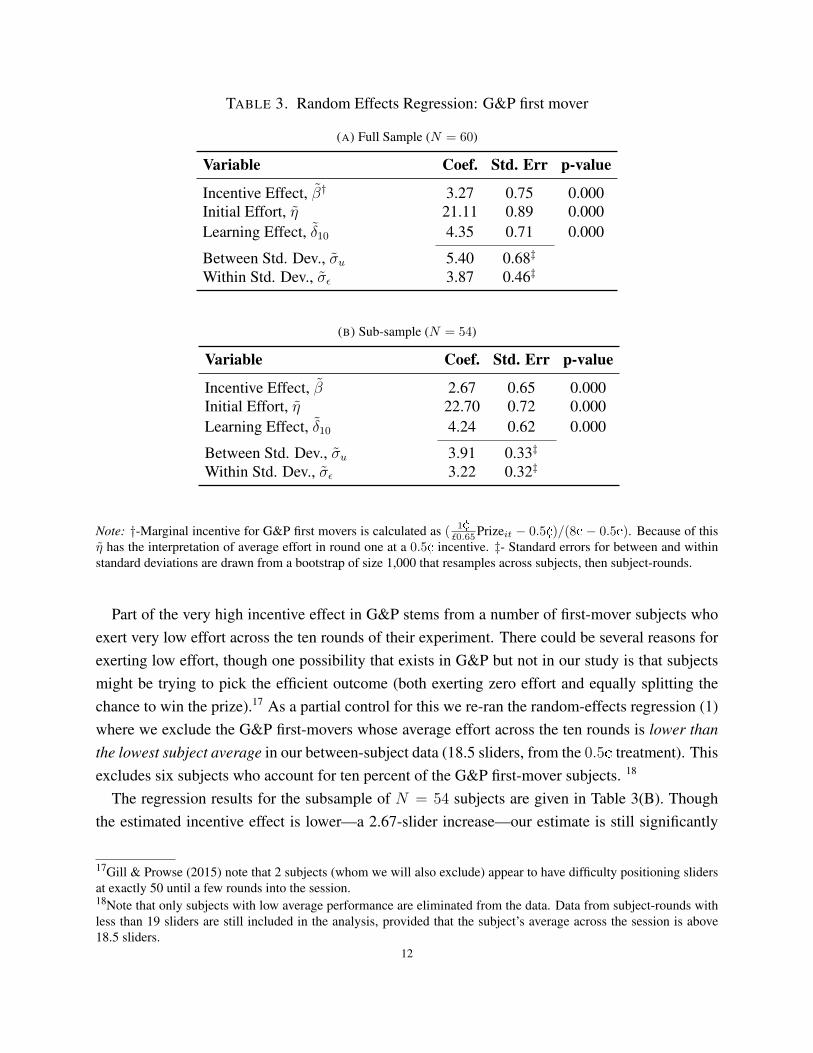
TABLE 3. Random Effects Regression: G&P first mover
(A) Full Sample (N = 60)
Variable Coef. Std. Err p-value
Incentive Effect, β† 3.27 0.75 0.000Initial Effort, η 21.11 0.89 0.000Learning Effect, δ10 4.35 0.71 0.000
Between Std. Dev., σu 5.40 0.68‡
Within Std. Dev., σε 3.87 0.46‡
(B) Sub-sample (N = 54)
Variable Coef. Std. Err p-value
Incentive Effect, β 2.67 0.65 0.000Initial Effort, η 22.70 0.72 0.000Learning Effect, δ10 4.24 0.62 0.000
Between Std. Dev., σu 3.91 0.33‡
Within Std. Dev., σε 3.22 0.32‡
Note: †-Marginal incentive for G&P first movers is calculated as ( 1g£0.65Prizeit − 0.5g)/(8g − 0.5g). Because of this
η has the interpretation of average effort in round one at a 0.5g incentive. ‡- Standard errors for between and withinstandard deviations are drawn from a bootstrap of size 1,000 that resamples across subjects, then subject-rounds.
Part of the very high incentive effect in G&P stems from a number of first-mover subjects whoexert very low effort across the ten rounds of their experiment. There could be several reasons forexerting low effort, though one possibility that exists in G&P but not in our study is that subjectsmight be trying to pick the efficient outcome (both exerting zero effort and equally splitting thechance to win the prize).17 As a partial control for this we re-ran the random-effects regression (1)where we exclude the G&P first-movers whose average effort across the ten rounds is lower thanthe lowest subject average in our between-subject data (18.5 sliders, from the 0.5g treatment). Thisexcludes six subjects who account for ten percent of the G&P first-mover subjects. 18
The regression results for the subsample of N = 54 subjects are given in Table 3(B). Thoughthe estimated incentive effect is lower—a 2.67-slider increase—our estimate is still significantly
17Gill & Prowse (2015) note that 2 subjects (whom we will also exclude) appear to have difficulty positioning slidersat exactly 50 until a few rounds into the session.18Note that only subjects with low average performance are eliminated from the data. Data from subject-rounds withless than 19 sliders are still included in the analysis, provided that the subject’s average across the session is above18.5 sliders.
12
different (p = 0.012). Despite these large differences in the estimated incentive effects, the otherregression coefficients are remarkably similar.
Looking at the Table 3(B)’s results (where we remove subjects in the left tail of the distribution),and comparing them to our results in Table 2(B), we find many commonalities. First, subjects onaverage get better across the sessions by approximately four sliders (δ10 and δ10 are not significantlydifferent).19 Second, though the initial effort level estimates of η are significantly higher in oursessions at 24 sliders in comparison to 22.7 in G&P, the size of the difference is quantitativelysmall.20 Third, between- and within-subject standard deviations for effort after controlling for theincentive effects (σu and σε, respectively) are very similar, though in both cases the estimatedvariation in our experiments is smaller than in G&P. The large estimated variation in Table 3(A) ismostly driven by the six subjects with unusually low average efforts.
Comparing our results to those of G&P it is hard not to attribute the majority of the observedincentive effect to some combination of a within-subject effect (potentially a demand effect, poten-tially peer effects) and a strategic or social effect (with the negative externality potentially pushingsubjects to exert low effort).
6. CONCLUSION
Using a between-subject design we examine how performance on the slider task responds tochanges in monetary incentives. Despite a sixteen-fold increase in incentives we find only a modestincrease in effort—less than four percent for the average subject.
While our results point to the standard version of the slider task being poorly suited for the exam-ination of response to incentives in between-subject designs, two recent studies point to techniquesthat can help regain control of the effort cost. Gachter et al. (2015) introduce a ball-catching taskwhere the cost of effort is directly manipulated and they find in a within-subject design that thereis a strong response to incentives when effort is costly. Similarly Eckartz (2014) finds that with apaid outside option, performance changes when presented with a flat-rate rather than a piece-rateincentive. While these types of modifications may be seen as more abstract, bringing the real-effortdesigns back toward those with stated-effort, for short and repeated tasks such modifications maybe needed to secure a more powerful response to incentives. Certainly, as the slider task stands,the limited sensitivity to incentives renders it poorly suited for studying responses to changes inmonetary or non-monetary incentives.
19All three of our treatments, as well as both movers in G&P show fairly consistent increases in average efforts acrossthe session.20A joint regression across both sets of data indicates no significant difference over the two constants (p = 0.123).
13
REFERENCES
Abeler, Johannes and Simon Jager, “Complex Tax Incentives,” American Economic Journal:Economic Policy, forthcoming.
Banuri, Sheheryar and Philip Keefer, “Intrinsic motivation, effort and the call to public service,”2013. World Bank Policy Research Working Paper 6729.
Besley, Timothy and Maitreesh Ghatak, “Profit with purpose? a theory of social enterprise withexperimental evidence,” 2013. Economic Organisation and Public Policy Discussion Papers,EOPP 047.
Bradler, Christiane, Susanne Neckermann, and Arne Jonas Warnke, “Rewards and perfor-mance: A comparison across a creative and a routine task,” 2015.
Brown, Alexander L, Jonathan Meer, and J Forrest Williams, “Why do people volunteer? Anexperimental analysis of preferences for time donations,” 2013. NBER Working Paper w19066.
Bull, Clive, Andrew Schotter, and Keith Weigelt, “Tournaments and piece rates: An experimen-tal study,” Journal of Political Economy, 1987, pp. 1–33.
Buser, Thomas and Anna Dreber, “The Flipside of Comparative Payment Schemes,” 2014. Tin-bergen Institute Discussion Paper 13-190/I.
Carpenter, Jeffrey, Peter Hans Matthews, and John Schirm, “Tournaments and Office Politics:Evidence from a Real Effort Experiment,” American Economic Review, 2010, 100 (1), 504–17.
Charness, Gary and Marie-Claire Villeval, “Cooperation and Competition in IntergenerationalExperiments in the Field and the Laboratory,” American Economic Review, 2009, 99 (3), 956–978.
and Peter Kuhn, “Lab labor: What can labor economists learn from the lab?,” Handbookof Labor Economics, 2011, 4, 229–330.
Dickinson, David and Marie-Claire Villeval, “Does monitoring decrease work effort?: The com-plementarity between agency and crowding-out theories,” Games and Economic behavior, 2008,63 (1), 56–76.
Doerrenberg, Philipp and Denvil Duncan, “Experimental evidence on the relationship betweentax evasion opportunities and labor supply,” European Economic Review, 2014, 68, 48–70.
, , and Christopher Zeppenfeld, “Circumstantial risk: Impact of future tax eva-sion and labor supply opportunities on risk exposure,” Journal of Economic Behavior & Orga-nization, 2015, 109, 85–100.
Dolan, Paul, Robert Metcalfe, and Daniel Navarro-Martinez, “Financial incentives and work-ing in the education sector,” 2012. Department for Education Research Report DFE–RR251.
Eckartz, Katharina, “Task enjoyment and opportunity costs in the lab: The effect of financialincentives on performance in real effort tasks,” 2014. Jena Economic Research Papers 2014-005.
14
Erkal, Nisvan, Lata Gangadharan, and Nikos Nikiforakis, “Relative earnings and giving in areal-effort experiment,” American Economic Review, 2011, pp. 3330–3348.
Evdokimov, Piotr and David Rahman, “Personality and Bargaining Power,” 2014.Feess, Eberhard, Oliver Lorz, and Markus Schramm, “Under-Delegation in Case of Pure Moral
Hazard: Evidence from the Laboratory,” 2014.Fehr, Ernst, Georg Kirchsteiger, and Arno Riedl, “Does fairness prevent market clearing? An
experimental investigation,” Quarterly Journal of Economics, 1993, pp. 437–459.Fischbacher, Urs, “z-Tree: Zurich toolbox for ready-made economic experiments,” Experimental
economics, 2007, 10 (2), 171–178.Friedl, Andreas, Levent Neyse, and Ulrich Schmidt, “Payment Scheme Changes and Effort
Provision: The Effect of Digit Ratio,” 2014. MPRA Paper 59549.Gachter, Simon, Lingbo Huang, and Martin Sefton, “Combining “Real Effort” with Induced
Effort Costs: The Ball-Catching Task,” May 2015. IZA Discussion Paper 9041.Georganas, Sotiris, Mirco Tonin, and Michael Vlassopoulos, “Peer Pressure and Productivity:
The Role of Observing and Being Observed,” 2014. CESifo Working Paper Series 4572.Gerhards, Leonie and Neele Siemer, “Private versus Public Feedback-The Incentive Effects of
Symbolic Awards,” 2014.Gill, David and Victoria Prowse, “A structural analysis of disappointment aversion in a real effort
competition,” American Economic Review, 2012, 102 (1), 469–503.and , “A novel computerized real effort task based on sliders,” 2015.
Gneezy, Uri, Muriel Niederle, Aldo Rustichini et al., “Performance in competitive environ-ments: Gender differences,” Quarterly Journal of Economics, 2003, 118 (3), 1049–1074.
, Stephan Meier, and Pedro Rey-Biel, “When and Why Incentives (Don’t) Work to Mod-ify Behavior,” Journal of Economic Perspectives, 2011, 25 (4), pp. 191–209.
Hammermann, Andrea, Alwine Mohnen, and Petra Nieken, “Whom to choose as a team mate?A lab experiment about in-group favouritism,” 2012. IZA Discussion Paper 6286.
Ibanez, Marcela and Elke Schaffland, “The Effect of Outside Leaders on the Performance of theOrganization: An Experiment,” 2013. Courant Research Centre: Poverty, Equity and Growth -Discussion Papers 149.
Imas, Alex, “Working for the “warm glow”: On the benefits and limits of prosocial incentives,”Journal of Public Economics, 2014, 114, 14–18.
, Sally Sadoff, and Anya Savikhin Samek, “Do People Anticipate Loss Aversion?,” Man-agement Science, forthcoming.
Kesternich, Martin, Andreas Lange, and Bodo Sturm, “The impact of burden sharing rules onthe voluntary provision of public goods,” Journal of Economic Behavior & Organization, 2014,105, 107–123.
Khadjavi, Menusch, “On the interaction of deterrence and emotions,” Journal of Law, Economics,15
and Organization, 2014, p. ewu012.Lindner, Florian, “Decision time and steps of reasoning in a competitive market entry game,”
Economics Letters, 2014, 122 (1), 7–11.Nalbantian, Haig R and Andrew Schotter, “Productivity under group incentives: An experimen-
tal study,” American Economic Review, 1997, pp. 314–341.Niederle, Muriel and Lise Vesterlund, “Do Women Shy Away from Competition? Do Men
Compete Too Much?,” Quarterly Journal of Economics, 2007, pp. 1067–1101.Schotter, Andrew and Keith Weigelt, “Asymmetric tournaments, equal opportunity laws, and
affirmative action: Some experimental results,” Quarterly Journal of Economics, 1992, pp. 511–539.
Straub, Tim, Henner Gimpel, Florian Teschner, and Christof Weinhardt, “How (not) to IncentCrowd Workers,” Business & Information Systems Engineering, 2015, pp. 1–13.
Swenson, Charles W, “Taxpayer behavior in response to taxation: An experimental analysis,”Journal of Accounting and Public Policy, 1988, 7 (1), 1–28.
16