
CFR CFR-Working Paper NO. 07 Working Paper NO. 07 Working Paper NO. 07-161616 The
39
CFR CFR CFR CFR-Working Paper NO. 07 Working Paper NO. 07 Working Paper NO. 07 Working Paper NO. 07-16 16 16 16 The Impact of Work Group Diversity The Impact of Work Group Diversity The Impact of Work Group Diversity The Impact of Work Group Diversity on Performance: on Performance: on Performance: on Performance: Large Sample Evidence from the Large Sample Evidence from the Large Sample Evidence from the Large Sample Evidence from the Mutual Fund Industry Mutual Fund Industry Mutual Fund Industry Mutual Fund Industry M. Bär M. Bär M. Bär M. Bär • A. Niessen A. Niessen A. Niessen A. Niessen • • • • S. Ruenzi S. Ruenzi S. Ruenzi S. Ruenzi
Transcript of CFR CFR-Working Paper NO. 07 Working Paper NO. 07 Working Paper NO. 07-161616 The

CFRCFRCFRCFR----Working Paper NO. 07Working Paper NO. 07Working Paper NO. 07Working Paper NO. 07----16161616
The Impact of Work Group Diversity The Impact of Work Group Diversity The Impact of Work Group Diversity The Impact of Work Group Diversity on Performance:on Performance:on Performance:on Performance:
Large Sample Evidence from the Large Sample Evidence from the Large Sample Evidence from the Large Sample Evidence from the Mutual Fund IndustryMutual Fund IndustryMutual Fund IndustryMutual Fund Industry
M. BärM. BärM. BärM. Bär •••• A. NiessenA. NiessenA. NiessenA. Niessen • • • • S. RuenziS. RuenziS. RuenziS. Ruenzi

The Impact of Work Group Diversity on Performance:
Large Sample Evidence from the Mutual Fund Industry ∗
Michaela Bar
Alexandra Niessen
Stefan Ruenzi
September 2007
Comments Welcome
JEL-Classification Codes: G23, J21, L22
Keywords: Diversity; Teams; Gender; Mutual Funds; Performance
∗All authors are at the Centre for Financial Research (CFR) Cologne at the University of Cologne,Albertus-Magnus Platz, 50923 Koeln, Germany. Baer: Phone +49(221)-470-7709, [email protected]: Phone +49(221)-470-7878, [email protected]. Ruenzi is also at the University ofTexas at Austin, McCombs School of Business, Department of Finance, Phone +1(512)-232-6834, [email protected]. We acknowledge financial support from the Centre for Financial Research(CFR) Cologne. Baer acknowledges research support from the Graduate School of Risk Management at theUniversity of Cologne. We have benefited from comments by Camelia Kuhnen, Jerry Parwada and seminarparticipants at the IZA research seminar. All errors are our own.

The Impact of Work Group Diversity on Performance:
Large Sample Evidence from the Mutual Fund Industry
Abstract
This paper investigates the impact of work group diversity on performance. Analyz-
ing a uniquely large sample of management teams from the U.S. mutual fund industry
we find that the influence of diversity on performance depends on the dimension of di-
versity that is analyzed. Informational diversity has a positive impact on performance,
which is driven by tenure diversity as well as educational diversity. Social category diver-
sity has a negative impact on performance, which is mainly driven by gender diversity
while age diversity has no strong impact. Our results have important implications for
the optimal composition of work groups and for investment strategies of fund investors.
JEL-Classification Codes: G23, J21, L22
Keywords: Diversity; Teams; Gender; Mutual Funds; Performance

1 Introduction
Over the past decades, the workforce in all industrialized countries has become increasingly
heterogenous. At the same time, corporate America has paid billions of dollars due to
discrimination lawsuits (see, e.g., Hersch (1991)). Obviously, successful diversity manage-
ment is an important challenge for modern corporations. To efficiently manage a diverse
workforce, it is important to understand how work group composition influences team
performance (see, e.g., Williams and O’Reilly (1998)).1 However, it is still controversial
whether diversity has a positive or negative impact on team performance (see, e.g., Siciliano
(1996), Jehn, Northcraft, and Neale (1999), and Kochan, Bezrukova, Ely, Jackson, Joshi,
Jehn, Leonard, Levine, and Thomas (2003)). While some studies show that diverse teams
outperform homogenous teams (see, e.g., Nemeth (1986), Jackson (1992), and Richard
(2000)) other studies provide the opposite finding (see, e.g., Ancona and Caldwell (1992) and
Timmerman (2000)). Thus, a clear indication for the optimal composition of work groups is
still missing. This paper investigates the impact of several important diversity dimensions
on performance in a uniquely large sample from the mutual fund industry. We examine
the joint impact of tenure diversity, educational diversity, gender diversity, and age diversity.
In the literature, there are three main theories that describe possible effects of diversity
on team performance: social categorization, similarity/attraction, and information and
decision making (see Williams and O’Reilly (1998)). The first two theories focus on the
emergence of subgroups within the team. These subgroups are either defined by salient
social categories like age or gender, or they consist of team members that perceive
themselves to be similar on dimensions such as interest or attitudes. According to these
theories, diversity in teams leads to decreased within-group communication and team
performance is eventually negatively affected. In contrast, the information and decision
making theory takes on a resource based view. It argues that diverse team members are1In this paper, we use ”work group” and ”team” as synonyms.
1

part of different networks, and that eventually increases the information set available to the
team. Thus, a positive effect of diversity on performance is predicted, because the decision
making process is based on a larger information set. Overall, the impact of diversity on
performance depends on the relative strength of the effects described by those theories.
Jehn, Northcraft, and Neale (1999) offer a convincing approach to reconcile these op-
posing predictions. They focus on diversity dimensions in which the relative impact of the
effects is clearly predictable: informational diversity and social category diversity.2 Infor-
mational diversity is defined as differences in knowledge bases, skills or perspectives of team
members. These differences can arise if team members are heterogenous in terms of edu-
cation or work experience. If informational diversity is high, the information set available
to the team is large and different alternatives will be evaluated and criticized intensively.
Every team member–based on her information set–might have a different opinion on how to
solve a specific task (see, e.g., Pelled (1993)). Such task-oriented conflicts enhance problem
solving abilities and creativity and eventually lead to high-quality solutions and a better
performance (see, e.g., Schwenk and Valacich (1994)). Social category diversity is defined as
differences in social category membership. It can arise, for example, if team members differ
in terms of gender or age or if they belong to different ethnic groups (see, e.g., Jackson
(1992)). These differences can lead to reduced within-group communication, lower levels
of cohesiveness, and a lower level of satisfaction with the team.3 If teams fail to manage
these disagreements, relationship-oriented conflicts arise with negative effects on perfor-
mance (see, e.g., Williams and O’Reilly (1998), Tjosvold (1991)). Overall, Jehn, Northcraft,
and Neale (1999) expect that informational diversity is positively related to performance
while social category diversity is negatively related to performance. However, they find only2Jehn, Northcraft, and Neale (1999) also look at a third dimension: value diversity. It measures the
difference of group members’ opinion on the group’s real task or mission. Increased value diversity can causetask-related conflicts or relationship conflicts. As our data does not allow us to measure value diversity, wewill not focus on this diversity dimension in our investigation.
3Based on data from the American Civil War, Costa and Kahn (2003) show that soldiers’ primarymotivation for fighting, to the point of self-sacrifice, was intense loyalty to a small group of comrades.Loyalty was significantly higher when the group was more homogeneous in ethnicity, occupation, and age.
2

partial empirical support for these predictions. Based on a survey conducted in a household
goods company, they find evidence for a positive impact of informational diversity on per-
formance, but they do not find the expected negative impact of social category diversity on
performance. However, it is not clear whether their findings can be generalized. They are
based on a relatively small sample of work groups from one single company, rely on subjec-
tive survey data and could be driven by the priming effect of the organizational culture in
that specific firm.
To circumvent these drawbacks, we use data from management teams in the equity
mutual fund industry. Looking at this industry allows us to overcome major shortcomings
of existing studies for several reasons. First, the decisions made by fund management
teams matter for promotion and remuneration (see, e.g., Khorana (1996)) which ensures
that the teams exert effort to achieve a high fund performance. Additionally, they make
repeated decisions over an extended period of time, typically working together for several
years. Thus, findings are not biased by weakly incentivised, artificial and short-lived groups
without sustained interdependence like the ones typically examined in experiments. Second,
our data offers a uniquely large number of observations obtained from different companies
covering the whole mutual fund industry. We are aware of no study that investigates
a comparably large number of management teams from so many different companies.
In their overviews, Milliken and Martins (1996) and Williams and O’Reilly (1998) cite
studies on diversity and performance which are mostly based on small samples of up to
about 100 teams from one or a small number of firms. Our large database is a major
advantage since we can investigate diversity over different organizational frameworks across
the whole mutual fund industry. This allows us to examine diversity effects separately
from the effects of the organizational culture in a specific company (see, e.g, Chatman,
Polzer, Barsade, and Neale (1998)). Third, fund management teams work in a relatively
homogenous environment with clearly defined tasks, i.e., every team in our sample has
to manage an equity fund. Thus, they can be easily compared and our results are not
influenced by different degrees of task difficulty or complexity that might affect team
3

outcomes (see, e.g., Jackson, Joshi, and Erhardt (2003)). Furthermore, the performance
of fund management teams is easily quantifiable based on fund returns. Williams and
O’Reilly (1998) mention the difficulty of measuring performance as one of the main
problems of existing studies on diversity. The finance literature has developed several
metrics to capture the performance of funds (see, e.g., Jensen (1968), Fama and French
(1993), and Carhart (1997)). We use these performance measures to rank fund management
team outcomes objectively. This is a major advantage compared to studies relying on
qualitative performance measures like team leaders’ ratings that depend on self-perceptions
or subjective judgements (see, e.g., Pelled, Eisenhardt, and Xin (1999)). Overall, the fund
management teams in our sample fit the Hackman (1987) definition of work groups very
well in the sense that team members see themselves and are perceived by others as an inde-
pendent social entity within the broader organizational context of the mutual fund company.
This paper contributes to two main strands of the literature. First, it contributes to
the broad empirical literature on work group diversity (see, e.g., Milliken and Martins
(1996), Hambrick, Cho, and Chen (1996), Pelled, Eisenhardt, and Xin (1999), Kilduff, An-
gelmar, and Mehra (2000), and Groysberg, Polzer, and Elfenbein (2007); for comprehensive
overviews, see Milliken and Martins (1996), Williams and O’Reilly (1998), and Jackson,
Joshi, and Erhardt (2003)). We extend this literature by jointly examining various dimen-
sions of diversity within a uniquely large sample. Our results allow us to quantify the effects
of diversity on fund performance across several diversity dimensions. Second, our paper
contributes to the literature on the determinants of fund performance. There are several
papers on the impact of single managers’ characteristics like age or gender or the status of a
fund as being single- or team-managed on fund performance (see, e.g., Chevalier and Ellison
(1999b), Niessen and Ruenzi (2007), Prather and Middleton (2002) and Baer, Kempf, and
Ruenzi (2006)). However, ours is the first study to look at the impact of group diversity
within fund management teams on fund performance.
4

2 Methodology
2.1 Data and Summary Statistics
Our empirical analysis is based on data from the CRSP Survivor Bias Free Mutual Fund
Database4 as well as the Morningstar Principa Database CDs. The CRSP database covers
virtually all U.S. open-end mutual funds and provides information on fund returns, invest-
ment objectives, fund managers and other fund characteristics. Since this database does not
include detailed information about fund managers, we obtain the fund managers’ age and
degree from the fund manager profiles provided by the Morningstar database. Age is not
explicitly reported in the manager profiles. Following the method suggested in Chevalier
and Ellison (1999a), we calculate a proxy for manager age based on information about the
year a manager finished her degree.
We focus on actively managed, well-diversified equity funds which invest more than
50% of their assets in U.S. stocks. ICDI objective codes as provided by Standard and Poor’s
Fund Services are used to define the market segment in which a fund operates. Our sample
consists of funds of the following three standard segments: Aggressive Growth, Growth and
Income, and Long Term Growth. We exclude index, sector, bond, money market, balanced,
and international funds since the management of these funds might require specific abilities
which make management teams of these funds less comparable. Furthermore, fund perfor-
mance is not easily comparable across these market segments due to different benchmarks.
Since we need to identify individual characteristics of fund managers, we only include funds
managed by more than one manager where the names of all members are explicitly given
in the CRSP database.5 Single managed funds are excluded to isolate diversity effects from4Source: CRSP, Center for Research in Security Prices. Graduate School of Business, The University of
Chicago. Used with permission. All rights reserved.5Some fund companies provide no information on the identity of team members. These observations are
excluded.
5

the impact of the management structure (single vs. team managed) on the behavior of fund
managers.6
Our data on manager characteristics from Morningstar begins in January 1996. Overall,
our sample covers the time period from January 1996 to December 2003 and contains 2,260
yearly observations of team managed funds. We follow the approach in Daniel, Grinblatt,
Titman, and Wermers (1997) and match share classes of a fund to avoid multiple counting.
Although multiple share classes are listed as separate entries in the CRSP database, they
are backed by the same portfolio of assets and have the same portfolio managers. Summary
statistics for our sample are presented in Table 1.
Table 1: Descriptive Statistics of Mutual Funds.
Mean Median Minimum Maximum
Fund Age (in years) 11.30 7.00 1.00 79.00
Fund Size (in Millions) 942.04 262.20 1.00 52, 837.00
Turnover Ratio (in percent) 96.02 76.00 0.01 684.00
Expenses (in percent) 1.32 1.25 0.01 3.87
Number of Team Members 3.11 3.00 2.00 15.00
The number of yearly observations is 2,260. The time period is from January 1996 toDecember 2003.
The funds in our sample have an average age of 11.3 years and an average size of 942.04
Million USD. The mean turnover ratio is 96.02% with a large variation ranging from 0.01%
up to 684%. Expense ratios are distributed between 0.01% and 3.87% with a mean of 1.32%.
The mean (median) fund management team consists of 3.11 (3) team members, while the
minimum number of team members is (by definition) 2 and the maximum number of team
members is 15. The large variation in fund characteristics like age, size and turnover man-6For differences between single and team managed funds, see Baer, Kempf, and Ruenzi (2006) and Massa,
Reuter, and Zitzewitz (2006).
6

dates that we control for them when investigating the impact of diversity on performance
in a regression framework.
2.2 Diversity Measures
To capture team diversity with respect to informational diversity and social category diver-
sity we develop four different diversity measures.
Informational diversity is likely to arise as a function of differences among group mem-
bers in work experience and education (see, e.g., Jehn, Northcraft, and Neale (1999)). Thus,
we construct measures based on team members’ variations in industry tenure and degree-
level. Tenure diversity within a fund management team is measured by the coefficient of
variation of industry tenure among team members. The industry tenure of each manager
is captured by that person’s first appearance in the Morningstar database. This method
might lead to some noise in our proxy as it is possible that some managers worked for an
anonymous team earlier in their career and thus the starting date would not be correctly
computed. Furthermore, the manager might have gained some experience in another area
of fund management, e.g., in hedge funds. However, we do not expect this to be a very
regular case or to systematically bias our results. Looking at the educational background of
fund managers we find that managers vary in particular with respect to their level of degree
(B.A., M.A., PhD (or equivalent)). Following Smith, Smith, Olian, Sims, O’Bannon, and
Scully (1994), we transform the highest degree achieved by a team member into years of for-
mal education. Educational diversity is then captured by the team’s coefficient of variation
of the team members’ length of formal education.7
Social category diversity arises from explicit differences in social category membership
among group members (see, e.g., Jackson (1992)). According to Jehn, Northcraft, and Neale
(1999), essential social categories are gender, age, race, and ethnicity. Unfortunately, we7It would also be interesting to study the impact of diversity with respect to the field in which team
members got their degree. Unfortunately, our data do not include this information.
7
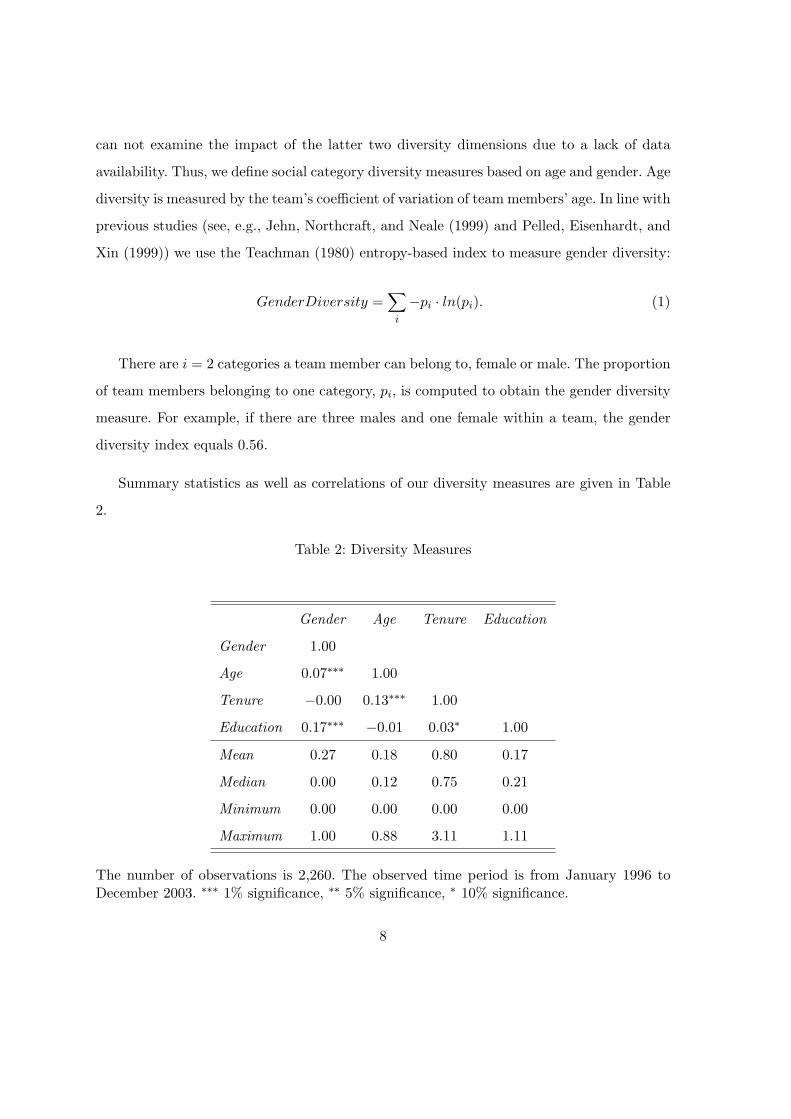
can not examine the impact of the latter two diversity dimensions due to a lack of data
availability. Thus, we define social category diversity measures based on age and gender. Age
diversity is measured by the team’s coefficient of variation of team members’ age. In line with
previous studies (see, e.g., Jehn, Northcraft, and Neale (1999) and Pelled, Eisenhardt, and
Xin (1999)) we use the Teachman (1980) entropy-based index to measure gender diversity:
GenderDiversity =∑
i
−pi · ln(pi). (1)
There are i = 2 categories a team member can belong to, female or male. The proportion
of team members belonging to one category, pi, is computed to obtain the gender diversity
measure. For example, if there are three males and one female within a team, the gender
diversity index equals 0.56.
Summary statistics as well as correlations of our diversity measures are given in Table
2.
Table 2: Diversity Measures
Gender Age Tenure Education
Gender 1.00
Age 0.07∗∗∗ 1.00
Tenure −0.00 0.13∗∗∗ 1.00
Education 0.17∗∗∗ −0.01 0.03∗ 1.00
Mean 0.27 0.18 0.80 0.17
Median 0.00 0.12 0.75 0.21
Minimum 0.00 0.00 0.00 0.00
Maximum 1.00 0.88 3.11 1.11
The number of observations is 2,260. The observed time period is from January 1996 toDecember 2003. ∗∗∗ 1% significance, ∗∗ 5% significance, ∗ 10% significance.
8

Correlations between the diversity dimensions are generally low. They range from -0.01
to 0.17. This indicates that a team that is, for example, gender diverse is not necessarily
also diverse in terms of age, tenure or education. The highest correlation of 0.17 and 0.13 is
between gender diversity and educational diversity and age diversity and tenure diversity,
respectively.
2.3 Performance Measures
To investigate the influence of diversity within the fund management team on fund per-
formance we analyze three common performance measures. First, we compute the net of
expenses return of fund i in year t over the risk-free, Reti,t. This measure allows us to di-
rectly assess how the value of fund shares develops relative to the risk-free account. However,
it does not take into account the riskiness of a fund’s strategy. It is possible that diversity
affects the riskiness of the decisions teams make. For example, Adams and Ferreira (2004)
show a negative correlation between firm risk and gender diversity within corporate boards.
Therefore, we additionally measure the risk adjusted fund performance by calculating each
fund’s Jensen (1968) Alpha. This measure adjusts returns by the amount of systematic risk
a fund is taking. It is obtained by running the following regression for each fund i and each
year t:
Ri,m,t −Rf,m,t = αJeni,t + βi,M,t(RM,m,t −Rf,m,t) + εJen
i,m,t. (2)
Ri,m,t −Rf,m,t denotes fund i’s excess return over the risk-free rate in month m of year
t and RM,m,t −Rf,m,t denotes the excess return of the market segment the fund belongs to
over the risk-free rate. The estimated alpha, αJeni,t , is our second performance measure for
fund i in year t.8
8These yearly alpha estimates are based on 12 monthly observations and will thus be noisy. However,we are not interested in a precise measure of a specific fund’s performance, but in differences across a largecross-section of funds.
9

As a third performance measure, we compute the yearly Carhart (1997) Four Factor Al-
pha. This measure also controls for systematic market risk, but additionally adjusts returns
for the influence of investment styles a fund management team is following:
Ri,m,t −Rf,m,t = αFFi,t + βi,M,t(RM,m,t −Rf,m,t) + βi,S,tSMBm,t
+βi,H,tHMLm,t + βi,MO,tMOMm,t + εFFi,m,t. (3)
SMBm,t is the return difference between small and large capitalization stocks, HMLm,t
denotes the return difference between high and low book-to-market stocks and MOMm,t is
the return difference between stocks with high and low returns in the previous year for month
m of year t.9 High loadings mean that the fund follows a small-cap (SMB), value (HML),
or momentum (MOM) strategy, respectively. Thus, the Carhart (1997) Four Factor Alpha
allows us to directly compare the performance of fund management teams independent of
differences in risk taking and investment styles.
3 Results
3.1 Impact of Diversity on Performance
We start our empirical investigation by relating fund performance to various dimensions of
diversity as well as other potentially relevant drivers of fund performance:
Perfi,t = α + β1 · TenureDivi,t−1 + β2 · EducDivi,t−1 + β3 ·GenderDivi,t−1
+β4 ·AgeDivi,t−1 + β5 · Perfi,t−1 + β6 · FundAgei,t−1
+β7 · FundSizei,t−1 + β8 · Turnoveri,t−1 + β9 · Expensesi,t−1 + εi,t. (4)
9The market, the size, and the value portfolio returns were taken from Kenneth French’s websitehttp://mba.tuck.dartmouth.edu/pages/faculty/ken.french, while the momentum factor was kindly pro-vided by Mark Carhart.
10

Here, Perfi,t denotes one of our performance measures, the excess return of fund i in year
t over the risk free rate, the Jensen (1968) Alpha or the Carhart (1997) Four Factor Alpha,
respectively. Tenure diversity, TenureDivi,t−1, and educational diversity, EducDivi,t−1, of
the management team of fund i at the end of year t − 1 are our proxies for informa-
tional diversity (see Section 2). Social category diversity is proxied by gender diversity,
GenderDivi,t−1, and age diversity, AgeDivi,t−1, of fund i’s team members at the end of
year t − 1, respectively. As some of our diversity measures are significantly correlated (see
Table 2), we examine the impact of informational and social category diversity on fund
returns in one joint regression to avoid potential misspecification due to cross correlation
effects.
We control for previous performance, Perfi,t−1, the logarithm of fund i’s age in years,
FundAgei,t−1, the logarithm of its total net-assets in million USD, FundSizei,t−1, its yearly
turnover ratio, Turnoveri,t−1, and its expense ratio, Expensesi,t−1. Previous studies show
that these variables can impact fund performance (see, e.g., Chen, Hong, Huang, and Kubik
(2004), Barber and Odean (2000), and Brown and Goetzmann (1995)). We lag our explana-
tory variables by one year to mitigate potential endogeneity problems. To ensure that we
only compare funds that are operating within the same market segment, we estimate all
our regressions with segment-fixed effects. We add time fixed effects to account for differ-
ences over our sample period. The simplest approach to estimate Model (4) is to run pooled
regressions. However, this approach assumes independent error terms over time and across
observations. To allow for possible violations of this assumption, we take advantage of the
panel structure of our data and estimate our model with panel corrected standard errors
(PCSE). Using a PCSE specification allows us to accommodate panel data with autocor-
relation and cross-correlation of the error terms and heteroscedasticity (see Beck and Katz
(1995)). Results are presented in Table 3.
Column 1 contains results where we use excess fund returns over the risk free rate as per-
formance measure. In line with the theoretical reasoning regarding informational diversity,
11

Table 3: Team Diversity and Performance
Excess Fund Returns Jensen Alpha Four Factor Alpha
Tenure Diversity 0.0002∗ 0.0001∗ 0.0001∗
Education Diversity 0.0018∗ 0.0019∗ 0.0013∗
Gender Diversity −0.0018∗∗ −0.0011∗∗ −0.0007∗∗
Age Diversity 0.0012 0.0005 0.0021
Lagged Performance 0.0132∗∗∗ 0.0188∗∗∗ 0.0115∗∗∗
Fund Age 0.0013∗∗∗ 0.0013∗∗∗ −0.0001
Fund Size −0.0013∗∗∗ −0.0010∗∗∗ −0.0005∗∗∗
Turnover −0.0001 0.0008 −0.0002
Expenses 0.0111 0.0109 −0.0021
adj.R2 0.6455 0.2429 0.1832
All regressions are estimated with time and segment fixed effects. Significance is based onpanel corrected standard errors. ∗∗∗ 1% significance, ∗∗ 5% significance, ∗ 10% significance.
12
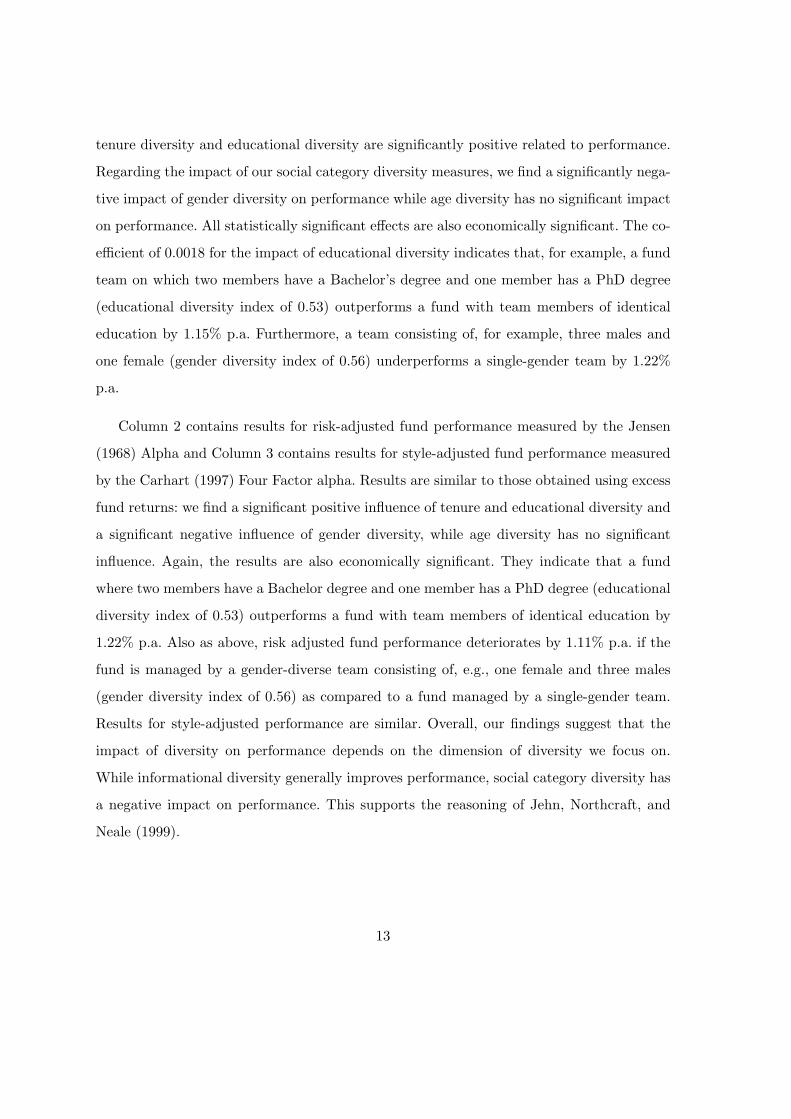
tenure diversity and educational diversity are significantly positive related to performance.
Regarding the impact of our social category diversity measures, we find a significantly nega-
tive impact of gender diversity on performance while age diversity has no significant impact
on performance. All statistically significant effects are also economically significant. The co-
efficient of 0.0018 for the impact of educational diversity indicates that, for example, a fund
team on which two members have a Bachelor’s degree and one member has a PhD degree
(educational diversity index of 0.53) outperforms a fund with team members of identical
education by 1.15% p.a. Furthermore, a team consisting of, for example, three males and
one female (gender diversity index of 0.56) underperforms a single-gender team by 1.22%
p.a.
Column 2 contains results for risk-adjusted fund performance measured by the Jensen
(1968) Alpha and Column 3 contains results for style-adjusted fund performance measured
by the Carhart (1997) Four Factor alpha. Results are similar to those obtained using excess
fund returns: we find a significant positive influence of tenure and educational diversity and
a significant negative influence of gender diversity, while age diversity has no significant
influence. Again, the results are also economically significant. They indicate that a fund
where two members have a Bachelor degree and one member has a PhD degree (educational
diversity index of 0.53) outperforms a fund with team members of identical education by
1.22% p.a. Also as above, risk adjusted fund performance deteriorates by 1.11% p.a. if the
fund is managed by a gender-diverse team consisting of, e.g., one female and three males
(gender diversity index of 0.56) as compared to a fund managed by a single-gender team.
Results for style-adjusted performance are similar. Overall, our findings suggest that the
impact of diversity on performance depends on the dimension of diversity we focus on.
While informational diversity generally improves performance, social category diversity has
a negative impact on performance. This supports the reasoning of Jehn, Northcraft, and
Neale (1999).
13

3.2 Influence of Team Characteristics
It is possible that characteristics of the team or its members influence performance. For
example, Simons, Pelled, and Smith (1999) argue that team size can influence decision
making and group outcomes. Furthermore, Bedeian and Mossholder (2000) emphasize the
need to control for team size to avoid measurement artifacts due to a positive correlation
between team size and diversity measures when teams are small. Thus, we add team size,
measured as the logarithm of the number of team members, as an additional explanatory
variable in our regressions.
It is also possible that our diversity measures partly capture the influence of the average
characteristics of the team members. For example, Chevalier and Ellison (1999b) show
that managers with a higher degree level obtain a better performance. To control for the
average characteristics of the team members, we add the average age of all managers in
fund i’s management team at the end of year t − 1, MgerAgei,t−1, their average tenure,
MgerTenurei,t−1, and dummy variables indicating whether any of the team members has an
MBA (MgerMBAi,t−1) and a PhD (MgerPhDi,t−1), respectively, as additional explanatory
variables.10
Results for all performance measures are presented in Table 4. They show that informa-
tional diversity is again positively related to performance while social category diversity still
has a negative impact on performance after controlling for team size and average team char-
acteristics. Team size itself has no significant impact on fund returns. Overall, the impact of
the team member characteristics on fund returns is small. This shows that our main results
do not change if we control for the influence of team size and average team characteristics.10We do not include the share of females in a fund management team as control variable, since it is highly
correlated (0.84) with our entropy measure. Thus, adding the share of females would lead to multi-collinearityproblems. However, Niessen and Ruenzi (2007) find no difference between the performance of female andmale fund managers.
14

Table 4: Influence of Team Characteristics
Excess Fund Returns Jensen Alpha Four Factor Alpha
Tenure Diversity 0.0003∗ 0.0003∗ 0.0004∗
Education Diversity 0.0054∗∗ 0.0059∗∗∗ 0.0031∗∗
Gender Diversity −0.0015∗∗ −0.0009∗ −0.0007∗
Age Diversity 0.0001 0.0008 0.0024
Lagged Performance 0.0191∗∗∗ 0.0164∗∗∗ 0.0120∗∗∗
Fund Age 0.0010∗∗ 0.0007∗∗ −0.0001
Fund Size −0.0011∗∗∗ −0.0009∗∗∗ −0.0005∗∗∗
Turnover −0.0002 0.0005 −0.0001
Expenses −0.0056 0.0021 −0.0026
Team Size 0.0005 0.0004 −0.0003
Mger Age −0.0021 −0.0039 −0.0014
Mger Tenure 0.0008 0.0012∗ 0.0004
Mger MBA 0.0029∗∗ 0.0020∗ 0.0013
Mger PhD −0.0028 −0.0062∗ −0.0036
adj.R2 0.6572 0.2530 0.1896
All regressions are estimated with time and segment fixed effects. Significance is based onpanel corrected standard errors. ∗∗∗ 1% significance, ∗∗ 5% significance, ∗ 10% significance.
15

3.3 Further Robustness Checks
Pelled, Eisenhardt, and Xin (1997) and Ancona and Caldwell (1992) show that the impact
of diversity on performance can depend on task design. Although the task of managing a
fund should be similar across market segments, we nevertheless test whether our findings
hold universally for all three market segments (i.e., Growth, Aggressive Growth, Long-Term
Growth) or whether they are driven by the funds from one specific segment. Therefore,
we estimate all previous regressions for subsamples of funds belonging to the Aggressive
Growth, Growth and Income and Long-Term Growth segment, respectively. Results (not
reported) are stable for all three market segments.
We also investigate the temporal stability of our results and split up our sample into
two subperiods covering the years from 1996 to 1999 and from 2000 to 2003, respectively.
Instead of splitting our sample in the middle, we also analyze subsamples consisting of bull
and bear market years, and subsamples consisting of volatile and calm years, respectively.
Results (not reported) in all subperiods are in line with the findings from the full sample.
As a final robustness check, we use alternative performance and diversity measures. We
use the Fama and French (1993) Three Factor Alpha as alternative performance measure
since there is some disagreement among finance scholars about which model is the most
suitable to measure mutual fund performance. As alternative tenure and age diversity mea-
sures we use the difference between the longest and shortest time a team member served in
the mutual fund industry and the difference between the oldest and youngest team mem-
ber, respectively. Educational and gender diversity are alternatively defined as a dummy
variables: the dummy for educational diversity is one if team members have different levels
of degrees, and zero otherwise; the dummy for gender diversity is one if the team consists of
male and female managers and zero if only male or only female managers are in the team.
Our results (not reported) remain stable and do not depend on a specific performance or
diversity measure.
16

3.4 Profitability of Investment Strategies based on Group Diversity
Finally, we investigate whether it would have been possible to earn abnormal
returns with an investment strategy that is solely based on information about
team diversity and does not take into account other fund or manager charac-
teristics. We construct a SocialHomogeneity/InfoDiversity portfolio as well as a
SocialDiversity/InfoHomogeneity portfolio. The first portfolio consists of all funds with
a below-median value of gender diversity and at the same time an above-median value of
tenure and educational diversity in a given year.11 The second portfolio consists of all funds
with an above-median value of gender diversity, and at the same time a below-median value
of tenure and educational diversity in a given year.12 These portfolios are re-balanced on
a yearly basis. We calculate equally-weighted yearly returns of these portfolios as well as
the respective difference between these equally weighted portfolio returns over our sample
period.13
In line with our findings hitherto we find that the SocialHomogeneity/InfoDiversity
portfolio outperforms the SocialDiversity/InfoHomogeneity portfolio by a statistically
significant and economically meaningful 1.55% p.a. based on raw returns, by 1.38% p.a.
based on Jensen (1968) Alphas, and by 1.23% p.a. based on Carhart (1997) Four Factor
Alphas, respectively. Overall, these results show that the degree and the dimension of di-
versity within a fund management team is an important and valuable piece of information
for fund investors.11Since age diversity has no significant impact on performance we do not include this dimension in our
further analysis.12Furthermore, we compare strategies that are solely based on one dimension of diversity. Results (not
reported) indicate that portfolios consisting of informational diverse funds significantly outperform portfoliosconsisting of informational homogenous funds while portfolios consisting of social category homogenous fundssignificantly outperform portfolios consisting of social category diverse funds, respectively.
13All portfolio strategies are also evaluated based on value weighted portfolios. Results (not reported)remain similar.
17

3.5 Discussion and Caveats
Our results support the theoretical reasoning in Jehn, Northcraft, and Neale (1999). They
suggest that social category diversity is negatively related to team performance. This is
consistent with the view that social-category diversity leads to relationship-oriented con-
flicts in work groups. In a work group like a fund management team, where all members are
supposed to contribute to a common task, relationship-oriented conflicts can cause deterio-
ration in group interaction, communication and eventually performance (see, e.g., Jackson
(1992)).
Kanter (1977) argues that characteristics that are possessed by a small fraction of the
relevant population are more important in the creation of social categories than characteris-
tics that are possessed by a larger fraction. Based on this finding, Randel (2002) and Joshi,
Liao, and Jackson (2006) suggest that gender diversity is more likely to lead to conflicts and
underperformance if the numerical distinctiveness of gender group composition is high, i.e.,
if there is a clear dominance of one of the sexes. The mutual fund industry is a clearly male-
dominated environment.14 Thus, conflicts caused by gender diversity are likely to arise and
negatively influence performance. This is consistent with our findings of a strong negative
influence of gender diversity on performance.
Age is also regularly viewed as one dimension of social category diversity (see, e.g., Jehn,
Northcraft, and Neale (1999), Simons, Pelled, and Smith (1999), and Pelled, Eisenhardt, and
Xin (1999)). However, we find no negative influence of age diversity on performance, which
agrees to the findings of the empirical studies reviewed in Williams and O’Reilly (1998) and
Jackson, Joshi, and Erhardt (2003). A possible reason why we find no effect of age diversity
is the less pronounced numerical distinctiveness between younger and older managers as
compared to the numerical distinctiveness between female and male managers. Thus, age
is probably less salient than gender and consequently age diversity has a less pronounced14Niessen and Ruenzi (2007) report a share of about 10% females in the U.S. mutual fund industry from
1994 to 2003.
18

negative influence (see, e.g., Pelled (1993)). These results are also consistent with Blau
(1977). Blau’s Paradox posits that only moderate levels of diversity with a clear numerical
distinctiveness between the diversity categories hurt performance. A further increase in
group heterogeneity with the extreme case of an equal number of team members in each
diversity category mitigates this effect. Furthermore, in our sample, age might also be a
proxy for experience or status rather than for social category. Young and old managers
are likely to have varied status-seeking tendencies. Overbeck, Correll, and Park (2005) and
Groysberg, Polzer, and Elfenbein (2007) show that teams with too many individuals seeking
for high status do not collaborate well since their attempt to gain status disrupts information
sharing.
With respect to informational diversity, our findings indicate that this diversity dimen-
sion is positively related to performance. Jehn, Northcraft, and Neale (1999) argue that
informational diversity leads to task-related conflicts and increases the probability of reach-
ing the optimal solution (see, e.g., Schwenk and Valacich (1994)). Consistent with this,
our findings indicate that educational diverse as well as tenure diverse teams outperform
teams that are less diverse with respect to these dimensions. A mixture of managers with
a different educational background as well as of experienced managers and managers who
just entered the industry seems to be an optimal combination to generate superior perfor-
mance.15 This finding is in line with Ancona and Caldwell (1992) who argue that teams
consisting of members that differ with respect to their tenure know a different set of people,
have different technical skills, and have a different perspective on the organization’s history.
This provides tenure diverse teams with a broader range of contacts and knowledge and
eventually improves decision quality. In contrast, Pfeffer (1985), Katz (1980), and Roberts
and O’Reilly (1979) argue that team members who entered at the same time have more
shared experiences and have developed networks which new members might find difficult to15Informal discussions with industry professionals indicate that the top management in fund companies
often actively sets up teams where more experienced team members work together with younger managers.Besides offering the opportunity for the inexperienced managers to learn from the more experienced man-agers, the main advantage of tenure diversity they mention is that older managers might have more oversight,while younger managers are more active and dedicated.
19

enter. Based on this latter reasoning, we would expect tenure homogenous teams to perform
better. Our findings provide no support for this idea.
Besides supporting the predictions of Jehn, Northcraft, and Neale (1999), the results
of our paper can also be well explained by a related economic model developed by Lazear
(1999). This model concludes that a potentially positive impact of diversity on performance
hinges on three main determinants. First, information and skills of the team members have
to be disjoint so that the total information set increases with the addition of team mem-
bers. Second, the information has to be relevant for the task that has to be solved. Third,
communication costs have to be small so that they do not offset potential benefits gained
by the additional information. Transferred to our findings, informational diversity has a
positive impact on performance since team members with different educational and profes-
sional backgrounds increase the set of relevant and (at least partially) disjoint information
the team can use to solve its task. In contrast, social category diversity increases commu-
nication costs. Thus, it is negatively related to performance.
While our sample has several important advantages, one important drawback of our
study is that we only observe team outcomes and not the decision process or the behavior
of individual group members. We cannot take a look into the ’black box’ of dynamic group
processes and decision making in teams (see, e.g., Pelled, Eisenhardt, and Xin (1997) and
Kilduff, Angelmar, and Mehra (2000)). Our study also neither includes an analysis of worker
morale or commitment of team members to their team nor an analysis of personal well-being
and satisfaction of team members. Furthermore, while we have a rich data set at hand
which contains many demographic variables as well as fund characteristics, there are still
variables that might influence performance that we can not observe. Most importantly, the
behavior and performance of team members might depend on their remuneration contracts.
We can not observe these contracts. However, we have no reason to assume that they are
systematically different between the members of diverse and homogenous teams. Another
limitation of our study is that our data does not allow for an investigation of other important
20

diversity categories like race and ethnicity. However, as long as such diversity categories are
not highly correlated with the diversity dimensions we examine, our results should still be
valid.
4 Implications and Conclusion
This paper is the first to investigate how diversity within fund management teams affects
fund performance. Using a uniquely large database of U.S. team managed equity funds we
transfer the controversial literature on the effect of group diversity on performance to the
mutual fund industry. Our analysis of 2,260 management teams of U.S. equity funds from
1996 to 2003 shows that the impact of diversity on performance depends on the dimension of
diversity that is investigated. While social category diversity is generally negatively related
to performance, informational diversity is positively related to performance. Our results are
stable over time and robust with respect to fund, manager, and team characteristics that
might be related to fund performance. These findings suggest that diversity is not a good
per se. They also help to explain some of the seemingly contradictory evidence regarding
the impact of group diversity on performance reported in earlier studies.
Our findings have important implications for the optimal composition of work groups.
Teams with members of different industry tenure and with members of different education
outperform teams that are homogenous in terms of industry tenure and education. Further-
more, single-gender teams outperform mixed-gender teams. Age diversity has no significant
effect on performance. Thus, to benefit from the increased creativity and innovation that
is often attributed to diverse work groups, it is important to consider the dimension of
diversity that is incorporated.
While we think the mutual fund industry is ideally suited to test diversity issues, one
still has to be careful in transferring our results to other settings. Specifically, our finding
of a negative impact of gender diversity could be driven by the fact that the numerical
21

distinctiveness between male and female managers makes gender a salient social category
in the clearly male dominated mutual fund industry. Thus, our results are transferable to
organizations that are male dominated. In contrast, in a female-dominated sample, O’Reilly,
Williams, and Barsade (1997) find no impact of gender diversity on performance. This shows
that the conclusion not to employ females in teams based on the findings in this paper might
be premature. In contrast, the negative effect of gender diversity might vanish if the share
of women employed actually rises to a level where women are not a salient minority.
An efficient implementation of diversity is particulary important in the mutual fund
industry, since the number of management teams employed by fund companies has risen
strongly during the past years (see, e.g., Baer, Kempf, and Ruenzi (2006)). Furthermore,
fund assets soared to 7.5 trillion USD in 2004 with a compound annual growth rate of 16
percent (see, e.g., Bogle (2005)) and many investors rely on mutual funds for their retirement
provisions. Therefore, the impact of diversity on performance is especially important for fund
investors, fund-of-fund managers, as well as financial advisors, financial planners and 401(k)
plan sponsors.
Since 2004, with the adoption of amendments to Forms N-1A and N-2, the SEC has
required fund companies to mention by name each member of a fund management team
in their prospectuses. This allows investors to identify the members of fund management
teams and get an idea about the diversity within each team. Our results show that this
information is relevant for fund investors: a portfolio consisting of funds managed by teams
that are characterized by high informational diversity and low social category diversity
outperformed a portfolio consisting of funds with low informational diversity and high social
category diversity by about 1.55% in our sample period.
22

References
Adams, R., and D. Ferreira, 2004, “Gender Diversity in the Boardroom,” ECGI Working
Paper Series in Finance, Stockholm.
Ancona, D., and D. Caldwell, 1992, “Demography and Design: Predictors of New Product
Team Performance,” Organization Science, 3, 321–341.
Baer, M., A. Kempf, and S. Ruenzi, 2006, “Determinants and Consequences of Team Man-
agement in the Mutual Fund Industry,” Working Paper.
Barber, B. M., and T. Odean, 2000, “Trading Is Hazardous to Your Wealth: The Common
Stock Investment Performance of Individual Investors,” The Journal of Finance, 55, 773–
806.
Beck, and Katz, 1995, “What to Do (and Not to Do) with Time-Series Cross-Section Data,”
American Political Science Review, 89, 634–647.
Bedeian, A. G., and K. W. Mossholder, 2000, “On the Use of the Coefficient of Variation
as a Measure of Diversity,” Organizational Research Methods, 3, 285–297.
Blau, P. M., 1977, Inequality and Heterogeneity: A Primitive Theory of Social Structure,
The Free Press, New York.
Bogle, J. C., 2005, “The Mutual Fund Industry 60 Years Later: For Better or Worse?,”
Financial Analysts Journal, 61, 15–24.
Brown, S. J., and W. N. Goetzmann, 1995, “Performance Persistence,” Journal of Finance,
50, 679–698.
Carhart, M. M., 1997, “On Persistence in Mutual Fund Performance,” Journal of Finance,
52, 57–82.
23

Chatman, J. A., J. T. Polzer, S. G. Barsade, and M. A. Neale, 1998, “Being Different Yet
Feeling Similar: The Influence of Demographic Composition and Organizational Culture
on Work Processes and Outcomes,” Administrative Science Quarterly, 43, 749–780.
Chen, J., H. Hong, M. Huang, and J. D. Kubik, 2004, “Does Fund Size Erode Performance?
Liquidity, Organizational Diseconomies and Active Money Management,” American Eco-
nomic Review, 94, 1276–1302.
Chevalier, J., and G. Ellison, 1999a, “Are Some Mutual Fund Managers Better Than Others?
Cross-Sectional Patterns in Behavior and Performance,” Journal of Finance, 54, 875–899.
Chevalier, J., and G. Ellison, 1999b, “Career Concerns of Mutual Fund Managers,” Quar-
terly Journal of Economics, 114, 389–432.
Costa, D. L., and M. E. Kahn, 2003, “Cowards and Heroes: Group Loyalty in the American
Civil War,” Quarterly Journal of Economics, 118, 519–548.
Daniel, K., M. Grinblatt, S. Titman, and R. Wermers, 1997, “Measuring Mutual Fund
Performance With Characteristic-Based Benchmarks,” Journal of Finance, 52, 1035–
1058.
Fama, E. F., and K. R. French, 1993, “Common Risk Factors in the Return on Bonds and
Stocks,” Journal of Financial Economics, 33, 3–53.
Groysberg, B., J. T. Polzer, and H. A. Elfenbein, 2007, “Too Many Cooks Spoil the Broth:
How High Status Individuals Decrease Group Effectiveness,” Working Paper.
Hackman, J. R., 1987, “The Design of Work Teams,” in J. Lorsch (ed.), Handbook of Orga-
nizational Behavior, Englewood Cliffs, Prentice Hall.
Hambrick, D. C., T. S. Cho, and M.-E. Chen, 1996, “The Influence of Top Management
Team Heterogeneity on Firms’ Competitive Moves,” Administrative Science Quarterly,
41, 659–684.
24

Hersch, J., 1991, “Equal Employment Opportunity Law and Firm Profitability,” Journal of
Human Resources, 26, 139–153.
Jackson, S. E., 1992, “Team Composition in Organizational Settings: Isuues in Managing an
Increasingly Diverse Workforce.,” in S. Worchel, W. Wood, and J. Simpson (ed.), Group
Processes and Productivity, Sage.
Jackson, S. E., A. Joshi, and N. L. Erhardt, 2003, “Recent Research on Team and Or-
ganizational Diversity: SWOT Analysis and Implications,” Journal of Management, 29,
801–830.
Jehn, K. A., G. B. Northcraft, and M. A. Neale, 1999, “Why Differences Make a Difference:
A Field Study of Diversity, Conflict and Performance in Workgroups,” Administrative
Science Quarterly, 44, 741–763.
Jensen, M. C., 1968, “The Performance of Mutual Funds in the Period 1955-1964,” Journal
of Finance, 23, 389–416.
Joshi, A., H. Liao, and S. E. Jackson, 2006, “Cross-Level Effects of Workplace Diversity on
Sales Performance and Pay,” Academy of Management Journal, 49, 459–481.
Kanter, R. M., 1977, “Some Effects of Proportions on Group Life: Skewed Sex Ratios and
Responses to Token Women,” American Journal of Sociology, 82, 965–990.
Katz, R., 1980, “Time and Work: Toward an Integrative Perspective,” in B.M. Staw, and
L.L. Cummings (ed.), Research in Organizational Behavior, Greenwich, CT: JAI Press.
Khorana, A., 1996, “Top Management Turnover: An Empirical Investigation of Mutual
Fund Managers,” Journal of Financial Economics, 40, 403–426.
Kilduff, M., R. Angelmar, and A. Mehra, 2000, “Top Management-Team Diversity and Firm
Performance: Examining the Role of Cognitions,” Organizational Science, 11, 21–34.
25

Kochan, T., K. Bezrukova, R. Ely, S. Jackson, A. Joshi, K. Jehn, J. Leonard, D. Levine,
and D. Thomas, 2003, “The Effects of Diversity on Business Performance: Report of the
Diversity Research Network,” Human Resource Management, 42, 3–21.
Lazear, E. P., 1999, “Globalisation and the Market for Team-Mates,” The Economic Jour-
nal, 109, C15–C40.
Massa, M., J. Reuter, and E. Zitzewitz, 2006, “The Rise of Anonymous Teams in Fund
Management,” Working Paper, Lundquist College of Business, University of Oregon.
Milliken, F. J., and L. L. Martins, 1996, “Searching for Common Threads: Understanding
the Multiple Effects of Diversity in Organizational Groups,” Academy of Management
Review, 21, 402–433.
Nemeth, C., 1986, “Differential Contributions of Majority and Minority Influence,” Psycho-
logical Review, 93, 23–32.
Niessen, A., and S. Ruenzi, 2007, “Sex Matters: Gender Differences in a Professional Set-
ting,” Working Paper, University of Cologne, Germany.
O’Reilly, C. A., K. Y. Williams, and S. G. Barsade, 1997, “Group Demography and In-
novation: Does Diversity Help?,” in E. Mannix, and M. Neale (ed.), Research in the
Management of Groups and Teams, Greenwich, CT: JAI Press.
Overbeck, J. R., J. Correll, and B. Park, 2005, “Internal Status Sorting in Groups: The
Problem of Too Many Stars,” in M. Thomas Hunt (ed.), Status and Groups, JAI.
Pelled, L. H., 1993, “Team Diversity and Conflict: A Multivariate Analysis,” Working Paper.
Pelled, L. H., K. M. Eisenhardt, and K. R. Xin, 1997, “Demographic Diversity in Work
Groups: An Empirical Assessment of Linkages to Intragroup Conflict and Performance,”
Working Paper, School of Business, University of Southern California.
26

Pelled, L. H., K. M. Eisenhardt, and K. R. Xin, 1999, “Exploring the Black Box: An Analysis
of Work Group Diversity, Conflict and Performance,” Administrative Science Quarterly,
44, 1–28.
Pfeffer, J., 1985, “Organizational Demography: Implications for Management,” California
Management Review, 28, 67–81.
Prather, L. J., and K. L. Middleton, 2002, “Are N+1 Heads Better Than One? - The Case of
Mutual Fund Managers,” Journal of Economic Behavior and Organization, 47, 103–120.
Randel, A. E., 2002, “Identity Salience: A Moderator of the Relationship Between Group
Gender Composition and Work Group Conflict,” Journal of Organizational Behavior, 23,
749 – 766.
Richard, O. C., 2000, “Racial Diversity, Business Strategy, and Firm Performance: A
Resource-Based View,” Academy of Management Journal, 43, 164–177.
Roberts, K. H., and C. A. O’Reilly, 1979, “Some Correlates of Communication Roles in
Organizations,” Academy of Management Journal, 22, 42–57.
Schwenk, C., and J. S. Valacich, 1994, “Effects of Devil’s Advocacy and Dialectical Inquiry
on Individuals versus Groups,” Organizational Behavior and Human Decision Processes,
59, 210–222.
Siciliano, J. I., 1996, “The Relationship of Board Member Diversity to Organizational Per-
formance,” Journal of Business Ethics, 15.
Simons, T., L. H. Pelled, and K. A. Smith, 1999, “Making Use of Difference: Diversity,
Debate and Decision Comprehensiveness in Top Management Teams,” Academy of Man-
agement Journal, 42, 662–673.
Smith, K. G., K. A. Smith, J. D. Olian, H. P. Sims, D. P. O’Bannon, and J. A. Scully, 1994,
“Top Management Team Demography and Process: The Role of Social Integration and
Communication,” Administrative Science Quarterly, 39, 412–438.
27

Teachman, J. D., 1980, “Analysis of Population Diversity,” Sociological Methods and Re-
search, 8, 341–362.
Timmerman, T. A., 2000, “Racial Diversity, Age Diversity, Interdependence, and Team
Performance,” Small Group Research, 31, 592–606.
Tjosvold, D., 1991, The Conflict-Positive Organisation, Addison Wesley.
Williams, K., and C. A. O’Reilly, 1998, “Demography and Diversity in Organizations,” in
Barry M. Staw, and Robert M. Sutton (ed.), Research in Organizational Behavior . pp.
77–140, JAI Press.
28
CFR WCFR WCFR WCFR Working orking orking orking Paper SPaper SPaper SPaper Serieserieserieseries
Centre for Financial ResearchCentre for Financial ResearchCentre for Financial ResearchCentre for Financial Research CologneCologneCologneCologne
CFR Working Papers are available for download from www.cfrwww.cfrwww.cfrwww.cfr----cologne.decologne.decologne.decologne.de. Hardcopies can be ordered from: Centre for Financial Research (CFR), Albertus Magnus Platz, 50923 Koeln, Germany. 2012201220122012 No. Author(s) Title
12-06 A. Kempf, A. Pütz,
F. Sonnenburg Fund Manager Duality: Impact on Performance and Investment Behavior
12-05 R. Wermers Runs on Money Market Mutual Funds 12-04 R. Wermers A matter of style: The causes and consequences of style drift
in institutional portfolios 12-03 C. Andres, A. Betzer, I.
van den Bongard, C. Haesner, E. Theissen
Dividend Announcements Reconsidered: Dividend Changes versus Dividend Surprises
12-02 C. Andres, E. Fernau, E. Theissen
Is It Better To Say Goodbye? When Former Executives Set Executive Pay
12-01 L. Andreu, A. Pütz Are Two Business Degrees Better Than One?
Evidence from Mutual Fund Managers' Education 2011201120112011 No. Author(s) Title
11-16 V. Agarwal, J.-P. Gómez,
R. Priestley Management Compensation and Market Timing under Portfolio Constraints
11-15 T. Dimpfl, S. Jank Can Internet Search Queries Help to Predict Stock Market
Volatility? 11-14 P. Gomber,
U. Schweickert, E. Theissen
Liquidity Dynamics in an Electronic Open Limit Order Book: An Event Study Approach
11-13 D. Hess, S. Orbe Irrationality or Efficiency of Macroeconomic Survey Forecasts?
Implications from the Anchoring Bias Test 11-12 D. Hess, P. Immenkötter Optimal Leverage, its Benefits, and the Business Cycle 11-11 N. Heinrichs, D. Hess,
C. Homburg, M. Lorenz, S. Sievers
Extended Dividend, Cash Flow and Residual Income Valuation Models – Accounting for Deviations from Ideal Conditions
11-10 A. Kempf, O. Korn, S. Saßning
Portfolio Optimization using Forward - Looking Information

11-09 V. Agarwal, S. Ray Determinants and Implications of Fee Changes in the Hedge Fund Industry
11-08 G. Cici, L.-F. Palacios On the Use of Options by Mutual Funds: Do They Know What They Are Doing?
11-07 V. Agarwal, G. D. Gay, L. Ling
Performance inconsistency in mutual funds: An investigation of window-dressing behavior
11-06 N. Hautsch, D. Hess, D. Veredas
The Impact of Macroeconomic News on Quote Adjustments, Noise, and Informational Volatility
11-05 G. Cici The Prevalence of the Disposition Effect in Mutual Funds' Trades
11-04 S. Jank Mutual Fund Flows, Expected Returns and the Real Economy
11-03 G.Fellner, E.Theissen
Short Sale Constraints, Divergence of Opinion and Asset Value: Evidence from the Laboratory
11-02 S.Jank Are There Disadvantaged Clienteles in Mutual Funds?
11-01 V. Agarwal, C. Meneghetti The Role of Hedge Funds as Primary Lenders 2010201020102010
No. Author(s) Title
10-20
G. Cici, S. Gibson, J.J. Merrick Jr.
Missing the Marks? Dispersion in Corporate Bond Valuations Across Mutual Funds
10-19 J. Hengelbrock,
E. Theissen, C. Westheide Market Response to Investor Sentiment
10-18 G. Cici, S. Gibson The Performance of Corporate-Bond Mutual Funds:
Evidence Based on Security-Level Holdings
10-17 D. Hess, D. Kreutzmann,
O. Pucker Projected Earnings Accuracy and the Profitability of Stock Recommendations
10-16 S. Jank, M. Wedow Sturm und Drang in Money Market Funds: When Money Market Funds Cease to Be Narrow
10-15 G. Cici, A. Kempf, A. Puetz
The Valuation of Hedge Funds’ Equity Positions
10-14 J. Grammig, S. Jank Creative Destruction and Asset Prices
10-13 S. Jank, M. Wedow Purchase and Redemption Decisions of Mutual Fund Investors and the Role of Fund Families
10-12 S. Artmann, P. Finter, A. Kempf, S. Koch, E. Theissen
The Cross-Section of German Stock Returns: New Data and New Evidence
10-11 M. Chesney, A. Kempf The Value of Tradeability
10-10 S. Frey, P. Herbst The Influence of Buy-side Analysts on Mutual Fund Trading
10-09 V. Agarwal, W. Jiang, Y. Tang, B. Yang
Uncovering Hedge Fund Skill from the Portfolio Holdings They Hide
10-08 V. Agarwal, V. Fos, W. Jiang
Inferring Reporting Biases in Hedge Fund Databases from Hedge Fund Equity Holdings
10-07 V. Agarwal, G. Bakshi, Do Higher-Moment Equity Risks Explain Hedge Fund

J. Huij Returns?
10-06 J. Grammig, F. J. Peter Tell-Tale Tails
10-05 K. Drachter, A. Kempf Höhe, Struktur und Determinanten der Managervergütung- Eine Analyse der Fondsbranche in Deutschland
10-04
J. Fang, A. Kempf, M. Trapp
Fund Manager Allocation
10-03 P. Finter, A. Niessen-Ruenzi, S. Ruenzi
The Impact of Investor Sentiment on the German Stock Market
10-02 D. Hunter, E. Kandel, S. Kandel, R. Wermers
Endogenous Benchmarks
10-01
S. Artmann, P. Finter, A. Kempf
Determinants of Expected Stock Returns: Large Sample Evidence from the German Market
2009200920092009 No. Author(s) Title
09-17
E. Theissen
Price Discovery in Spot and Futures Markets: A Reconsideration
09-16 M. Trapp Trading the Bond-CDS Basis – The Role of Credit Risk and Liquidity
09-15 A. Betzer, J. Gider, D.Metzger, E. Theissen
Strategic Trading and Trade Reporting by Corporate Insiders
09-14 A. Kempf, O. Korn, M. Uhrig-Homburg
The Term Structure of Illiquidity Premia
09-13 W. Bühler, M. Trapp Time-Varying Credit Risk and Liquidity Premia in Bond and CDS Markets
09-12 W. Bühler, M. Trapp
Explaining the Bond-CDS Basis – The Role of Credit Risk and Liquidity
09-11 S. J. Taylor, P. K. Yadav, Y. Zhang
Cross-sectional analysis of risk-neutral skewness
09-10 A. Kempf, C. Merkle, A. Niessen-Ruenzi
Low Risk and High Return – Affective Attitudes and Stock Market Expectations
09-09 V. Fotak, V. Raman, P. K. Yadav
Naked Short Selling: The Emperor`s New Clothes?
09-08 F. Bardong, S.M. Bartram, P.K. Yadav
Informed Trading, Information Asymmetry and Pricing of Information Risk: Empirical Evidence from the NYSE
09-07 S. J. Taylor , P. K. Yadav, Y. Zhang
The information content of implied volatilities and model-free volatility expectations: Evidence from options written on individual stocks
09-06 S. Frey, P. Sandas The Impact of Iceberg Orders in Limit Order Books
09-05 H. Beltran-Lopez, P. Giot, J. Grammig
Commonalities in the Order Book
09-04 J. Fang, S. Ruenzi Rapid Trading bei deutschen Aktienfonds: Evidenz aus einer großen deutschen Fondsgesellschaft
09-03 A. Banegas, B. Gillen, A. Timmermann, R. Wermers
The Performance of European Equity Mutual Funds

09-02 J. Grammig, A. Schrimpf, M. Schuppli
Long-Horizon Consumption Risk and the Cross-Section of Returns: New Tests and International Evidence
09-01 O. Korn, P. Koziol The Term Structure of Currency Hedge Ratios
2008200820082008 No. Author(s) Title
08-12
U. Bonenkamp, C. Homburg, A. Kempf
Fundamental Information in Technical Trading Strategies
08-11 O. Korn Risk Management with Default-risky Forwards
08-10 J. Grammig, F.J. Peter International Price Discovery in the Presence of Market Microstructure Effects
08-09 C. M. Kuhnen, A. Niessen Public Opinion and Executive Compensation
08-08 A. Pütz, S. Ruenzi Overconfidence among Professional Investors: Evidence from Mutual Fund Managers
08-07 P. Osthoff What matters to SRI investors?
08-06 A. Betzer, E. Theissen Sooner Or Later: Delays in Trade Reporting by Corporate Insiders
08-05 P. Linge, E. Theissen Determinanten der Aktionärspräsenz auf
Hauptversammlungen deutscher Aktiengesellschaften 08-04 N. Hautsch, D. Hess,
C. Müller
Price Adjustment to News with Uncertain Precision
08-03 D. Hess, H. Huang, A. Niessen
How Do Commodity Futures Respond to Macroeconomic News?
08-02 R. Chakrabarti, W. Megginson, P. Yadav
Corporate Governance in India
08-01 C. Andres, E. Theissen Setting a Fox to Keep the Geese - Does the Comply-or-Explain Principle Work?
2007200720072007 No. Author(s) Title
07-16
M. Bär, A. Niessen, S. Ruenzi
The Impact of Work Group Diversity on Performance: Large Sample Evidence from the Mutual Fund Industry
07-15 A. Niessen, S. Ruenzi Political Connectedness and Firm Performance: Evidence From Germany
07-14 O. Korn Hedging Price Risk when Payment Dates are Uncertain
07-13 A. Kempf, P. Osthoff SRI Funds: Nomen est Omen
07-12 J. Grammig, E. Theissen, O. Wuensche
Time and Price Impact of a Trade: A Structural Approach
07-11 V. Agarwal, J. R. Kale On the Relative Performance of Multi-Strategy and Funds of Hedge Funds
07-10 M. Kasch-Haroutounian, E. Theissen
Competition Between Exchanges: Euronext versus Xetra
07-09 V. Agarwal, N. D. Daniel, N. Y. Naik
Do hedge funds manage their reported returns?

07-08 N. C. Brown, K. D. Wei, R. Wermers
Analyst Recommendations, Mutual Fund Herding, and Overreaction in Stock Prices
07-07 A. Betzer, E. Theissen Insider Trading and Corporate Governance: The Case of Germany
07-06 V. Agarwal, L. Wang Transaction Costs and Value Premium
07-05 J. Grammig, A. Schrimpf Asset Pricing with a Reference Level of Consumption: New Evidence from the Cross-Section of Stock Returns
07-04 V. Agarwal, N.M. Boyson, N.Y. Naik
Hedge Funds for retail investors? An examination of hedged mutual funds
07-03 D. Hess, A. Niessen The Early News Catches the Attention: On the Relative Price Impact of Similar Economic Indicators
07-02 A. Kempf, S. Ruenzi, T. Thiele
Employment Risk, Compensation Incentives and Managerial Risk Taking - Evidence from the Mutual Fund Industry -
07-01 M. Hagemeister, A. Kempf CAPM und erwartete Renditen: Eine Untersuchung auf Basis der Erwartung von Marktteilnehmern
2006200620062006 No. Author(s) Title
06-13
S. Čeljo-Hörhager, A. Niessen
How do Self-fulfilling Prophecies affect Financial Ratings? - An experimental study
06-12 R. Wermers, Y. Wu, J. Zechner
Portfolio Performance, Discount Dynamics, and the Turnover of Closed-End Fund Managers
06-11 U. v. Lilienfeld-Toal, S. Ruenzi
Why Managers Hold Shares of Their Firm: An Empirical Analysis
06-10 A. Kempf, P. Osthoff The Effect of Socially Responsible Investing on Portfolio Performance
06-09 R. Wermers, T. Yao, J. Zhao
Extracting Stock Selection Information from Mutual Fund holdings: An Efficient Aggregation Approach
06-08 M. Hoffmann, B. Kempa The Poole Analysis in the New Open Economy Macroeconomic Framework
06-07 K. Drachter, A. Kempf, M. Wagner
Decision Processes in German Mutual Fund Companies: Evidence from a Telephone Survey
06-06 J.P. Krahnen, F.A. Schmid, E. Theissen
Investment Performance and Market Share: A Study of the German Mutual Fund Industry
06-05 S. Ber, S. Ruenzi On the Usability of Synthetic Measures of Mutual Fund Net-Flows
06-04 A. Kempf, D. Mayston Liquidity Commonality Beyond Best Prices
06-03 O. Korn, C. Koziol Bond Portfolio Optimization: A Risk-Return Approach
06-02 O. Scaillet, L. Barras, R. Wermers
False Discoveries in Mutual Fund Performance: Measuring Luck in Estimated Alphas
06-01 A. Niessen, S. Ruenzi Sex Matters: Gender Differences in a Professional Setting 2005200520052005
No. Author(s) Title
05-16
E. Theissen
An Analysis of Private Investors´ Stock Market Return Forecasts

05-15 T. Foucault, S. Moinas, E. Theissen
Does Anonymity Matter in Electronic Limit Order Markets
05-14 R. Kosowski, A. Timmermann, R. Wermers, H. White
Can Mutual Fund „Stars“ Really Pick Stocks? New Evidence from a Bootstrap Analysis
05-13 D. Avramov, R. Wermers Investing in Mutual Funds when Returns are Predictable
05-12 K. Griese, A. Kempf Liquiditätsdynamik am deutschen Aktienmarkt
05-11 S. Ber, A. Kempf, S. Ruenzi
Determinanten der Mittelzuflüsse bei deutschen Aktienfonds
05-10 M. Bär, A. Kempf, S. Ruenzi
Is a Team Different From the Sum of Its Parts? Evidence from Mutual Fund Managers
05-09 M. Hoffmann Saving, Investment and the Net Foreign Asset Position
05-08 S. Ruenzi Mutual Fund Growth in Standard and Specialist Market Segments
05-07 A. Kempf, S. Ruenzi Status Quo Bias and the Number of Alternatives - An Empirical Illustration from the Mutual Fund Industry
05-06 J. Grammig, E. Theissen Is Best Really Better? Internalization of Orders in an Open Limit Order Book
05-05 H. Beltran-Lopez, J.
Grammig, A.J. Menkveld Limit order books and trade informativeness
05-04 M. Hoffmann Compensating Wages under different Exchange rate Regimes
05-03 M. Hoffmann Fixed versus Flexible Exchange Rates: Evidence from Developing Countries
05-02 A. Kempf, C. Memmel Estimating the Global Minimum Variance Portfolio
05-01 S. Frey, J. Grammig Liquidity supply and adverse selection in a pure limit order book market
2004200420042004 No. Author(s) Title
04-10
N. Hautsch, D. Hess
Bayesian Learning in Financial Markets – Testing for the Relevance of Information Precision in Price Discovery
04-09 A. Kempf, K. Kreuzberg Portfolio Disclosure, Portfolio Selection and Mutual Fund Performance Evaluation
04-08 N.F. Carline, S.C. Linn, P.K. Yadav
Operating performance changes associated with corporate mergers and the role of corporate governance
04-07 J.J. Merrick, Jr., N.Y. Naik, P.K. Yadav
Strategic Trading Behaviour and Price Distortion in a Manipulated Market: Anatomy of a Squeeze
04-06 N.Y. Naik, P.K. Yadav Trading Costs of Public Investors with Obligatory and Voluntary Market-Making: Evidence from Market Reforms
04-05 A. Kempf, S. Ruenzi Family Matters: Rankings Within Fund Families and Fund Inflows
04-04 V. Agarwal, N.D. Daniel, N.Y. Naik
Role of Managerial Incentives and Discretion in Hedge Fund Performance
04-03 V. Agarwal, W.H. Fung, J.C. Loon, N.Y. Naik
Risk and Return in Convertible Arbitrage: Evidence from the Convertible Bond Market
04-02 A. Kempf, S. Ruenzi Tournaments in Mutual Fund Families

04-01 I. Chowdhury, M. Hoffmann, A. Schabert
Inflation Dynamics and the Cost Channel of Monetary Transmission

Cfr/University of cologne
Albertus-Magnus-Platz
D-50923 Cologne
Fon +49(0)221-470-6995
Fax +49(0)221-470-3992