Why Invest Internationally NOW? - Buffalo Funds · international equities have ... CFA Nicole...
13
Why Invest Internationally NOW? PM INSIGHTS October 2017 Over the past 9 months, we have detected a change in market leadership, as international equities have started to outperform their domestic counterparts. In this latest report, learn why now might be the time to rethink your international equity exposure and possibly increase your international allocation levels. Discover in-depth insights on current and prospective trends from the viewpoint of our international portfolio managers. Insights provided by Buffalo International Fund portfolio managers: Bill Kornitzer, CFA Nicole Kornitzer, CFA
Transcript of Why Invest Internationally NOW? - Buffalo Funds · international equities have ... CFA Nicole...

Why Invest Internationally
NOW?
PM INSIGHTS October 2017
Over the past 9 months, we have detected a change in market leadership, as international equities have started to outperform their domestic counterparts.
In this latest report, learn why now might be the time to rethink your international equity exposure and possibly increase your international allocation levels.
Discover in-depth insights on current and prospective trends from the viewpoint of our international portfolio managers.
Insights provided by Buffalo International Fund portfolio managers:
Bill Kornitzer, CFANicole Kornitzer, CFA

In this latest edition of Buffalo Funds’ PM Insights, our International Fund portfolio managers, who operate within the international equity asset classes on a daily basis, share their view of international markets. Based on a multitude of global market factors, we believe now is the time for investors to rethink international equity exposure and consider increasing international stock allocations.
“Why Invest Internationally NOW?”
Bill Kornitzer, CFAPortfolio Manager
25 years experience
Nicole Kornitzer, CFAPortfolio Manager
17 years experience
International Fund
(800) 49-BUFFALO | [email protected] | buffalofunds.comOctober 2017 1
SUMMARY
• International equities have underperformed their domestic (U.S.) counter-parts over the past 3, 5, and 10-year periods1, as international economies have lagged the U.S. by a couple of years.
• International equities appear ready to take a leadership role as they have begun to outperform domestic equities in 2017, and the international market cycle has a long recovery ahead.
• Valuations appear cheaper for most international stocks compared to U.S. stocks, and the credit cycle in global markets is still very accommodative.
• Sophisticated long-term institutional investors continue to increase their exposure to international equities.
INVESTING INTERNATIONALLY
Seasoned, educated investors know the historical and theoretical benefits of allocating a portion of their overall portfolio to international equity. The primary potential benefit is exposure to faster-growing economies and companies located outside of the U.S., combined with better risk- adjusted returns because of diversification, when compared to a U.S. equity-only portfolio.
While some investors consider international equities “mainstream”, many do not realize the pool of U.S. listed companies is dwarfed by the number of international company listings. According to The World Bank there are nearly eight times the number of foreign stocks as there are U.S. stocks.
Over the last 10 years, the number of listed companies in the U.S. has decreased by 16%, while the number of foreign listed companies has stayed relatively flat.
# of Listed Companies
Foreign Stocks38,861
U.S. Stocks 4,331
source: World Federation of Exchanges; as of 9/30/17
PM INSIGHTS

“Why Invest Internationally NOW?”
International Fund
(800) 49-BUFFALO | [email protected] | buffalofunds.comOctober 2017 2
Additionally, the cumulative market capitalization of internationalcompanies makes up almost half of the world’s total equity investment universe, as measured by the market capitalization of the MSCI ACWI Index, a broad-based global benchmark.
Based on the sheer number of public companies listed in foreign markets, it is hard to argue that international equities can be as efficiently priced as their U.S. counterparts. It also likely that most investors have little actual investment exposure corresponding to the market cap weightings in the index.
We believe that because of domestic bias, many U.S. investors consider international equity to be mere window dressing and allocate minimal exposure to the asset class when devising an investment plan.
Until recently, international equities have not been particularly rewarding over the past 10 years, and investors with significant foreign exposure may not be feeling particularly predisposed in favor of the asset class. One of the tenets of asset allocation between domestic U.S. equity and international equity is that they often take turns outperforming, and sometimes the outperformance is dramatic and long-lasting. The S&P 500 has made a significant run over the past 10 years outperforming the MSCI EAFE Index by 3.8% on an annualized basis through 9/30/17.
More recently, however, there has been a change in leadership, and international equity has outper-formed its domestic counterpart this year (see chart below). Unless investors have been diligent with portfolio rebalancing over the past decade, it is possible, if not likely, that their international exposure is below a suggested target level due to the underperformance of the asset class.
Market Cap % of MSCI AC World Index
U.S. Stocks
53%
ForeignStocks
47%
source: MSCI; as of 9/30/17
9-Month Performance of the S&P 500 vs MSCI AC World Index
source: Bloomberg Finance
January February March April May June July August September
20%
15%
10%
5%
0%
MSCI ACWI ex US IndexS&P 500 Index
2017 2017
Index performance is not indicative of the Fund's performance. Past performance does not guarantee future results. Current performance can be obtained by calling (800) 49-BUFFALO.

International Fund
(800) 49-BUFFALO | [email protected] | buffalofunds.comOctober 2017 3
As indicated in the previous chart, international equity performance has improved over the past 9 months, partly due to higher growth rates in international economies, better company valuations, and stronger investor flows into international capital markets. Statistically speaking, reversion to the mean -- “what goes around, comes around” -- appears to be in play. While we cannot guarantee if this trend is set to continue, we will point out additional factors in support of investing in interna-tional equity today.
ECONOMIC CYCLE & GDP GROWTH
Typically, international economic cycles have lagged the U.S. by 2-3 years. However, there are signs that the global environment is finally improving. Eurozone GDP growth surpassed that of the U.S. for the first time in years. While overseas growth data is strengthening, Eurozone leading economic indicators are up and accelerating, and investor sentiment in the region is trending higher.
Eurozone vs U.S. GDP Growth
Eurozone Leading
Economic Indicators
EurozoneInvestor
Sentiment
Dec Mar Jun Sep Dec Mar Jun Sep Dec Mar Jun 2014 2015 2016
107.00
106.00
105.00
104.00
103.00
OECD Euro AreaOECD Euro Area (yoy %)
2.202.001.801.601.401.201.000.80
Mar Jun Sep Dec Mar Jun Sep Dec Mar Jun 2015 2016 2017
4.003.503.002.502.001.501.00
EurozoneU.S.
2.20
2.00
1.80
1.60
1.40
Dec Mar Jun Sep Dec Mar Jun Sep Dec Mar Jun Sep2014 2015 2016 2017
30
20
10
0
-10
Sentix Investor Confidence Index
source: Bloomberg Finance
“Why Invest Internationally NOW?”
source: Bloomberg Finance
source: Bloomberg Finance
10%
12%
14%
16%
18%
20%
22%
24%
1980 1984 1988 1992 1996 2000 2004 2008 2012 2016 2020
International Fund
(800) 49-BUFFALO | [email protected] | buffalofunds.comOctober 2017 4
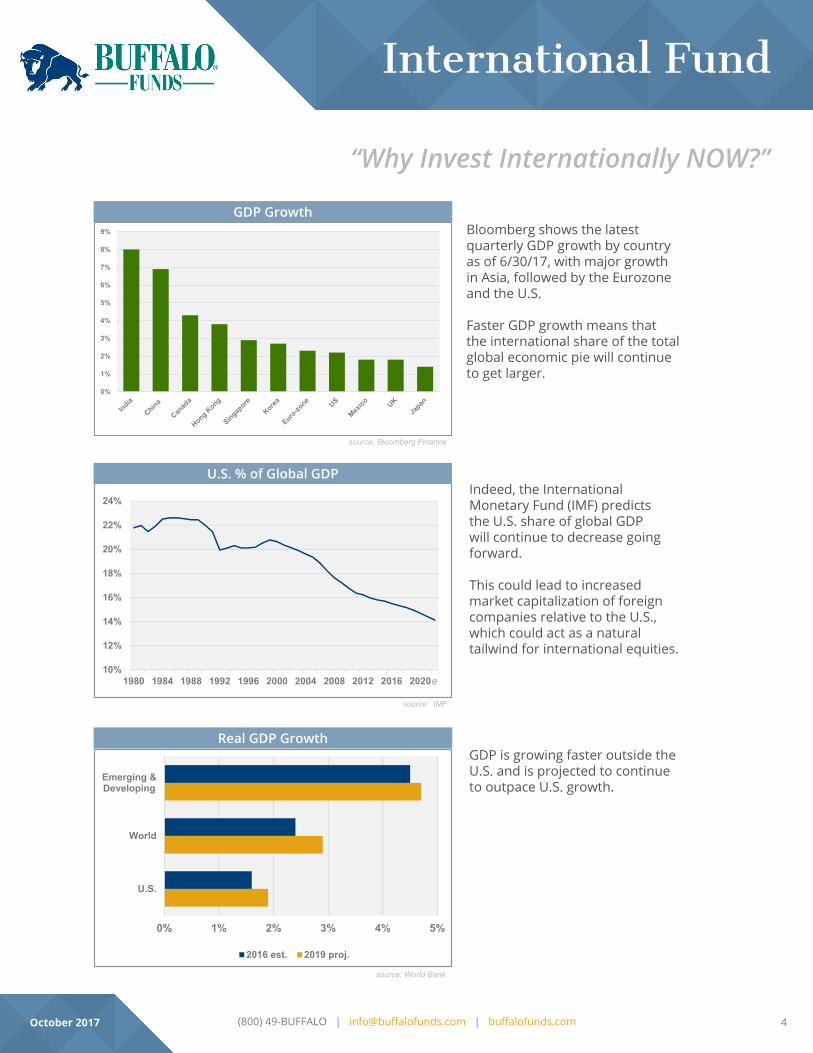
Bloomberg shows the latest quarterly GDP growth by country as of 6/30/17, with major growth in Asia, followed by the Eurozone and the U.S.
Faster GDP growth means that the international share of the total global economic pie will continue to get larger.
Japan 1.40%
0%
1%
2%
3%
4%
5%
6%
7%
8%
9%
GDP Growth
“Why Invest Internationally NOW?”
U.S. % of Global GDP
0% 1% 2% 3% 4% 5%
U.S.
World
Emerging &Developing
2016 est. 2019 proj.
Real GDP Growth
source: Bloomberg Finance
source: IMF
source: World Bank
e
Indeed, the International Monetary Fund (IMF) predicts the U.S. share of global GDP will continue to decrease going forward.
This could lead to increased market capitalization of foreign companies relative to the U.S., which could act as a natural tailwind for international equities.
GDP is growing faster outside the U.S. and is projected to continue to outpace U.S. growth.

0%
5%
10%
15%
20%
25%
30%
35%
40%
International Fund
(800) 49-BUFFALO | [email protected] | buffalofunds.comOctober 2017 5
GLOBAL SAVINGS RATES
Another helpful indicator to examine is the savings rate of countries around the world. As shown below, the U.S. savings rate is substantially lower than many foreign countries, including France, Germany, and the United Kingdom in the West and India and China in the East.
A smaller savings rate is not necessarily “bad”. However, we believe a higher savings rate implies a greater ability to invest (whether in stocks, bond, infrastructure, etc.) as a percent of the total economy.
Furthermore, as foreign economies continue to grow (potentially at rates faster than those of the U.S.), the amount of savings available for investment compounds. A virtuous cycle could then be created -- save more, invest more, grow more, repeat. Should that increasing investment be biased toward home countries, we believe it can only be positive for international equities relative to U.S. equities.
“Why Invest Internationally NOW?”
Household Savings Rates
source: savespendsplurge.com

-1%
0%
1%
2%
3%
4%
5%
6%
Sep2007
Sep2008
Sep2009
Sep2010
Sep2011
Sep2012
Sep2013
Sep2014
Sep2015
Sep2016
Sep2017
British Pound U.S. Dollar Japanese Yen
International Fund
(800) 49-BUFFALO | [email protected] | buffalofunds.comOctober 2017 6
CREDIT CYCLES
The next factor we highlight in support of investing internationally is related to the global credit cycle. In general, credit cycles for worldwide markets are still highly accommodative, with many foreign central banks attempting to expand the overall money supply to boost their economy, while those in the U.S. have begun to tighten on a relative basis.
Lower rates suggest the credit cycle is primed for higher growth outside of the United States. Credit expansion and accommodative monetary policy have historically been positive for economic growth, and both Europe and Japan are still leaning on the monetary accelerator.
To the extent that the base level of interest rates influences asset valuations, lower rates might suggest that higher valuations are appropriate in lower interest rate economies, all other things being equal.
“Why Invest Internationally NOW?”
10-Year Vanilla Interest Rate Swap Rates
source: Bloomberg Finance

0.40
3.20
8.0x
2.17 1.99
0.9x
0.00
1.00
2.00
3.00
4.00
5.00
6.00
7.00
8.00
9.00
10 yr Gov Yield Dividend Yield Ratio Div/10 yr Yld
Europe (STOXX 600) US (S&P 500)
rate
s / m
ultip
le
International Fund
(800) 49-BUFFALO | [email protected] | buffalofunds.comOctober 2017 7
Many economists also posit that there should be a tight relationship between interest rates and dividend yields. However, the rate and yield relationships in different economic regions does not seem to support those theories.
This may foreshadow an increase in the variance of returns across global markets, increasing the benefits from diversification though international investment.
“Why Invest Internationally NOW?”
Dividend Yields & Government Rates
source: Bloomberg Finance

International Fund
(800) 49-BUFFALO | [email protected] | buffalofunds.comOctober 2017 8
RELATIVE VALUATIONS
Even after the recent run-up in many foreign equity markets, valuations appear cheaper for interna-tional stocks, in general, than for U.S. stocks.
In many instances absolute valuation metrics, as measured by the Best P/E Ratio, are on the upper end of their 10-year range. While the MSCI ACWI Index is trading near its highs of 2009 and 2015, it has stabilized at roughly one standard deviation above the 10-year average, as noted by the upper dotted line on the chart below. Meanwhile, the S&P 500 Index is trading nearly two standard devia-tions above its 10-year average (second chart below).
“Why Invest Internationally NOW?”
Best P/E Ratio (MSCI ACWI Index)
2007 2008 2009 2010 2011 2012 2013 2014 2015 2016 2017
source: Bloomberg Finance
15.00
14.00
13.00
12.00
11.00
10.00
9.00
Best P/E Ratio (blended 12 month)Deviation 1Deviation -1Average Best P/E Ratio
Best P/E Ratio (S&P 500 Index)
2007 2008 2009 2010 2011 2012 2013 2014 2015 2016 2017
source: Bloomberg Finance
18.00
17.00
16.00
15.00
14.00
13.00
12.00
11.00
10.00
Best P/E Ratio (blended 12 month)Deviation 1Deviation -1Average Best P/E Ratio
The Best P/E Ratio of the MSCI ACWI Index still has not returned to its peak, while the S&P 500 Index continues to reach all-time highs.

0%
5%
10%
15%
20%
25%
ForwardPE
2 yearFPE
Price /Book
Price /Cash Flow
EV /EBITDA
Div Yield(as %)
S&P 500 MSCI ACWI ex US
International Fund
(800) 49-BUFFALO | [email protected] | buffalofunds.comOctober 2017 9
We believe much of the S&P 500 Index outperformance over the last five years was due to stock price multiple expansion. As indicated in the chart below, valuation multiples between the S&P 500 and the MSCI ACWI Ex-US Index were similar and correlations fairly tight in the early part of the last decade. However, over the last five years, the valuation gap between the U.S. and global markets has continued to expand and is now at its widest levels.
When we look at various other valuation metrics, the data is similar: ratios are higher across the board for U.S. equities compared to their international counterparts.
While we can’t predict how these metrics will compare over the next five years, it does raise the question: Will domestic market outperformance driven by further relative multiple expansion continue, or will there be a slow, steady reversion to the mean historical trends?
“Why Invest Internationally NOW?”
Best P/E Ratio
2007 2008 2009 2010 2011 2012 2013 2014 2015 2016 2017
source: Bloomberg Finance
18.00
16.00
14.00
12.00
10.00
8.00S&P 500 IndexMSCI ACWI Ex-US Index
International Valuations are Less Demanding
source: Bloomberg Finance

International Fund
(800) 49-BUFFALO | [email protected] | buffalofunds.comOctober 2017 10
LONG-TERM INVESTORS INCREASE WEIGHT TOWARD INTERNATIONAL EQUITIES
Despite the long run of outperformance by domestic markets, we have seen sophisticated investors continue to increase their relative weight to international equity.
David Swensen, the highly-regarded manager of Yale University’s $25.4 billion endowment fund, and inventor of what has become known as “the Yale Model” for his application of modern portfolio theory to long-term endowment assets, follows this broad long-term approach.
Swensen’s framework relies on mean-variance analysis, and he has gone a step further than tradi-tional reallocation would suggest.
While adding to new alternative asset classes over the past 20 years, he has also steadily shifted the endowment’s total equity holdings toward foreign equity at the expense of domestic equity. International exposure made up less than 40% of Yale’s total equity stake in 1997, but almost 80% in 2016.
“Why Invest Internationally NOW?”
30%
40%
50%
60%
70%
80%
90%
1997 1999 2001 2003 2005 2007 2009 2011 2013 2015
Yale Endowment’s Foreign Equity Allocation as Share of Total
source: Yale Endowment Fund Annual Report
Not to be outdone by its Ivy league counterpart, Harvard University’s $37.1 billion endowment has also significantly and systematically increased its exposure to international equities over the last few decades.
Harvard Endowment’s Foreign Equity Allocation
1980 1991 2000 2008 2015
0%
31%52% 65% 67%
U.S. Equities Non-U.S. Equitiessource: Harvard Endowment Fund Annual Report
“Less mainstream asset categories, by their very nature, tend to be less efficiently priced than tradi-tional domestic marketable securities, providing an opportunity to exploit market inefficiencies through active management,” says Swensen2. Swensen believes this approach statistically optimizes his portfolio.

International Fund
(800) 49-BUFFALO | [email protected] | buffalofunds.comOctober 2017 11
As specific asset classes underperform, traditional institutional portfolio reallocation models with long-term time horizons would suggest rotating funds into areas that have underperformed.
Swensen says individuals who do not have the same access to some of the sophisticated investment products and tools that large institutions do should probably “stick to a more traditional portfolio of 60% domestic and 40% foreign exposure for their public equity investments, with their remaining assets allocated in real estate, Treasury bonds and Treasury inflation-protected securities (TIPS).”
CONCLUSION
The severe underperformance of international markets of the past five years combined with foreign GDP growth continuing to outpace the U.S., in our opinion, are good indicators for investors to rethink their international equity exposure. With global savings rates well above the U.S. rate, a favorable credit cycles in international markets, and relative valuations inexpensive compared to the U.S., it would seem to suggest NOW is a relatively good time to have higher exposure to international equities.
ABOUT THE AUTHORS
Bill Kornitzer, CFA, Portfolio ManagerBill has been with the Buffalo Funds since 2004 and has 25 years of professional investment experience. Previously Bill was with USAA, Ernst & Young, and Arthur Andersen. At the Buffalo Funds, he works with equity portfolios, and his focus areas include technology, financial services, telecommunications, and food and beverage. Bill received a B.S. from Virginia Tech and an M.B.A. from Drexel University.
Nicole Kornitzer, CFA, Portfolio ManagerNicole has been with the Buffalo Funds since 2004 and has 17 years of professional investment experience. At the Buffalo Funds, Nicole works with equity portfolios, and her previous focus areas have included pharmaceuticals, medical diagnostics, and biotechnology. Her current focus is on European equities. Nicole received a B.A. from the University of Pennsylvania, an M.A. from Columbia University, and an M.B.A. from INSEAD.
“Why Invest Internationally NOW?”
ABOUT THE BUFFALO FUNDS
The Buffalo Funds are a family of 10 actively-managed mutual funds offering a variety of domestic equity, international equity, and income-generating investment strategies. Located in Mission, Kansas (a suburb of Kansas City), employee-owned Kornitzer Capital Management, Inc. (KCM) has been the exclusive investment advisor to the Funds since inception in 1994. At KCM, we believe that patient investing backed by solid, intelligent research is the best way to achieve potential long-term financial rewards. Disciplined investment decisions are made using a distinct, time-tested investment approach guided by trend analysis, rigorous fundamental company research, and strict security valuation parameters. Our fund family is characterized by a long-term growth investment strategy and a team-based, idea-sharing management style. “Trends and Patience” is our mantra, and our great strength.

International Fund
(800) 49-BUFFALO | [email protected] | buffalofunds.comOctober 2017
Definitions & Disclosures1 Average Annual Returns
2 Source: investments.yale.edu
Opinions expressed are subject to change, are not intended to be a forecast of future events, a guarantee of future results, nor investment advice. The S&P 500 Index is a capitalization weighted index of 500 large capitalization stocks which is designed to measure broad domestic securities markets. The MSCI ACWI Index is a capitalization weighted index designed to provide a broad measure of equity-market performance throughout the world. The MSCI ACWI is maintained by Morgan Stanley Capital International (MSCI) and is comprised of stocks from both developed and emerging markets. The MSCI ACWI Ex-US Index excludes the United States. The MSCI EAFE Index serves as a benchmark of the performance in major international equity markets as represented by 21 major MSCI indexes from Europe, Australia, and Southeast Asia. The Sentix Investor Confidence Index rates the relative six-month economic outlook for the Eurozone. The data is compiled from a survey of about 2,800 investors and analysts. A reading above zero indicates optimism; below indicates pessimism. The STOXX 600 Index represents 600 European stocks from 18 European countries, covering approximately 90% of the European stock market. It is not possible to invest directly in an index.
Standard deviation measures the distance from the mean in a set of data points, giving analysts an idea of the variance that could occur; used to illustrate volatility in a portfolio. P/E or “Price-Earnings” Ratio measures the current share price relative to its per-share earnings. Correlation is a statistic that measures the degree to which two securities move in relation to each other.Mutual fund investing involves risk; Principal loss is possible. The Fund may invest in smaller companies, which involve additional risks such as limited liquidity and greater volatility than larger companies. The Fund may invest in foreign securities which will involve political, economic and currency risks, greater volatility and differences in accounting methods. This risk is greater in emerging markets. Investments in debt securities typically decrease in value when interest rates rise. This risk is usually greater for longer-term debt securities. Past performance does not guarantee future results.
Diversification does not guarantee a profit or protect from loss in a declining market.
The Funds’ investment objectives, risks, charges and expenses must be considered carefully before investing. The statutory prospectus contains this and other important information about the investment company, and may be obtained by calling (800) 49-BUFFALO or visiting buffalofunds.com. Read carefully before investing.Kornitzer Capital Management is the advisor to the Buffalo Funds, which are distributed by Quasar Distributors, LLC.
INTERESTED IN MORE INFORMATION?
For questions or to speak with a relationship manager about adding any of the 10 Buffalo Funds to your portfolio, contact:
Scott [email protected](913) 754-1537
Joe [email protected](913) 647-9875
“Why Invest Internationally NOW?”
As of 9/30/17 3 Yr 5 Yr 10 YrMSCI ACWI Ex-US Index 4.70 6.97 1.30S&P 500 Index 10.81 14.22 7.44