WHY INVEST IN TURKEY? · The convenient location has enabled Turkey to tap significant export...
20
WHY INVEST IN TURKEY? July 2019
Transcript of WHY INVEST IN TURKEY? · The convenient location has enabled Turkey to tap significant export...
WHY INVEST IN TURKEY? July 2019
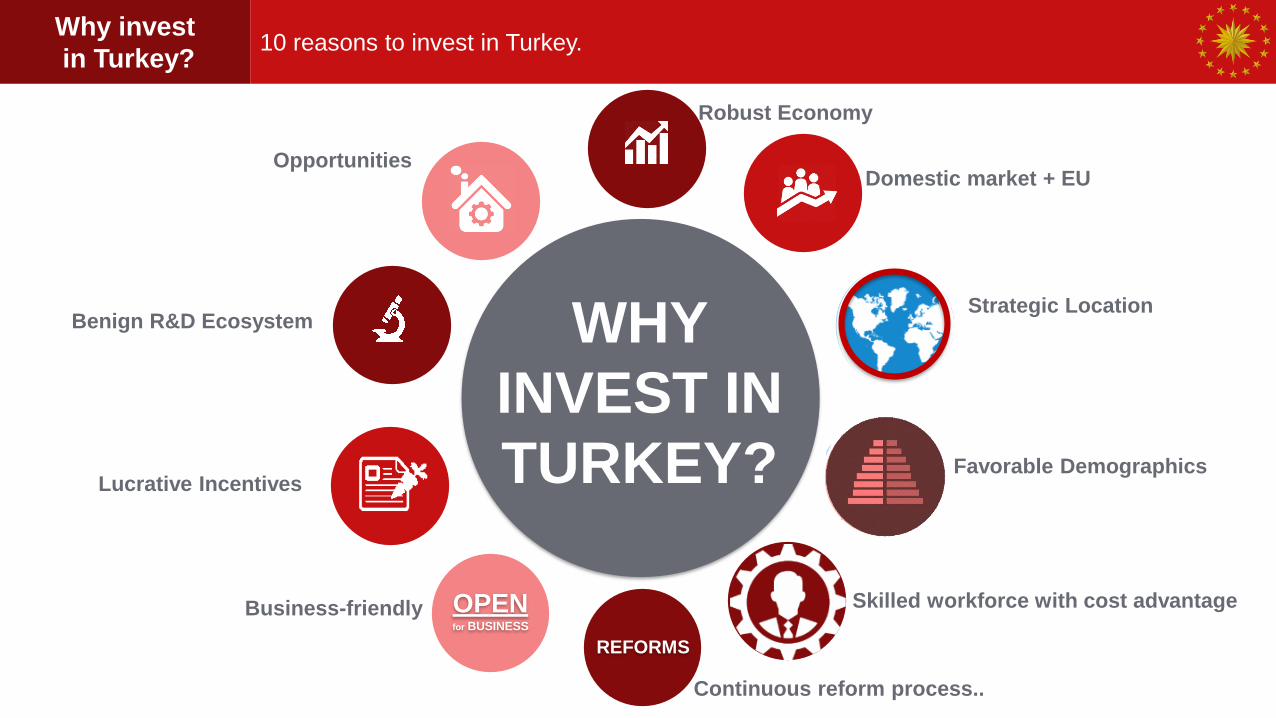
Strategic Location
Robust Economy
Domestic market + EU
Business-friendly
Benign R&D Ecosystem
Opportunities
Favorable Demographics
Skilled workforce with cost advantage
Lucrative Incentives
Continuous reform process..
REFORMS
OPENfor BUSINESS
Why invest
in Turkey?10 reasons to invest in Turkey.
WHY
INVEST IN
TURKEY?

Real GDP Growth (Index: 2002=100)Ranking of Economies by GDP at PPP
100
120
140
160
180
200
220
240
260
20
02
20
03
20
04
20
05
20
06
20
07
20
08
20
09
20
10
20
11
20
12
20
13
20
14
20
15
20
16
20
17
20
18
20
19
20
20
20
21
20
22
20
23
Source: TurkStat, OECD, World Bank, IMF, PPP: Purchasing Power Parity
13TH
LARGEST
ECONOMY 5.5 4.0 3.9 2.8 2.1
Robust
EconomyTrack record growth and bright future with proven resilience.
Average Annual GDP Growth (%), 2003-2018
Turkey Poland Romania Czechia Hungary
2003 2018
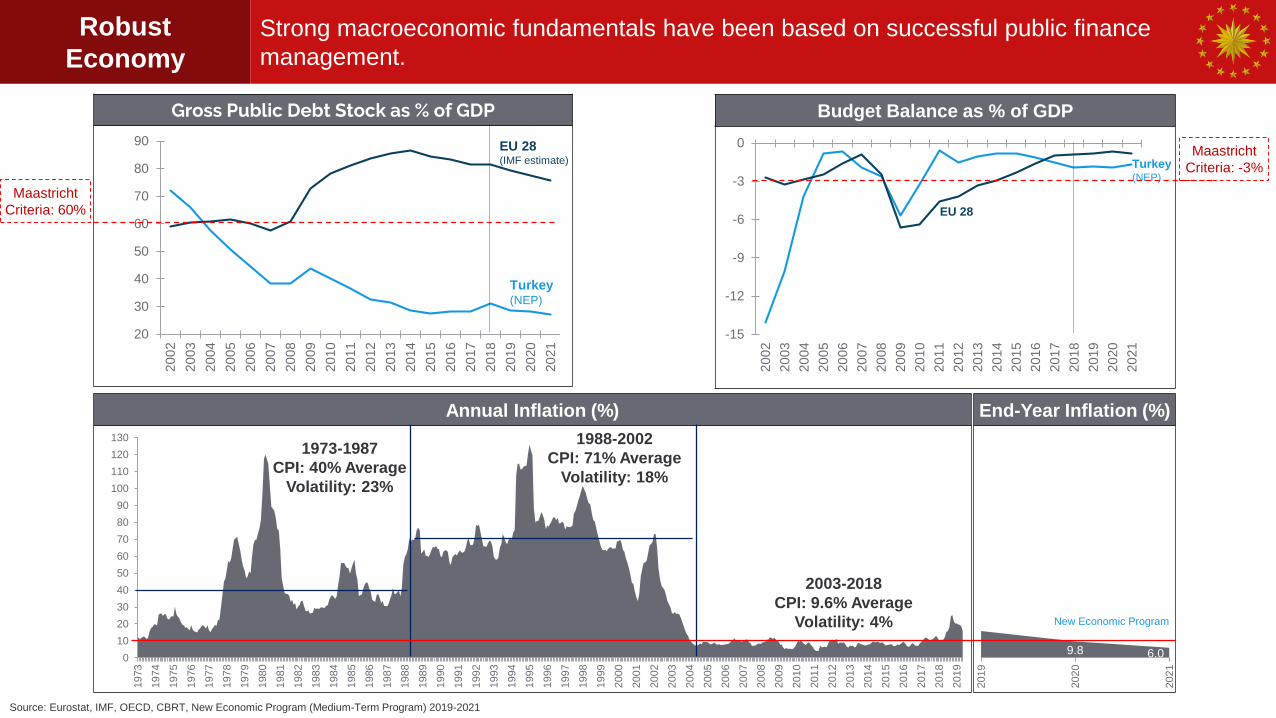
Budget Balance as % of GDPGross Public Debt Stock as % of GDP
Source: Eurostat, IMF, OECD, CBRT, New Economic Program (Medium-Term Program) 2019-2021
Robust
Economy
Strong macroeconomic fundamentals have been based on successful public finance
management.
-15
-12
-9
-6
-3
0
20
02
20
03
20
04
20
05
20
06
20
07
20
08
20
09
20
10
20
11
20
12
20
13
20
14
20
15
20
16
20
17
20
18
20
19
20
20
20
21
20
30
40
50
60
70
80
90
20
02
20
03
20
04
20
05
20
06
20
07
20
08
20
09
20
10
20
11
20
12
20
13
20
14
20
15
20
16
20
17
20
18
20
19
20
20
20
21
Turkey(NEP)
EU 28 (IMF estimate) Turkey
(NEP)
EU 28
Maastricht
Criteria: 60%
Maastricht
Criteria: -3%
End-Year Inflation (%)Annual Inflation (%)
0
10
20
30
40
50
60
70
80
90
100
110
120
130
1973
1974
1975
1976
1977
1978
1979
1980
1981
1982
1983
1984
1985
1986
1987
1988
1989
1990
1991
1992
1993
1994
1995
1996
1997
1998
1999
2000
2001
2002
2003
2004
2005
2006
2007
2008
2009
2010
2011
2012
2013
2014
2015
2016
2017
2018
2019
2003-2018
CPI: 9.6% Average
Volatility: 4%
1988-2002
CPI: 71% Average
Volatility: 18%
1973-1987
CPI: 40% Average
Volatility: 23%
9.8 6.0
2019
2020
2021
New Economic Program
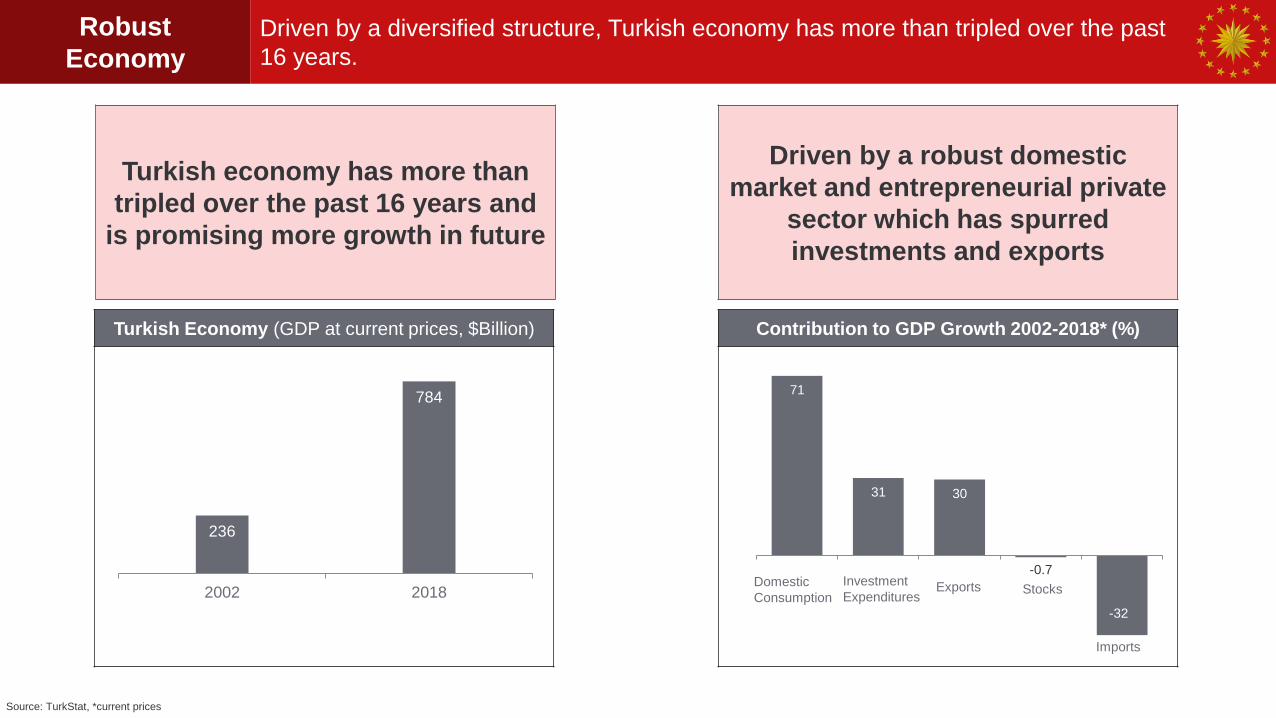
Contribution to GDP Growth 2002-2018* (%)
71
31 30
-0.7
-32
Turkish Economy (GDP at current prices, $Billion)
Turkish economy has more than
tripled over the past 16 years and
is promising more growth in future
Source: TurkStat, *current prices
Domestic
Consumption
Investment
Expenditures Stocks
Imports
Exports
236
784
2002 2018
Driven by a robust domestic
market and entrepreneurial private
sector which has spurred
investments and exports
Robust
Economy
Driven by a diversified structure, Turkish economy has more than tripled over the past
16 years.
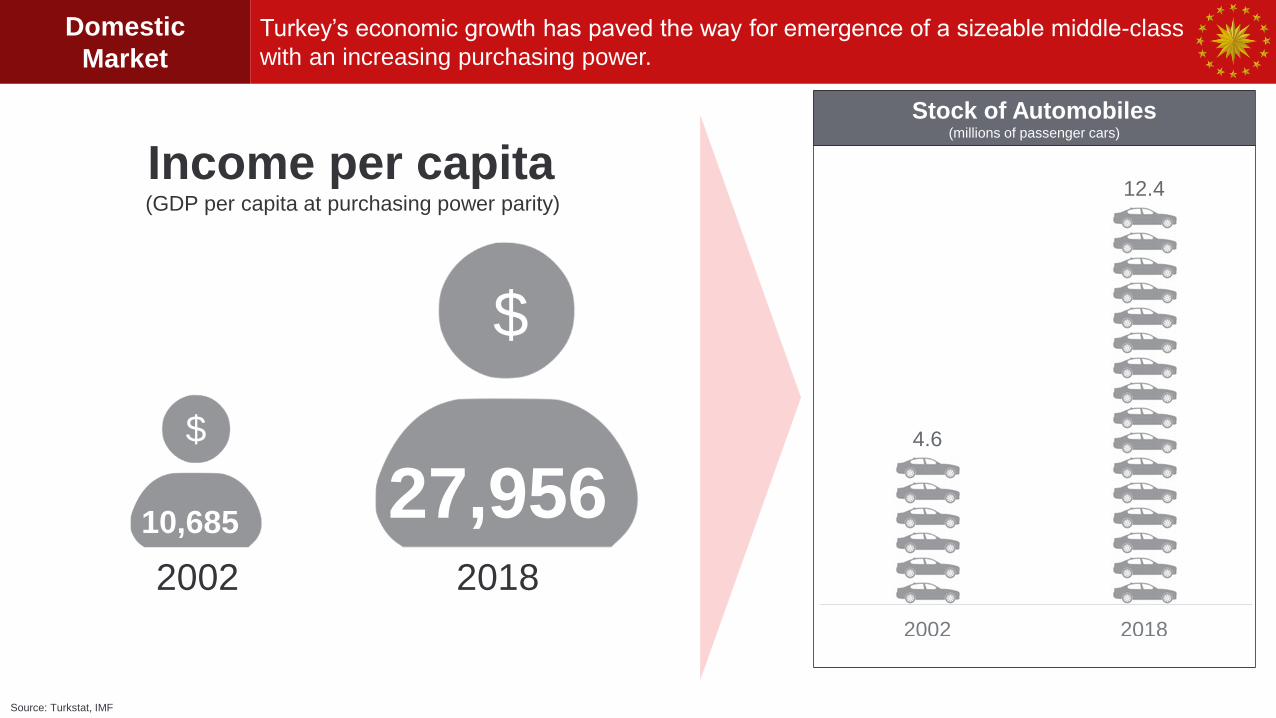
Stock of Automobiles(millions of passenger cars)
Source: Turkstat, IMF
Domestic
Market
Turkey’s economic growth has paved the way for emergence of a sizeable middle-class
with an increasing purchasing power.
4.6
12.4
2002 2018
10,685
$
27,956
$
Income per capita(GDP per capita at purchasing power parity)
2002 2018
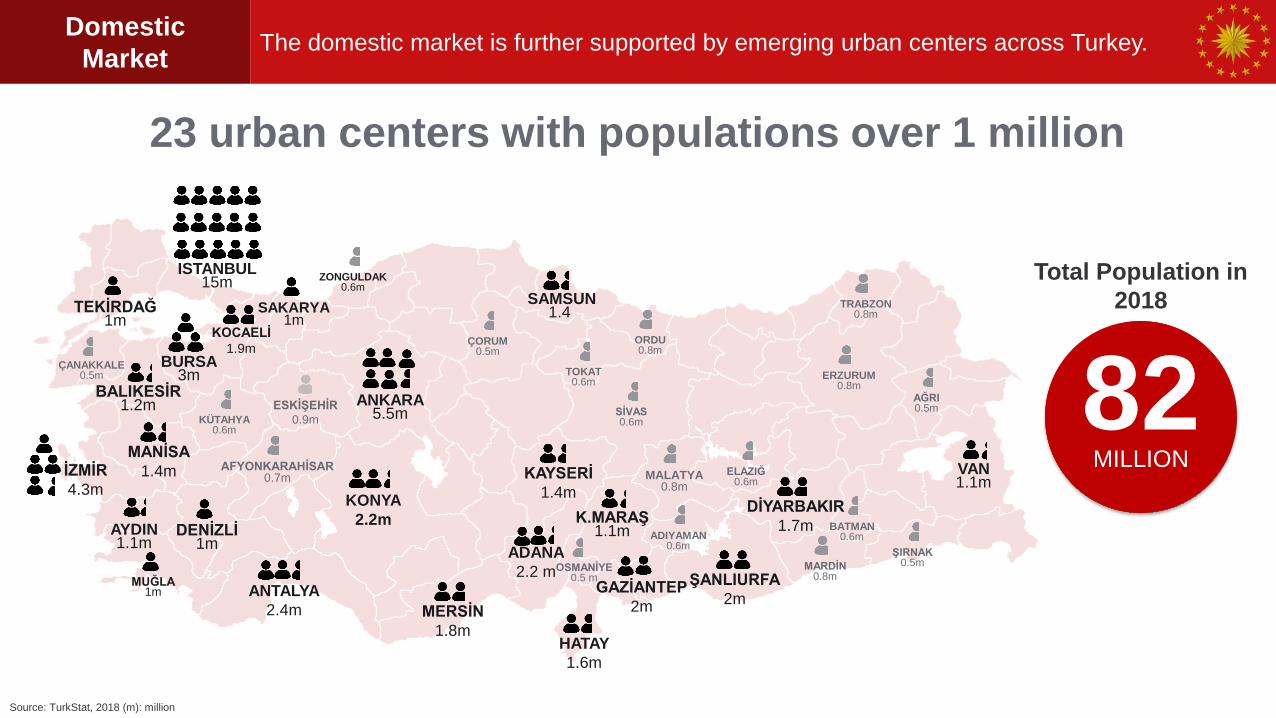
Source: TurkStat, 2018 (m): million
Domestic
MarketThe domestic market is further supported by emerging urban centers across Turkey.
23 urban centers with populations over 1 million
ISTANBUL15m
ANKARA5.5m
İZMİR
4.3m
BURSA3m
ANTALYA
2.4m
ADANA
2.2 m
KONYA
2.2m
ŞANLIURFA
2mGAZİANTEP
2m
KOCAELİ
1.9m
MERSİN
1.8m
DİYARBAKIR
1.7m
HATAY
1.6m
MANİSA
1.4m KAYSERİ
1.4m
SAMSUN1.4
BALIKESİR1.2m
K.MARAŞ1.1m
VAN1.1m
AYDIN1.1m
TEKİRDAĞ1m
DENİZLİ1m
SAKARYA1m
82MILLION
MUĞLA1m
ESKİŞEHİR
0.9m
MARDİN0.8m
TRABZON0.8m
MALATYA0.8m
ORDU0.8m
ERZURUM0.8m
AFYONKARAHİSAR0.7m
SİVAS0.6m
ADIYAMAN0.6m
TOKAT0.6m
ZONGULDAK0.6m
BATMAN0.6m
ELAZIĞ0.6m
KÜTAHYA0.6m
ÇANAKKALE0.5m
AĞRI0.5m
ÇORUM0.5m
OSMANİYE0.5 m
ŞIRNAK0.5m
Total Population in
2018

Source: Eurostat, Population as of 2017, Ministry of Economy
* In ratification process
Access to
in 27 countries
with Free Trade
Agreements
Customs
Union with the
EU allows
direct access
to the EU
Market+
+
Free Access
to
945million consumers
Domestic
Market + EUDomestic market + EU market + Free Trade Area
355million in
FTA Area
82million in
Turkey
510million
in EU

Strategic
Locationto manufacture, export and manage…
Production base for MENA
Its largest production facility worldwide
Exporting 85% of its production
Exporting 77% of its production
67 countries
80 countries
60 countries
30 countries
89 countries
72 countries
80 countries
63 countries
PROXIMITY TO
MAJOR
MARKETS1.5 billion people and $24T GDP
in Europe, MENA and Central
Asia at 4 hour flight-distance
CONNECTIVITYTurkish Airlines connects you to 255
destinations in 122 countries
MANUFACTURING
& EXPORT HUB
FOR
MULTINATIONALS
AS WELL AS
MANAGEMENT
HUB FOR
MULTINATIONALS
25 countries
Strategic
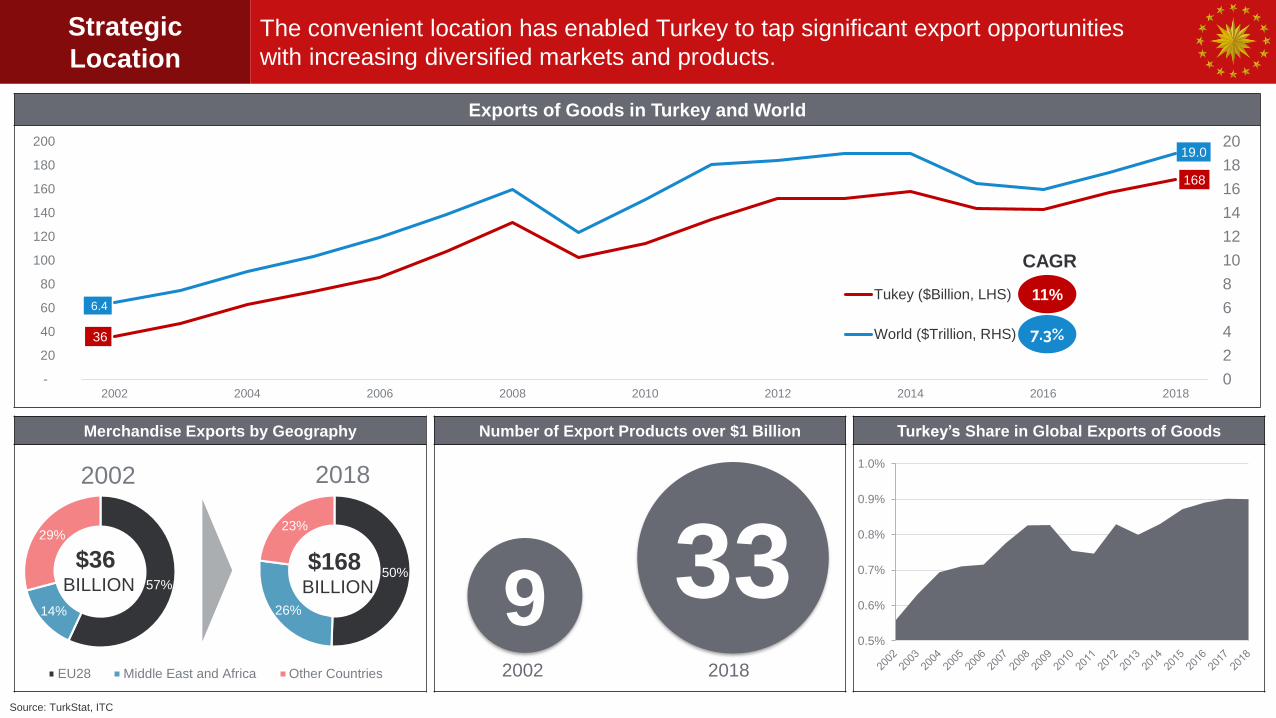
Location
The convenient location has enabled Turkey to tap significant export opportunities
with increasing diversified markets and products.
Merchandise Exports by Geography
Exports of Goods in Turkey and World
Source: TurkStat, ITC
36
168
6.4
19.0
0
2
4
6
8
10
12
14
16
18
20
-
20
40
60
80
100
120
140
160
180
200
2002 2004 2006 2008 2010 2012 2014 2016 2018
Tukey ($Billion, LHS)
World ($Trillion, RHS) 7.3%
57%
14%
29%
2002
EU28 Middle East and Africa Other Countries
50%
26%
23%
2018
Number of Export Products over $1 Billion
9 332002 2018
Turkey’s Share in Global Exports of Goods
$36 BILLION
$168 BILLION
0.5%
0.6%
0.7%
0.8%
0.9%
1.0%
11%
CAGR
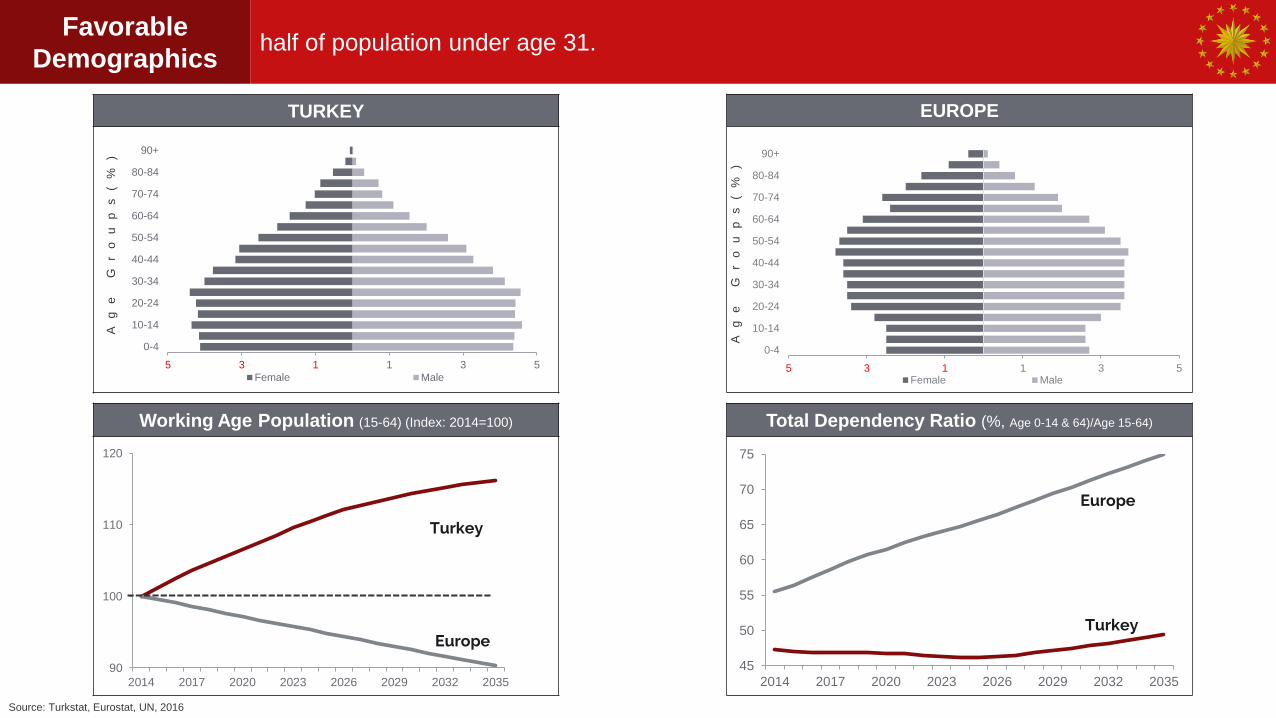
Working Age Population (15-64) (Index: 2014=100) Total Dependency Ratio (%, Age 0-14 & 64)/Age 15-64)
45
50
55
60
65
70
75
2014 2017 2020 2023 2026 2029 2032 2035
Europe
Turkey
90
100
110
120
2014 2017 2020 2023 2026 2029 2032 2035
Europe
Turkey
TURKEY EUROPE
5 3 1 1 3 5
0-4
10-14
20-24
30-34
40-44
50-54
60-64
70-74
80-84
90+
Female Male5 3 1 1 3 5
0-4
10-14
20-24
30-34
40-44
50-54
60-64
70-74
80-84
90+
Female Male
Source: Turkstat, Eurostat, UN, 2016
Ag
e
Gr
ou
ps
(%
)
Ag
e
Gr
ou
ps
(%
)
Favorable
Demographicshalf of population under age 31.
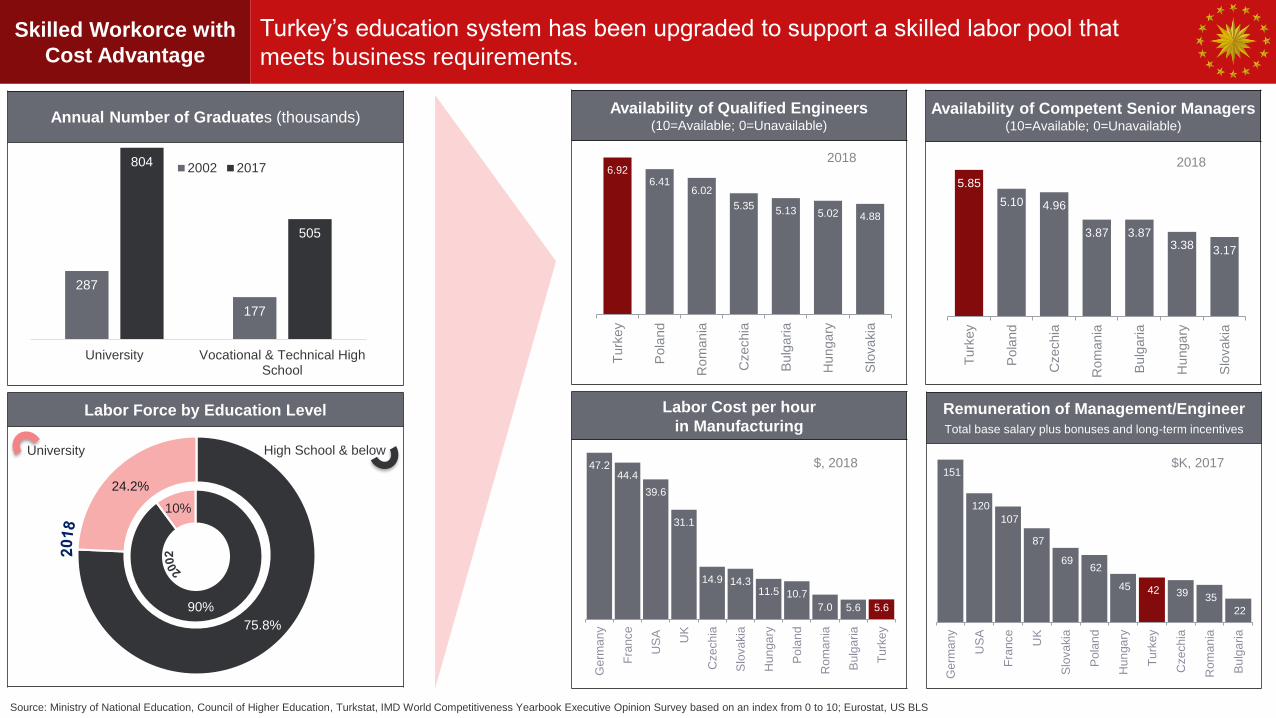
Labor Force by Education Level
75.8%
24.2%
90%
10%
Availability of Competent Senior Managers (10=Available; 0=Unavailable)
Availability of Qualified Engineers(10=Available; 0=Unavailable)
6.926.41
6.02
5.35 5.13 5.02 4.88
Turk
ey
Pola
nd
Ro
man
ia
Czechia
Bulg
aria
Hu
nga
ry
Slo
vakia
Annual Number of Graduates (thousands)
Source: Ministry of National Education, Council of Higher Education, Turkstat, IMD World Competitiveness Yearbook Executive Opinion Survey based on an index from 0 to 10; Eurostat, US BLS
Skilled Workorce with
Cost Advantage
Turkey’s education system has been upgraded to support a skilled labor pool that
meets business requirements.
287
177
804
505
University Vocational & Technical HighSchool
2002 2017
University High School & below
Labor Cost per hour
in Manufacturing
5.85
5.10 4.96
3.87 3.873.38 3.17
Turk
ey
Pola
nd
Czechia
Ro
man
ia
Bulg
aria
Hu
nga
ry
Slo
vakia
47.244.4
39.6
31.1
14.9 14.311.5 10.7
7.0 5.6 5.6G
erm
an
y
Fra
nce
US
A UK
Czech
ia
Slo
va
kia
Hun
ga
ry
Po
lan
d
Ro
ma
nia
Bu
lga
ria
Tu
rke
y
2018 2018
Remuneration of Management/Engineer
Total base salary plus bonuses and long-term incentives
151
120
107
87
69 62
45 42 39 35
22
Ge
rma
ny
US
A
Fra
nce
UK
Slo
va
kia
Po
lan
d
Hun
ga
ry
Tu
rke
y
Czech
ia
Ro
ma
nia
Bu
lga
ria
$K, 2017$, 2018
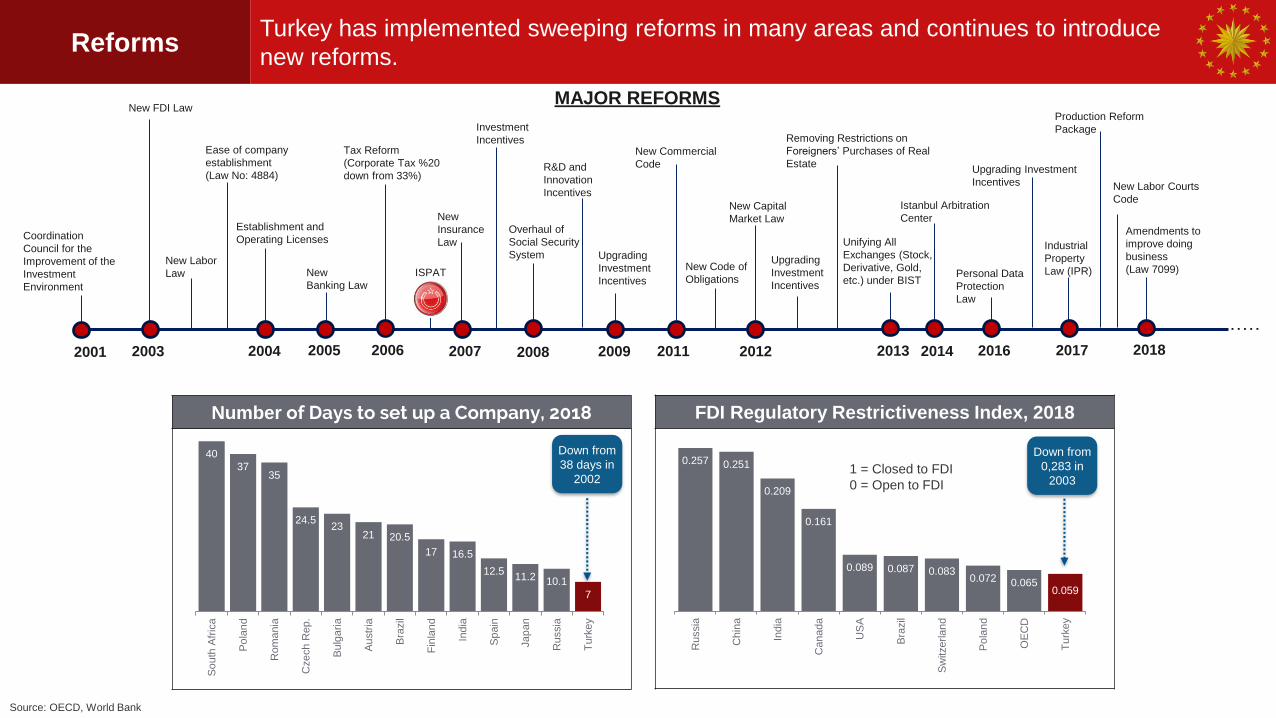
FDI Regulatory Restrictiveness Index, 2018
Personal Data
Protection
Law
MAJOR REFORMS
0.257 0.251
0.209
0.161
0.089 0.087 0.0830.072 0.065
0.059
Russia
Chin
a
India
Canada
US
A
Bra
zil
Sw
itzerlan
d
Po
lan
d
OE
CD
Tu
rkey
1 = Closed to FDI
0 = Open to FDI
Source: OECD, World Bank
2006
Tax Reform
(Corporate Tax %20
down from 33%)
2003
New FDI Law
……
ISPAT
2005
New
Banking Law
2008
Overhaul of
Social Security
System
2011
New Commercial
Code
New Code of
Obligations
2012
New Capital
Market Law
New Labor
Law
2014
Istanbul Arbitration
Center
Ease of company
establishment
(Law No: 4884)
Investment
Incentives
R&D and
Innovation
Incentives
2009
Upgrading
Investment
Incentives
Upgrading
Investment
Incentives
2016
Upgrading Investment
Incentives
2007
New
Insurance
Law
Establishment and
Operating Licenses
2004
Removing Restrictions on
Foreigners’ Purchases of Real
Estate
2013
Unifying All
Exchanges (Stock,
Derivative, Gold,
etc.) under BIST
2001
Coordination
Council for the
Improvement of the
Investment
Environment
2017
Industrial
Property
Law (IPR)
Production Reform
Package
Down from
0,283 in
2003
ReformsTurkey has implemented sweeping reforms in many areas and continues to introduce
new reforms.
New Labor Courts
Code
2018
Amendments to
improve doing
business
(Law 7099)
Number of Days to set up a Company, 2018
Internationally-
minded
people
40
3735
24.523
21 20.5
17 16.5
12.511.2 10.1
7
So
uth
Afr
ica
Po
lan
d
Rom
ania
Cze
ch R
ep.
Bu
lga
ria
Au
str
ia
Bra
zil
Fin
lan
d
India
Sp
ain
Jap
an
Russia
Turk
ey
Down from
38 days in
2002
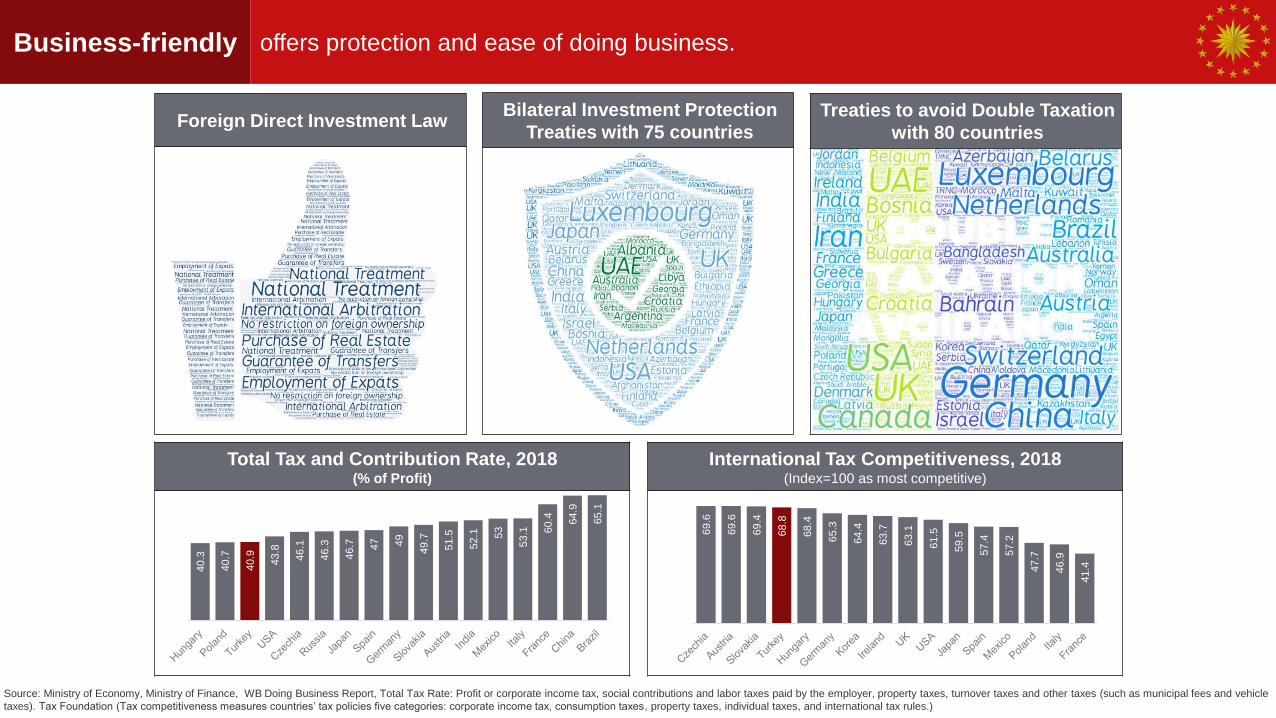
International Tax Competitiveness, 2018(Index=100 as most competitive)
Bilateral Investment Protection
Treaties with 75 countries
Source: Ministry of Economy, Ministry of Finance, WB Doing Business Report, Total Tax Rate: Profit or corporate income tax, social contributions and labor taxes paid by the employer, property taxes, turnover taxes and other taxes (such as municipal fees and vehicle
taxes). Tax Foundation (Tax competitiveness measures countries’ tax policies five categories: corporate income tax, consumption taxes, property taxes, individual taxes, and international tax rules.)69.6
69.6
69
.4
68.8
68.4
65.3
64.4
63.7
63.1
61.5
59.5
57.4
57
.2
47.7
46.9
41.4
Foreign Direct Investment Law
Total Tax and Contribution Rate, 2018(% of Profit)
40.3
40.7
40.9
43.8
46.1
46.3
46.7 47 49
49.7
51.5
52.1 53
53.1 6
0.4 64.9
65.1
Business-friendly offers protection and ease of doing business.
Treaties to avoid Double Taxation
with 80 countries

R&D and Innovation Incentives
Tax deduction & exemption +
Employment Incentives
Payroll & Training support +
Manufacturing Incentives
Tax deduction & exemption +
Technology Development Zones
To support R&D
Tax deduction & exemption+
Exclusive Zones
Free Zones
Tax deduction & exemption +
Organized Industrial Zones
Developed infrastructure
Academia
Industry
Incentives for Service Exporters
Tax deduction for exporting
services in;
E n g i n e e r i n g
A r c h i t e c t u r e
D e s i g nS o f t w a r e
Medical Reporting
Accounting
Call Center
D a t a c e n t e r
EDUCATION
H e a l t h c a r e
Lucrative
IncentivesInvestors are offered lucrative incentives in many ways.

Selected Foreign Companies conducting R&D in Turkey
Increasing R&D Spending ($ Billion, PPP)Number of Researchers (thousands)
Source: OECD, Eurostat, Turkstat, PPP: Purchasing Power Parity
0
5
10
15
20
Turkey
Romania
Poland
0
20
40
60
80
100
120
140
160
180
200
220 Turkey
Romania
Poland
Benign R&D
EcosystemR&D incentives are further supported by a favorable ecosystem..
Over 100 R&D centers
by foreign companies
Hungary Hungary

Source: Turkstat, Ministry of Industry and Technology, Sasad, OSD, SBB; export values as of 2018, market values as of 2017, defence industry value as of 2018
Opportunities Turkey offers abundant opportunities in a variety of sectors.
AUTOMOTIVEMACHINERY &
ELECTRICAL EQP.AEROSPACE &
DEFENCE ENERG
Y INFRASTRUCTUR
E
FINANC
E
OPPORTUNITIES
AGROFOOD
–Largest TV & white goods
producer in Europe
–Market: $38 billion
–Export: $25 billion
–$19 billion defense spending
–Industry: $8.7 billion
–Export: $2.2 billion
–Air passengers: 210 million
–Market: $66 billion
–Growing demand
–Energy corridor
–Untapped renewables
–15th largest manufacturer
–1.6 million vehicle produced
-Market: $24 billion
–Export: $32 billion
–$127 billion PPP contracts
(2003-2018)
–More opportunities in
transport, energy, health
–Robust growth with double
digits
–Islamic finance to grow
–Istanbul Financial Center
–Market: $80 billion
Export: $17 billion
–Export to around 200
countries

Number of Foreign Companies in Turkey (‘000)FDI Inflows ($ Billion)
Source: CBRT, Ministry of Industry and Technology, Team Analysis *Geographic (adjusted) and sectoral breakdown of cumulative gross inflows of equity FDI from 2003 to 2018
15
209
1973-2002 (30 years) 2003-2018 (16 years)
5.6
65.5
2002 2018
EU68.6%
USA8.8%
Asia21.5%
Other1.1%
Geographic Breakdown of Investments*
Finance33.7%
Manufacturing24.1%
Energy11.7%
Information & Communication Services 8.1%
Wholesale & Retail Trade
6.4%
Transport & Storage
4.5%
Construction 3.1%
Others 8.4%
SectoralBreakdown of Investments*
Foreign Direct
Investment (FDI)
Turkey’s value has been appreciated by foreign investors with increasing FDI inflow to
Turkey.
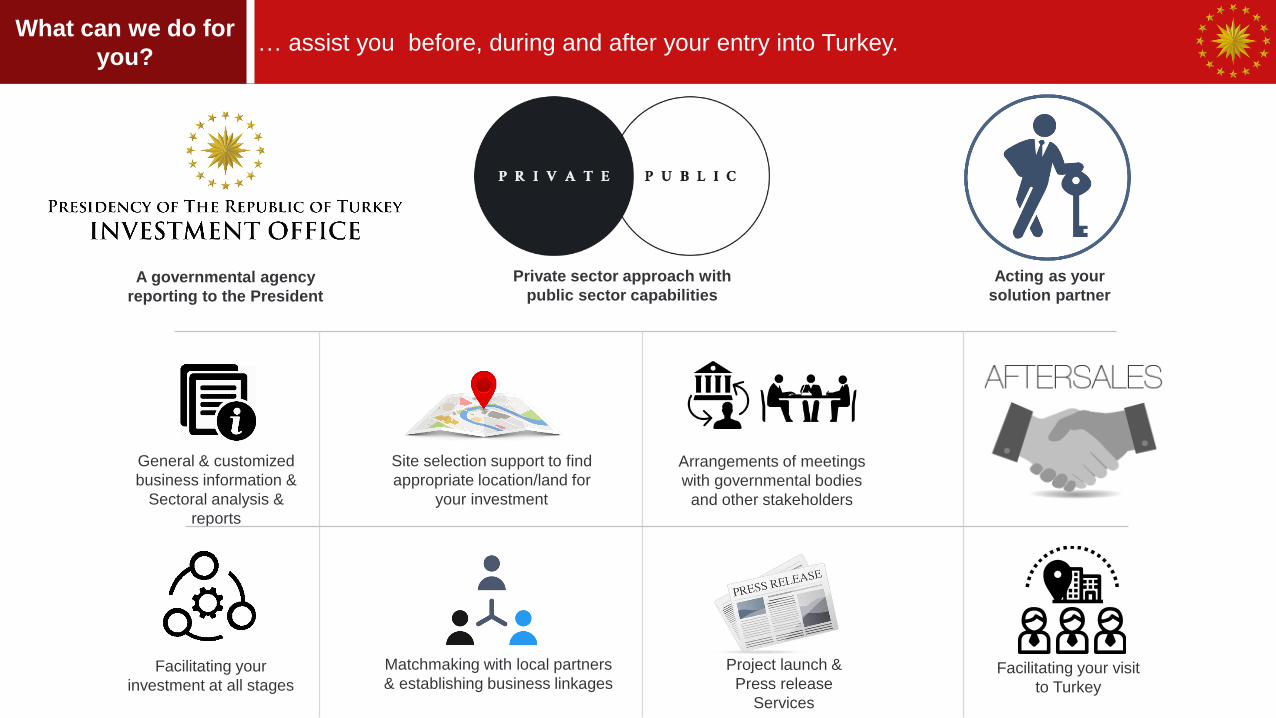
What can we do for
you?… assist you before, during and after your entry into Turkey.
A governmental agency
reporting to the President
Private sector approach with
public sector capabilities
Acting as your
solution partner
General & customized
business information &
Sectoral analysis &
reports
Site selection support to find
appropriate location/land for
your investment
Arrangements of meetings
with governmental bodies
and other stakeholders
Matchmaking with local partners
& establishing business linkages Facilitating your
investment at all stages
Project launch &
Press release
Services
Facilitating your visit
to Turkey