WHITEPAPER Supply chain optimization - it’s not magic, it ...
11
Supply chain optimization - it’s not magic, it’s mathematics Companies with complex supply chains must make real-time, data-driven decisions to ensure efficient resource utilization and first-class customer service. Yet, many organizations continue to rely on outdated planning tools such as spreadsheets and MRP. Supply chain planning based on mathematical optimization is fundamentally different from traditional methods and allows companies to maximize overall supply chain performance. This whitepaper uses common planning scenarios to explain how supply chain optimization technology works and why companies looking to streamline operations and maximize profits should consider switching. WHITEPAPER
Transcript of WHITEPAPER Supply chain optimization - it’s not magic, it ...
Supply chain optimization - it’s not magic, it’s mathematics Companies with complex supply chains must make real-time, data-driven
decisions to ensure efficient resource utilization and first-class customer
service. Yet, many organizations continue to rely on outdated planning
tools such as spreadsheets and MRP.
Supply chain planning based on mathematical optimization is
fundamentally different from traditional methods and allows companies
to maximize overall supply chain performance.
This whitepaper uses common planning scenarios to explain how supply
chain optimization technology works and why companies looking to
streamline operations and maximize profits should consider switching.
WHITEPAPER

Optimization – Not just for big business
Supply chain optimization software has been around for decades, but it’s only recently that the
technology has become a viable alternative for small and mid-size businesses.
Today, the processing power required to run the optimization algorithms comes at a fraction of the
cost. At the same time, supply chain optimization software has become more user-friendly and easier
to maintain. Thanks to these advances, smaller organizations with limited IT budgets and resources can
now benefit from this powerful technology.
Why do I need optimization?
Optimization software transforms the way companies plan and manage their supply chains.
Because the optimization engine takes supply chain constraints and costs into account, the
system-generated plans are validated upfront. The software can therefore provide the planner
with more accurate decision support.
The result is better customer service and resource utilization with less inventory - all helping to
boost the bottom line. These instant benefits are why optimization implementations offer such an
attractive ROI.
02
How does supply chain optimization work?
As humans, we trust the familiar and what we understand. Therefore, it’s essential for companies that
rely on spreadsheets and MRP software to take the time to understand the fundamental differences
between traditional planning tools and modern solutions powered by mathematical optimization.
While there’s no need for planners and business users to understand the inner workings of
mathematical modeling and optimization techniques, a good grasp of what underpins the planning
approach is needed. To help with this understanding, let’s take a closer look at the three core
elements of a supply chain optimization solution:

03
1. The supply chain model (the “Digital Twin”)
The Digital Twin is an electronic representation of your physical supply chain.
It’s a detailed model of your processes and resources, with their associated costs
and constraints. The model provides the blueprint for your planning solution.
Warehouses, production lines, machines, vehicles, tooling, and staff are all
represented here.
2. System interfaces
The planning tool needs accurate, up-to-date information from your existing
business systems. Depending on your setup, direct interfaces with ERP, PLM,
CRM, and Transportation & Warehouse Management systems provide access
to the necessary input data. Examples of required information are sales forecasts,
customer orders, product information, and stock levels.
3. The solver
The solver is the brain of the optimization solution and where the magic happens.
It contains mathematical algorithms that work together to solve the supply chain
problem described by the digital twin and the input data.
The solver optimizes one of the two available “objective functions”:
Maximum Profit
Max Delivery Service at Lowest Cost
If revenue is represented in the model, the solver will determine the plan that
maximizes your overall profitability. However, if revenue is not included in the
model, the solver will maximize customer service at the lowest possible cost.
It is important to be aware of the difference between these two objective
functions. However, in both cases the solver will find the best overall solution
for the business with respect to the defined business rules and constraints.
2
1
“To find the optimal plan, we first
need to define the planning
problem - including all the
parameters framing it. Once a
digital model of the supply chain
is in place, the mathematical
optimization algorithms can go
to work.”
04
Optimization Examples
To get a better feel for the difference between optimization technology and traditional planning
approaches, we can look at some common planning problems.
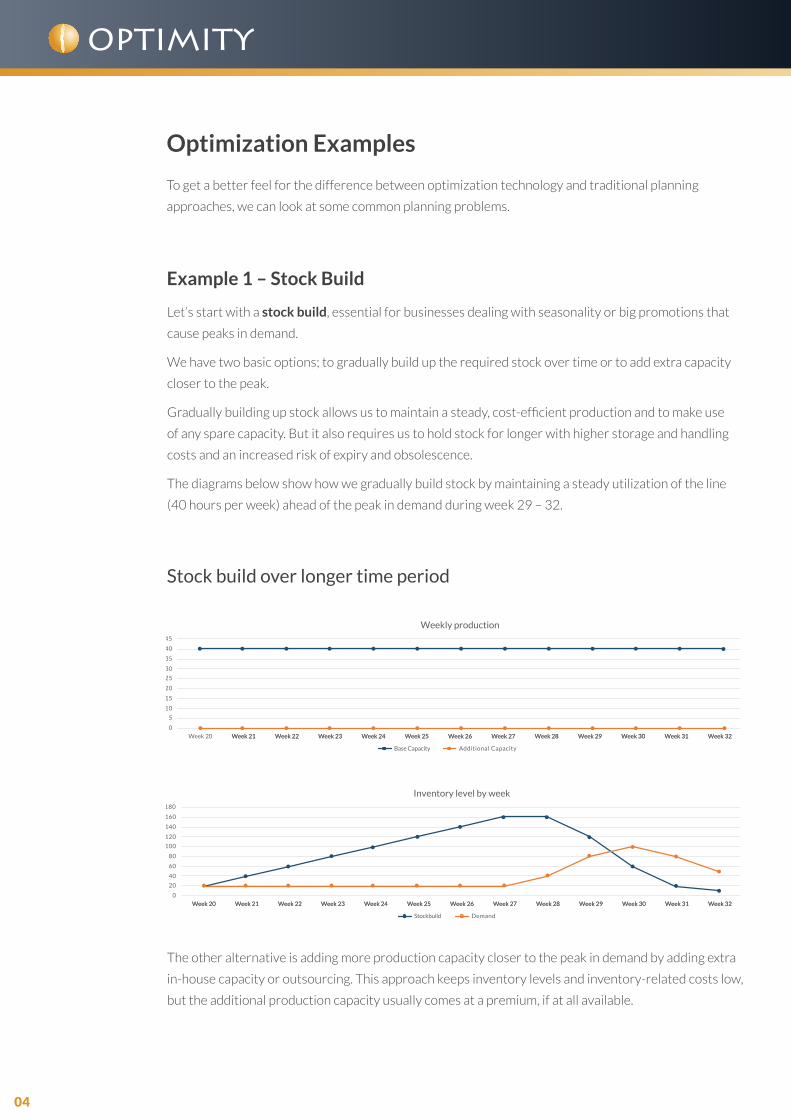
Example 1 – Stock Build
Let’s start with a stock build, essential for businesses dealing with seasonality or big promotions that
cause peaks in demand.
We have two basic options; to gradually build up the required stock over time or to add extra capacity
closer to the peak.
Gradually building up stock allows us to maintain a steady, cost-efficient production and to make use
of any spare capacity. But it also requires us to hold stock for longer with higher storage and handling
costs and an increased risk of expiry and obsolescence.
The diagrams below show how we gradually build stock by maintaining a steady utilization of the line
(40 hours per week) ahead of the peak in demand during week 29 – 32.
Stock build over longer time period
0
5
10
15
20
25
30
35
40
45
Base Capacity Additional Capacity
Week 20 Week 21 Week 22 Week 23 Week 24 Week 25 Week 26 Week 27 Week 28 Week 29 Week 30 Week 31 Week 32Week 21 Week 22 Week 23 Week 24 Week 25 Week 26 Week 27 Week 28 Week 29 Week 30 Week 31 Week 32
Weekly production
0
20
40
60
80
100
120
140
160
180
Stockbuild Demand
Week 20 Week 21 Week 22 Week 23 Week 24 Week 25 Week 26 Week 27 Week 28 Week 29 Week 30 Week 31 Week 32
Inventory level by week
Week 20 Week 21 Week 22 Week 23 Week 24 Week 25 Week 26 Week 27 Week 28 Week 29 Week 30 Week 31 Week 32
The other alternative is adding more production capacity closer to the peak in demand by adding extra
in-house capacity or outsourcing. This approach keeps inventory levels and inventory-related costs low,
but the additional production capacity usually comes at a premium, if at all available.
05
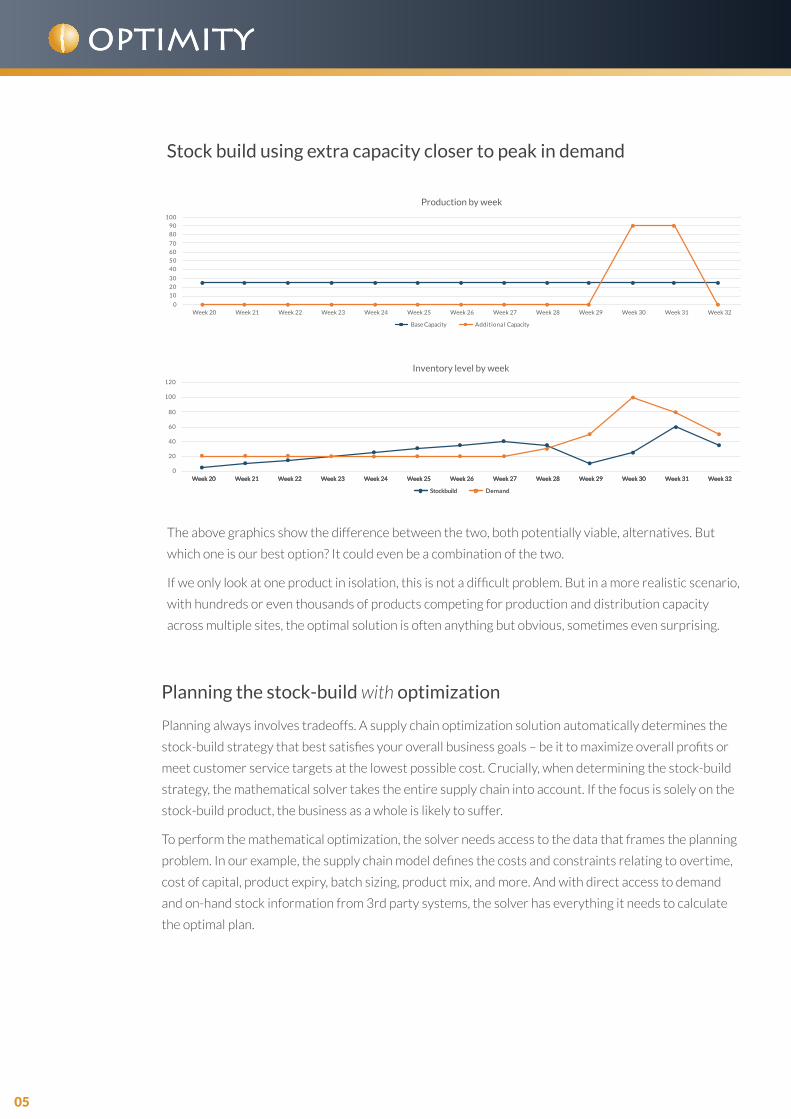
Stock build using extra capacity closer to peak in demand
0
20
40
60
80
100
120
Week 20 Week 21 Week 22 Week 23 Week 24 Week 25 Week 26 Week 27 Week 28 Week 29 Week 30 Week 31 Week 32
Inventory level by week
Stockbuild Demand
0
10
20
30
40
50
60
70
80
90
100
Production by week
Base Capacity Additional Capacity
Week 20 Week 21 Week 22 Week 23 Week 24 Week 25 Week 26 Week 27 Week 28 Week 29 Week 30 Week 31 Week 32
0
20
40
60
80
100
120
Week 20 Week 21 Week 22 Week 23 Week 24 Week 25 Week 26 Week 27 Week 28 Week 29 Week 30 Week 31 Week 32
Stockbuild Demand
Inventory level by week
Stockbuild Demand
Week 20 Week 21 Week 22 Week 23 Week 24 Week 25 Week 26 Week 27 Week 28 Week 29 Week 30 Week 31 Week 32Week 20 Week 21 Week 22 Week 23 Week 24 Week 25 Week 26 Week 27 Week 28 Week 29 Week 30 Week 31 Week 32
The above graphics show the difference between the two, both potentially viable, alternatives. But
which one is our best option? It could even be a combination of the two.
If we only look at one product in isolation, this is not a difficult problem. But in a more realistic scenario,
with hundreds or even thousands of products competing for production and distribution capacity
across multiple sites, the optimal solution is often anything but obvious, sometimes even surprising.
Planning the stock-build with optimization
Planning always involves tradeoffs. A supply chain optimization solution automatically determines the
stock-build strategy that best satisfies your overall business goals – be it to maximize overall profits or
meet customer service targets at the lowest possible cost. Crucially, when determining the stock-build
strategy, the mathematical solver takes the entire supply chain into account. If the focus is solely on the
stock-build product, the business as a whole is likely to suffer.
To perform the mathematical optimization, the solver needs access to the data that frames the planning
problem. In our example, the supply chain model defines the costs and constraints relating to overtime,
cost of capital, product expiry, batch sizing, product mix, and more. And with direct access to demand
and on-hand stock information from 3rd party systems, the solver has everything it needs to calculate
the optimal plan.
06
Planning the stock-build without optimization
Planning the same stock build using the MRP and DRP functionality of an ERP system is an entirely
different challenge. With tools that don’t consider production and inventory constraints, the planner
is left with a lot of work to validate the plan’s basic feasibility.
Unable to recognize planning constraints, MRP and DRP must make a series of assumptions, including
infinite capacity and fixed production and distribution lead times. However, capacity is rarely unlimited,
and lead times are, per definition, not fixed. Instead, they depend on the availability of materials and
production, storage, and distribution capacity. As a result, MRP-generated plans are of much
lower quality.
MRP’s inability to deliver a plan that can be executed “out-of-the-box” is only part of the problem.
Because MRP doesn’t consider the plan’s overall profitability, it is difficult to determine if it meets the
company’s business goals.
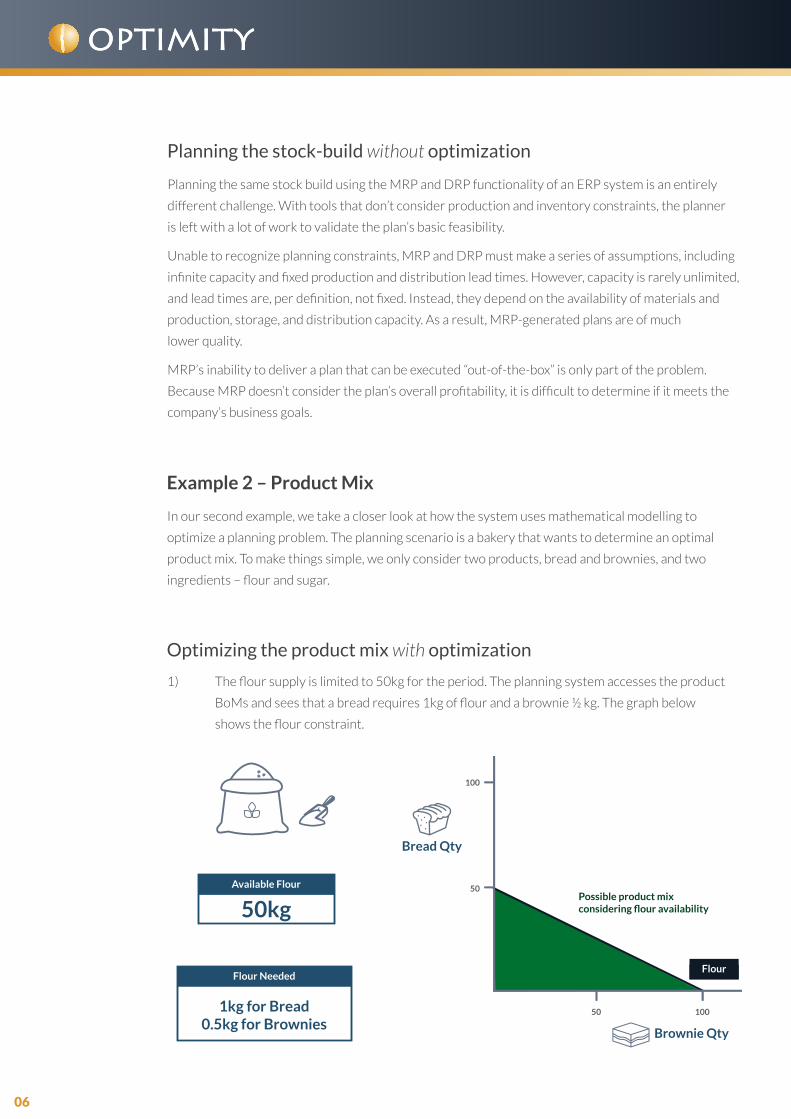
Example 2 – Product Mix
In our second example, we take a closer look at how the system uses mathematical modelling to
optimize a planning problem. The planning scenario is a bakery that wants to determine an optimal
product mix. To make things simple, we only consider two products, bread and brownies, and two
ingredients – flour and sugar.
Optimizing the product mix with optimization
1) The flour supply is limited to 50kg for the period. The planning system accesses the product
BoMs and sees that a bread requires 1kg of flour and a brownie ½ kg. The graph below
shows the flour constraint.
Available Flour
50kg
Flour Needed
1kg for Bread0.5kg for Brownies
100
50
50 100
Bread Qty
Brownie Qty
Flour
Possible product mix considering flour availability

07
2) After adding the supply constraint for sugar, we get the following picture. Our possible product
mix is now reduced.
Demand for Brownies
25
Demand for Bread
45
Demand for Brownies
100
50
50 100
Bread Qty
Brownie Qty
Demand for Bread
Flour
Sugar
Possible product mix considering flour and sugar availability and demand
3) Next, the demand forecasts for the two products, bread (45) & brownies (25), are imported
from the demand planner. As we don’t want to produce more than what we have demand for,
the possible product mix is further reduced.
Available Sugar
60kg
Sugar Needed
2kg for Brownies0.5kg for Bread
100
50
50 100
Bread Qty
Brownie Qty
Flour
Sugar
Possible product mix considering flour and sugar availability

08
4) The optimal product mix is where the bakery achieves maximum profit. With a profit
contribution of $1.50 for bread and $2.00 for brownies, the system has all the information
it needs to determine the optimal mix.
5) In this example, a Linear Programming (LP) algorithm is used to determine the optimal
product mix. The system establishes the profit contribution line and finds the optimum.
Remember - all this happens automatically!
Profit Contribution
$1.50
Profit Contribution
$2.00
Demand for Brownies
100
50
50 100
Bread Qty
Brownie Qty
Demand for Bread
Flour
Sugar
We now shift the profit contribution line towards the green area. Our optimal product mix (max profit) is where the line first hits the green area.
100
50
50 100
Demand for Brownies
Sugar
Bread Qty
Brownie Qty
Demand for Bread
Flour
100
50
50 100
Bread Qty
Brownie Qty
Demand for Bread
Flour
Sugar
Demand for Brownies
Profit Contribution Line: Any product mix on this line will generate the same overall profit
“There are several different algorithms available depending on the mathematical structure of the
planning problem. In this example, the system chooses an optimization technique called Linear
Programming. Crucially, the planner doesn’t need to be a mathematician to use the
system, as this is all taken care of automatically.”

09
The above example is very simple, but the beauty of mathematical optimization is that we can
achieve the same optimized results with thousands of products, limited supply materials, and
capacity-constrained production, storage and transportation resources.
Optimizing the product mix without optimization
Without optimization, the pattern from our first example will repeat itself. An MRP-generated plan will
produce the total demand quantity of 45 breads and 25 brownies, despite the limited supply of flour.
While the system will recognize the resulting shortage of flour, this will only be clear to the planner
after the fact. Thus, it is down to the planner to resolve the problem.
Demand for Brownies
100
50
50 100
Bread Qty
Brownie Qty
Demand for Bread
Flour
Sugar
Max Profit
40Bread
20Brownies
6) The optimal product mix is 40 breads and 20 brownies.
Video - Supply Chain Optimization Explained - Optimity Software

10
Changing the role of the planner
Working with an MRP system (without mathematical optimization) is very different from a supply chain
optimization solution.
With MRP, planners are notified when there’s an issue but left to figure out how to fix the problem
themselves. This is time-consuming and invariably leads to sub-optimal decisions based on gut feel and
bias rather than real-time data and facts.
With supply chain optimization, planning becomes much more proactive and strategic to the
organization. With a system that models and optimizes the entire supply chain, planners and managers
have complete visibility of all activities and how they interrelate. When someone makes a change to the
plan, any ripple effects are immediately visible.
How optimization impacts the role of a planner
Summary
Supply chain planning based on mathematical optimization has the power to transform your business.
The technology is mature and proven to add significant value and it is now available and affordable to
companies of all sizes.
Any manufacturing or distribution organization not yet using supply chain optimization is strongly
encouraged to find out what it would mean to their customer service and bottom line.
Improved planning automation means more time to focus on exceptions
The plans can be executed “out-of-the-box” with little or no need for manual adjustment
The planning function will become more strategic when trust continues to grow
The speed of the optimization algorithms allows planners to run multiple what-if analyses before
making important decisions
The planner will maintain the “digital twin”, keeping business rules, costs, and constraints up
to date.
www.optimitysoftware.com
About Optimity
Optimity helps companies achieve better supply chain planning by leveraging
tools that unify the business and drive growth and success through the power
of true supply chain optimization technology. With offices in the US, Europe,
Asia, Australia, and New Zealand, the company offers a suite of modules that
work seamlessly together or independently to suit precise supply chain planning
requirements and challenges, including silos and uncertainty. Their solutions are
supportive of overall business strategies across all time frames and offer
unprecedented control, accuracy, and visibility across supply chain channels.
As a result, supply chain planning becomes a driver for growth and
competitive differentiation.
North America
United States, Head Office
Optimity Inc.
1434 Spruce Street
Suite 100
Boulder
CO 80302
USA
Tel: +1-720-726-8031
Asia
Asia, Head Office
Optimity Pte Ltd
82 Playfair Rd
#13-01 D’Lithium
Singapore 368001
Tel: +65 96608604
Europe
Europe, Head Office
Optimity AB
Mäster Samuelsgatan 3
SE-111 44
Stockholm
Sweden
Tel: +46-709-677015
Australia
Australia & NZ, Head Office
Optimity Pty Ltd
Suite 242
Lifestyle Working Brookvale
117 Old Pittwater Rd
Brookvale, NSW, 2100
Australia
Tel: +61 2 9994 8084