Performance Optimization of Speakers and the Listening … · - TECHNICAL WHITEPAPER - Performance...
17
www.eventelectronics.com - TECHNICAL WHITEPAPER - Performance Optimization of Speakers and the Listening Space By Marcelo Vercelli Head of Engineering Event Electronics
Transcript of Performance Optimization of Speakers and the Listening … · - TECHNICAL WHITEPAPER - Performance...
www.eventelectronics.com
- T E C H N I C A L W H I T E P A P E R -
Performance Optimization of Speakers and the
Listening SpaceBy Marcelo Vercelli
Head of EngineeringEvent Electronics

- T E C H N I C A L W H I T E P A P E R -
Performance Optimization of Speakers and the Listening Space
by Marcelo VercelliHead of EngineeringEvent Electronics
Published November 2nd, 2010 www.eventelectronics.com
Preface
Much has been written and published in the last fi fty years regarding the placement of speakers in rooms. The advent of DSP, multi-channel audio and other technologies has added to the confusion created by rules of thumb offered at many audio information sites. This paper will attempt to provide an outline of the acoustic issues present in all listening spaces, and specifi cally address the challenges of placing speakers in small listening spaces.
In thinking about how to approach the writing of this paper, I was struck by how many of our customers seemed to be intimidated by the issue of room acoustics, speaker placement and audio measurements. There seem to be so many opinions, and/or beliefs that are held as truths, that it warranted a detailed explanation along with a data snap shot of room acoustics science in order to dispel the most egregious myths.
Room placement rules of thumb and most of the recommended room calculators assume symmetrical sizing of the listening space. We know that most of the time, this is not the case. The truth is that we are typically required to set up playback devices in rooms that are not within the recommended dimensional length, width and height ratios and so one therefore has to focus on three things; the room, the speakers, and possible corrections.
The good room
We’ll assume that your room is not a perfect rectangle, with perfectly straight walls and no furniture or windows. If you did have a room like this it would be quite an awful acoustic space anyway. Your room however does have a shape and that shape will have fundamental resonances that will be energized by the sound sources i.e. the speakers in the room. The room dimensions will dictate which frequencies will resonate more than others, and these resonances will exist both in the axial (side to side), tangential (up and down) and oblique (corner to corner) modes. In my experience, the axial modes always have the greatest impact on sound quality with the other two following behind.
The biggest challenge we face in getting the room to behave is not in its dimensional ratios but in how it is prepared to deal with the sound sources. Large surfaces like walls, ceilings and fl oors refl ect and enhance the low frequency energy introduced by the sound sources in the room. The worst scenario is a room with very defi ned corners (a perfect rectan-gle) and very hard surfaces. This results in high Q room modes that are extremely diffi cult to overcome.
It is very important to know that that foam absorbers or loosely packed fi berglass have no effect on low frequency energy. Correctly designed sound panels, low frequency traps and absorbers are the best way to deal with these problems and so choosing devices with high coeffi cients of sound absorption in the frequency bands of concern, will obviously provide the best results. With panels you must also cover a large portion of the surface as well; a few square feet of treatment on a 200 square foot surface will not change anything.
If you are lucky enough to be able to get into the construction of the room walls, there are several techniques that can be implemented that won’t break the bank such as;
• Double stud construction, making the wall twice as thick and staggering the position of the wood studs. This helps to create better diffusion of the energy hitting the surface.
• If you can’t build double walls you can place a layer of acoustic board underneath the gypsum wall material. • You can also use products like Acousti-Board™ or QuietRock™ in the construction of your room, although this
can get a bit expensive.
- T E C H N I C A L W H I T E P A P E R -
Performance Optimization of Speakers and the Listening Space
by Marcelo VercelliHead of EngineeringEvent Electronics
Published November 2nd, 2010 www.eventelectronics.com
So, what is achieved by adding some sound absorption materials? First, you will deaden the major room modes and peaks and soften the nulls or holes in the room. This will allow more uniform bass response over a larger area of the listening space resulting in a listening environment where acoustic adjustment is possible
What you hear from your loudspeakers
For the sake of clarity (sorry), let’s break up the loudspeaker’s reproduction bandwidth into three sections. Low-frequency (below 100 Hz), mid-frequency (100Hz – 2kHz) and high-frequency (2kHz – 20 kHz) bands. What you actually hear in the room is infl uenced by a number of factors, and each section of the speaker’s bandwidth is infl uenced differently.
Accurate low frequency reproduction is completely dominated by the room and the listening position within the room. Sitting next to any room surface, a boundary where the energy will load, will give you a completely different listening experience than sitting in the middle of the room where all sorts of addition and subtraction of modes are occurring.
Mid and high frequencies are dominated by the loudspeaker itself and its performance characteristics in the area of frequency response, directivity, phase and power response.It is vital to note that if a loudspeaker has signifi cant defi ciencies in the above-mentioned areas of performance, it is a fallacy to believe these can be remedied through the implementation of equalization. The results achieved by manipulat-ing the frequency response of a loudspeaker through the use of signal equalization are position dependent. When you use equalization to affect the response on-axis, the frequency response will not be the same off-axis. In a well damped room with minimal axial refl ections, a high quality loudspeaker’s mid and high frequency reproduc-tion will be perceived mostly in the direct sound fi eld, resulting in a tighter image and a high precision experience that sounds “up front”. If placed in a reverberant environment, the added refl ections increase to the complexity of the sound fi eld and may add to the spaciousness or openness of the sound fi eld. The key to high quality mid and high frequency performance is obviously to choose high quality precision loudspeakers.
Enhancing low-frequency performance and rules of thumb that matter
While I have explained why equalization is not the correct tool to use to optimize mid and high frequency reproduction, it can be very useful in correcting low frequency room based anomalies. Implementing equalization correctly can improve the low-frequency performance of your loudspeaker system dramatically. There are many traditionalists, who will wrongly argue this point citing phase-shift and other introduced problems. Low-frequency energy in a room is a minimum phase event and dealing with low frequency problems with a parametric fi lter is a valid and genuine solution; mathematically, fl attening the bass response will result in fl atter, more linear phase response (Hilbert transform). You therefore want to equalize not only to remove modes, but also to improve the phase response of the speaker system.
Now we are approaching the reason for writing this paper, how can we improve the low frequency performance of our listening space? First, let us start with what is truly important if we are to achieve optimum results.
1) We need to make some valid acoustical measurements.2) We need to learn how to interpret those measurements.3) We need to add the right type of equalization. 4) We need to know what not to do. 5) Listen, adjust and repeat!
- T E C H N I C A L W H I T E P A P E R -
Performance Optimization of Speakers and the Listening Space
by Marcelo VercelliHead of EngineeringEvent Electronics
Published November 2nd, 2010 www.eventelectronics.com
Acoustical Measurements – the advent of StudioEQ
For years, the biggest challenge the professional audio community faced in trying to understand what was happening in their listening spaces was the lack of access to high resolution, acoustic measurement systems. In the early 80’s when the technology required became available at a reasonable cost, the most common test equipment used to measure a room was the real time analyzer (RTA). While an amazing advancement and a valuable tool, the 1/3 octave resolution simply did not give us the information we needed to deal with the complex modes found in our listening spaces. The reality is that the “Q” of these devices was so wide, that they created new problems when adjustments were made with the usual 1/3 octave graphic equalizer.
Today we are fortunate to have a number of different measurement tools that are able to provide the resolution we need to see and adjust the low-frequency response of a room. Tools such as MLSSA, Clio and ETF are but a few. These are all sophisticated DSP based solutions that are used by professionals involved in the disciplines of room acoustics, as well as product development. The problem with these systems is they also require a signifi cant amount of technical knowledge, training as well as precision test microphones and hardware. These are expensive tools that, within the context of our discussion would only be used once when setting up a listening room.
When we began the development program for the Opal studio monitor, we decided that for these loudspeakers to deliver the results our customers were expecting, we would obviously need to consider the listening space they would be used in. While we could of course never control this, we could provide an analysis tool and a level of adjustment that would get our customers closer to the ideal monitoring space. We achieved this by adding a bandwidth limited parametric notch fi lter in the control electronics of Opal. This precision fi lter allows the user to deal with the biggest room mode issue in any given listening space. During development we were soon confronted with the challenge of how to simply and effectively implement such notch fi lter, which led to the concept of StudioEQ software. In the end, the software morphed into a fl exible tool that can be used with any speaker system in order to make accurate low frequency room measurements.
The key components of StudioEQ are a dedicated USB sound card dongle, a measurement microphone and the Mac or PC based StudioEQ software. By designing a dongle based USB sound card, we were able to eliminate the huge challenge represented by getting the microphone and speaker outputs to work with the hundreds of different sound cards currently inside PC’s around the planet. The combination of hardware and software provide 2.7 Hz resolution down to 20 Hz enabling us to accurately see what is happening in our listening space.
I want to make one thing very clear. The best approach to the task of creating a good listening space starts with room design and treatment. As touched on earlier, regardless of your room size and its dimensions, the use of correct con-struction techniques as well as incorporating absorption and diffusion panels, and devices known as tube traps, is where you should begin your project. You will never be able to get your monitors working correctly in a room with acoustical problems, but you can always improve any situation. The installation of loudspeakers and their placement as well as op-timization through equalization, should be the last task in setting up a listening space. While this paper will not touch on materials or product to use, as it is obviously beyond the scope of what I am trying to convey here, I would like to direct you to one of our associated companies Vicoustic (vicoustic.com) for more information. I would also like to recommend the book Sound Reproduction, The Acoustics and Psychoacoustics of Loudspeakers and Rooms by Floyd E. Toole. This book provides a vast amount of valuable information on how to optimize the acoustics in your listening space for monitoring purposes.

- T E C H N I C A L W H I T E P A P E R -
Performance Optimization of Speakers and the Listening Space
by Marcelo VercelliHead of EngineeringEvent Electronics
Published November 2nd, 2010 www.eventelectronics.com
So, lets assume you have done some study on room acoustics as they apply to studio monitoring in your space and have prepared your listening space with the appropriate acoustic absorbers/tube traps etc. and have set up your Opals in the optimum position.
The tutorial
The measurement you make is only valid at one location.This is especially true when it comes to low-frequency measurements. Whatever you measure at one location in the room, will be different from another location, even one that is a couple of feet (.5m) away.
Make several measurements in the listening area before applying EQ.Move the microphone around in the listening area and look for peaks that manifest themselves in a specifi c frequency band at all the locations. Now apply a notch fi lter that will attack the average peak.
Only peaks can be damped, you cannot fi ll in nulls. The only type of equalization that is recommended is one that eliminates peaks. Loudspeaker output that excites room modes will create frequency response peaks as well as valleys in the listening space. The valley is a function of the summation of nulls at that location. It is an acoustic black hole; you cannot equalize it out by pouring more power into it. Keep in mind that adding 3dB of boost requires double the amplifi er output to be delivered as well as higher excursion from the woofer. Trying to fi ll in a null with power just eats up your headroom and never solves the problem.
Interpreting Measurements
First things fi rst.There is a huge difference between the measurement data provided by a speaker manufacturer of a device measured in an anechoic (no refl ections) space and the one you would see of the same device measured in a reverberant room like the one we all commonly use. Even the measurement techniques are different. I start here because most people are frus-trated when they make a measurement of their studio monitors and they can’t get the measurement to look like the data on the manufacture’s product data sheet.
For the sake of explanation, let’s look at some measurements of the Opal found in our small anechoic chamber and the same speaker measured in our listening space with the microphone at different distances. We used two different measur-ing techniques; the anechoic measurements implement a stepped sinusoidal technique using a gate at 10 kHz. The room measurements use a MLS (maximum length sequence) stimulus that allows us to better see the effects of the modes in the room. We used our Clio system for these initial measurements for the sake of fl exibility. We will use StudioEQ once we have discussed measuring techniques and the subject of data interpretation.

- T E C H N I C A L W H I T E P A P E R -
Performance Optimization of Speakers and the Listening Space
by Marcelo VercelliHead of EngineeringEvent Electronics
Published November 2nd, 2010 www.eventelectronics.com
Red Curve: Opal measured in anechoic chamber.Green Curve: Opal place against wall in listening room and microphone at 1 meter on tweeter axis.Purple Curve: Opal place against wall in listening room and microphone at 1.5 meters on tweeter axis.Blue Curve: Opal place against wall in listening room and microphone at 2 meters on tweeter axis.
Note: All curves implement 1/3 octave smoothing as that more closely represents how we perceive sound.
Interpretation
I think that this is a great place to start. Our listening space uses typical US construction, .5-inch thick gypsum board wall and a drop ceiling using 24 x 24 in (60 x 60cm) acoustic panels. We hung acoustic panels along the rear and sidewalls but nothing from the ceiling. Room dimensions are 13.7 ft (4.2m) wide x 18.6 ft (5.6m) long x 9.3 ft (2.8m) high. Opals were placed on speaker stands 36 in. (.9m) high. Measurement distances were chosen because of their proximity to standard listening distances for a studio monitoring application.
The red measurement shows the response of the Opal in the anechoic chamber. The microphone is placed on-axis to the tweeter and one meter away. Making changes to the distance between the microphone and the Opal makes very little difference to the measurement taken. We will use this measurement to compare to the in-room measurements.
The green curve shows the Opal placed against the wall and measured with the microphone placed on-axis to the tweeter and placed 1 meter away. Here you can see a couple of consistent and predictable phenomena. First, take a look at the “ripple” which starts occurring below 1 kHz. This is caused by the refl ections in the listening space and can be deadened through the addition of more sound panels. Then, look at how much more energy is measured down to 30Hz, this is the gain created by the room and its boundaries.
- T E C H N I C A L W H I T E P A P E R -
Performance Optimization of Speakers and the Listening Space
by Marcelo VercelliHead of EngineeringEvent Electronics
Published November 2nd, 2010 www.eventelectronics.com
For the purple measurement, we moved the microphone to a distance of 1.5 meters away from the Opal. Note the increased amount of ripple and the appearance of a small peak at 450Hz. Also note the increase in gain below 120Hz compared to the red, 1-meter measurement. In fact, where the red measurement had a dip at 100Hz, the purple measurement shows a peak.
The blue measurement was made at 2 meters. Again, note the increased “ripple” which you can now detect starting at 4kHz and continuing down through 50 Hz. The measurement looks wildly different to the 1-meter measurement.
Listening tests and opinions
For me, this has always been the diffi cult part of the set up, as we now have to derive an opinion of our speakers in our listening space based on both data and listening tests. I always end up using pieces of music that I know well, this is imperative. In production rooms where video, cinema and gaming production is taking place, we always want to have sound effect recordings available. This is especially important, as we want to experience what I call the tail of the low frequency energy.
We are using steady state measurements to examine complicated combinations of direct and refl ected sounds – time domain phenomena.The measurements may show comb fi ltering that will be startling to the eye but the human ear can only hear natural sounds, thus most of the ripple in the measurements is inaudible.
The ‘big box’ (the room) always dominates the bottom end.The room is responsible for what we hear and measure below 100Hz.
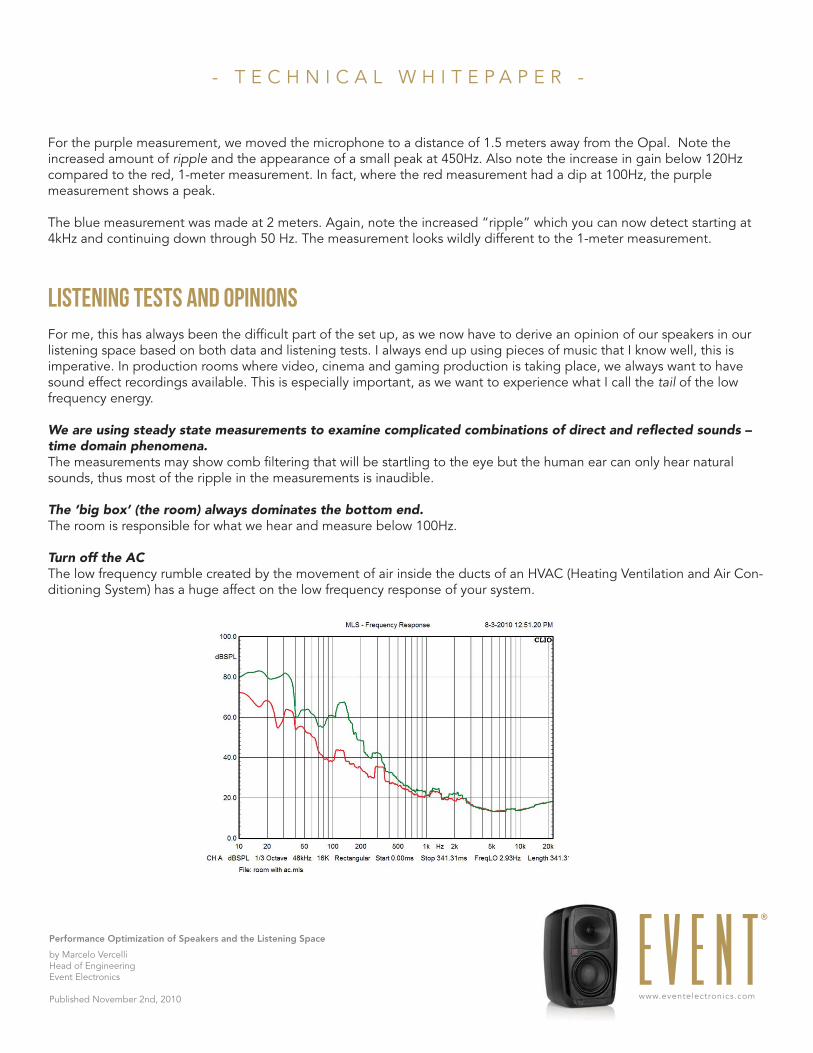
Turn off the ACThe low frequency rumble created by the movement of air inside the ducts of an HVAC (Heating Ventilation and Air Con-ditioning System) has a huge affect on the low frequency response of your system.

- T E C H N I C A L W H I T E P A P E R -
Performance Optimization of Speakers and the Listening Space
by Marcelo VercelliHead of EngineeringEvent Electronics
Published November 2nd, 2010 www.eventelectronics.com
The above graph shows measurements of our room with the microphone placed 1 meter away from the Opal. We simply turned off the speaker and made a measurement of the room. The red measurement was made with the air conditioning (AC) off and the green was made with the AC on. As you can see, the room gain is huge below 200 Hz. You can see the bump at 120Hz as well as one at 30 Hz. You can also see how much energy the AC injects into the space all the way down to 10Hz.
Listening test
Do most of your listening at a nominal level of 84-86dB.This is the recommended playback level for audio engineers spending extended periods of time in front of studio moni-tors.
Listen to the speaker system within the 1 to 2 meter measurement distance and moved side to side.You have reached a point where you can start isolating specifi c performance issues in the low frequency performance of your room. In our case, we will see what happens when we start attacking the 60Hz and 120 Hz bumps that are in our measurements and then listening to hear the result as we start smoothing out that part of the response.
Using StudioEQ Up to this point, we have been using our very expensive Clio system along with a very expensive measurement micro-phone and pre-amplifi er. Now we will start making measurements with Studio EQ software and implementing the on-board electronic circuits available on the Opal in order to adjust the low frequency response of our system.
Opal on board electronicsThere are several on-board controls on the Opal speaker that can be implemented in order to make adjustments to the low frequency response.
Parametric Notch Filter – The Opal features a high quality parametric notch fi lter that functions between 40Hz and 240Hz. It is comprised of three separate controls.
Q - This control defi nes the bandwidth or Q of the notch. a. Position 1 – is equivalent to a Q of 50 b. Position 2 – is equivalent to a Q of 30 c. Position 3 – is equivalent to a Q of 20 d. Position 4 – is equivalent to a Q of 15 e. Position 5 – is equivalent to a Q of 10 f. Position 6 – is equivalent to a Q of 5

- T E C H N I C A L W H I T E P A P E R -
Performance Optimization of Speakers and the Listening Space
by Marcelo VercelliHead of EngineeringEvent Electronics
Published November 2nd, 2010 www.eventelectronics.com
Freq Knob = 50HzDepth Knob = 6“Q” Knob Positions 1 through 6
Freq Knob = 100HzDepth Knob = 6“Q” Knob Positions 1 through 6
Freq Knob = 200HzDepth Knob = 6Q Knob Positions 1 through 6
Here you can see how the bandwidth of the notch changes relative to the selected position. Keep in mind that position 1 represents the highest “Q” with the narrowest bandwidth and position 6 representing the widest bandwidth with the lowest “Q”. (Not intuitive, sorry about that)

- T E C H N I C A L W H I T E P A P E R -
Performance Optimization of Speakers and the Listening Space
by Marcelo VercelliHead of EngineeringEvent Electronics
Published November 2nd, 2010 www.eventelectronics.com
Depth Knob – This knob controls the acoustic depth of the notch fi lter.
g. Position 1 – is equivalent to a depth of 0dB or the OFF Position for the fi lter h. Position 2 – – is equivalent to a depth of -1.5dB i. Position 3 – is equivalent to a depth of -3.0dB j. Position 4 – is equivalent to a depth of -6.0dB k. Position 5 – is equivalent to a depth of -12.0dB l. Position 6 – is equivalent to a depth of -18.0dB
Freq Knob = 50HzQ Knob = Position 1Depth Knob = 1 through 6
Freq Knob = 100HzQ Knob = Position 1Depth Knob = 1 through 6
Freq Knob = 200HzQ Knob = Position 1Depth Knob = 1 through6

- T E C H N I C A L W H I T E P A P E R -
Performance Optimization of Speakers and the Listening Space
by Marcelo VercelliHead of EngineeringEvent Electronics
Published November 2nd, 2010 www.eventelectronics.com
Making Measurements with Studio EQ
Hardware and Software Setup and Noise Calibration (Win 7)After you plug in the USB sound card, your PC will typically assign the audio out and mic in to the new source. Connect the USB audio output to the Opals using the included wiring harness. Now set up and connect your test microphone.
Once you arrive at Step 5, open Control Panel /Hardware and Sound/Sound click on the Recording tab. Here you will make sure that the mic level is set up correctly. On the Step 5 page, press the Test Tone button. You should now see at least one bar appear on the Microphone level meter. To increase the level, hit the Properties / Levels tab and increase the microphone level until you see at least one bar.
Under the Custom tab, you may also fi nd an optional Microphone Boost option; it’s a good idea to select this feature as long as the input is not overloaded.
With the microphone in a location near to where your ears would be, point the microphone to the front of the room and not directly to the speaker your are measuring; remember, we are trying to measure low frequencies. The height of the microphone should also approximate the location of your ears.

- T E C H N I C A L W H I T E P A P E R -
Performance Optimization of Speakers and the Listening Space
by Marcelo VercelliHead of EngineeringEvent Electronics
Published November 2nd, 2010 www.eventelectronics.com
The fi rst measurement in our example room and set up.
I ran a measurement, clicked the Hold Current button and then ran the measurement again. This simply helps me verify the modes of the room at this particular location. The mode at 85Hz is measureable here and at locations where I move the microphone side to side in front of the speaker.
Now I want to calculate a notch value that can be implemented to smooth out the notch. I click the EQ Calculator button, and the calculator page appears.
The calculator allows you to graphically visualize the shape of the notch fi lter we are going to implement. Let’s implement and measure again.

- T E C H N I C A L W H I T E P A P E R -
Performance Optimization of Speakers and the Listening Space
by Marcelo VercelliHead of EngineeringEvent Electronics
Published November 2nd, 2010 www.eventelectronics.com
We can see a slight improvement in the 85Hz peak. Let’s increase the Depth of the fi lter by increasing the value from 2 to 3. Measure again.
This made a big difference and fl attened the response down to 40Hz. Now, let’s start with the right speaker.

- T E C H N I C A L W H I T E P A P E R -
Performance Optimization of Speakers and the Listening Space
by Marcelo VercelliHead of EngineeringEvent Electronics
Published November 2nd, 2010 www.eventelectronics.com
We see the same 85Hz mode but a bit more severe as it seems to be cutting energy above and below the mode. Look at the energy at 50Hz and the hole at 110Hz, some cancellation is occurring here.
Lets implement the same fi lter we had on the Left Speaker and measure. We also should move the microphone around to confi rm the existence of the modes.
We can see that the notch improved the performance below 85Hz, but the notch at 100-105hz is till there.

- T E C H N I C A L W H I T E P A P E R -
Performance Optimization of Speakers and the Listening Space
by Marcelo VercelliHead of EngineeringEvent Electronics
Published November 2nd, 2010 www.eventelectronics.com
Possible solutions for the null include the following:
• Move the speaker closer and farther away from the back wall• Move the speaker closer and farther away from the side wall• Increase the amount of dampening material to the back and side walls• Measure again
BUT BEFORE YOU DO THAT, MEASURE BOTH SPEAKERS! The additional sound source will fi ll in certain nodes and you may not need any additional adjustments.
This is now looking much better and closer to our ideal. The summation of the second source has created a null at 70Hz. Now let’s move the microphone in 12-inch (30cm) steps laterally in front of the speakers as if we were rolling side to side in front of our work surface.

- T E C H N I C A L W H I T E P A P E R -
Performance Optimization of Speakers and the Listening Space
by Marcelo VercelliHead of EngineeringEvent Electronics
Published November 2nd, 2010 www.eventelectronics.com
12-inch to the left.
The response is different and a little better.
12-inches to the right.
The response is now even better!

- T E C H N I C A L W H I T E P A P E R -
Performance Optimization of Speakers and the Listening Space
by Marcelo VercelliHead of EngineeringEvent Electronics
Published November 2nd, 2010 www.eventelectronics.com
The process of getting the bass response correct in a room is one of averaging and trade-offs. Studio EQ is an amazing tool that allows you to really see what is happening in any given room location. By interpreting the data and refi ning the listening space and the notch fi lter application, you can drastically improve and control the response of your listening space. Keep in mind that your ears are the most important tool you can use to determine what is “correct”. The combination of the human brain and ears are very complex apparatus and simply don’t compare to what a single, small diaphragm measurement microphone hears at one location. Even though the measurements show some response changes when moving side to side, with a set of ears and the psychoacoustic processing of the human brain involved, the perceived low frequency smooth will be super smooth.
I hope this paper has helped you better understand the physics involved in room acoustics as they apply to amplifi ed sound, and how to maximize the benefi ts of Studio EQ in achieving the best possible result when using Opal studio monitors.
The Event Opal represents a revolution in monitoring, and this information has been provided so that we can fully deliver on our promise: Opal, the single biggest improvement you can make to your sound.
Marcelo VercelliNovember 2010
StudioEQ System Technical DataSampling rate: 44.1 kHzSampling Method: 16384-point discrete Fourier TransformMeasurement Resolution: 2.7Hz Test Tone Stimulus: Pink Noise Measurement Gating: Test tone played 2500 mSec before the measurement is made in order to fully stimulate room modes.USB Audio processor: CMedia CM119