What did abolishing university fees in Ireland do? Kevin Denny · What did abolishing university...
28
UCD GEARY INSTITUTE DISCUSSION PAPER SERIES What did abolishing university fees in Ireland do? Kevin Denny * School of Economics & Geary Institute, University College Dublin May 20 th 2010 University tuition fees for undergraduates were abolished in Ireland in 1996. This paper examines the effect of this reform on the socio-economic gradient (SES) to determine whether the reform was successful in achieving its objective of promoting educational equality. It finds that the reform clearly did not have that effect. It is also shown that the university/SES gradient can be explained by differential performance at second level which also explains the gap between the sexes. Students from white collar backgrounds do significantly better in their final second level exams than the children of blue-collar workers. The results are very similar to recent findings for the UK. I also find that certain demographic characteristics have large negative effects on school performance i.e. having a disabled or deceased parent. The results show that the effect of SES on school performance is generally stronger for those at the lower end of the conditional distribution of academic attainment. Keywords: tuition costs, university, fees, socio-economic background, educational attainment * Address: Kevin Denny, Department of Economics, University of Kentucky, Lexington, 40506, KY, USA. Tel: +1 (859) 257 2101. Email: [email protected] . The author is also affiliated to the Institute for Fiscal Studies. Tarja Viitanen did a great job preparing the data which was kindly provided by the ESRI. I thank Colm Harmon, Vincent O’Sullivan & John Sheehan for helpful suggestions and Orla Doyle for detailed comments. This research was partly funded under the Programme for Research in Third Level Institutions at the UCD Geary Institute and was completed during a sabbatical visit to the Department of Economics, University of Kentucky.
Transcript of What did abolishing university fees in Ireland do? Kevin Denny · What did abolishing university...
UCD GEARY INSTITUTE
DISCUSSION PAPER SERIES
What did abolishing university fees in Ireland do?
Kevin Denny *
School of Economics & Geary Institute,
University College Dublin
May 20th
2010
University tuition fees for undergraduates were abolished in Ireland in 1996. This paper examines the effect of this reform on the socio-economic gradient (SES) to determine whether the reform was successful in achieving its objective of promoting educational equality. It finds that the reform clearly did not have that effect. It is also shown that the university/SES gradient can be explained by differential performance at second level which also explains the gap between the sexes. Students from white collar backgrounds do significantly better in their final second level exams than the children of blue-collar workers. The results are very similar to recent findings for the UK. I also find that certain demographic characteristics have large negative effects on school performance i.e. having a disabled or deceased parent. The results show that the effect of SES on school performance is generally stronger for those at the lower end of the conditional distribution of academic attainment. Keywords: tuition costs, university, fees, socio-economic background, educational attainment
* Address: Kevin Denny, Department of Economics, University of Kentucky, Lexington, 40506, KY, USA. Tel:
+1 (859) 257 2101. Email: [email protected]. The author is also affiliated to the Institute for Fiscal
Studies. Tarja Viitanen did a great job preparing the data which was kindly provided by the ESRI. I thank
Colm Harmon, Vincent O’Sullivan & John Sheehan for helpful suggestions and Orla Doyle for detailed
comments. This research was partly funded under the Programme for Research in Third Level Institutions
at the UCD Geary Institute and was completed during a sabbatical visit to the Department of Economics,
University of Kentucky.
What did abolishing university fees in Ireland do?
Kevin Denny *
School of Economics & Geary Institute,
University College Dublin
May 20th
2010
University tuition fees for undergraduates were abolished in Ireland in
1996. This paper examines the effect of this reform on the socio-
economic gradient (SES) to determine whether the reform was
successful in achieving its objective of promoting educational equality. It
finds that the reform clearly did not have that effect. It is also shown
that the university/SES gradient can be explained by differential
performance at second level which also explains the gap between the
sexes. Students from white collar backgrounds do significantly better in
their final second level exams than the children of blue-collar workers.
The results are very similar to recent findings for the UK. I also find that
certain demographic characteristics have large negative effects on
school performance i.e. having a disabled or deceased parent. The
results show that the effect of SES on school performance is generally
stronger for those at the lower end of the conditional distribution of
academic attainment.
Keywords: tuition costs, university, fees, socio-economic background, educational attainment
* Address: Kevin Denny, Department of Economics, University of Kentucky, Lexington, 40506, KY, USA. Tel: +1
(859) 257 2101. Email: [email protected]. The author is also affiliated to the Institute for Fiscal Studies. Tarja
Viitanen did a great job preparing the data which was kindly provided by the ESRI. I thank Colm Harmon,
Vincent O’Sullivan & John Sheehan for helpful suggestions and Orla Doyle for detailed comments. This research
was partly funded under the Programme for Research in Third Level Institutions at the UCD Geary Institute and
was completed during a sabbatical visit to the Department of Economics, University of Kentucky.
1
“Everybody knows the dice are loaded…” Leonard Cohen
1.Introduction
In Ireland there has been a long standing concern that people from a low socio-economic
status (SES) backgrounds are heavily under-represented in higher education in general and
universities in particular. This has been well established in several official reports and
particularly the work of Patrick Clancy, for example Clancy (1988, 2001) and most recently
O’Connell et al (2006). This implies a high inter-generational correlation in educational
attainment and this clearly constrains social mobility. Leaving aside concerns about equity, it
also implies an efficiency loss to the economy. The educational immobility between
generations in Ireland is high relative to many other countries: in a cross-country study of
inter-generational educational mobility using data on OECD countries Chevalier et al (2009)
find that the association between education levels of individuals and their parents was
highest in Ireland1. One might expect two sets of actions to follow from this: intensive studies
to understand why this is the case and, building on the ensuing findings, policies to redress it.
Unfortunately while the problem of educational inequality is well known, there has been a
dearth of research which establishing why low SES groups do not progress to higher
education. There are some qualitative studies on the subject as well as numerous policy
evaluations and reviews2. However these cannot (nor do they claim to) establish what the
causal mechanisms behind educational disadvantage are, still less to quantify them. Hence
they are of fairly limited assistance in the design of policy.
A proximate explanation for this dearth of work in Ireland is the lack of suitable publicly
available data that would allow one to investigate these matters. So while the scale of the
problem has been well documented, remarkably little is known about the underlying causes.
1 Using a different methodology and different data, Asplund et al (2008) also find that for a
subset of OECD countries the association between higher education and parental education is
highest in Ireland. Throughout the paper, references to Ireland exclude Northern Ireland
which is part of the United Kingdom. 2 For example Lynch & Riordan (1996), Osbourne & Leith (2000), Department of Education &
Science (2001,2003).
2
That said, the government operates several programs to deal with educational disadvantage
in schools under the heading “Delivering Equality of Opportunity in Schools” (DEIS). These
programmes provide differential support to schools that have been designated as
disadvantaged (“DEIS schools”). The effects of these programs have not in general been
studied using methods that would allow one to infer whether they have been effective or not.
This paper examines one of the most significant changes to higher education in Ireland in
recent decades, the abolition of undergraduate university fees for Irish and EU students in
1996. To understand the consequences of this reform it is also instructive to examine the
factors which predict academic success at secondary level, specifically in the national exams
taken by students who remain in school until the end of the secondary system.
In the absence of previous comparable studies for Ireland, it is worthwhile looking at the
international literature. The effects of SES on access for higher education and the impact of
changes in educational financing are two of the most widely studied questions in the
economics of education. There is, not surprisingly, a wide range of findings which are difficult
to summarize succinctly. In an influential study Carneiro & Heckman (2002) find that only a
small proportion (around 8%) of US school leavers were credit constrained when it came to
attending higher education. Applying the same methodology to UK data, Dearden et al (2004)
also find that credit constraints are comparatively unimportant. So these papers would tend
to suggest that it is long run factors that are important and hence changes in tuition costs are
unlikely to be important. Using a different approach, a recent study for the UK, Chowdry et al
(2010) finds that most of the differences in participation in higher education across socio-
economic groups can be explained by school attainment. In a Canadian study, Levin (1990)
finds that a policy of low tuition fees has not resulted in substantial changes in the
composition of the university population though a more recent study finds for Canada found
that increases in tuition costs has substantial negative effects on enrolment, see Neill (2009).
However this is not to imply money does not matter in general. A review of US studies, by
Deming & Dynarski (2009), finds that financial aid to students can be effective at increasing
participation (& retention) at university depending on how the programme is designed. So it
is far from clear, a priori, what to expect from the abolition of university fees and it will, in
general, depend on local circumstances and institutions.

3
The Irish educational system consists of six years of primary school (often preceded by two
years of pre-school) followed by secondary school which lasts five or six years. After three
years of secondary school (usually at the age of 15 or 16), students take the Junior Certificate,
a nationwide exam, usually in 8 or 9 subjects. Some students leave at this stage3.
The senior cycle of secondary school can be completed in two years, however many students
take a “transition year” first emphasizing non-academic skills before starting the two year
preparation for the final Leaving Certificate (LC) examination. The LC is usually taken in 7 or 8
subjects but only the best six are counted for the purpose of university qualification. As with
the Junior Certificate, English, Irish & Mathematics are compulsory. Papers can be taken at a
higher or lower level (“Honours” and “Pass”). The students’ grades on the best six subjects
are summarized in a single points score with a maximum of 100 points per subject for a total
maximum of 600 points.
Application to universities in Ireland is through a centralized clearing house, the Central
Applications Office (CAO). Students make one application on which they list their top 10
choices of degree programme. This application is made in the final year of secondary school
and before they take the LC. Offers for a place on a particular course at a particular university
are made to the highest scoring students who applied for that course at that university as
their first preference.4 Further offers are made on the basis of grades until all places have
been filled – some students will turn down their initial offers. Students who are not offered
their first ranked course are then considered for their second ranked course and the process
continues until all places are allocated. As the number of students applying for places
generally exceeds the supply the system is characterized by a high level of excess demand and
particularly for more prestigious courses. Students are free to repeat the exams and re-apply
or they may apply in one year on the basis of their exams taken in a previous year. In making
an application, it is not possible to combine exam results from different years.
3 The “retention rate”, the proportion of the cohort which starts secondary school and remain
to take the Leaving Certificate, has risen steadily since the 1960s. In 1960 the rate was 20%
and was about 75% in 1995. Thereafter growth has leveled off at just over 80%, see
Department of Education (2008) Figure F. 4 Details of the scoring system are at www.cao.ie/index.php?page=scoring, see also Gormley
and Murphy (2006) for a detailed description of the university admissions system in Ireland.
As of 2009, entrance to medical schools depends also depends on an aptitude test.
4
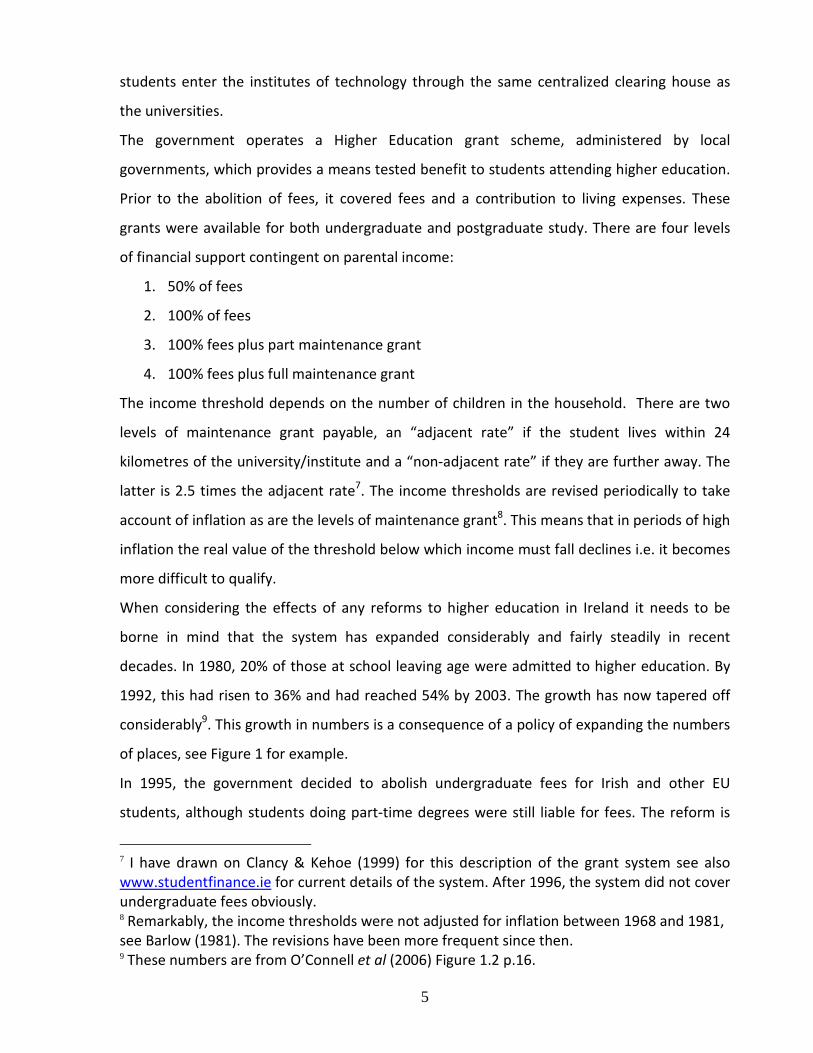
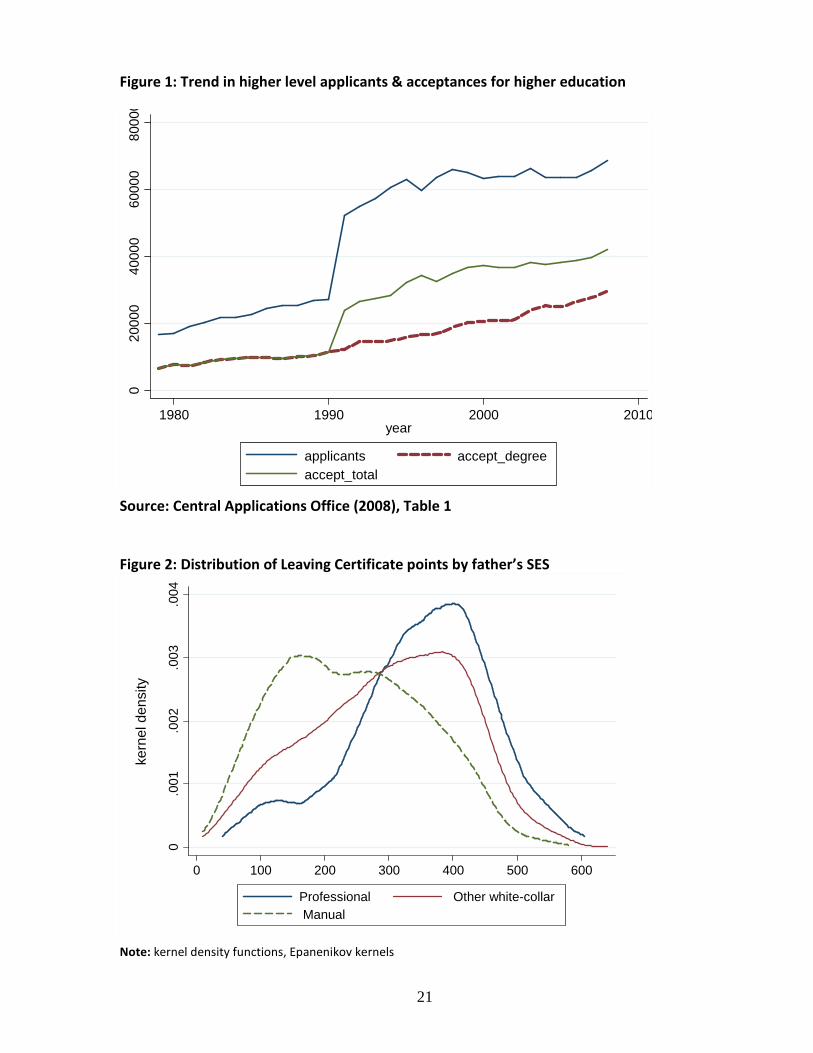
Figure 1 graphs the total number of applications made for higher education courses made via
the CAO. From 1979 to 1990 (inclusive) only applications for degree courses in universities
were made through the CAO. For these years one can see that the number of applicants is a
multiple of the number of acceptances (which is essentially the number of places available).
Not all students who apply will subsequently achieve the minimum points required to enter
university so the “true” excess demand may be less that the gap between the number of
applications and the number of acceptances. Nevertheless, the basic picture would not be
changed if one allows for this. After 1990, the CAO also dealt with applications for degree and
non-degree (i.e. diploma) courses in non-university institutions hence the increase in both the
number of applications and acceptances. While this complicates the picture somewhat the
basic fact, of a high level of excess demand for higher education places, is unchanged.
The minimum level of points required to enter particular programs varies widely both across
subject and, to a lesser extent, across institution. To enter medicine (or veterinary medicine)
in any university typically requires around 570 points, business, law and engineering degrees
are usually in the 440-520 range with humanities and social sciences in the 330-400 range. In
general it does not matter through which LC subjects a student acquires their points: it is
simply the total that counts although some programmes, like Engineering and Medicine,
require minimum levels of attainment in some LC science subjects.
There are seven universities in Ireland as well as a medical school, the Royal College of
Surgeons in Ireland (RCSI), and St Patricks Pontifical University, a religious institution. There
are fourteen institutes of technology, six teacher training colleges and approximately eleven
other institutions (including private colleges and colleges specialising in theology, hotel
management, arts and other areas)5. In 2004 the universities and institutes of technology
accounted for 47.3% and 41.9% respectively of new entrants to higher education6. This paper
is concerned only with entrance to the universities (but excluding St Patricks) as they form a
distinct group. Institutes of technology provide a diverse range of courses in more vocational
areas and award a mixture of degrees, diplomas and other certification. Some, but not all,
5 See O’Connell et al (2006) figure 1.3 p.17 for a list.
6 ibid Table 2.1 p.22. In the period which this paper studies, the mid 1990s, the relative
proportions were similar.
5
students enter the institutes of technology through the same centralized clearing house as
the universities.
The government operates a Higher Education grant scheme, administered by local
governments, which provides a means tested benefit to students attending higher education.
Prior to the abolition of fees, it covered fees and a contribution to living expenses. These
grants were available for both undergraduate and postgraduate study. There are four levels
of financial support contingent on parental income:
1. 50% of fees
2. 100% of fees
3. 100% fees plus part maintenance grant
4. 100% fees plus full maintenance grant
The income threshold depends on the number of children in the household. There are two
levels of maintenance grant payable, an “adjacent rate” if the student lives within 24
kilometres of the university/institute and a “non-adjacent rate” if they are further away. The
latter is 2.5 times the adjacent rate7. The income thresholds are revised periodically to take
account of inflation as are the levels of maintenance grant8. This means that in periods of high
inflation the real value of the threshold below which income must fall declines i.e. it becomes
more difficult to qualify.
When considering the effects of any reforms to higher education in Ireland it needs to be
borne in mind that the system has expanded considerably and fairly steadily in recent
decades. In 1980, 20% of those at school leaving age were admitted to higher education. By
1992, this had risen to 36% and had reached 54% by 2003. The growth has now tapered off
considerably9. This growth in numbers is a consequence of a policy of expanding the numbers
of places, see Figure 1 for example.
In 1995, the government decided to abolish undergraduate fees for Irish and other EU
students, although students doing part-time degrees were still liable for fees. The reform is
7 I have drawn on Clancy & Kehoe (1999) for this description of the grant system see also
www.studentfinance.ie for current details of the system. After 1996, the system did not cover
undergraduate fees obviously. 8 Remarkably, the income thresholds were not adjusted for inflation between 1968 and 1981,
see Barlow (1981). The revisions have been more frequent since then. 9 These numbers are from O’Connell et al (2006) Figure 1.2 p.16.
6
generally referred to as the “free fees” initiative. Fees were cut by 50% in 1995 and
eliminated thereafter. In addition a tax covenant scheme whereby family members of fee
paying students could effectively write off these fees against tax was abolished. The
universities received a block grant in lieu of the fee income. This policy was outlined in a
government White Paper in which it was asserted that “These decisions are a major step
forward in the promotion of equality. They remove important financial and psychological
barriers to participation at third level.” (Department of Education & Science (1995), p106).
No evidence was cited to support this ex ante or ex post. Some of the thinking behind this
change has also been provided, albeit retrospectively, by the Minister of Education at the
time of the reform who attributes to the reform increased numbers at university, seemingly
unaware of the consistent upward trend in numbers throughout the period generated by
increased supply, see Bhreathnach (2008). More cynical observers have suggested that the
imminence of a general election (one was held in 1997) may have been responsible for the
apparent alacrity with which the reform was introduced. At the time of the reform university
fees varied between degree programs significantly (and to a lesser extent between
universities) with fees in subjects like medicine, science and engineering higher than
humanities, business and law10
. These fee differentials remain for non-EU students applying.
An irony associated with the timing of this policy is its pro-cyclicality: at the Irish economy has
started to grow rapidly with incomes rising across the board.
A priori, given the high level of excess demand (with the number of applicants around twice
the number of places) a reform which would stimulate demand seems unlikely to be effective.
Moreover it achieves this by changing the relative price against the population who are
under-represented. The reform also clearly generates a deadweight loss: individuals who
were willing to pay for an investment now benefitted from the investment at the taxpayers’
expense. An argument in favour of the policy that has been made was that the fees acted as a
barrier to individuals whose parents’ income was just above the threshold to qualify for the
Higher Education grant, largely from low income white-collar backgrounds. Raising the
threshold would obviously have been a more efficient solution to this problem to the extent
that it existed.
10
See Clancy & Kehoe (1999) Table 1, p.45 for example. Students who have to repeat an
academic year are also liable for fees.
7
This paper uses pooled cross-section survey data on school leavers to see whether the reform
in question changed the SES gradient with respective to university progression. It also
examines a closely related question the extent to which family background, including SES,
predicts educational attainment at second level immediately prior to leaving school.
2.Data
The data used to conduct the analysis is the ESRI School Leavers Survey. This is a random
sample of individuals, collected annually, who were sampled approximately 9 months after
they leave school11
. The sample size varies between 2000 to 3000. The analysis here uses case
deletion which reduces the effective sample size. Since the reform occurs in 1996, we use
data for years 1994-1998 to abstract from any trends that may be occurring. Data for the
years 1991-1993 are also available, however the results are not substantially changed if all
years are included. After the period, the survey was discontinued although its collection has
been resumed subsequently.
Because individuals are sampled 9 months after leaving school, those who start university
after this will not be recorded as university students. Universities have “mature student”
programs to encourage access by those who have left school a few years. In addition, one
university has an evening degree though prospective students must have left school several
years before they can enter this program. However in Ireland these forms of progression to
university are relatively unusual and account for a small proportion of university students.
Compared to the US, for example, Ireland is not a “second chance” society with most
students entering university directly after school.
3. Results
To investigate the possible effect of the abolition of fees on progression to university I
estimate a set of probit models using pooled cross-section data for a five year period
spanning the reform. As noted above, higher education in Ireland is and has been
11
For more details on this data source see, for example, Byrne et al (2009).
8
characterized by significant excess demand. So increases in aggregate participation are
uninformative about any changes in demand. Having investigated the participation decision,
an analysis of the determinants of attainment at second level is presented since this sheds a
great deal of light on how SES impacts on university progression.
3.1 Modelling the probability of going to university
This section models the probability of a school leaver progressing to university. The
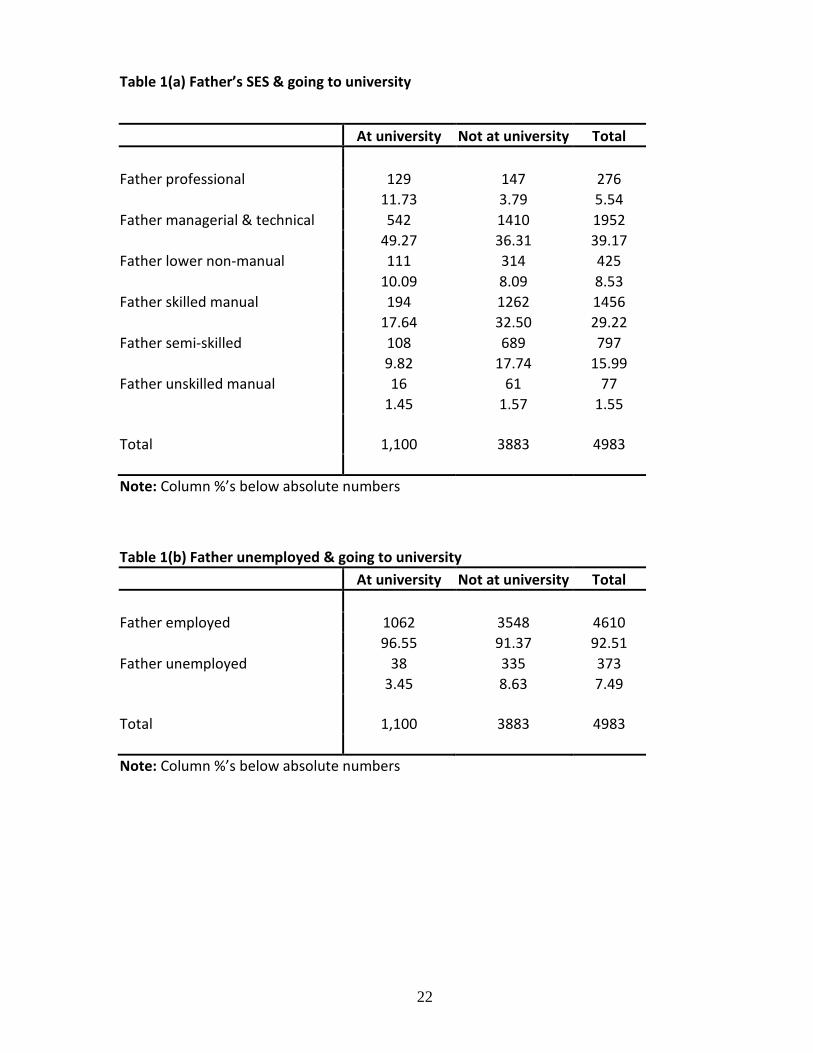
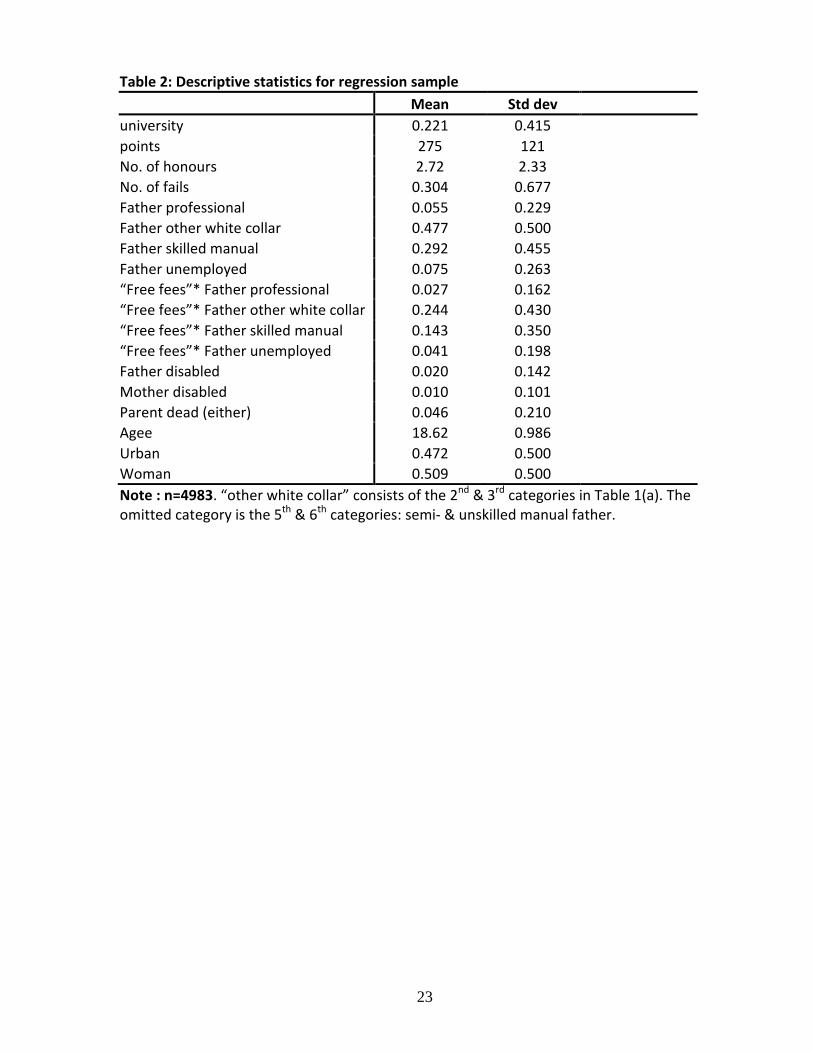
dependent variable is a dummy for whether an individual went to university or not. Table 1(a)
and 1(b) contain cross tabulations of the dependent variable against two measures of the
father’s economic circumstances, a 6 category classification of SES and a binary indicator for
whether he was unemployed. Descriptive statistics for the regression sample are in Table 2.
One can see from a glance at Table 1(a) that the proportion of respondents going to
university is higher for those with higher SES backgrounds, the Pearson test rejects the null of
independence: χ2(5)=237, p=.000. Table 1(b) shows a positive association between going to
university and one’s father being employed. The Pearson test again rejects the null of
independence: χ2(5)=33.12, p=.000.
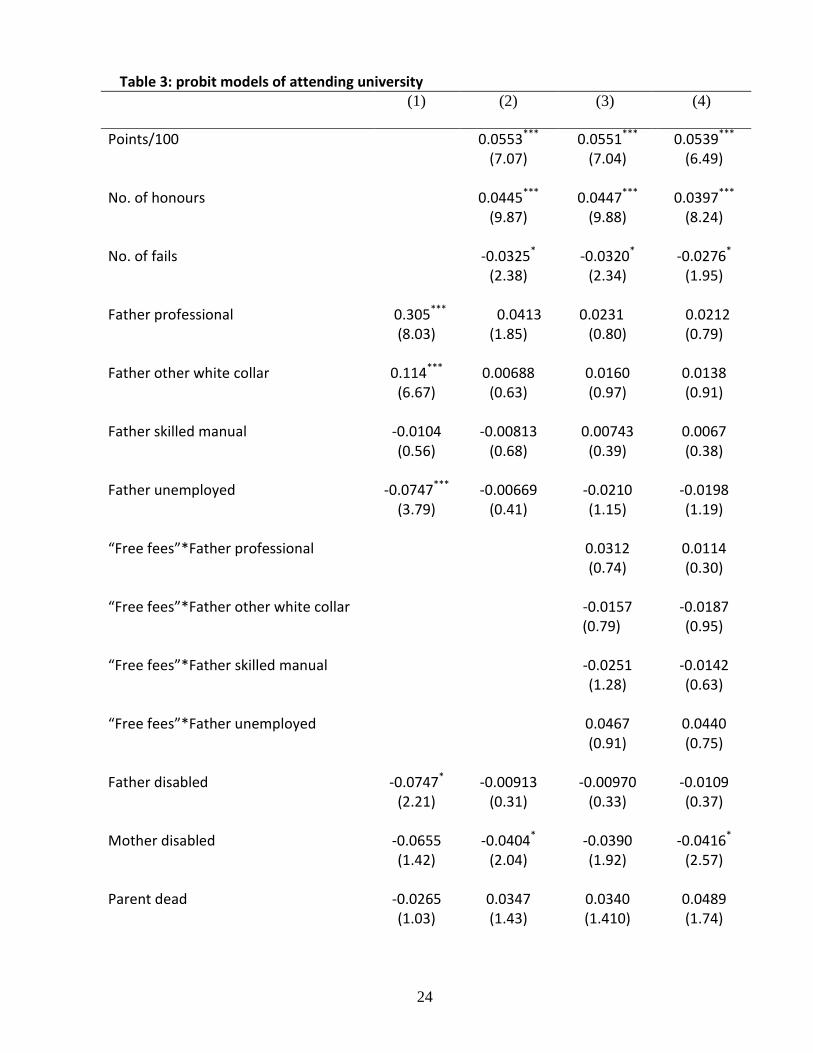
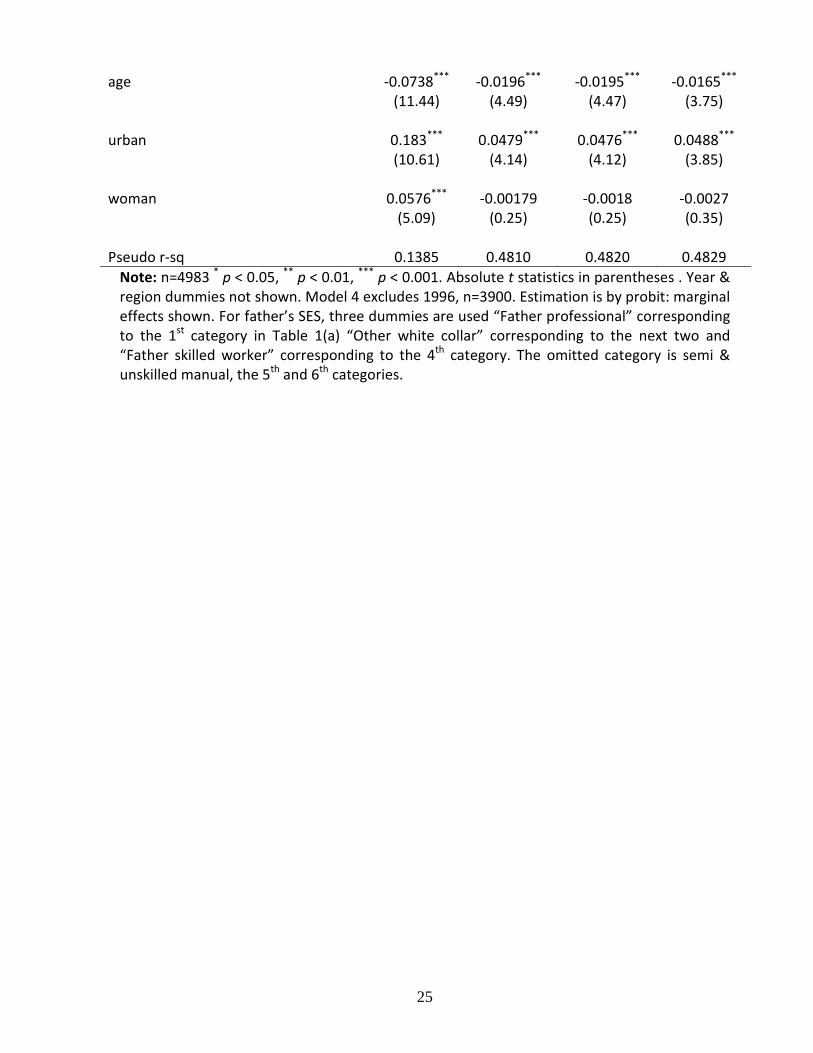
Table 3 presents the results from four models with different specifications. The first column
models attending university as a function of the student’s socio-economic background
measured in terms of their father’s occupation and labour market status and a small number
of other characteristics but excluding any measure of performance in school12
. The first three
coefficients show the socio-economic gradient: a student whose father is a professional is
about 30% (i.e. 30 percentage points) more likely to attend university than one who’s father is
semi- or unskilled. For the child of a father in the “other white collar” category the probability
of attending university is 11% higher. That such a gradient exists is not surprising since the
higher attendance at university by those of higher SES has been documented exhaustively in a
series of reports published by the Higher Education Authority and initially compiled by Patrick
Clancy starting in 1982, see Clancy (1982,2001) for example and O’Connell et al (2004).
12 All models include a full set of region dummies (i.e. where the students are from) and year
dummies which will control for any aggregate changes such as the expansion of the university
sector in general.
9
However multivariate analyses of this relationship are much less common and there does not
appear to be papers which allow for school performance as this one does. It is worth noting
that there is no statistically significant difference between the different three lower SES
categories: the children of skilled, semi-skilled and un-skilled manual workers – the latter two
being the omitted category. In general the earnings of the fathers in these three groups could
differ quite significantly thus if credit constraints were in operation we would expect to find
some differences in the proportion of their children attending university. By contrast, those
whose fathers are unemployed are about 7% less likely to go to university, which may
indicate the presence of credit constraints. However it is important to bear in mind that those
from low income backgrounds are likely to be in receipt of the Higher Education grant which
may have had the effect of neutralizing any credit constraints13
.
The second model adds measures of the student’s performance in the Leaving Certificate
which is the nationwide baccalaureate type exam which is required for entry to university14
. I
include the number of LC points achieved and the number of honours grades (an A, B or C on
a higher level exam) and the number of fails (E or lower on any exam). Alternatively one could
have included some non-linearity in the total number of points such as a polynomial or a
linear spline function however the results of interest are not sensitive to this choice. As
expected, the probability of attending university is increasing in the points score and the
number of honours and is decreasing in the number of fails. What is important here is the
impact of these variables on the coefficients for father’s SES and labour market status: they
are clearly much smaller & less well determined than in the previous model. A joint test for
their statistical significance is borderline χ2(4)=9.33 , p=.0533. It is also interesting that once
one includes these Leaving Certificate variables that the coefficient on the female dummy
variable is no longer statistically significance i.e. all of the differences between the sexes in
terms of going to university can be explained by the fact that the girls do better in school.
13 At the time of the reform, for example about 30% of undergraduates at University College
Dublin, Ireland’s largest university, were in receipt of the High Education Grant (author’s
calculations). 14 Students applying from outside Ireland qualify on the basis of their own national exams
while a very small number of Irish students take the International Baccalaureate or UK A
levels.
10
It is clear that the coefficients on SES are a fraction of what they were in the previous model
(column 1). The third model addresses the possible impact of the abolition of university fees
by including a set of interactions between a “free fees” dummy variable with the four
measures of the father’s economic circumstances (the three SES dummies & father’s
unemployment). The “free fees” dummy variable indicates if the respondent entered
university after 1995. The results show that the inclusion of these variables does not
substantially change the results of interest. A test for the joint significance of the four
interactions is χ2(4)=5.23, p=.2644. A test for the joint significance of the original four direct
effects is now χ2(4)=3.06 , p=.5477 while a test for the joint significance of all eight
coefficients is χ2(8)=14.40, p=.0718.
Since students were liable for 50% of fees in 1995 an alternative specification of the reform is
as a step function equal to 0 before 1995, 0.5 in 1995 and 1 thereafter. Repeating the
estimates in Table 3 but using this step function to generate the interactions does not change
noticeably: the p values for the three tests reported above are .2027, .6957 and .0561
respectively. Since it is possible that secondary school students in 1996 might not have had
time to adjust their plans to the abolition of fees, the final column repeats the model in
column 3 but omitting that year. It is obvious that this too does not change the results to any
noticeable degree.
The results and these robustness tests demonstrate clearly that the policy of abolishing
university fees did nothing with regard to improving access to university amongst low SES
students which was a stated objective of the policy. Bearing in mind that most low income
students would typically not have been paying university fees (since most would be in receipt
of the Higher Education grant) one would not expect a reform which largely benefitted better
off students to somehow benefit low SES students. The logic of this apparently escaped
policy makers at the time.
3.2 Modelling the predictors of secondary school academic success
Given the evident importance of Leaving Certificate success for university and its implication
for the SES gradient it is worth investigating what are the predictors of this success so in this
11
section I model the determinants of LC points using linear regression. One could also apply
this or similar approaches to the number of honours or fails grades achieved but it would add
little of substance to the general findings. Before looking at the results of the estimation, it is
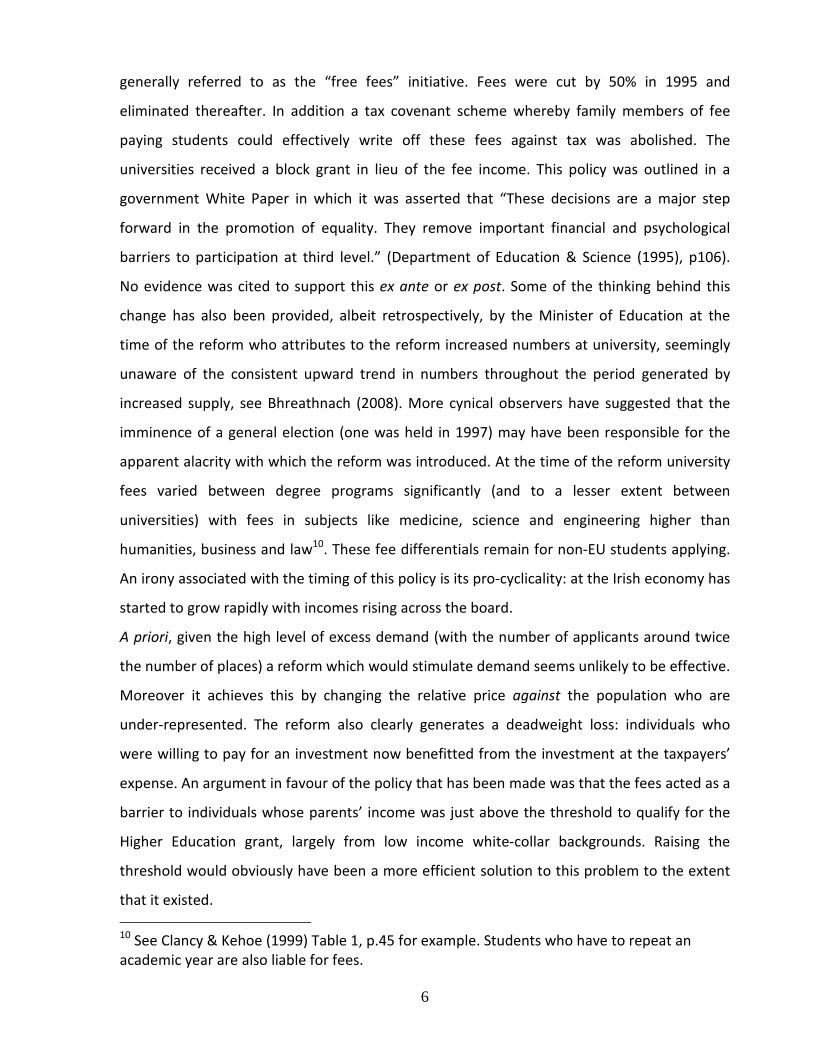
worth graphing the distribution of Leaving Certificate point to get an idea of what we might
expect, see Figure 2.
The location of the graph is as one would predict, the points distribution for those whose
fathers are professional is to the right followed by that of other non-manuals relative to that
of manual workers. However the graph reveals another interesting feature other than the
location of the means: the distribution for those from manual backgrounds is skewed right:
that is not only are their points lower than average but very few get high points (which would
be required for entry into the most sought-after degree programmes such as medicine). For
the other two groups the reverse is true with the distributions skewed to the left: the chances
of a student from a white-collar background achieving low points are quite low. Why this is so
is unclear. Whether this is due to how the respective schools operate or their parents is a
moot point.
On the basis of the results in Table 3 and Figure 1 one expects to find an SES gradient with
respect to points. Column 1 of Table 4 shows the results of a simple linear regression using
the same covariates as in Table 315
. What is very striking is the size of the coefficients on
father’s SES: the child of a professional can expect to get about 92 points (about .76 of a
standard deviation) more Leaving Certificate points than the child of a manual worker. For the
children of other non-manual workers the advantage is smaller, but sizeable, at around 47
points. The child of an unemployed man can expect to get about 30 points fewer. This clearly
explains why, in Table 3, once one controls for Leaving Certificate points, the direct effect of
SES essentially disappears.
Some of the other coefficients are notable. It is striking that a student’s father being disabled
is associated with a large penalty in terms of points. The data does not tell us whether the
student is disabled unfortunately. It is possible that there may be some inter-generational
correlation in disability (for example, if there is a congenital defect) so that this variable is
picking up the student’s own disability but it seems unlikely that this is the explanation. It
15 The interactions with the reform are not included since one would not expect the
relationship to change with the abolition of university fees.
12
seems more plausible that having a disabled parent effectively imposes a cost on a student,
perhaps through reducing the study time available to them if the student has to participate
more in home duties or take on paid employment. Since it is the disability of the father that
matters, typically the main earner in the household, this suggests that it is the effect on
household income that is driving this result.
One might conjecture that this effect differs between male and female students (for example
if daughters are more likely to take on domestic responsibilities) but one can reject this
hypothesis, F(2,4959)=0.68, p=.509. The last coefficient of interest is whether one of the
student’s parents is deceased. This too is associated with a significant penalty in terms of
lower points. Similar findings to these have been reported in the international literature, for
example Chen et al (2009) or the extensive literature on the consequences of single-
parenthood for example McLanahan and Sandefur (1997). Unfortunately the data does not
tell us how long the parent has been deceased and one might expect this to matter nor is
there other information on family structure such as birth order, siblings or the presence of
step-parents.
A linear regression models the conditional mean of the distribution so in this case it tells us
how an average student with particular characteristics can be expected to perform in the LC.
However the mean is not the only parameter of interest. Koenker & Basset (1978) developed
quantile regression to model conditional quantile functions. It generalizes Least Absolute
Deviations which models the conditional median function. While this technique is now widely
used in applied labour economics, especially in the study of earnings, care needs to be taken
in the interpretation of the results. In particular it needs to be remembered that the different
quantile functions refer to the conditional, not the unconditional distribution, of Y. The
interpretation here follows that of Arias et al (2001) which models earnings. To recall, the
model is
Y= βX + ε
In this case Y is our LC points variable and X is a design matrix of covariates (including a
constant) with associated parameter vector β. The disturbance term, ε , reflects unobserved
13
factors that generate high levels of points as well as any measurement error which is assumed
to be classical. Unobserved factors could include the innate ability of the students or perhaps
school quality. Since our model is necessarily simple, many factors could enter here. So in
modelling the conditional distribution of Y given X one is modelling the distribution of ε.
Hence one can think of the higher conditional quantiles as corresponding to “lucky” students
in that they have some unobserved characteristic(s) which generates higher scores in the
exams. This paper interprets ε as reflecting largely unobserved ability but it could also reflect
other factors such as school quality.
Columns 2 to 4 of Table 4 present estimates of conditional quantile functions corresponding
to the 25th
, 50th
and 75th
percentiles. One could have estimated a larger number of functions,
for example corresponding to the deciles, but the basic picture does not change so for
reasons of parsimony three quantile functions suffice.
The coefficients on fathers’ SES are higher at the lower quantiles, with a big difference for the
effect of having a father who is professional at the 25th
percentile compared to the 75th
percentile (113.03 vs. 74.04). Therefore if a student at the 25th
percentile of the conditional
distribution is, other things being equal, less able that someone at the 75th
then having a high
SES father have a greater impact on their points at the margin (relative to the omitted
category). Intuitively this could be because the high ability student “needs” less help or is able
to achieve his/her potential with less assistance. Alternatively it may be the case that parents
choose to provide greater assistance to their less able children. One can only speculate as to
the reason for this difference.
The same pattern applies for most of the other parental characteristics such as the penalty
associated with having a deceased parent or a disabled father. That is, a student who is
“unlucky” - in the sense of being at a lower conditional quantile of attainment- will suffer a
great penalty if they are unfortunate enough to have a deceased parent or a disabled father.
The size of these penalties, of the order of 50-70 points, is significant in that it would have
sizeable impact on what degree program a student could enrol in. One way of interpreting
this, perhaps, is that those at the lower quantiles are more vulnerable to these disadvantages.
14
4. Conclusions and implications for policy
For young people from a low SES background in Ireland who wish to progress to university the
dice are firmly loaded against them16
. They will, on average, perform much worse in school
and this is why they are less likely to be successful when it comes to attending university. The
extent of this disadvantage may have lessened somewhat in recent decades as higher
education has expanded considerably. Hence policies that do not directly address the
underperformance at secondary level (i.e. high school) are unlikely to have a major impact on
the problem.
The main purpose of this paper was to investigate the effect, if any, of the abolition of
university fees in Ireland in the mid-1990s. This reform, and the possibility of reversing it, has
come under renewed discussion in recent years partly because of financial pressures on the
universities as well as a desire for greater financial autonomy by them. However a defence of
the reform that is commonly offered is that, somehow, it lead to greater access by groups
that have been traditionally under-represented in higher education in general and university
in particular. On the face of it, this is highly unlikely to be true since prior to the reform many
low income students did not pay fees because they received a means tested grant covering
both tuition costs and a contribution to their living expenses. In effect, the reform withdrew
the one advantage that low income students had relative to high income students. Defenders
of the policy might to a general increase in access by low income group over-time. This is not
serious evidence and ignores, in particular, the secular increase in the supply of places as
universities and other higher education institutions expanded, see the numbers cited on page
5 above and Figure 1. Indeed while the absolute numbers from low SES groups rose, as a
share they remained constant17
. The research design used here, a micro-econometric analysis
using a large representative sample, over a period spanning the introduction of the reform is
clearly superior methodologically.
16
The latest figures, for the academic years beginning 2007 & 2008 actually show a small
increase in the share of students coming from higher SES backgrounds, HEA(2010) Table 7.4. 17
Department of Education & Science (2003), Table 2.6
15
The results are clear and striking: the socio-economic gradient with regard to attending
university can essentially be explained by differential performance at secondary school level.
The gap between the sexes in progressing to university is also explained by the fact that girls
do better in secondary school. In Ireland, the abolition of fees did not change the effect of SES
on university entrance which was effectively zero before and after the reform once one
controls for exam performance. The only obvious effect of the policy was to provide a windfall
gain to middle-class parents who no longer had to pay fees18
. The failure of this policy to
redress educational inequalities should not come as a total surprise to policy makers, the
OECD(2004) spelt it out quite bluntly (p.56): “The free fees policy has not had the effects that
were hoped for in improving participation from students from disadvantaged backgrounds..”.
Moreover, the results reported here are very similar to those reported for the UK in Chowdry
et al (2009) who find that controlling for educational attainment at second level largely
explains the SES gradient with respect to third level education. As Nicholas Barr put it
succinctly: “It’s attainment, stupid” (quoted in Gill (2009)). However in evaluating the absence
of a direct SES effect conditional on school attainment it does not follow that “money doesn’t
matter”. Low income students would typically be in receipt of a means tested grant and this
may simply have neutralized the effect of any credit constraints.
The policy implication that one can draw from this, and a theme that is emerging generally in
the literature, is the importance of early interventions: disadvantage sets in early in life. Quite
how early is unclear with some authors, notably James Heckman and co-authors, pointing to
the necessity of very early interventions in life, see Doyle et al (2009) for an overview. So
while this paper demonstrates that performance at the final secondary school exam is the
proximate explanation for the SES gradient with respect to university it is not able to pinpoint
the ultimate explanation i.e. what accounts for the differential performance at secondary
level. It may be due to the differential effects of secondary schools however this cannot be
assumed. It could, for that matter, be due to differences in primary schooling. Students from
higher SES backgrounds make greater use of private tuition in preparing for the Leaving
Certificate but, paradoxically, it appears to have no beneficial effect, see Smyth (2009).
Perhaps it has nothing to do with schools at all but evolve from the home environment and
18
There is anecdotal evidence that this increased the demand for fee paying secondary
schools.
16
parental investment in particular. Most likely, it is a combination of these. So while this paper
can help rule out some explanations, it cannot pinpoint exactly where the disadvantage sets
in. One would need much better data for this.
This is not to say that early disadvantage cannot be remediated later to some extent. Irish
universities operate “Access Programmes” which are interventions targeted at disadvantaged
(“DEIS”) schools with a view to increasing the numbers of their students attending university
and supporting those who do make it to university. Denny et al (2010) evaluates one of these
programmes and finds well determined positive effects on students who received the
intervention. The scale of these programmes are relatively small however, between 1999 and
2004 about 2% of the incoming undergraduates in University College Dublin, Ireland’s largest
university, were part of this programme19
.
The results also reiterate what might seem an obvious point namely that for policies to be
successful they need to be targeted at the intended beneficiaries.
While this paper is primarily about the educational consequences of socio-economic
disadvantage, it has also provided evidence on another, perhaps surprising, form of
disadvantage namely large penalties – in the form of worse exam results- arising from having
a deceased or disabled parent. Students with special needs in second and third level are given
extra assistance for example additional time in exams. Here however the problem arises not
from the student’s own disability but from that of their parents. This suggests that the
education system needs to show greater awareness of such students, something which may
not be easily achieved. We clearly need to know more about the mechanisms through which
this disadvantage manifests itself for example is it because the student takes on additional
responsibility in the home? One thing that is clear is that there are different domains of
disadvantage and some of them may not be obvious.
19
See Denny et al (2010) Table 3.
17
References
Arias O., K.Hallock and W. Sosa-Escudero (2001) Individual heterogeneity in the returns to
schooling: instrumental variables quantile regression using twins data, Empirical Economics
26(1), 7-40
Asplund, R., O. Ben-Adbelkarim & A. Skalli (2008) An equity perspective on access to,
enrolment in and finance of tertiary education, Education Economics, 16(3), 261-274
Bhreathnach, N. (2008) Why third level fees were abolished in Ireland, Public Affairs Ireland,
51 (October) p.7
Barlow, A.C. (1981) The financing of third level education in Ireland, ESRI, Dublin, Paper no.
106
Byrne, D., S. McCoy & D. Watson (2009) School leavers survey report 2007 Economic and
Social Research Institute & Department of Education and Science, Dublin
Central Applications Office (2008) Board of Directors report 2008, CAO, Galway
Clancy, P. (1982) Participation in Higher Education: A National Survey, Dublin: Higher
Education Authority.
Clancy, P. (2001) College entry in focus: a fourth national survey of access to higher education
Higher Education Authority, Dublin
Clancy, P. & D.Kehoe (1999) Financing third level students in Ireland, European Journal of
Education, 34(1), 43-57
18
Chen, S., Y.C. Chen & J.T. Liu (2009) The Impact of Unexpected Maternal Death on Education:
First Evidence from Three National Administrative Data Links. American Economic Review
99(2), 149-153
Chowdry, H., C.Crawford, L.Dearden, A.Goodman & A.Vignoles (2010) Widening participation
in higher education: analyses using linked administrative data, Institute for Fiscal Studies,
London, Working Paper 10/04
Deming, D. & S.Dynarski (2009) Into college, out of poverty? Policies to increase
postsecondary attainment of the poor, NBER Working Paper w15387, NBER Cambridge, Mass.
Department of Education and Science (1995) Charting our Education Future, Department of
Education & Science, Dublin
Department of Education & Science (2001) Report of the action group on access to third level
education, Department of Education & Science, Dublin
Department of Education and Science (2003) Supporting Equity in Higher Education,
Department of Education & Science, Dublin.
Department of Education and Science (2008) Statistical report 2005/06, Department of
Education & Science/Stationery Office, Dublin.
Chevalier, A., K.Denny & D.McMahon (2009) Intergenerational Mobility and Education
Equality in Education and Inequality across Europe. Eds P. Dolton, R. Asplund, and E. Barth.
London: Edward Elgar.
19
Denny K., O. Doyle, P.O’Reilly & V.O’Sullivan (2010) Money, mentoring and making friends:
The Impact of a Multidimensional Access Program on Student Performance, UCD Geary
Institute Discussion Paper 21,
Doyle, O., C.Harmon, J.J. Heckman & R. Tremblay (2009) Investing in early human
development: Timing and economic efficiency, Economics and Human Biology, 7(1) , 1-6
Dearden, L., L.McGranahan & B.Sianesi (2004) The role of credit constraints in educational
choices: evidence from the NCDS and BCS70, CEEDP, 48. Centre for the Economics of
Education, London School of Economics
Gill, J. (2009) Fees do not harm access, says architect of policy, Times Higher Education
(January 22nd
2009):
Gormely, I.C & T.B. Murphy (2006) Analysis of Irish Third Level College Application Data,
Journal of the Royal Statistical Society Series A, 169(2): 361-379.
Heckman, J.J. & P.Carneiro (2002) The evidence on credit constraints in post-secondary
schooling Economic Journal 112(482), 705-734
HEA (2010) Higher Education: key facts and figures 08/09, Higher Education Authority, Dublin
Koenker R. & G. Bassett Jr. (1978) Regression quantiles Econometrica, 46(1), 33-50
Levin, B. (1990) Tuition Fees and University Accessibility Canadian Public Policy / Analyse de
Politiques, 16(1), 51-59
Lynch, K. & C. O'Riordan (1996) Social Class, Inequality and Higher Education: Barriers to
Equality of Access and Participation among School Leavers, University College Dublin,
Registrar's Office.
20
McLanahan, S. & G. Sandefur (1997) Growing up with a single parent: what helps, what hurts,
Harvard University Press, Cambridge, Mass.
Neill, C. (2009) Tuition fees and the demand for university place, Economics of Education
Review, 28(5), 561-570
OECD (2004) Review of National Policies for Education: review of higher education in Ireland
OECD,Paris
Osborne, R. & H. Leith (2000) Evaluation of the Targeted Initiatives on Widening Access for
Young People from Socio-Economically Disadvantaged Backgrounds, Higher Education
Authority, Dublin.
O’Connell, P., S. McCoy & D .Clancy (2006) Who Went to College in 2004? A National Survey of
New Entrants to Higher Education, Higher Education Authority, Dublin
Smyth E. (2009) Buying your way into college? Private tuition and the transition to higher
education in Ireland, Oxford Review of Education, 35(1), 1-22
21
Figure 1: Trend in higher level applicants & acceptances for higher education
020
000
4000
060
000
8000
0
1980 1990 2000 2010year
applicants accept_degreeaccept_total
Source: Central Applications Office (2008), Table 1
Figure 2: Distribution of Leaving Certificate points by father’s SES
0.0
01.0
02.0
03.0
04
0 100 200 300 400 500 600
Professional Other white-collar Manual
kern
el d
ensi
ty
Note: kernel density functions, Epanenikov kernels
22
Table 1(a) Father’s SES & going to university
At university Not at university Total
Father professional 129 147 276
11.73 3.79 5.54
Father managerial & technical 542 1410 1952
49.27 36.31 39.17
Father lower non-manual 111 314 425
10.09 8.09 8.53
Father skilled manual 194 1262 1456
17.64 32.50 29.22
Father semi-skilled 108 689 797
9.82 17.74 15.99
Father unskilled manual 16 61 77
1.45 1.57 1.55
Total
1,100 3883 4983
Note: Column %’s below absolute numbers
Table 1(b) Father unemployed & going to university
At university Not at university Total
Father employed 1062 3548 4610
96.55 91.37 92.51
Father unemployed 38 335 373
3.45 8.63 7.49
Total
1,100 3883 4983
Note: Column %’s below absolute numbers
23
Table 2: Descriptive statistics for regression sample
Mean Std dev
university 0.221 0.415
points 275 121
No. of honours 2.72 2.33
No. of fails 0.304 0.677
Father professional 0.055 0.229
Father other white collar 0.477 0.500
Father skilled manual 0.292 0.455
Father unemployed 0.075 0.263
“Free fees”* Father professional 0.027 0.162
“Free fees”* Father other white collar 0.244 0.430
“Free fees”* Father skilled manual 0.143 0.350
“Free fees”* Father unemployed 0.041 0.198
Father disabled 0.020 0.142
Mother disabled 0.010 0.101
Parent dead (either) 0.046 0.210
Agee 18.62 0.986
Urban 0.472 0.500
Woman 0.509 0.500
Note : n=4983. “other white collar” consists of the 2nd
& 3rd
categories in Table 1(a). The
omitted category is the 5th
& 6th
categories: semi- & unskilled manual father.
24
Table 3: probit models of attending university
(1) (2) (3) (4) Points/100 0.0553
*** 0.0551
*** 0.0539
***
(7.07) (7.04) (6.49)
No. of honours 0.0445***
0.0447***
0.0397***
(9.87) (9.88) (8.24)
No. of fails -0.0325* -0.0320
* -0.0276
*
(2.38) (2.34) (1.95)
Father professional 0.305***
0.0413 0.0231 0.0212
(8.03) (1.85) (0.80) (0.79)
Father other white collar 0.114***
0.00688 0.0160 0.0138
(6.67) (0.63) (0.97) (0.91)
Father skilled manual -0.0104 -0.00813 0.00743 0.0067
(0.56) (0.68) (0.39) (0.38)
Father unemployed -0.0747***
-0.00669 -0.0210 -0.0198
(3.79) (0.41) (1.15) (1.19)
“Free fees”*Father professional 0.0312 0.0114
(0.74) (0.30)
“Free fees”*Father other white collar -0.0157 -0.0187
(0.79) (0.95)
“Free fees”*Father skilled manual -0.0251 -0.0142
(1.28) (0.63)
“Free fees”*Father unemployed 0.0467 0.0440
(0.91) (0.75)
Father disabled -0.0747* -0.00913 -0.00970 -0.0109
(2.21) (0.31) (0.33) (0.37)
Mother disabled -0.0655 -0.0404* -0.0390 -0.0416
*
(1.42) (2.04) (1.92) (2.57)
Parent dead -0.0265 0.0347 0.0340 0.0489
(1.03) (1.43) (1.410) (1.74)
25
age -0.0738***
-0.0196***
-0.0195***
-0.0165***
(11.44) (4.49) (4.47) (3.75)
urban 0.183***
0.0479***
0.0476***
0.0488***
(10.61) (4.14) (4.12) (3.85)
woman 0.0576***
-0.00179 -0.0018 -0.0027
(5.09) (0.25) (0.25) (0.35)
Pseudo r-sq 0.1385 0.4810 0.4820 0.4829
Note: n=4983 * p < 0.05, **
p < 0.01, ***
p < 0.001. Absolute t statistics in parentheses . Year &
region dummies not shown. Model 4 excludes 1996, n=3900. Estimation is by probit: marginal
effects shown. For father’s SES, three dummies are used “Father professional” corresponding
to the 1st
category in Table 1(a) “Other white collar” corresponding to the next two and
“Father skilled worker” corresponding to the 4th
category. The omitted category is semi &
unskilled manual, the 5th
and 6th
categories.

26
Table 4: Determinants of Leaving Certificate points
OLS Quantile
regressions
.25 .50 .75
Father professional 92.19***
113.30***
96.00***
74.04***
(12.73) (10.59) (9.59) (8.48)
“ other white collar 46.88***
51.67***
54.00***
42.12***
(10.49) (7.32) (7.23) (7.59)
“ skilled manual -2.691 -3.333 -8.000 -6.442
(0.57) (0.49) (1.09) (1.13)
“ unemployed -30.23***
-35.00***
-35.00***
-30.67**
(4.83) (5.05) (4.25) (2.98)
Father disabled -50.58***
-60.00***
-70.00***
-44.33*
(4.18) (5.20) (4.21) (2.29)
Mother disabled -23.65 -36.67 -34.00 -46.92
(1.43) (1.92) (1.52) (1.15)
Parent dead -33.53***
-46.67***
-41.00***
-26.35*
(4.42) (4.81) (3.89) (2.12)
age -16.33***
-11.67***
-20.00***
-21.83***
(10.23) (4.79) (8.67) (9.89)
urban 56.18***
73.33***
70.00***
55.96***
(11.89) (10.01) (10.58) (9.40)
woman 26.64***
21.67***
31.00***
27.40***
(8.44) (4.94) (6.45) (6.72)
r-sq 0.1584 0.0806 0.1079 0.1076
Notes: N=4983. * p < 0.05,
** p < 0.01,
*** p < 0.001. Absolute t statistics in parentheses. The
1st
column is a OLS regression. Columns 2-4 are quantile regressions. Coefficients for region &
year dummies are not shown. T ratios for the quantile regressions are based on bootstrapped
standard errors, 500 replications.