Washington State Actuarial Valuation of LEOFF 1 Medical...
46
Office of the State Actuary “Securing tomorrow’s pensions today.” Washington State June 2013 Actuarial Valuation of LEOFF 1 Medical Benefits
Transcript of Washington State Actuarial Valuation of LEOFF 1 Medical...

Office of the State Actuary“Securing tomorrow’s pensions today.”
Washington State
June 2013
Actuarial Valuation of LEOFF 1 Medical Benefits


To obtain a copy of this report in alternative format call 360.786.6140 or for TDD 711.
Mai l ing Address PhoneOffice of the State Actuary Reception: 360.786.6140PO Box 40914 TDD: 711Olympia, Washington 98504-0914 Fax: 360.586.8135
Phys ical Address E lect ronic Contact2100 Evergreen Park Dr. SW [email protected] 150 osa.leg.wa.gov
Report Preparat ionMatthew M. Smith, FCA, EA, MAAAState Actuary
Kelly Burkhart Troy Dempsey, ASA, EA, MAAAAaron Gutierrez, MPA, JD Michael HarbourElizabeth Hyde Devon Nichols, MPA Darren Painter Christi SteeleKyle Stineman Keri WallisLisa Won, ASA, FCA, MAAA
Addit ional Ass is tanceDepartment of Retirement SystemsWashington State Investment Board
Office of the State Actuary“Securing tomorrow’s pensions today.”
Connect with us on social media. Click the linked images below.


Actuar ia l Valuat ion of LEOFF 1 Medical Benef i ts i
Table of Contents
Letter of Introduction .....................................................................................................1
Key Results .....................................................................................................................3Comments on 2011 Results .................................................................................................... 4
Section One - Background .........................................................................................5-8OPEB ......................................................................................................................................... 5
Necessary Medical Expenses ................................................................................................... 5
Disability Boards ........................................................................................................................ 5
Insurance ................................................................................................................................. 6
GASB 43/45 .............................................................................................................................. 6
Actuarial Valuation ................................................................................................................... 7
Funding Policy .......................................................................................................................... 8
Section Two - Actuarial Exhibits .................................................................................9-18Actuarial Certification ............................................................................................................... 9
Present Value of Future Benefits .............................................................................................. 11
GASB No. 45 Liability ............................................................................................................... 11
ARC, Annual OPEB Cost, and NOO ......................................................................................... 12
Amortization Schedule ............................................................................................................ 12
Assets ...................................................................................................................................... 13
Funded Ratio .......................................................................................................................... 14
Covered Payroll ...................................................................................................................... 14
Unfunded Liability as a Percentage of Covered Payroll .......................................................... 14
Percentage of ARC Contributed ............................................................................................. 15
Gain/Loss Analysis ................................................................................................................... 15
Projections .............................................................................................................................. 16
Section Three - Sensitivity Analysis ...........................................................................19-20
Section Four - Participant Data ...............................................................................21-30Summary of Plan Participants ................................................................................................. 21
Summary of Employers .......................................................................................................... 22
Section Five - Appendices .....................................................................................31-36Actuarial Methods .................................................................................................................. 31
Economic Assumptions .......................................................................................................... 31
Demographic Assumptions .................................................................................................... 33
Summary of Plan Provisions .................................................................................................... 33
Glossary .................................................................................................................................. 35

Off ice of the State Actuar yi i

Actuar ia l Valuat ion of LEOFF 1 Medical Benef i ts 1
PO Box 40914 Phone: 360.786.6140 Olympia, Washington, 98504-0914 Fax: 360.586.8135 osa.leg.wa.gov TDD: 711

Off ice of the State Actuar y2
June 2013

Actuar ia l Valuat ion of LEOFF 1 Medical Benef i ts 3
This section documents the key Governmental Accounting Standards Board Statement No. 45 (GASB 45) valuation and accounting results related to the Law Enforcement Officers’ and Fire Fighters’ Retirement System Plan 1 (LEOFF 1) employer-provided medical benefits in Washington State. GASB 45 requires the following key measurements to be disclosed.
♦ Actuarial Accrued Liability (AAL) – The amount of medical benefits expected to be paid to current retirees and current active members (future retirees) that have already been earned, measured in today’s dollars. Also referred to as the GASB 45 liability.
♦ Annual Required Contribution (ARC) – The annual amount required under the actuarial cost method and funding policy for amortizing the unfunded AAL (the portion of the AAL not covered by the plan’s assets at the valuation date). It is made up of the normal cost (the portion of the cost of future unearned medical benefits allocated to next year) plus the amortization of the unfunded AAL.
♦ Annual Other Post-Employment Benefits (OPEB) Cost – The ARC plus the amortization of the Net OPEB Obligation (NOO; see next bullet point). The Annual OPEB Cost is the “expense” for financial reporting.
♦ Net OPEB Obligation (NOO) – The cumulative difference between the Annual OPEB Cost and actual employer contributions. The NOO is the “balance sheet liability” for financial reporting.
The table below shows these key measurements for the LEOFF 1 employers in Washington State. Please read the rest of the report for a detailed description of what these measures are, how they are calculated, and how they should be used. Please review the Sensitivity Analysis section for more information on how these numbers change with small changes in our assumptions.
Key Results
(Dollars in Thousands) 2011 2009Actuarial Accrued Liability (AAL) $2,513,534 $1,860,827Annual Required Contribution (ARC) 267,821 194,859Annual OPEB Cost 245,410 183,931Net OPEB Obligation (NOO) (6/30/2012)* $531,819 $304,091*Estimated.
GASB 45 Key Results

Off ice of the State Actuar y4
Comments on 2011 Results
Significant changes in plan provisions or actuarial assumptions and methods impact the GASB 45 liability. Significant factors that impacted the results of this valuation include the following:
♦ We lowered the assumed investment rate of return from 4.5 to 4.0 percent in consultation with the State Treasurer’s Office. This assumption change increased the present value of future medical benefits by over 6 percent.
♦ With the assistance of a healthcare actuary, we developed new healthcare assumptions for this valuation. These assumptions include the expected impact of an excise tax paid by affected employers on “Cadillac” health care plans as defined under the Patient Protection and Affordable Care Act (PPACA). This excise tax, which does not go into effect until the year 2018, represents approximately 6 percent of all liabilities. The inclusion of this tax does not represent tax advice or an opinon that this tax applies to this medical plan. Please see the Sensitivity Analysis section for the results of this valuation wtihout the excise tax.
♦ The assumption changes noted above increased liabilities by over 30 percent from the prior valuation. Please see the gain/loss analysis section for further details.
Sect ion One - Background 5
Section One - Background
OPEB
Other Post-Employment Benefits (OPEB), as defined by Governmental Accounting Standards Board (GASB), are benefits that are provided to retired employees beyond those provided by their pension plans. Such benefits include medical, prescription drug, life, dental, vision, disability, and long-term care insurance. Law Enforcement Officers’ and Fire Fighters’ Retirement Plan 1 (LEOFF 1) employers pay 100 percent of “necessary medical services” for LEOFF 1 retirees.
Necessary Medical Services
The medical benefit, set up under RCW 41.26.150(1), provides free medical and long-term care coverage for LEOFF 1 retirees. The statute reads as follows:
Whenever any active member, or any member hereafter retired, on account of service, sickness, or disability, not caused or brought on by dissipation or abuse, of which the disability board shall be judge, is confined in any hospital or in home, and whether or not so confined, requires medical services, the employer shall pay for the active or retired member the necessary medical services not payable from some other source . . . .
The last employer of a retired LEOFF 1 member is responsible for the full cost of any post-retirement medical benefits.
Individual local disability boards administer the LEOFF 1 medical plan. One set of plan terms or conditions does not exist. Different boards interpret the language “necessary medical services” differently. For example, one board may deem dental costs as necessary, whereas another board may deem dental costs as quality of living and not reimburse the member for the costs.
Disability Boards
The disability boards’ authority is established under RCW 41.26.150(1)(a)&(b). It outlines each disability board’s discretionary power:
1. The power to determine whether an active employee has been disabled either in the line of duty or outside of duty.
2. The power to designate the medical services available to any sick or disabled member.
These disability boards were established before the creation of the LEOFF retirement system in 1970; however, more boards were created in 1970 to handle the expanded membership. There are three types of disability boards:.First class cities (one board for police and one board for fire fighters).
3. Other large cities (one board for both police and fire fighters).
4. Counties (one board for both police and fire fighters).

LEOFF 1 Medical Benef i ts6
The main difference between these board types is the makeup of the members of the board. However, the difference is slight and all of these boards have the same power and duties. Each board, regardless of type, will use their own discretion regarding which medical services are fully paid by their LEOFF 1 employers.
Insurance
Insurance allows the LEOFF 1 employers to control the volatility in annual medical service costs. For example, if a LEOFF 1 employer only has one retiree, the ongoing annual costs will vary widely depending on whether that retiree had a relatively healthy year or entered long-term care. When many employers group together in an insurance pool, they will be able to pay a steadier annual amount to offset medical service costs. The Legislature has approved of this practice by codifying it in RCW 41.26.150 (4).
Any employer under this chapter, either singly, or jointly with any other such employer or employers through an association thereof…may provide for all or part of one or more plans of group hospitalization and medical aid insurance to cover any of its employees who are members of the Washington law enforcement officers’ and fire fighters’ retirement system, and/or retired former employees…through contracts with regularly constituted insurance carriers, with health maintenance organizations…or with health care service contractors.…
The County Commissioners have established the Washington Counties Insurance Fund. The Association of Washington Cities has established the Association of Washington Cities Employees Benefit Trust, which provides indemnity coverage as well as HMO coverage. The Washington Fire Commissioners Association also provides a plan with indemnity and HMO coverage. Most LEOFF 1 employers have joined their respective association’s medical plans.
The remaining LEOFF 1 employers not opting to join their association’s medical plan have several other options. Some obtain coverage through union health and welfare plans (e.g. Teamsters). Some contract through other individual insurance providers. Self-insurance is another viable option for large LEOFF 1 employers, which a number of the larger political subdivisions have selected.
GASB 43/45
In the past, these free medical services have not been projected and accounted for under an accrual basis. Accrual accounting is meant to match the timing between when something occurs and when the employer accounts for the cost. In this case, it is meant to match the accounting expense to the year in which the benefits are earned by the member. Under pay-as-you-go funding, contributions are made when the cost occurs (after retirement). This cost is expensed as the LEOFF 1 employers in Washington State pay the current year’s medical expenses. However, the unfunded liability, the difference between the projected cost of benefits members have earned and what the LEOFF 1 employers in Washington State have been paying, is growing and is not accounted for under the pay-as-you-go method. According to GASB, Statements No. 43 and 45 were created in an attempt to:
♦ Create financial transparency.
♦ Create better alignment between public and private sector accounting.

Sect ion One - Background 7
♦ Provide clarity among bargaining groups to show the true cost of benefits over time.
♦ Provide employers knowledge of the true cost of benefits over time.
♦ Provide investors knowledge of the true long-term liabilities.
♦ Show the decision makers that a liability exists.
GASB 43 requires disclosure of information related to the entire plan. In this case, since there is no statewide LEOFF 1 Medical plan, GASB does not require that a liability be calculated at the plan level. Instead, this report shows what the results would look like if all the LEOFF 1 employers were joined in one single plan. GASB 45 requires each employer to calculate their OPEB liability. The individual LEOFF 1 employers will be responsible for GASB 45. Using the same methods and assumptions, the summation of all the individual LEOFF 1 employers should equal the results in this report for the statewide liability. In addition to the overall liability, GASB requires that the Annual Required Contribution (ARC) must be calculated. The ARC is the annual amount required under the actuarial cost method and funding policy for amortizing the unfunded actuarial accrued liability. GASB does not require that LEOFF 1 employers actually contribute the ARC each year, just that it is recognized so that all stakeholders can see how adequately the liability is being funded.
As soon as an estimate of the GASB Actuarial Accrued Liability (AAL) is issued, it must be disclosed in every municipal Bond Prospectus. Rating agencies such as Moody’s, Fitch, and Standard & Poors will analyze the OPEB liabilities. Bond ratings, and the related cost of capital, may be impacted. However, the resulting analyses will not necessarily have a negative impact on ratings. These agencies will consider whether a plan is in place to manage these liabilities, look at the entity’s ability to meet its budget, and analyze the size of the Unfunded Actuarial Accrued Liability compared to payroll, budget, and tax base when making their determinations.
Actuarial Valuation
In order to determine the GASB 45 liabilities, an actuarial valuation must be performed. An actuarial valuation is a way to determine what benefits will be paid throughout the future lifetimes of current members and discount those payments back to the present. The result is the present value of future benefits. For example, if you had a dollar amount today, which equaled the present value of future benefits, that amount could be invested, accrue earnings during the current plan members’ lifetimes, and be paid out in a benefit stream when the members are eligible. The total amount remaining when there are no more benefits being paid would be zero. In this case, the benefits being paid out are the medical service costs for the LEOFF 1 retirees.
An actuarial valuation requires inputs such as participant data (who is receiving the benefits), benefit provisions (what are the benefits), and assumptions (how do we expect the members and the economy to behave). Participant data records include the members’ ages, membership service, plan selection, etc. Benefit provisions include the structure of the benefits that the members receive; in this case, the retiree medical benefits paid by employers. Assumptions include the interest rate (investment return), health care inflation rates, general inflation rates, decrement rates (retirement, mortality, etc.), participation rates, Medicare coverage, etc.
The inputs are taken and valued using an actuarial cost method. The method chosen will allocate costs between past and future plan membership service. Distinct actuarial cost methods will produce

LEOFF 1 Medical Benef i ts8
somewhat different allocations since each method allocates cost a little bit differently. The inputs and the cost method are put into valuation software to determine the AAL and ARC. Essentially, the valuation software uses the inputs to determine when a benefit will be paid, how much the benefit will be, and how long it will be paid to each member. All of these benefits are then discounted back to today’s dollars and summed to determine the present value of future benefits, the AAL, and the ARC for all plan members.
Funding Policy
In the past, these medical expenses were funded on a pay-as-you-go basis, meaning that employers would pay these costs as they occurred. This generally means today’s taxpayers are paying for benefits that were accrued (or earned) in the past. This funding policy conflicts with the principle of intergenerational equity, which requires that employers fund a member’s benefits over the member’s working lifetime. The idea is for the member’s benefits to be paid by the taxpayers who benefit from that member’s service, as opposed to making future taxpayers, who do not benefit from that member’s service, pay for the member’s benefits.
In the future, these liabilities can continue to be funded on a pay-as-you-go basis, or they can be pre-funded. If they continue to be funded on a pay-as-you-go basis, then a Net OPEB Obligation (NOO) will continue to accrue as the annual contributions fall short of the ARC. This funding policy results in lower current contributions, a growing liability, and continued conflict with the principle of intergenerational equity. In addition, if a pay-as-you-go funding method is selected, there will be no assets to invest; therefore, the interest discount rate must be lower, in the range of 3 to 5 percent. A lower interest discount rate will mean the reported overall liability will be larger.
If, instead, these liabilities are fully pre-funded, then contributions equal to the ARC must be made annually and placed in an irrevocable trust. If the choice to fully pre-fund is made, then no further NOO will accrue. This funding policy results in larger current contributions, a lower unfunded liability, and adherence to the principle of intergenerational equity. In addition, if the choice is made to pre-fund, there will be assets to invest; the investment return applied to the liabilities will reflect the expected long-term yield of the assets used to finance the payment of the benefits. If these assets are invested similarly to those in a typical retirement plan, an interest discount rate in the range of 7 to 8 percent can be used. A higher interest discount rate will mean the reported overall liability will be smaller.
It is important to note that switching from pay-as-you-go to pre-funding and creating a trust fund is a complicated process with many considerations. Such considerations include determining the level of pre-funding and weighing the short-term costs versus long-term benefits.
Another alternative is to choose a combination of the two funding policies. Partially pre-funding the liabilities will allow for an interest discount rate of 5 to 7 percent. A NOO will accrue, but not as fast as under a pay-as-you-go funding method. Choosing this combination of funding methods allows for decision-makers to keep current contributions manageable, while still pre-funding part of the liability and being able to earn some investment returns from the assets.
Lastly, partial or full pre-funding could occur under a non-dedicated fund. Under this approach, future benefit payments would be partially offset by anticipated investment earnings. A NOO would still accrue, however, since GASB requires funding under an irrevocable and dedicated trust.
Sect ion Two - Actuar ia l Exh ib i ts 9
Section Two - Actuarial Exhibits
PO Box 40914 Phone: 360.786.6140 Olympia, Washington, 98504-0914 Fax: 360.586.8135 osa.leg.wa.gov TDD: 711

LEOFF 1 Medical Benef i ts10
June 2013

Sect ion Two - Actuar ia l Exh ib i ts 11
Present Value of Future Benefits
The Present Value of Future Benefits (PVFB) is the present value of future medical and long-term care benefits paid on behalf of current LEOFF 1 employees (actives/future retirees) and current LEOFF 1 retirees. The PVFB is based on all service currently earned and all service projected to be earned in the future. In other words, this is the present value of all future medical benefits, whereas the GASB Statement No. 45 (GASB 45) liability is the present value of all future medical benefits that members have earned. The table to the right shows the PVFB as of June 30, 2011, by current active and inactive members and shows what portions are attributable to medical and long-term care benefits.
(Dollars in Thousands)
Active Members1
Medical $99,252Institutional Long-Term Care 24,400Non Institutional Long-Term Care 9,787Total Active $133,439
Inactive Members2
Medical $1,669,848Institutional Long-Term Care 519,580Non Institutional Long-Term Care 199,433Total Inactive $2,388,862
Total $2,522,301
Present Value of Future Benefits (PVFB)
2 Retired members and terminated members entitled to a benefit.
1 Currently employed.
Note: Totals may not agree due to rounding.
GASB 45 Liability
The GASB 45 liability is the total accrued liability from the medical and long-term care benefits offered by LEOFF 1 employers. It is the present value of future medical benefits paid on behalf of current LEOFF 1 employees (actives/future retirees) and current LEOFF 1 retirees. The GASB 45 liabilities are based on all service currently earned. The GASB 45 liability is also referred to as the actuarial accrued liability. This table shows the GASB 45 liabilities as of June 30, 2011, by current active and inactive members and shows what portions are attributable to medical and long-term care benefits. Since the plan is nearly a 100 percent retired population, almost all future medical benefits have been earned. Therefore, the GASB 45 liability and PVFB are approaching the same number.
(Dollars in Thousands)
Active Members1
Medical $92,768Institutional Long-Term Care 22,765Non Institutional Long-Term Care 9,140Total Active $124,673
Inactive Members2
Medical $1,669,848Institutional Long-Term Care 519,580Non Institutional Long-Term Care 199,433Total Inactive $2,388,862
Total $2,513,534
1 Currently employed.
GASB 45 Actuarial Accrued Liability (AAL)
2 Retired members and terminated members entitled to a benefit.
Note: Totals may not agree due to rounding.
LEOFF 1 Medical Benef i ts12
ARC, Annual OPEB Cost, and NOO
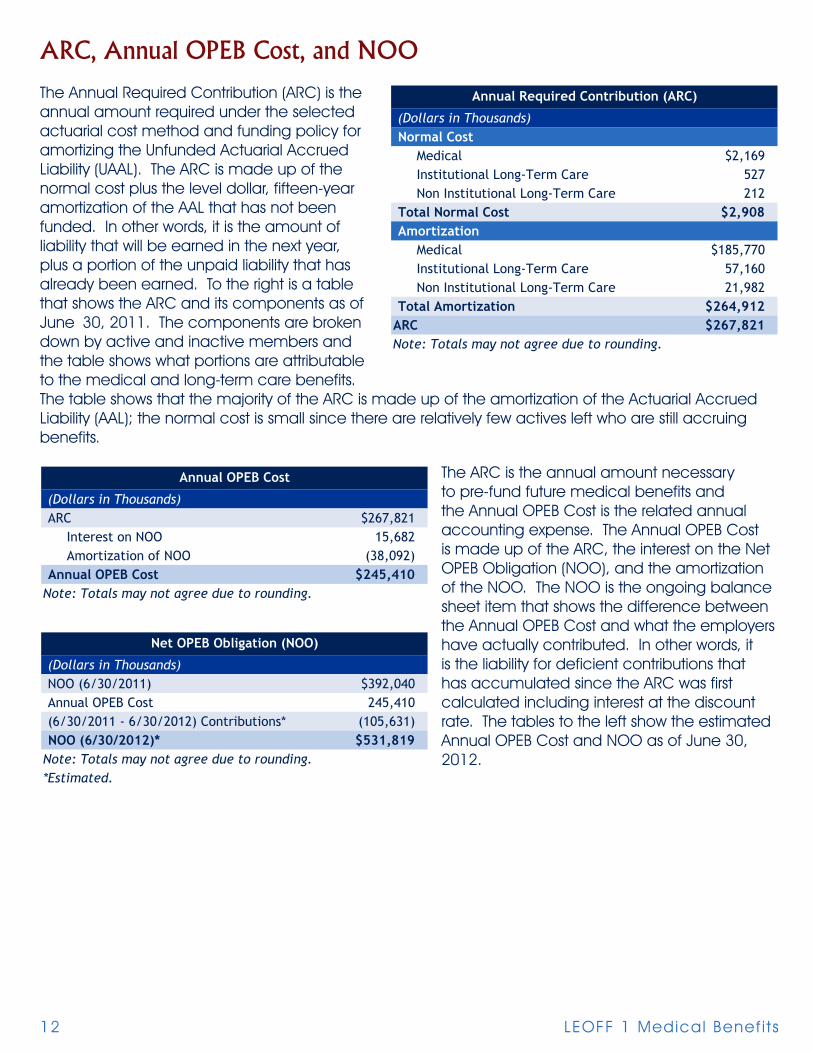
The Annual Required Contribution (ARC) is the annual amount required under the selected actuarial cost method and funding policy for amortizing the Unfunded Actuarial Accrued Liability (UAAL). The ARC is made up of the normal cost plus the level dollar, fifteen-year amortization of the AAL that has not been funded. In other words, it is the amount of liability that will be earned in the next year, plus a portion of the unpaid liability that has already been earned. To the right is a table that shows the ARC and its components as of June 30, 2011. The components are broken down by active and inactive members and the table shows what portions are attributable to the medical and long-term care benefits. The table shows that the majority of the ARC is made up of the amortization of the Actuarial Accrued Liability (AAL); the normal cost is small since there are relatively few actives left who are still accruing benefits.
The ARC is the annual amount necessary to pre-fund future medical benefits and the Annual OPEB Cost is the related annual accounting expense. The Annual OPEB Cost is made up of the ARC, the interest on the Net OPEB Obligation (NOO), and the amortization of the NOO. The NOO is the ongoing balance sheet item that shows the difference between the Annual OPEB Cost and what the employers have actually contributed. In other words, it is the liability for deficient contributions that has accumulated since the ARC was first calculated including interest at the discount rate. The tables to the left show the estimated Annual OPEB Cost and NOO as of June 30, 2012.
(Dollars in Thousands)Normal Cost
Medical $2,169Institutional Long-Term Care 527Non Institutional Long-Term Care 212
Total Normal Cost $2,908Amortization
Medical $185,770Institutional Long-Term Care 57,160Non Institutional Long-Term Care 21,982
Total Amortization $264,912ARC $267,821Note: Totals may not agree due to rounding.
Annual Required Contribution (ARC)
(Dollars in Thousands)ARC $267,821
Interest on NOO 15,682Amortization of NOO (38,092)
Annual OPEB Cost $245,410Note: Totals may not agree due to rounding.
Annual OPEB Cost
(Dollars in Thousands)NOO (6/30/2011) $392,040Annual OPEB Cost 245,410(6/30/2011 - 6/30/2012) Contributions* (105,631)NOO (6/30/2012)* $531,819
Note: Totals may not agree due to rounding.*Estimated.
Net OPEB Obligation (NOO)

Sect ion Two - Actuar ia l Exh ib i ts 13
Amortization Schedule
The UAAL and NOO are amortized as a level dollar amount over a closed fifteen-year period. The following tables show what makes up this year’s amortization of the UAAL and NOO.
Assets
Under GASB rules, employers must establish an irrevocable, dedicated, and protected trust for medical benefits in order to accumulate assets for accounting purposes. It is unknown how many individual LEOFF 1 employers have established such trusts for their LEOFF 1 medical obligations. As a result, we assumed all employers pay for medical benefits on a pay-as-you-go basis for purposes of this statewide valuation. When employers fund benefits on a pay-as-you-go basis, no assets accumulate for investment. The following table shows the market value of assets and the actuarial value of assets as of the valuation date, June 30, 2011.
(Dollars in Thousands)
Beginning UAAL
Previous Amortization
Accrued Interest
CurrentUAAL
Amortization Factor
Amortization Amount
(a) (b) (c) (d) = (a-b+c) (e) (d/e)9/30/2006 $1,745,427 $731,201 $310,283 $1,324,509 8.60 $153,9376/30/2009 $334,291 $57,820 $23,763 $300,233 10.39 28,9106/30/2011 $888,793 $0 $0 $888,793 11.56 76,864
$259,7125,201
$264,912
(Dollars in Thousands)
Beginning NOOPrevious
AmortizationAccrued Interest
CurrentNOO
Amortization Factor
Amortization Amount
(a) (b) (c) (d) = (a-b+c) (e) (d/e)9/30/2006 $0 $0 $0 $0 N/A $09/30/2007* 82,319 27,291 12,458 67,486 9.27 7,2776/30/2008 64,269 17,045 8,233 55,457 9.76 5,6826/30/2009 $75,848 13,411 7,199 $69,636 10.39 6,7056/30/2010 $99,254 8,775 5,916 $96,395 10.99 8,7756/30/2011 $101,064 $0 $2,001 $103,065 11.56 8,913
$37,353$740
$38,092*Restated.
Amortization of the UAAL
Amortization of the NOO
Interest on Contributions
Total NOO Amortization
Total UAAL Amortization
Total
TotalInterest on Contributions
(Dollars in Thousands)$00
$0
Assets as of June 30, 2011
Market Value of Assets Amortization of Gains/(Losses)Actuarial Value of Assets

LEOFF 1 Medical Benef i ts14
Funded Ratio
The funded ratio is the ratio of the present value of contributions that have been made for current members (and associated investment return, if applicable) to the present value of the liability that has already been accrued (as defined by the funding method). A funded ratio of 100 percent indicates that all benefits that have been accrued have been funded as of the valuation date. A ratio of less than 100 percent indicates that all benefits that have been accrued have not been funded as of the valuation date. The table above shows the funded status of the LEOFF 1 employers’ OPEB liability.
Covered Payroll
The covered payroll is the total payroll of all current members that are eligible to receive medical benefits upon retirement. The estimated current covered payroll can be seen in the table to the right.
Unfunded Liability as a Percentage of Covered Payroll
We will look at the unfunded liability as a percentage of covered payroll as a measure of the relative magnitude of the unfunded liability. The table below shows that the unfunded liability is 10,251 percent of the total covered payroll. In other words, if 10,251 percent of this year’s payroll (or 102.5 times the current payroll) were contributed to fund the benefits, all accrued benefits would be fully funded. This is an extreme example of a benefit that was not funded over the working lifetime of the members, which leads to a large percent of the covered payroll; in a short time this percentage will be infinite as there will be no covered payroll when all LEOFF 1 members are retired.
The unfunded liability can also be compared to the total payroll of the entire LEOFF system (Plans 1 and 2). This is an alternative measure of the unfunded liability compared to the total police and fire fighter payroll. The table below shows this comparison; it would take 161 percent of this year’s total LEOFF payroll to fund the accrued benefits.
(Dollars in Thousands)$2,513,534
0$2,513,534
0.0%Funded Ratio: 6/30/2012*Assumes all employers use pay-as-you-go funding.
Unfunded Liability (6/30/2011)
Funded Status as of June 30, 2011*
Actuarial Accrued LiabilityAssets
(Dollars in Thousands)$2,513,534$1,559,186
161%
Unfunded Liability (6/30/2011)Total Payroll (LEOFF 1 & 2)
Unfunded Liability as a % of Covered Payroll
Unfunded Liability as a Percent of LEOFF Payroll
(Dollars in Thousands)
$24,520Total Payroll
Covered Payroll (LEOFF 1)
(Dollars in Thousands)$2,513,534
$24,52010,251%
Unfunded Liability as a Percent of LEOFF 1 Covered Payroll
Unfunded Liability as a % of Covered Payroll Total Payroll (LEOFF 1)Unfunded Liability (6/30/2011)

Sect ion Two - Actuar ia l Exh ib i ts 15
Percentage of ARC Contributed
The next table shows that an estimated 39.4 percent of the ARC would be contributed during the year ending June 30, 2012, on a pay-as-you-go basis. Contributions on a pay-as-you-go basis represent a significant portion of the ARC since the opportunity to pre-fund benefits over members’ working lifetimes has passed.
Gain/(Loss) Analysis
The results of this report are based on assumptions about future economic and demographic events. It is important to note over time how actual events differed from those assumptions. An event that causes the plan to cost less than was expected is described as a gain to the plan. An event that causes the plan to cost more than was expected is described as a loss to the plan. An analysis of the gains and losses between the prior valuation and this year’s valuation shows what events are attributable to the change in expected cost of the plan.
The table to the left shows the difference between the prior liability and this year’s liability by major source.
(Dollars in Thousands)
$105,631$267,821
39.4%
(6/30/2011 - 6/30/2012) Contributions*ARCPercentage of ARC Contributed*
*Estimated.
Percent of ARC Contributed
2009 PUC Liability $1,860,827Normal Cost 2,902Interest 83,802Disbursements (98,607)
2010 Expected PUC Liability 1,848,924Normal Cost 2,123Interest 83,249Disbursements (103,535)
2011 Expected PUC Liability 1,830,761Expected Change in PUC Liability ($30,066)
2009 PUC Liability $1,860,827Expected Change in Liability ($30,066)Liability (Gain) / Loss
Termination $35Retirement (5,636)Mortality 12,548Disability (3)Other Liabilities (7,030)
Total Liability (Gains) / Losses ($87)Incremental Changes
Plan Changes $0Method Changes 0Medical Assumption Changes 433,237Excise Tax Assumption Change 140,303Discount Rate Assumption Change 109,319Correction Changes 0
Total Incremental Changes 682,860Total Change 652,708
2011 PUC Liability $2,513,534
Expected Change in Projected Unit Credit (PUC) Liability
Change in PUC Liability by Source
(Dollars in Thousands)

LEOFF 1 Medical Benef i ts16
Projections
It is important to look at the projections of the contributions and the liability in order to determine whether the contributions are manageable and whether the liability will be funded in a reasonable amount of time. Projections allow policy decision makers to determine the best funding policy for the state, local governments, and their constituents while providing investors and stakeholders the knowledge of what lies ahead. Bond rating agencies will look at these projections and consider whether a well-formulated plan is in place, or is necessary.
We will look at what the stream of future benefits/contributions will look like with a pay-as-you-go funding policy for the current participants. Fifty years is a good time frame for these projections since it is enough time to see the pay-as-you-go contributions decrease to zero. As the large number of current members and high medical inflation dominate the early years, the annual contributions increase. As projected medical inflation slows down and the closed population continues to dwindle, the annual benefits/contributions reach a peak and decrease to zero in the long-run. The graph below shows what we expect the contributions to look like under the current pay-as-you-go funding policy. It shows what pieces are attributable to institutional Long-Term Care (LTC), non-institutional LTC, and medical.
$0
$20,000
$40,000
$60,000
$80,000
$100,000
$120,000
$140,000
$160,000
$180,000
Cont
ribu
tion
s (D
olla
rs in
Tho
usan
ds)
Fiscal Year
Annual Statewide LEOFF 1 Contributions on Pay-As-You-Go Basis
Total Institutional LTC Non-Institutional LTC Medical

Sect ion Two - Actuar ia l Exh ib i ts 17
0.0%
0.1%
0.2%
0.3%
0.4%
0.5%
Perc
ent
of R
even
ue (
%)
Fiscal Year
Annual Statewide LEOFF 1 Contributions as a Percent of Local Government Revenue
Total Institutional LTC Non-Institutional LTC Medical
While the expected stream of future contributions is nice to know, it is only helpful when put in perspective. A good comparison for the LEOFF 1 employers’ obligation is to look at the projected contributions as a percentage of total local government revenue (cities, counties, ports, transits). The table on the following page shows the percentage of the contributions relative to total local government revenue. It shows what pieces are attributable to institutional LTC, non-institutional LTC, and medical. Note that not all local government revenue is available to fund these benefits; this is intended to show relative magnitude. We increased the local government revenue by 5.6 percent per year to estimate future local government revenue.

LEOFF 1 Medical Benef i ts18
$0
$200,000
$400,000
$600,000
$800,000
$1,000,000
$1,200,000
$1,400,000
$1,600,000
$1,800,000
$2,000,000
NO
O (
Dol
lars
in
Thou
sand
s)
Fiscal Year
Projected Statewide LEOFF 1 NOO on a Pay-As-You-Go-Basis
The last projection we considered is the NOO over this same time period. Remember, the NOO grows as long as contributions are less than the annual OPEB cost. The NOO is a balance sheet item that shows the cumulative difference between the annual OPEB cost and actual contributions made. The graph on the following page shows the NOO; the annual OPEB cost is larger than the contributions in the years that the NOO increases, while the annual OPEB cost is smaller than the contributions in the years that the NOO decreases.
Since almost all LEOFF 1 members are in retirement, the vast majority of the ARC is made up of the closed fifteen-year amortization of the original unfunded actuarial accrued liability. Therefore, the NOO increases for about ten years as contributions are less than the annual OPEB cost, and decreases after the annual OPEB cost drops off.

Sect ion Three - Sens i t iv i ty Analys is 19
Section Three - Sensitivity AnalysisA point estimate is only the start of understanding the GASB 45 liability. This point estimate will only be realized if future economic and demographic experience matches our assumptions. It is equally important to understand what will happen if the economic and demographic experience is different than we assumed. To test the sensitivity of the results to our assumptions, we determined how much the statewide LEOFF 1 liability would change due to small changes in the medical trend assumption.
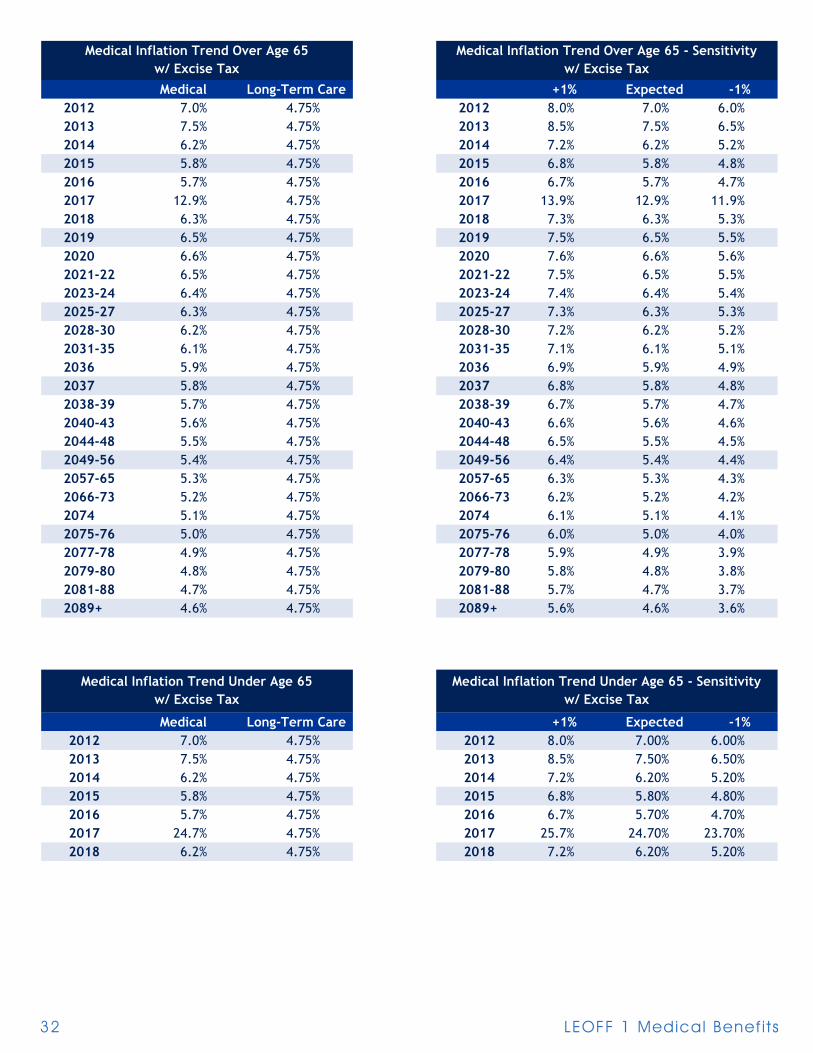
The medical inflation trend assumption, for members over1 age 65, starts at 7.0 percent in 2012, peaks at 12.9 percent in 2017, and decreases to an ultimate rate of 4.6 percent in 2089. The ultimate rate means the expected rate for 2089 and beyond is 4.6 percent. Comparatively, the medical inflation trend assumption, for members under1 age 65, starts at 7.0 percent in 2012, peaks at 24.7 percent in 2017, and decreases to an ultimate rate of 6.2 percent in 2018.
Although this represents our best estimate, it is reasonable that the actual medical inflation trend could be higher or lower. The table to the right shows how sensitive the results are to the medical inflation trend at 1 percent higher and lower than expected. Please see the Appendix for the detailed medical trend assumptions.
We also prepared sensitivity analysis assuming 0.5 percent higher or lower investment rate or return, and illustrated the impact of the PPACA excise taxes.
(Dollars in Thousands) Low (-1.0%) Expected* High (+ 1.0%)PVFB $2,241,432 $2,522,301 $2,854,322GASB 45 Liability $2,234,112 $2,513,534 $2,843,761Note: Totals may not agree due to rounding.*See the Economic Assumptions section of the Appendices for details.
Sensitivity Analysis - Medical Trend
(Dollars in Thousands) Low (-0.5%) Expected* High (+0.5%)PVFB $2,691,852 $2,522,301 $2,368,276GASB 45 Liability $2,682,191 $2,513,534 $2,360,301Note: Totals may not agree due to rounding.*See the Economic Assumptions section of the Appendices for details.
Sensitivity Analysis - Discount Rate
(Dollars in Thousands) Expected* w/o Excise TaxPVFB $2,522,301 $2,381,203GASB 45 Liability $2,513,534 $2,373,231Note: Totals may not agree due to rounding.*See the Economic Assumptions section of the Appendices for details.
Sensitivity Analysis - Impact of Excise Tax
It is important to realize that economic assumptions, such as medical inflation, can vary based on random events such as wars, medical breakthroughs, and legislation. Knowing the variability in our best estimate is just as important as knowing the best estimate itself.
1 In the previous published report, the words “over” and “under” were reversed; this has been corrected in this published version.

LEOFF 1 Medical Benef i ts20
Sect ion Four - Par t ic ipant Data 21
Section Four - Participant Data
Summary of Plan Participants
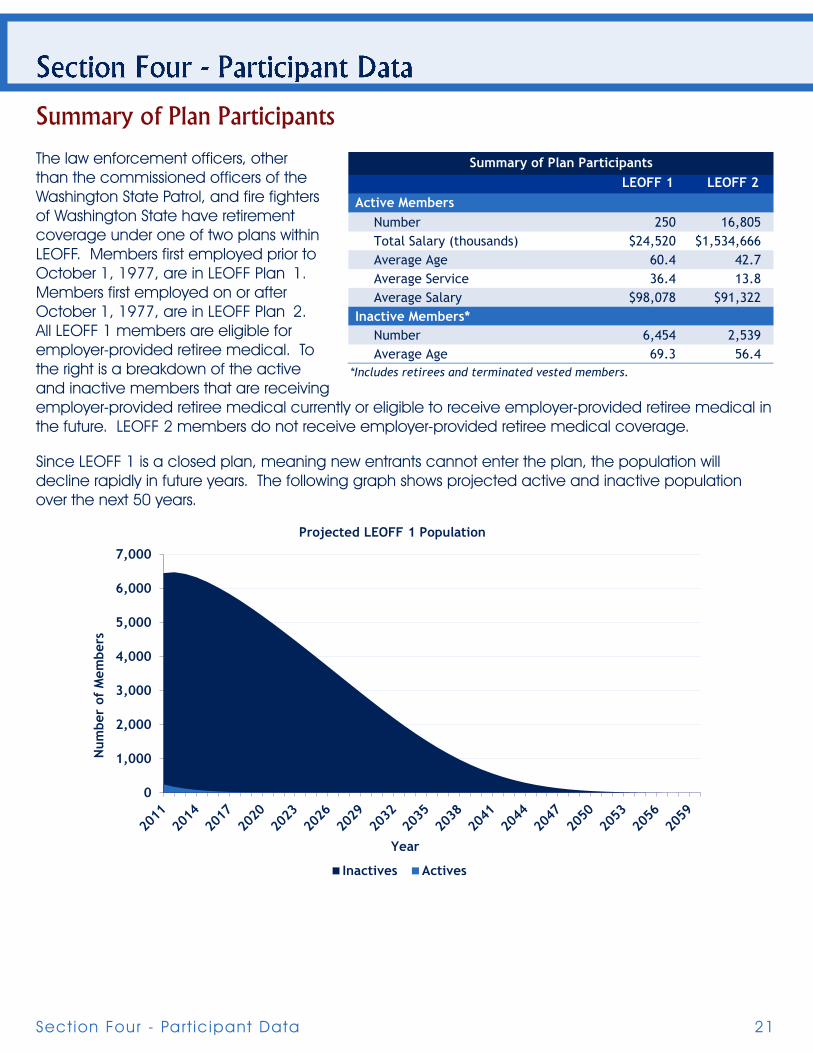
The law enforcement officers, other than the commissioned officers of the Washington State Patrol, and fire fighters of Washington State have retirement coverage under one of two plans within LEOFF. Members first employed prior to October 1, 1977, are in LEOFF Plan 1. Members first employed on or after October 1, 1977, are in LEOFF Plan 2. All LEOFF 1 members are eligible for employer-provided retiree medical. To the right is a breakdown of the active and inactive members that are receiving employer-provided retiree medical currently or eligible to receive employer-provided retiree medical in the future. LEOFF 2 members do not receive employer-provided retiree medical coverage.
Since LEOFF 1 is a closed plan, meaning new entrants cannot enter the plan, the population will decline rapidly in future years. The following graph shows projected active and inactive population over the next 50 years.
LEOFF 1 LEOFF 2 Active Members
Number 250 16,805Total Salary (thousands) $24,520 $1,534,666Average Age 60.4 42.7Average Service 36.4 13.8Average Salary $98,078 $91,322
Inactive Members*Number 6,454 2,539Average Age 69.3 56.4
Summary of Plan Participants
*Includes retirees and terminated vested members.
0
1,000
2,000
3,000
4,000
5,000
6,000
7,000
Num
ber
of M
embe
rs
Year
Projected LEOFF 1 Population
Inactives Actives
LEOFF 1 Medical Benef i ts22
The next graph shows the average annual benefit payment per retiree in LEOFF 1 over the next fifty years. As you can see, as the LEOFF 1 population ages, the average amount paid per retiree will increase significantly over the next fifty years. Note that a portion of this increase is due to inflation (a dollar in the future is not expected to be worth as much as a dollar today).
Summary of Employers
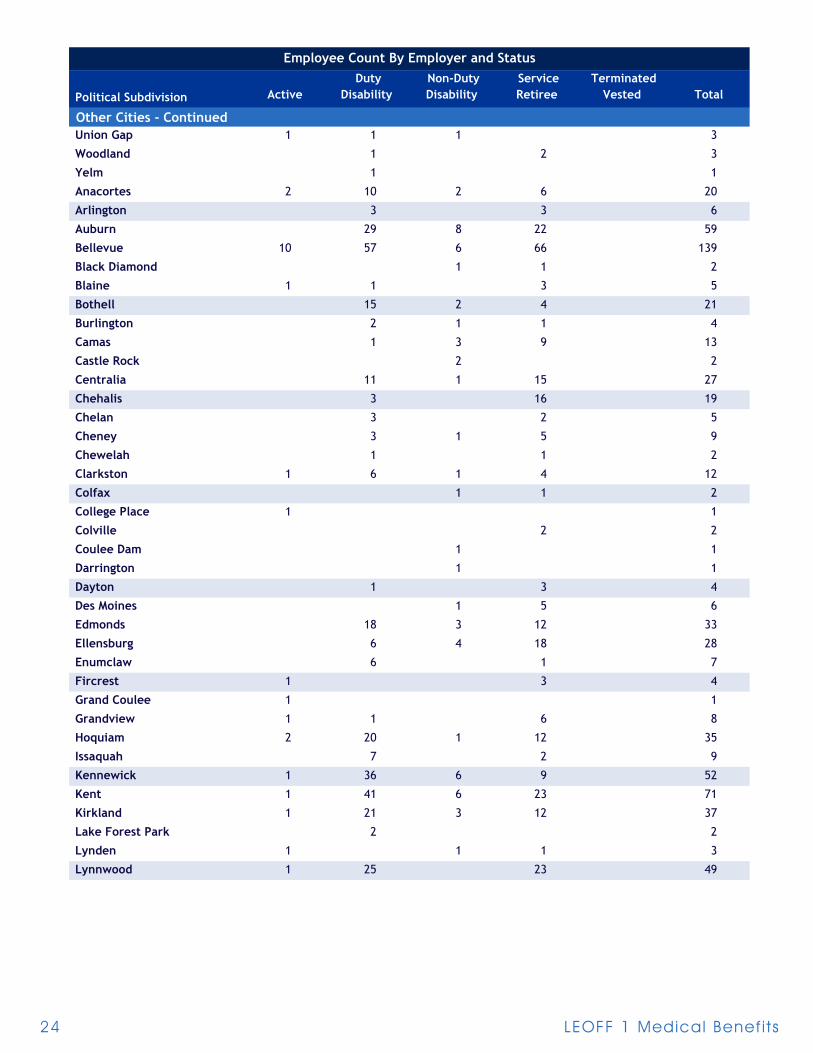
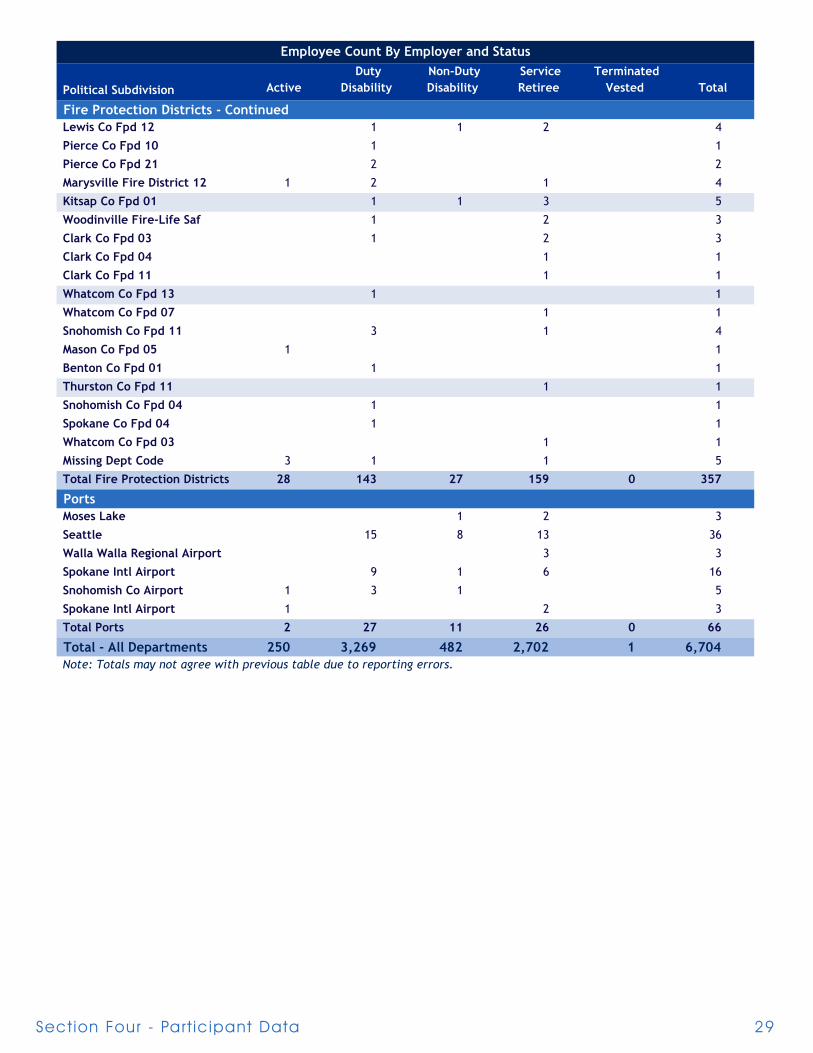
Political subdivisions employ LEOFF 1 members. Different political subdivisions employ police officers, firefighters, or both. The table below shows which types of employers employ police officers and fire fighters and the current status of the members they employ.
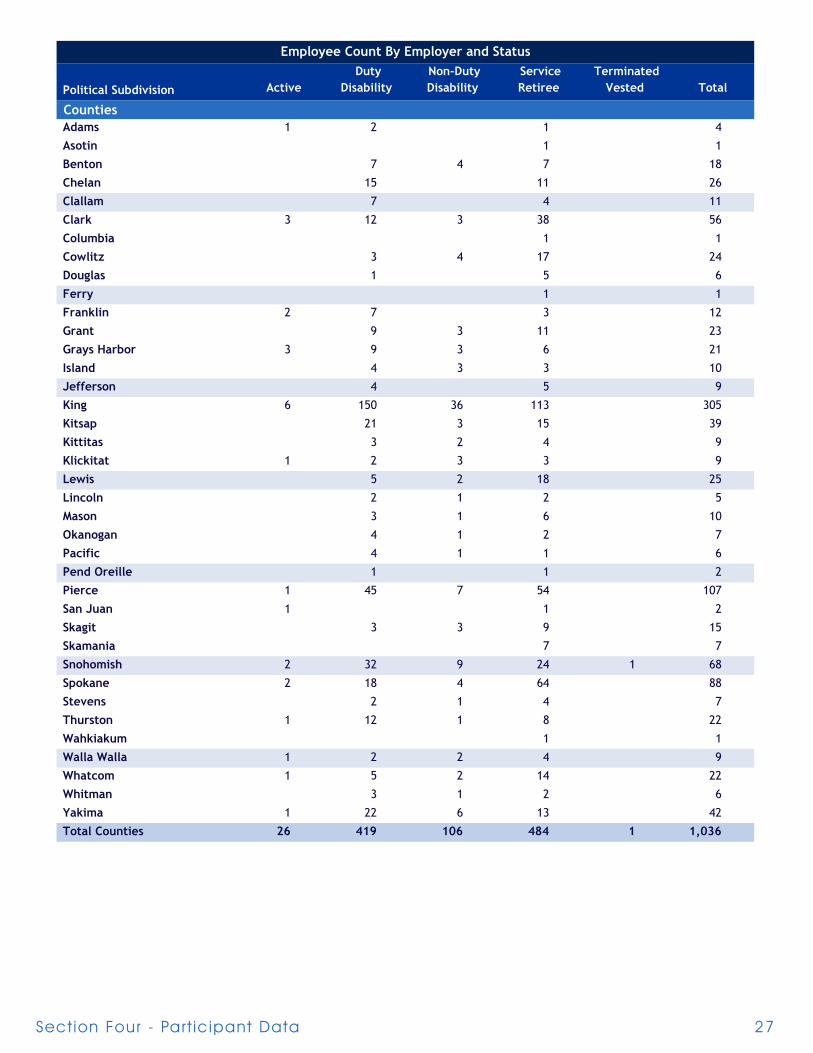
Further detail can be seen in the table below. This table shows each political subdivision that employs LEOFF 1 members and groups them by employer type. The table also shows the status of each political subdivision’s members.
Employer Type Active Duty
Disability Non-Duty Disability
Service Retiree
Terminated Vested Total
PoliceFirst Class City 53 588 127 867 0 1,635
Other City 22 437 93 401 0 953
County 26 419 106 484 1 1,036
Total Police 101 1,444 326 1,752 1 3,624
FirefightersFirst Class City 85 1,322 67 467 0 1,941
Other City 34 333 51 298 0 716
Fire Protection District 28 143 27 159 0 357
Port 2 27 11 26 0 66
Total Firefighters 149 1,825 156 950 0 3,080Total Members 250 3,269 482 2,702 1 6,704
Employee Count By Employer Type and Status
$0
$20,000
$40,000
$60,000
$80,000
$100,000
$120,000
$140,000
$160,000
$180,000
$200,000
Ann
ual B
enef
it P
aym
ents
Year
Average Annual Benefit Per Retiree

Sect ion Four - Par t ic ipant Data 23
Political Subdivision Active Duty
Disability Non-Duty Disability
Service Retiree
Terminated Vested Total
First Class CitiesAberdeen 2 34 6 31 73
Bellingham 7 31 10 83 131
Bremerton 4 58 10 30 102
Everett 8 170 9 25 212
Richland 4 33 11 23 71
Seattle 34 300 45 454 833
Spokane 14 104 35 314 467
Tacoma 17 317 24 149 507
Vancouver 45 15 65 125
Yakima 3 59 12 70 144
Seattle 45 759 17 90 911
Total First Class Cities 138 1,910 194 1,334 0 3,576
Other CitiesBuckley 1 1 3 5
Coupeville 1 1
Elma 3 3
Ephrata 3 1 4
Ferndale 4 4
Goldendale 2 1 1 4
Granite Falls 1 1
Kelso 2 4 18 24
Lacey 1 8 1 4 14
Long Beach 1 1 2
Longview 27 5 37 69
Marysville 7 4 11
McCleary 2 2
Milton 3 3
Monroe 3 1 4
Olympia 4 36 2 33 75
Port Orchard 4 1 5
Prosser 1 1 1 3
Puyallup 21 2 16 39
Quincy 2 2
Shelton 6 8 14
Snohomish 1 2 1 4
Sultan 1 1
Tekoa 1 1
Tumwater 6 10 16
Employee Count By Employer and Status
LEOFF 1 Medical Benef i ts24
Political Subdivision Active Duty
Disability Non-Duty Disability
Service Retiree
Terminated Vested Total
Other Cities - ContinuedUnion Gap 1 1 1 3
Woodland 1 2 3
Yelm 1 1
Anacortes 2 10 2 6 20
Arlington 3 3 6
Auburn 29 8 22 59
Bellevue 10 57 6 66 139
Black Diamond 1 1 2
Blaine 1 1 3 5
Bothell 15 2 4 21
Burlington 2 1 1 4
Camas 1 3 9 13
Castle Rock 2 2
Centralia 11 1 15 27
Chehalis 3 16 19
Chelan 3 2 5
Cheney 3 1 5 9
Chewelah 1 1 2
Clarkston 1 6 1 4 12
Colfax 1 1 2
College Place 1 1
Colville 2 2
Coulee Dam 1 1
Darrington 1 1
Dayton 1 3 4
Des Moines 1 5 6
Edmonds 18 3 12 33
Ellensburg 6 4 18 28
Enumclaw 6 1 7
Fircrest 1 3 4
Grand Coulee 1 1
Grandview 1 1 6 8
Hoquiam 2 20 1 12 35
Issaquah 7 2 9
Kennewick 1 36 6 9 52
Kent 1 41 6 23 71
Kirkland 1 21 3 12 37
Lake Forest Park 2 2
Lynden 1 1 1 3
Lynnwood 1 25 23 49
Employee Count By Employer and Status

Sect ion Four - Par t ic ipant Data 25
Political Subdivision Active Duty
Disability Non-Duty Disability
Service Retiree
Terminated Vested Total
Other Cities - ContinuedMedical Lake 1 1
Medina 1 1 2
Mercer Island 19 1 18 38
Montesano 3 3
Moses Lake 7 1 11 19
Mount Vernon 3 7 2 14 26
Mountlake Terrace 22 2 4 28
Mukilteo 1 1 2
Normandy Park 1 1
Oak Harbor 2 1 2 5
Okanogan 1 1
Omak 1 1 2 4
Oroville 1 1
Othello 2 3 4 9
Pasco 5 17 7 16 45
Port Angeles 13 2 12 27
Port Townsend 5 1 4 10
Poulsbo 2 2
Pullman 3 8 1 6 18
Raymond 1 4 5
Redmond 3 17 3 8 31
Renton 3 56 1 38 98
Ritzville 0
Ruston 1 1
Sedro Woolley 3 1 4 8
Selah 2 1 3
Sequim 1 1
Snoqualmie 1 1 2
Steilacoom 1 1
Sumas 1 1
Sumner 3 1 4 8
Sunnyside 5 2 7 14
Tonasket 1 1
Toppenish 4 2 3 9
Tukwila 3 21 3 14 41
Walla Walla 2 20 10 33 65
Warden 1 1
Washougal 3 3
Wenatchee 1 18 2 18 39
Westport 1 1
Employee Count By Employer and Status

LEOFF 1 Medical Benef i ts26
Political Subdivision Active Duty
Disability Non-Duty Disability
Service Retiree
Terminated Vested Total
Other Cities - ContinuedWhite Salmon 1 1 1 3
Cle Elum 1 1
Newport 1 1
Algona 1 1
Battle Ground 1 1 1 3
Bonney Lake 1 1
Brier 1 1 2
Clyde Hill 2 1 3
East Wenatchee 1 1 1 3
Forks 2 1 3
Gig Harbor 4 4
Granger 2 2
Palouse 1 1
Pomeroy 1 1
Roy 1 1
Soap Lake 1 1
South Bend 1 1 2
Wapato 2 2 4
Tenino 1 1
Bainbridge Island 1 2 3
Fife 4 1 1 6
Brewster 3 1 4
West Richland 1 2 3
Concrete 1 1 2
Stanwood 1 1
Ocean Shores 5 2 2 9
Napavine 1 1
Yacolt 1 1
Mill Creek 1 1
Everson 1 1
Kettle Falls 1 1
SeaTac 4 4
Total Other Cities 56 770 144 699 0 1,669
Employee Count By Employer and Status
Sect ion Four - Par t ic ipant Data 27
Political Subdivision Active Duty
Disability Non-Duty Disability
Service Retiree
Terminated Vested Total
CountiesAdams 1 2 1 4
Asotin 1 1
Benton 7 4 7 18
Chelan 15 11 26
Clallam 7 4 11
Clark 3 12 3 38 56
Columbia 1 1
Cowlitz 3 4 17 24
Douglas 1 5 6
Ferry 1 1
Franklin 2 7 3 12
Grant 9 3 11 23
Grays Harbor 3 9 3 6 21
Island 4 3 3 10
Jefferson 4 5 9
King 6 150 36 113 305
Kitsap 21 3 15 39
Kittitas 3 2 4 9
Klickitat 1 2 3 3 9
Lewis 5 2 18 25
Lincoln 2 1 2 5
Mason 3 1 6 10
Okanogan 4 1 2 7
Pacific 4 1 1 6
Pend Oreille 1 1 2
Pierce 1 45 7 54 107
San Juan 1 1 2
Skagit 3 3 9 15
Skamania 7 7
Snohomish 2 32 9 24 1 68
Spokane 2 18 4 64 88
Stevens 2 1 4 7
Thurston 1 12 1 8 22
Wahkiakum 1 1
Walla Walla 1 2 2 4 9
Whatcom 1 5 2 14 22
Whitman 3 1 2 6
Yakima 1 22 6 13 42
Total Counties 26 419 106 484 1 1,036
Employee Count By Employer and Status

LEOFF 1 Medical Benef i ts28
Political Subdivision Active Duty
Disability Non-Duty Disability
Service Retiree
Terminated Vested Total
Fire Protection DistrictsChelan Co Fpd 01 2 3 5
Clark Co Fpd 05 1 2 3 6
Clark Co Fpd 06 1 5 3 3 12
Douglas Co Fpd 02 2 1 3 6
King Co Fpd 01 1 1 2
King Co Fpd 02 8 8
King Co Fpd 04 6 1 7 14
King Co Fpd 10 3 1 5 9
North Highline Fire District 2 5 2 1 10
King Co Fpd 16 4 1 2 7
King Co Fpd 20 2 2
King Co Fpd 24 0
King Co Fpd 25 2 1 3
King Co Fpd 26 1 1
King Co Fpd 32 1 1
King Co Fpd 37 1 1
Federal Way Fire Dept 3 3 1 13 20
King Co Fpd 40 2 1 3
King Co Fpd 43 1 1 1 3
Bainbridge Island Fire Dept 3 3
Kitsap Co Fpd 07 3 1 4 8
Kittitas Co Fpd 02 1 2 3
Mason Co Fpd 02 1 1 2
Pierce Co Fpd 02 8 1 17 26
Pierce Co Fpd 03 7 3 4 14
Pierce Co Fpd 05 1 3 4
Pierce Co Fpd 06 1 4 5 10
Pierce Co Fpd 07 1 1
Pierce Co Fpd 09 2 2 4
Snohomish Co Fpd 01 5 13 1 3 22
Spokane Co Fpd 01 2 25 3 44 74
Spokane Co Fpd 03 1 1
Spokane Co Fpd 09 3 2 1 6
Thurston Co Fpd 03 5 1 3 9
Thurston Co Fpd 09 3 1 1 5
Walla Walla Co Fpd 04 1 1
Yakima Co Fpd 05 1 4 5
Cowlitz Co Fpd 02 1 1
Grant Co Fpd 03 1 2 3
Grant Co Fpd 05 1 1
Employee Count By Employer and Status
Sect ion Four - Par t ic ipant Data 29
Political Subdivision Active Duty
Disability Non-Duty Disability
Service Retiree
Terminated Vested Total
Fire Protection Districts - ContinuedLewis Co Fpd 12 1 1 2 4
Pierce Co Fpd 10 1 1
Pierce Co Fpd 21 2 2
Marysville Fire District 12 1 2 1 4
Kitsap Co Fpd 01 1 1 3 5
Woodinville Fire-Life Saf 1 2 3
Clark Co Fpd 03 1 2 3
Clark Co Fpd 04 1 1
Clark Co Fpd 11 1 1
Whatcom Co Fpd 13 1 1
Whatcom Co Fpd 07 1 1
Snohomish Co Fpd 11 3 1 4
Mason Co Fpd 05 1 1
Benton Co Fpd 01 1 1
Thurston Co Fpd 11 1 1
Snohomish Co Fpd 04 1 1
Spokane Co Fpd 04 1 1
Whatcom Co Fpd 03 1 1
Missing Dept Code 3 1 1 5
Total Fire Protection Districts 28 143 27 159 0 357
PortsMoses Lake 1 2 3
Seattle 15 8 13 36
Walla Walla Regional Airport 3 3
Spokane Intl Airport 9 1 6 16
Snohomish Co Airport 1 3 1 5
Spokane Intl Airport 1 2 3
Total Ports 2 27 11 26 0 66
Total - All Departments 250 3,269 482 2,702 1 6,704Note: Totals may not agree with previous table due to reporting errors.
Employee Count By Employer and Status

LEOFF 1 Medical Benef i ts30
Sect ion Five - Appendices 31
Section Five - Appendices
Actuarial Methods
The Projected Unit Credit (PUC) cost method was used to calculate the plan’s Actuarial Accrued Liability (AAL), normal cost, and funded status and is consistent with governmental accounting standards.
Currently, there is no asset valuation method since there are no statewide invested assets in an irrevocable, dedicated, and protected trust.
The Unfunded Actuarial Accrued Liability (UAAL) is amortized over a closed fifteen-year period as a level dollar amount.
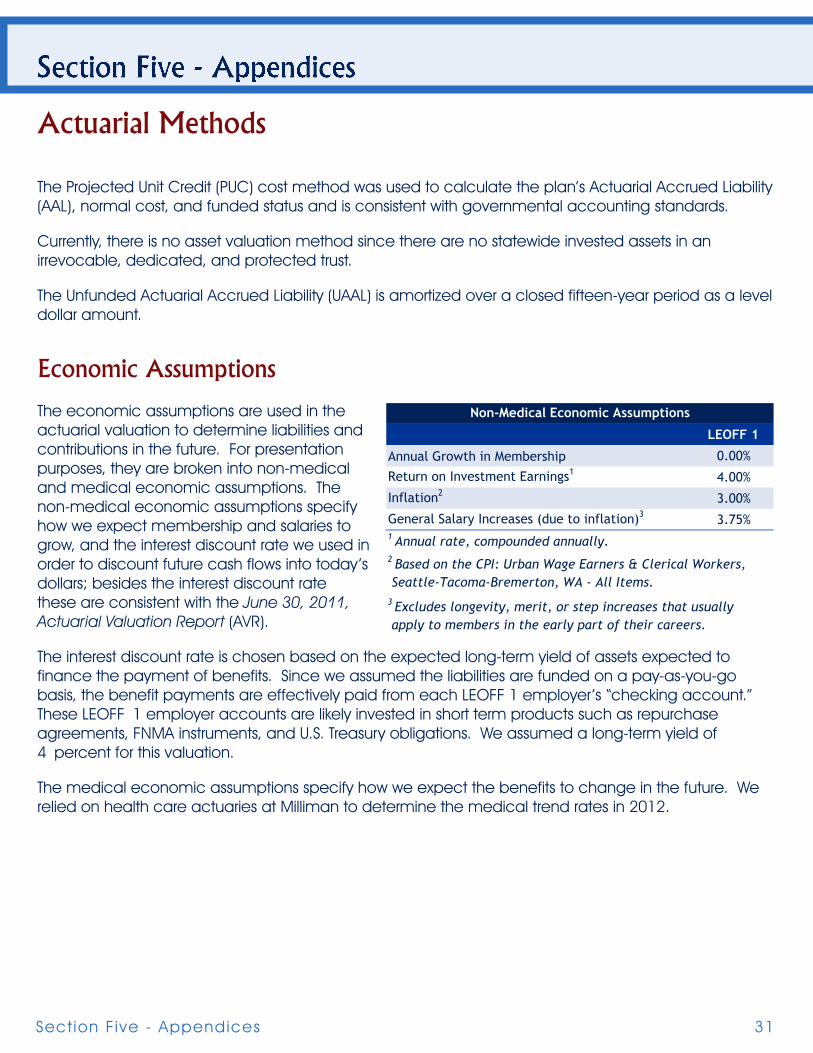
Economic Assumptions
The economic assumptions are used in the actuarial valuation to determine liabilities and contributions in the future. For presentation purposes, they are broken into non-medical and medical economic assumptions. The non-medical economic assumptions specify how we expect membership and salaries to grow, and the interest discount rate we used in order to discount future cash flows into today’s dollars; besides the interest discount rate these are consistent with the June 30, 2011, Actuarial Valuation Report (AVR).
The interest discount rate is chosen based on the expected long-term yield of assets expected to finance the payment of benefits. Since we assumed the liabilities are funded on a pay-as-you-go basis, the benefit payments are effectively paid from each LEOFF 1 employer’s “checking account.” These LEOFF 1 employer accounts are likely invested in short term products such as repurchase agreements, FNMA instruments, and U.S. Treasury obligations. We assumed a long-term yield of 4 percent for this valuation.
The medical economic assumptions specify how we expect the benefits to change in the future. We relied on health care actuaries at Milliman to determine the medical trend rates in 2012.
LEOFF 1
Annual Growth in Membership 0.00%
Return on Investment Earnings1 4.00%
Inflation2 3.00%
General Salary Increases (due to inflation)3 3.75%
3 Excludes longevity, merit, or step increases that usually apply to members in the early part of their careers.
2 Based on the CPI: Urban Wage Earners & Clerical Workers, Seattle-Tacoma-Bremerton, WA - All Items.
1 Annual rate, compounded annually.
Non-Medical Economic Assumptions
LEOFF 1 Medical Benef i ts32
Medical Long-Term Care2012 7.0% 4.75%2013 7.5% 4.75%2014 6.2% 4.75%2015 5.8% 4.75%2016 5.7% 4.75%2017 12.9% 4.75%2018 6.3% 4.75%2019 6.5% 4.75%2020 6.6% 4.75%2021-22 6.5% 4.75%2023-24 6.4% 4.75%2025-27 6.3% 4.75%2028-30 6.2% 4.75%2031-35 6.1% 4.75%2036 5.9% 4.75%2037 5.8% 4.75%2038-39 5.7% 4.75%2040-43 5.6% 4.75%2044-48 5.5% 4.75%2049-56 5.4% 4.75%2057-65 5.3% 4.75%2066-73 5.2% 4.75%2074 5.1% 4.75%2075-76 5.0% 4.75%2077-78 4.9% 4.75%2079-80 4.8% 4.75%2081-88 4.7% 4.75%2089+ 4.6% 4.75%
Medical Inflation Trend Over Age 65w/ Excise Tax
+1% Expected -1%2012 8.0% 7.0% 6.0%2013 8.5% 7.5% 6.5%2014 7.2% 6.2% 5.2%2015 6.8% 5.8% 4.8%2016 6.7% 5.7% 4.7%2017 13.9% 12.9% 11.9%2018 7.3% 6.3% 5.3%2019 7.5% 6.5% 5.5%2020 7.6% 6.6% 5.6%2021-22 7.5% 6.5% 5.5%2023-24 7.4% 6.4% 5.4%2025-27 7.3% 6.3% 5.3%2028-30 7.2% 6.2% 5.2%2031-35 7.1% 6.1% 5.1%2036 6.9% 5.9% 4.9%2037 6.8% 5.8% 4.8%2038-39 6.7% 5.7% 4.7%2040-43 6.6% 5.6% 4.6%2044-48 6.5% 5.5% 4.5%2049-56 6.4% 5.4% 4.4%2057-65 6.3% 5.3% 4.3%2066-73 6.2% 5.2% 4.2%2074 6.1% 5.1% 4.1%2075-76 6.0% 5.0% 4.0%2077-78 5.9% 4.9% 3.9%2079-80 5.8% 4.8% 3.8%2081-88 5.7% 4.7% 3.7%2089+ 5.6% 4.6% 3.6%
Medical Inflation Trend Over Age 65 - Sensitivityw/ Excise Tax
Medical Long-Term Care2012 7.0% 4.75%2013 7.5% 4.75%2014 6.2% 4.75%2015 5.8% 4.75%2016 5.7% 4.75%2017 24.7% 4.75%2018 6.2% 4.75%
Medical Inflation Trend Under Age 65w/ Excise Tax
+1% Expected -1%2012 8.0% 7.00% 6.00%2013 8.5% 7.50% 6.50%2014 7.2% 6.20% 5.20%2015 6.8% 5.80% 4.80%2016 6.7% 5.70% 4.70%2017 25.7% 24.70% 23.70%2018 7.2% 6.20% 5.20%
Medical Inflation Trend Under Age 65 - Sensitivityw/ Excise Tax

Sect ion Five - Appendices 33
The assumptions in the tables on the prior page include the excise tax. For comparison purposes, we provided the medical inflation trend without the excise tax to the right. The Sensitivity Analysis section of this report details the impact on the results.
We relied on Milliman health care actuaries to determine the medical claims costs in 2012. They provided us with Medicare and non-Medicare medical costs by age. Claims costs for sample ages are shown in the table to the left and represent the average claims cost for each age. Due to Medicare subsidies, younger retirees can cost more than older retirees.
Age Non-Medicare Medicare57 $12,776 N/A62 $16,401 N/A67 N/A $10,94772 N/A $12,13477 N/A $13,13382 N/A $13,79187 N/A $14,119
Annual Medical Cost By Age
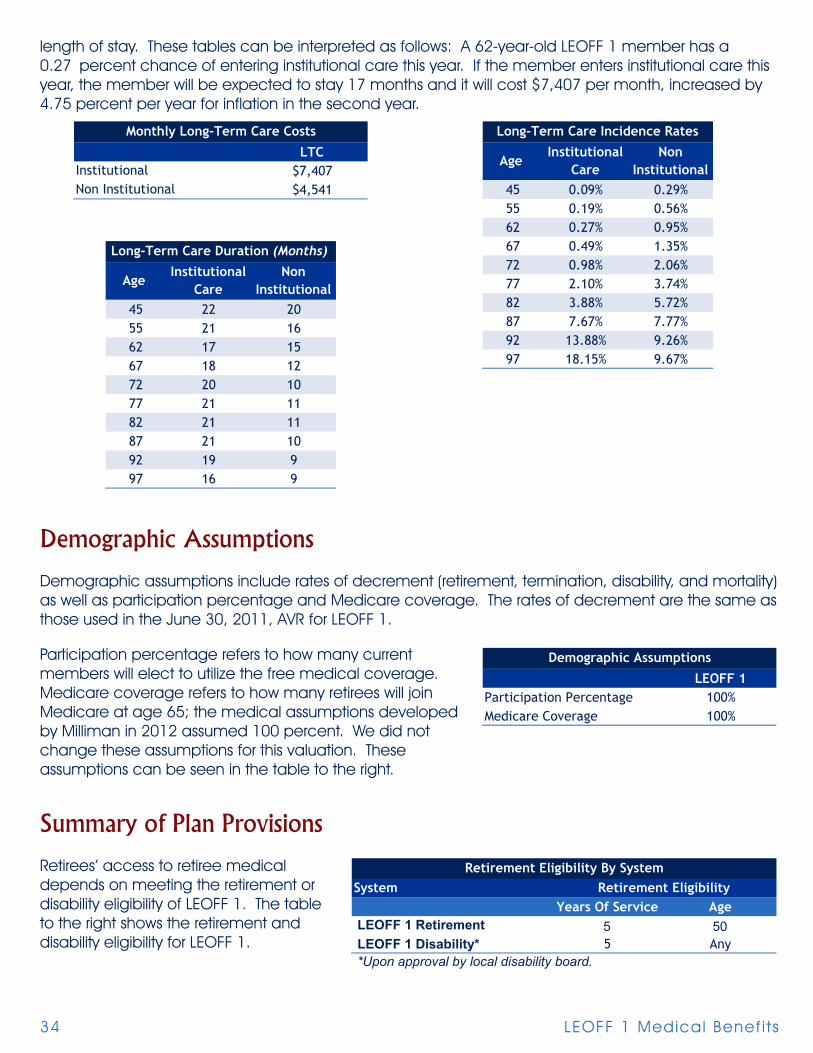
In addition, Milliman health care actuaries also developed long-term care assumptions in 2012. The two types of long-term care are:
1. Institutional. Care provided in a nursing home or wing of a hospital designed to provide nursing care services, including:
a. Skilled – includes nursing and rehabilitation services that can only be performed by skilled medical personnel; must be under orders of a physician and provided on a 24-hour basis.
b. Intermediate – includes continuous treatment not meeting all the requirements for skilled care.
c. Custodial – includes assistance in carrying out daily living activities.
2. Non institutional. Includes all home health, assisted living facility, and adult day-care services.
The four assumptions dealing with long-term care are the annual cost, the incidence rate (likelihood of entering long-term care), the length of stay, and the inflation rate (previously mentioned). The three tables below show the expected cost for long-term care, the incidence rates, and the expected
2012 7.0%2013 7.5%2014 6.2%2015 5.8%2016-23 5.7%2024-34 5.6%2035 5.5%2036-37 5.4%2038-40 5.3%2041-48 5.2%2049-67 5.1%2068-74 5.0%2075-76 4.9%2077-78 4.8%2079-80 4.7%2081+ 4.6%
Medical Inflation Trendw/o Excise Tax
LEOFF 1 Medical Benef i ts34
length of stay. These tables can be interpreted as follows: A 62-year-old LEOFF 1 member has a 0.27 percent chance of entering institutional care this year. If the member enters institutional care this year, the member will be expected to stay 17 months and it will cost $7,407 per month, increased by 4.75 percent per year for inflation in the second year.
LTC$7,407$4,541
InstitutionalNon Institutional
Monthly Long-Term Care Costs
45 0.09% 0.29%55 0.19% 0.56%62 0.27% 0.95%67 0.49% 1.35%72 0.98% 2.06%77 2.10% 3.74%82 3.88% 5.72%87 7.67% 7.77%92 13.88% 9.26%97 18.15% 9.67%
Age Institutional
CareNon
Institutional
Long-Term Care Incidence Rates
45 22 2055 21 1662 17 1567 18 1272 20 1077 21 1182 21 1187 21 1092 19 997 16 9
Long-Term Care Duration (Months)
Institutional Care
Age Non
Institutional
Demographic Assumptions
Demographic assumptions include rates of decrement (retirement, termination, disability, and mortality) as well as participation percentage and Medicare coverage. The rates of decrement are the same as those used in the June 30, 2011, AVR for LEOFF 1.
Participation percentage refers to how many current members will elect to utilize the free medical coverage. Medicare coverage refers to how many retirees will join Medicare at age 65; the medical assumptions developed by Milliman in 2012 assumed 100 percent. We did not change these assumptions for this valuation. These assumptions can be seen in the table to the right.
Summary of Plan Provisions
Retirees’ access to retiree medical depends on meeting the retirement or disability eligibility of LEOFF 1. The table to the right shows the retirement and disability eligibility for LEOFF 1.
LEOFF 1Participation Percentage 100%Medicare Coverage 100%
Demographic Assumptions
Years Of Service Age5 50
LEOFF 1 Disability* 5 Any *Upon approval by local disability board.
LEOFF 1 Retirement
SystemRetirement Eligibility By System
Retirement Eligibility
Sect ion Five - Appendices 35
Each disability board has the discretionary power to determine which costs they will reimburse and which costs they will not reimburse. However, there is a list of minimum services for which they must reimburse the retiree.
♦ Hospital board and room not to exceed semi-private, unless condition requires otherwise.
♦ Hospital services, other than board and room.
Fees for:
♦ Licensed physicians or surgeons.
♦ Licensed osteopaths.
♦ Licensed chiropractors.
♦ Charges of a registered graduate nurse.
♦ Physician-prescribed drugs and medications.
♦ X-ray, radium, and radioactive isotopes therapy.
♦ Anesthesia and oxygen.
♦ Rental of durable medical and surgical equipment.
♦ Artificial limbs and eyes; and casts, splints, and trusses.
♦ Professional ambulance services to transport to or from a hospital.
♦ Dental charges resulting from accidental injury to the teeth if treatment is commenced within zero days of the accident.
♦ Nursing home confinement or hospital extended care facility.
♦ Physical therapy by a registered physical therapist.
♦ Blood transfusions.
♦ Licensed optometric examination.

LEOFF 1 Medical Benef i ts36
Glossary
Actives
Members who are currently employed.
Actuarial Accrued Liability (AAL)
Computed differently under different funding methods, the actuarial accrued liability generally represents the portion of the present value of fully projected benefits attributable to service credit that has been earned (or accrued) as of the valuation date.
Actuarial Gain or Loss
Experience, from one year to the next, which differs from that assumed will result in an actuarial gain or loss. For example, an actuarial gain would occur if less members retired than assumed.
Actuarial Value of Assets
The value of pension plan investments and other property used by the actuary for the purpose of an actuarial valuation (sometimes referred to as valuation assets). It is common for actuaries to select an actuarial valuation method that smoothes the effects of short term volatility in the market value of assets.
Annual Required Contributions (ARC)
Annual required contribution: refers to a GASB disclosure requirement. The ARC is the annual contribution that will fund the current active and inactive members’ medical benefits by the end of their working lifetimes. It can be calculated as a level dollar amount or a percent of payroll on a year to year basis.
Actuarial Valuation Report (AVR)
Created annually to monitor the State’s pension plans.
Decrement
The mode in which a member leaves employment. Examples include retirement, termination, disability, or death.
Funded Ratio
The ratio of a plan’s assets to its accrued liabilities. There are several acceptable methods of measuring a plan’s assets and liabilities. In financial reporting, funded status is reported using consistent measures by all governmental entities. According to GASB, one acceptable method of calculating the funded ratio is to divide the actuarial value of assets by the actuarial accrued liability calculated under PUC (see below).

Sect ion Five - Appendices 37
Governmental Accounting Standards Board (GASB)
Refers to the private, nonpartisan, nonprofit organization that works to create and improve the rules U.S. state and local governments follow when accounting for their finances and reporting to the public.
Inactives
Retired members or terminated members entitled to a benefit.
Net OPEB Obligation (NOO)
Refers to the GASB disclosure requirement on the balance sheet. It is the cumulative difference between the annual OPEB cost and the actual contributions.
Normal Cost
Computed differently under different funding methods, the normal cost generally represents the portion of the cost of projected benefits allocated to the current plan year.
Other Post-Employment Benefits (OPEB)
Refers to benefits offered to retirees besides a pension and includes, among other benefits, prescription drug insurance, dental insurance, and long-term care insurance.
Present Value of Fully Projected Benefits (PVFB)
Computed by projecting the total future benefit cash flows from the plan, using actuarial assumptions (i.e., probability of death, retirement, salary increases, etc.), and discounting the cash flows to the valuation date using the assumed valuation interest rate.
Projected Unit Credit (PUC) Funding Method
The PUC funding method is a standard actuarial funding method. The annual cost of benefits under PUC is comprised of two components:
♦ Normal cost; plus,
♦ Amortization of the unfunded actuarial accrued liability.
The PUC normal cost is the estimated present value of projected benefits to be earned in the current plan year.
Unfunded Actuarial Accrued Liability (UAAL)
The excess, if any, of the actuarial accrued liability (AAL) over the actuarial value of assets. In other words, the present value of benefits earned to date that are not covered by plan assets.

LEOFF 1 Medical Benef i ts38


Office of the State Actuary“Securing tomorrow’s pensions today.”
2100 Evergreen Park Dr. SWPO Box 40914Olympia, Washington 98504-0914
osa.leg.wa.govstate. [email protected]