Actuarial Approach to MBS Valuation
38
1 May 5, 2009 MORTGAGE BACKED SECURITIES AN ACTUARIAL APPROACH TO CASH FLOW ANALYSIS Kyle S. Mrotek, FCAS, MAAA Neal Dihora, ASA, CFA CAS Spring Meeting May 5, 2009
-
Upload
kylemrotek -
Category
Documents
-
view
576 -
download
4
description
An Actuarial Approach to MBS Valuation, as presented at the CAS\'s 2009 Spring Meeting in New Orleans, Kyle Mrotek and Neal Dihora
Transcript of Actuarial Approach to MBS Valuation
1
May 5, 2009
MORTGAGE BACKED SECURITIES AN ACTUARIAL APPROACH TO
CASH FLOW ANALYSIS
Kyle S. Mrotek, FCAS, MAAANeal Dihora, ASA, CFA
CAS Spring Meeting
May 5, 2009
2
May 5, 2009
Agenda
What is a Mortgage Backed Security (MBS)? Background on the MBS market Current situation Actuarial model presentation
3
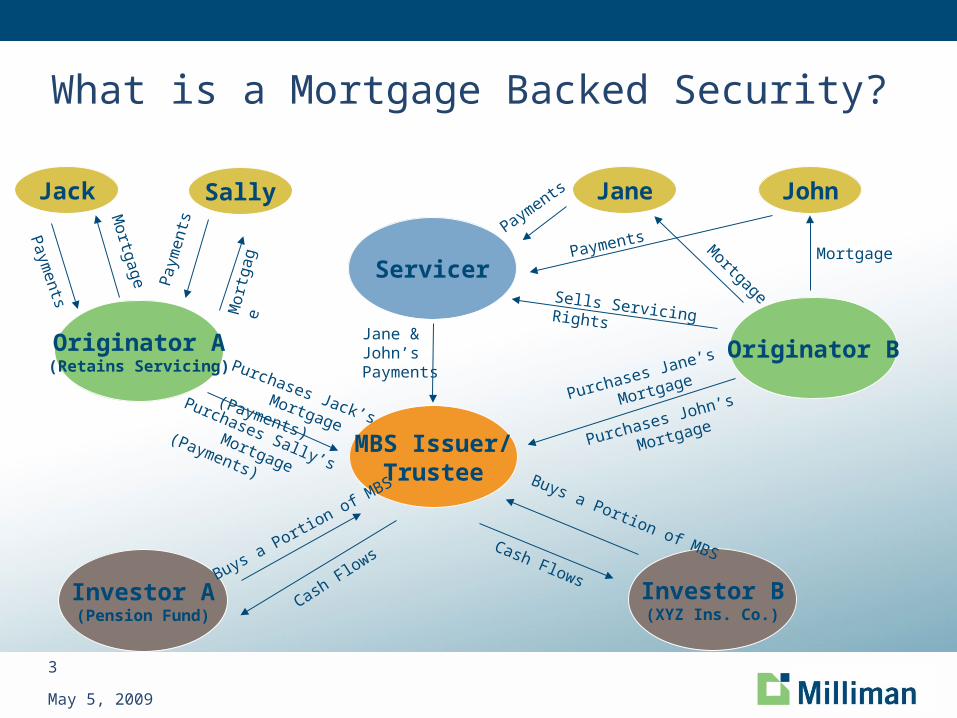
What is a Mortgage Backed Security?
Investor B(XYZ Ins. Co.)
Investor A(Pension Fund)
MBS Issuer/Trustee
Originator A(Retains Servicing)
Originator B
Servicer
Jack Sally Jane John
Mortgage
Payments
Mor
tgag
e
Paym
ents
MortgageMortgage
Payments
Payments
Sells Servicing Rights
Purchases Jane’s
Mortgage
Purchases John’s
Mortgage
Purchases Jack’s
Mortgage (Payments)
Purchases Sally’s
Mortgage (Payments)
Buys a Portion of M
BS
Buys a Portion of MBS
Cash Flows
Cash Flows
Jane & John’s Payments
May 5, 2009

4
May 5, 2009
MBS Valuation Flowchart
Collateral
(Mortgage Loans)
Macro Factors &Assumptions
Prepay /Credit
Models
InterestRate and
HPASimulations
CashFlow
EngineA
BBB
BBB-
Sub
AA
AAA
A
BBB
BBB-
Sub
AA
AAA
LossesLosses
Principal &Interest
Principal &Interest
Data ModelsSecurity Capital
StructureCDO Capital
Structure
Prepay
Default
Loss Severity
5
May 5, 2009
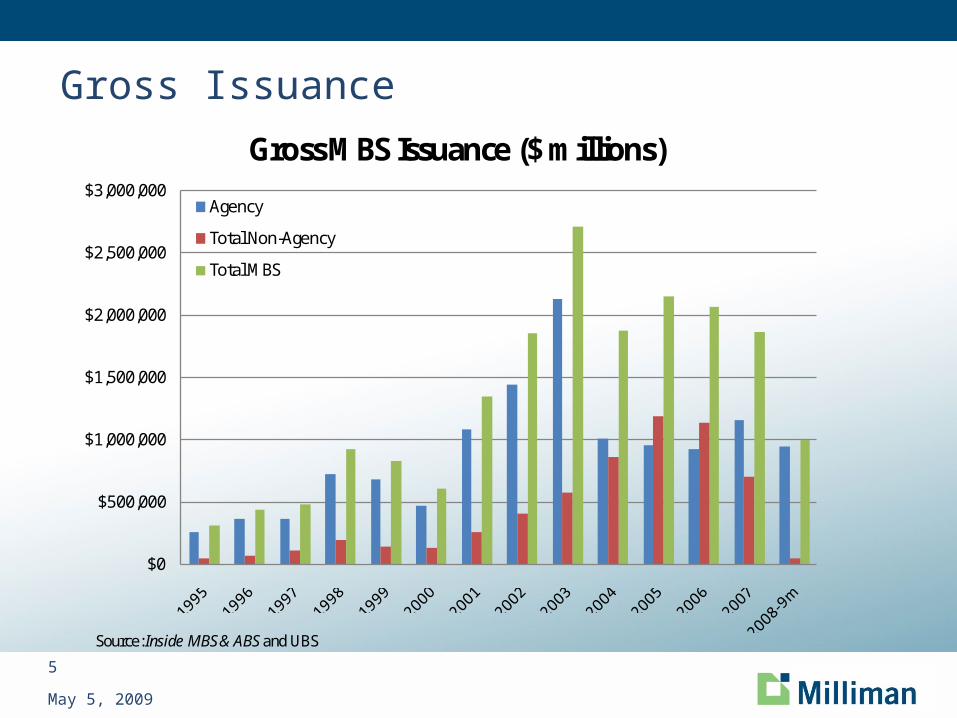
Gross Issuance
$0
$500,000
$1,000,000
$1,500,000
$2,000,000
$2,500,000
$3,000,000
Gross MBS Issuance ($ millions)
Agency
Total Non-Agency
Total MBS
Source: Inside MBS & ABS and UBS
6
May 5, 2009
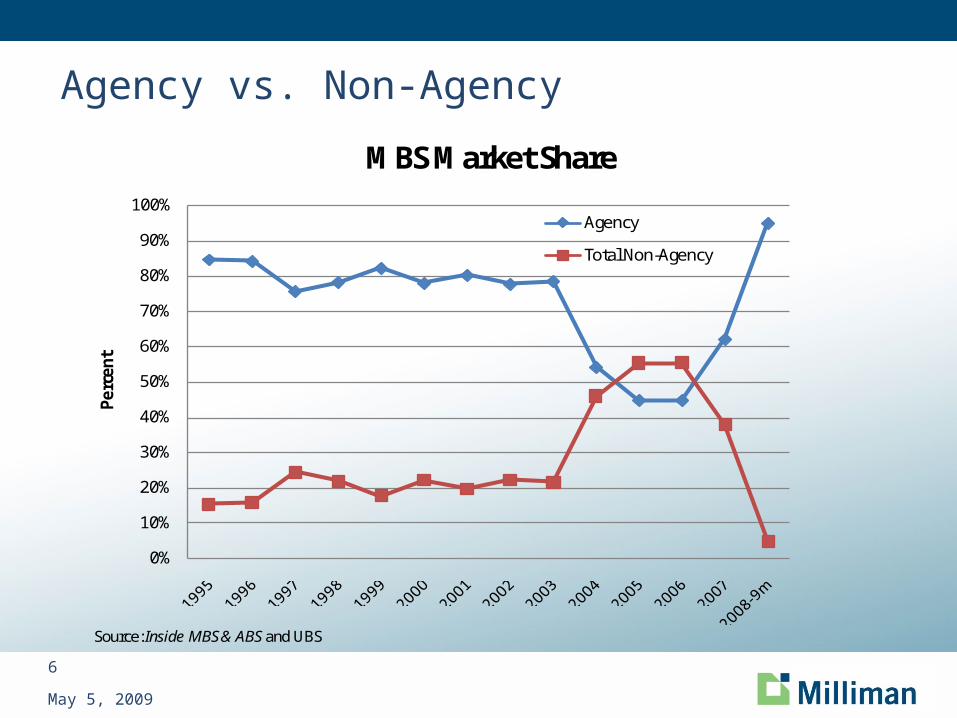
Agency vs. Non-Agency
0%
10%
20%
30%
40%
50%
60%
70%
80%
90%
100%
Perc
ent
MBS Market Share
Agency
Total Non-Agency
Source: Inside MBS & ABS and UBS
7
May 5, 2009
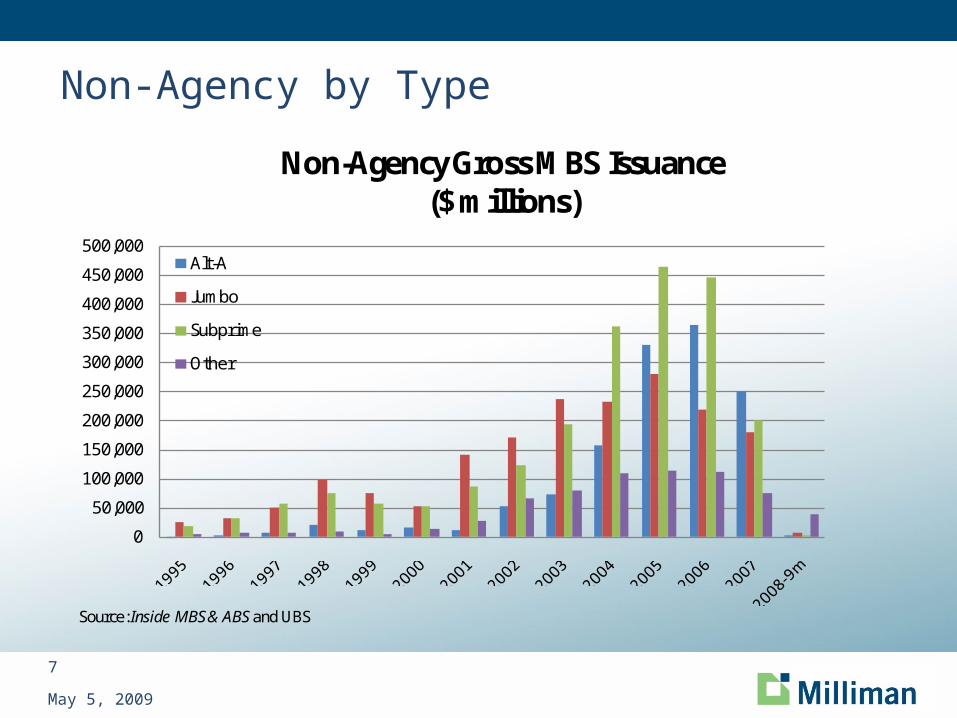
Non-Agency by Type
0
50,000
100,000
150,000
200,000
250,000
300,000
350,000
400,000
450,000
500,000
Non-Agency Gross MBS Issuance($ millions)
Alt-A
Jumbo
Subprime
Other
Source: Inside MBS & ABS and UBS
8
May 5, 2009
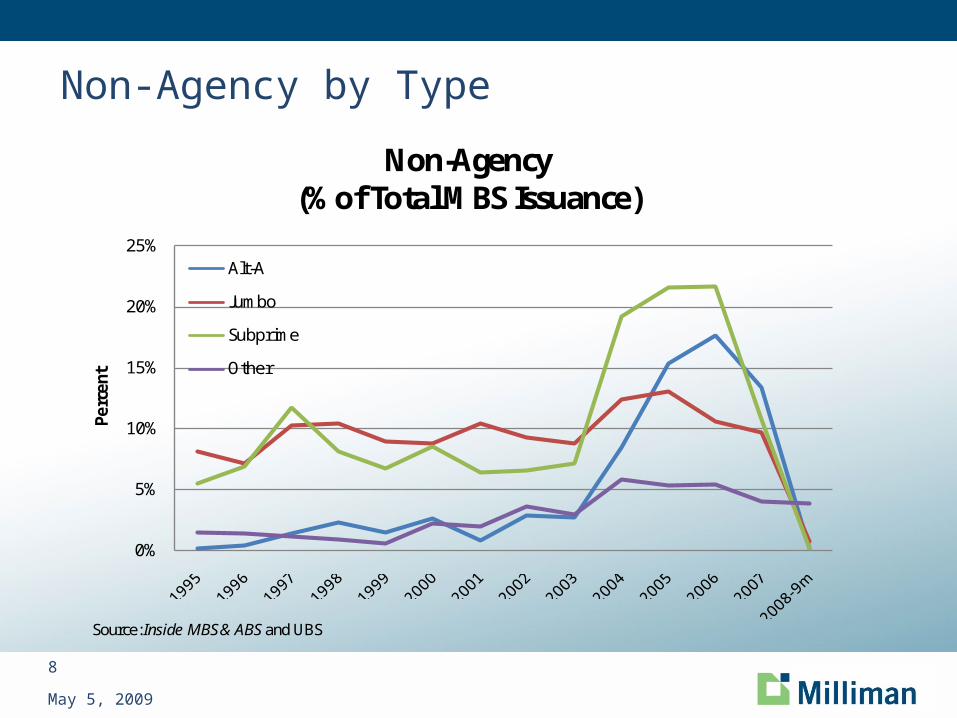
Non-Agency by Type
0%
5%
10%
15%
20%
25%
Perc
ent
Non-Agency (% of Total MBS Issuance)
Alt-A
Jumbo
Subprime
Other
Source: Inside MBS & ABS and UBS
9
May 5, 2009
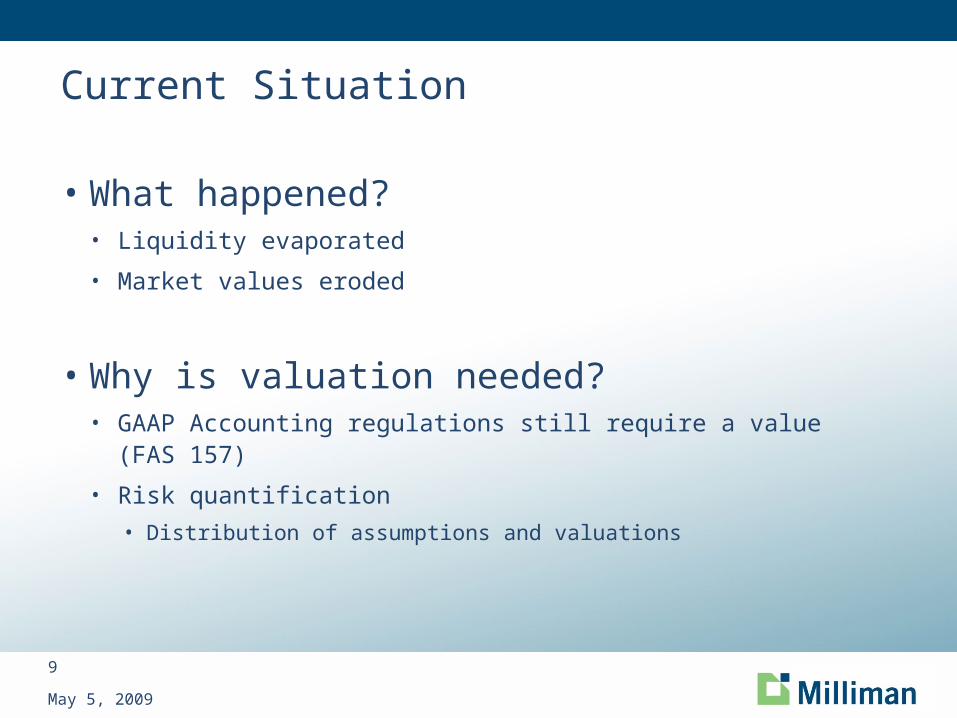
Current Situation
• What happened?• Liquidity evaporated
• Market values eroded
• Why is valuation needed?• GAAP Accounting regulations still require a value (FAS 157)
• Risk quantification• Distribution of assumptions and valuations
10
May 5, 2009
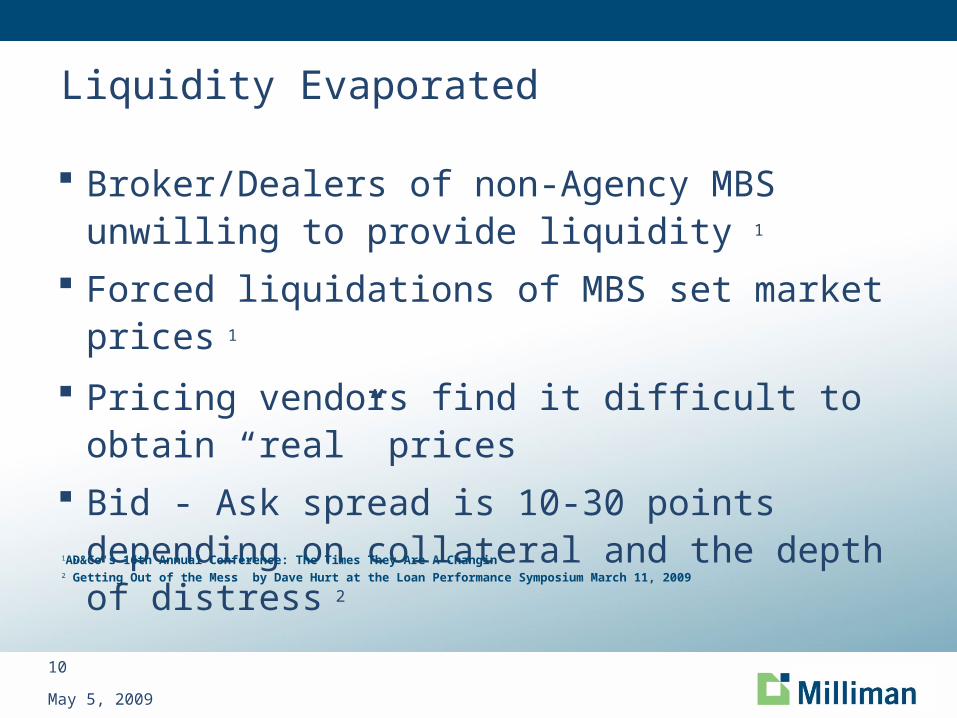
Liquidity Evaporated
Broker/Dealers of non-Agency MBS unwilling to provide liquidity 1
Forced liquidations of MBS set market prices 1
Pricing vendors find it difficult to obtain “real” prices Bid - Ask spread is 10-30 points depending on
collateral and the depth of distress 2
1AD&Co's 16th Annual Conference: The Times They Are A-Changin‘2”Getting Out of the Mess” by Dave Hurt at the Loan Performance Symposium March 11, 2009
11
May 5, 2009
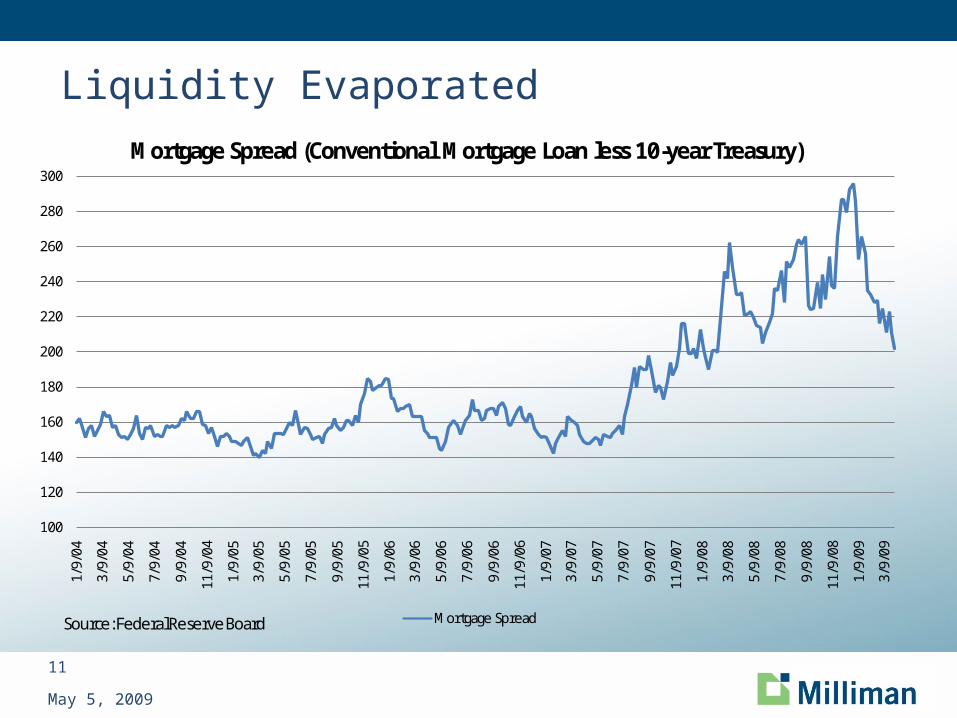
Liquidity Evaporated
100
120
140
160
180
200
220
240
260
280
300
1/9/
04
3/9/
04
5/9/
04
7/9/
04
9/9/
04
11/9
/04
1/9/
05
3/9/
05
5/9/
05
7/9/
05
9/9/
05
11/9
/05
1/9/
06
3/9/
06
5/9/
06
7/9/
06
9/9/
06
11/9
/06
1/9/
07
3/9/
07
5/9/
07
7/9/
07
9/9/
07
11/9
/07
1/9/
08
3/9/
08
5/9/
08
7/9/
08
9/9/
08
11/9
/08
1/9/
09
3/9/
09
Mortgage Spread (Conventional Mortgage Loan less 10-year Treasury)
Mortgage SpreadSource: Federal Reserve Board
12
May 5, 2009
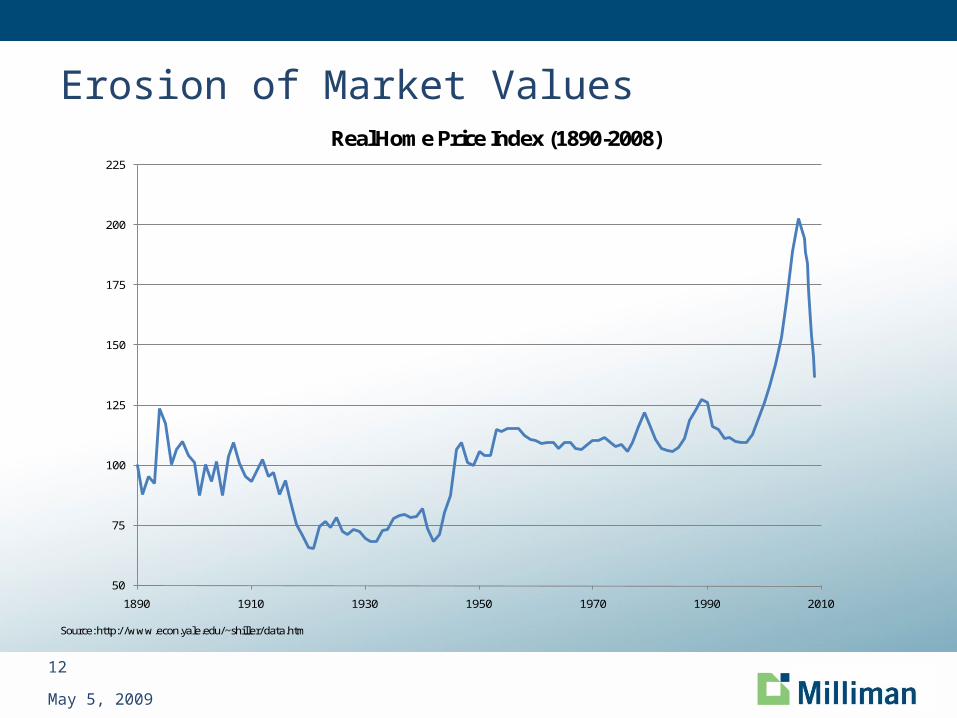
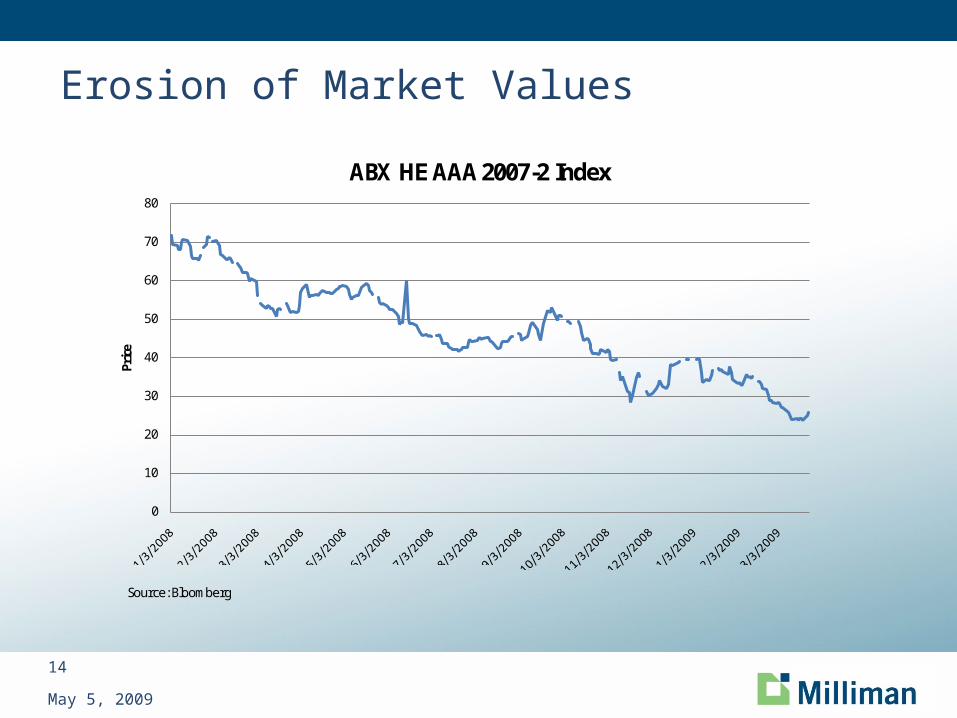
Erosion of Market Values
50
75
100
125
150
175
200
225
1890 1910 1930 1950 1970 1990 2010
Real Home Price Index (1890-2008)
Source: http://www.econ.yale.edu/~shiller/data.htm
13
May 5, 2009
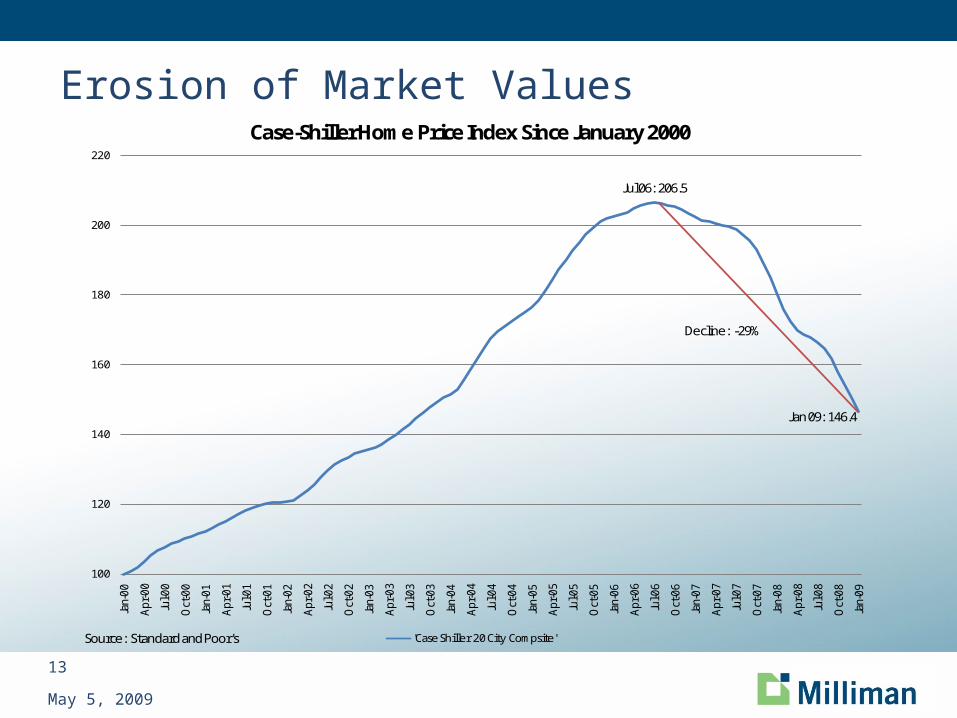
Erosion of Market Values
100
120
140
160
180
200
220
Jan-
00
Apr-0
0
Jul-0
0
Oct
-00
Jan-
01
Apr-0
1
Jul-0
1
Oct
-01
Jan-
02
Apr-0
2
Jul-0
2
Oct
-02
Jan-
03
Apr-0
3
Jul-0
3
Oct
-03
Jan-
04
Apr-0
4
Jul-0
4
Oct
-04
Jan-
05
Apr-0
5
Jul-0
5
Oct
-05
Jan-
06
Apr-0
6
Jul-0
6
Oct
-06
Jan-
07
Apr-0
7
Jul-0
7
Oct
-07
Jan-
08
Apr-0
8
Jul-0
8
Oct
-08
Jan-
09
Case-Shiller Home Price Index Since January 2000
'Case Shiller 20 City Compsite'Source: Standard and Poor's
Jul 06: 206.5
Jan 09: 146.4
Decline: -29%
14
May 5, 2009
Erosion of Market Values
0
10
20
30
40
50
60
70
80
Price
ABX HE AAA 2007-2 Index
Source: Bloomberg
15
May 5, 2009
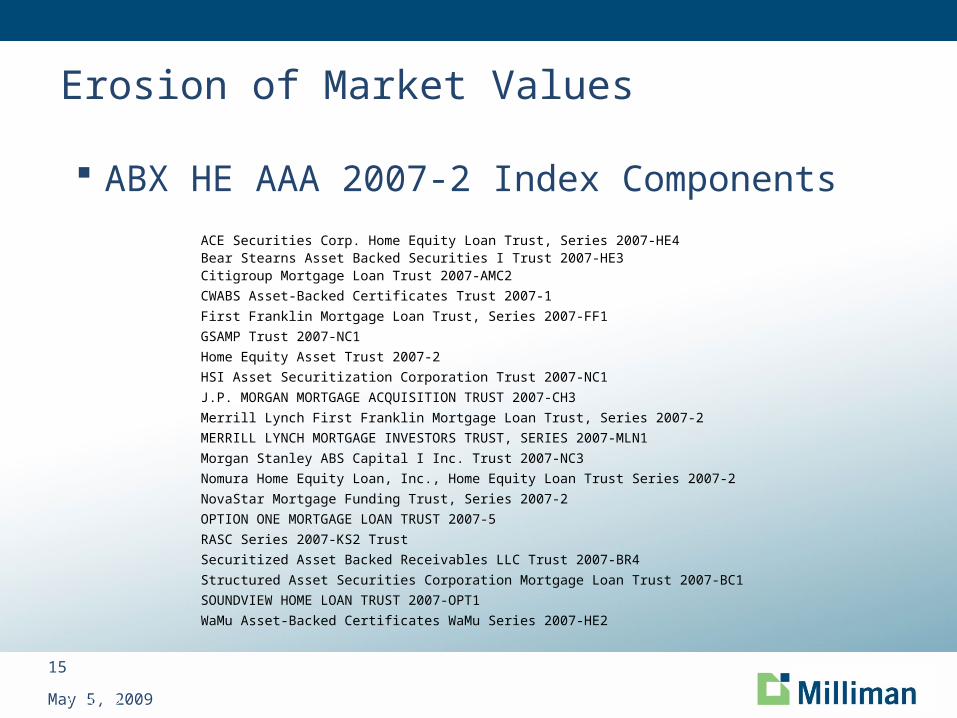
Erosion of Market Values
ABX HE AAA 2007-2 Index ComponentsACE Securities Corp. Home Equity Loan Trust, Series 2007-HE4Bear Stearns Asset Backed Securities I Trust 2007-HE3Citigroup Mortgage Loan Trust 2007-AMC2CWABS Asset-Backed Certificates Trust 2007-1 First Franklin Mortgage Loan Trust, Series 2007-FF1GSAMP Trust 2007-NC1 Home Equity Asset Trust 2007-2 HSI Asset Securitization Corporation Trust 2007-NC1 J.P. MORGAN MORTGAGE ACQUISITION TRUST 2007-CH3Merrill Lynch First Franklin Mortgage Loan Trust, Series 2007-2 MERRILL LYNCH MORTGAGE INVESTORS TRUST, SERIES 2007-MLN1 Morgan Stanley ABS Capital I Inc. Trust 2007-NC3 Nomura Home Equity Loan, Inc., Home Equity Loan Trust Series 2007-2 NovaStar Mortgage Funding Trust, Series 2007-2 OPTION ONE MORTGAGE LOAN TRUST 2007-5 RASC Series 2007-KS2 Trust Securitized Asset Backed Receivables LLC Trust 2007-BR4 Structured Asset Securities Corporation Mortgage Loan Trust 2007-BC1 SOUNDVIEW HOME LOAN TRUST 2007-OPT1 WaMu Asset-Backed Certificates WaMu Series 2007-HE2
Source: markit.com 3/16/09
16
May 5, 2009
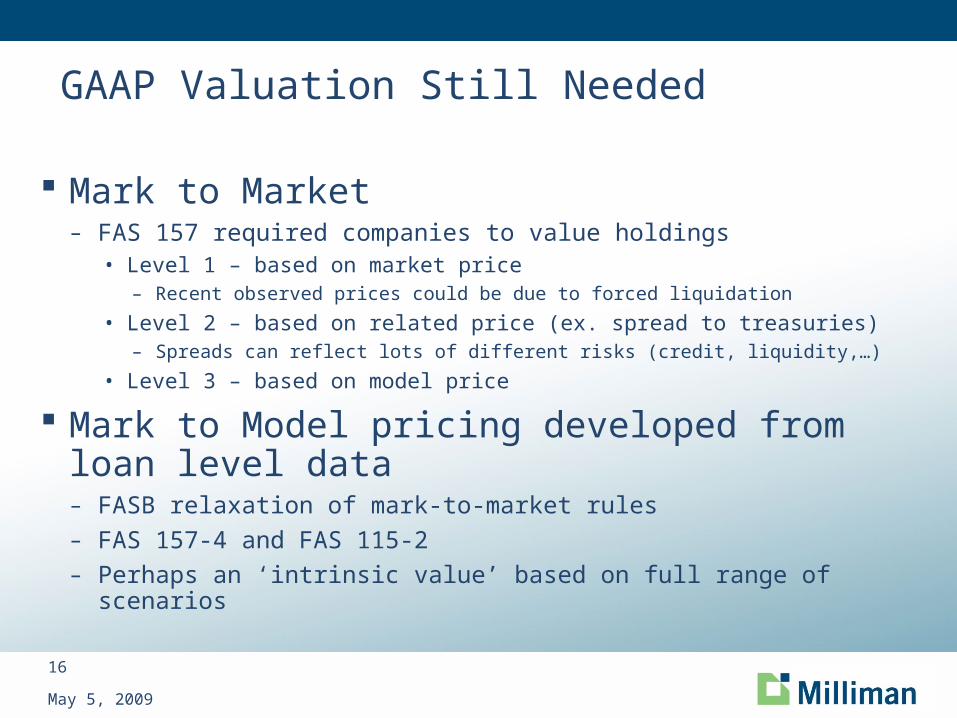
GAAP Valuation Still Needed
Mark to Market – FAS 157 required companies to value holdings
• Level 1 – based on market price– Recent observed prices could be due to forced liquidation
• Level 2 – based on related price (ex. spread to treasuries)– Spreads can reflect lots of different risks (credit, liquidity,…)
• Level 3 – based on model price
Mark to Model pricing developed from loan level data– FASB relaxation of mark-to-market rules – FAS 157-4 and FAS 115-2– Perhaps an ‘intrinsic value’ based on full range of scenarios

17
May 5, 2009
GAAP Valuation Still Needed
FAS 157 –Level 3 assets as % of tangible common equity
18
May 5, 2009
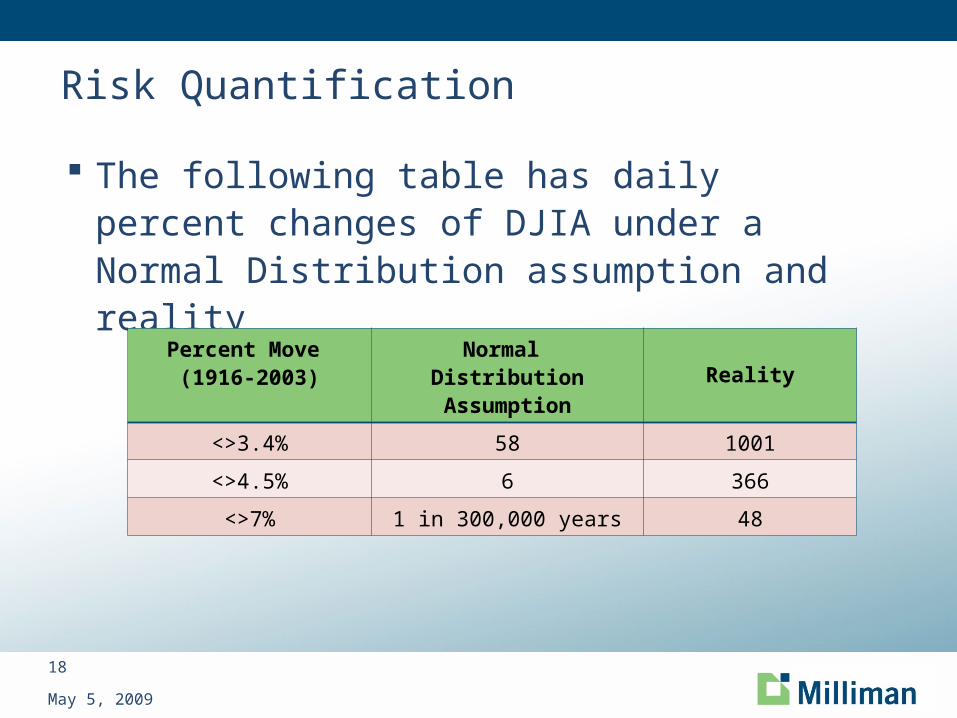
Risk Quantification
The following table has daily percent changes of DJIA under a Normal Distribution assumption and reality
Percent Move (1916-2003)
Normal Distribution Assumption Reality
<>3.4% 58 1001
<>4.5% 6 366
<>7% 1 in 300,000 years 48
Source: Benoit Mandelbrot, Economist 1/24/2009

19
May 5, 2009
MBS Valuation Flowchart
Collateral
(Mortgage Loans)
Macro Factors &Assumptions
Prepay /Credit
Models
InterestRate and
HPASimulations
CashFlow
EngineA
BBB
BBB-
Sub
AA
AAA
A
BBB
BBB-
Sub
AA
AAA
LossesLosses
Principal &Interest
Principal &Interest
Data ModelsSecurity Capital
StructureCDO Capital
Structure
Prepay
Default
Loss Severity
20
May 5, 2009
MBS Valuation Process
Collateral– Extensive history– Utilize loan level experience
Macro factors– Home prices– Interest rates– Unemployment
21
May 5, 2009
Model
General Characteristics– Transparent– Credit Focus
Prepay model– Willingness
• Interest rate– Ability
• Current LTV• Lending standards/policies• Federal government initiatives
22
May 5, 2009
Credit Model
Collateral ‘loss’ projection– Amount and timing– ‘Loss’ is failure to pay timely P&I
Methods– ‘Paid’ Loss Development Factor (LDF)– ‘Incurred’ LDF– Adjusted ‘paid’ BF method– ‘Incurred’ BF– Non-exhaustive
23
May 5, 2009
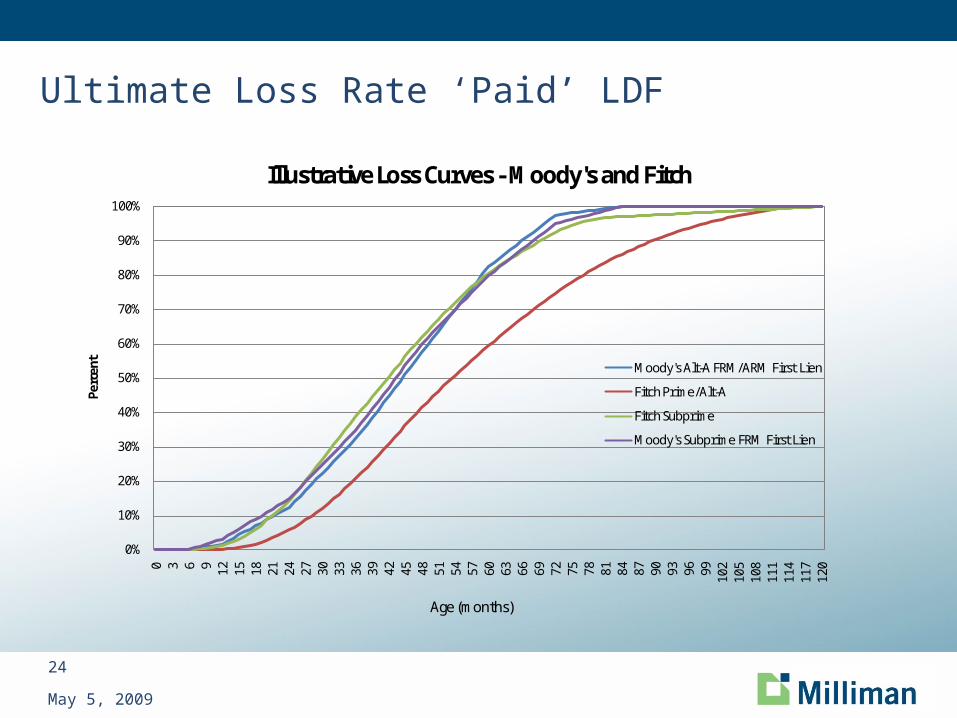
Ultimate Loss Rate ‘Paid’ LDF
Ultimate loss rate (ULR) ‘Paid’ losses to date
– Can calculate from loan level data– Data aggregators
Cumulative loss curve by age of loan– Reciprocal of cumulative LDF– Examples on next slide– What % of the losses should we expect to see at a certain loan age
Ultimate loss = ‘paid’ losses / % expected to be ‘paid’
24
May 5, 2009
Ultimate Loss Rate ‘Paid’ LDF
0%
10%
20%
30%
40%
50%
60%
70%
80%
90%
100%
0 3 6 9 12 15 18 21 24 27 30 33 36 39 42 45 48 51 54 57 60 63 66 69 72 75 78 81 84 87 90 93 96 99 102
105
108
111
114
117
120
Perc
ent
Illustrative Loss Curves - Moody's and Fitch
Moody's Alt-A FRM/ARM First Lien
Fitch Prime/Alt-A
Fitch Subprime
Moody's Subprime FRM First Lien
Age (months)
25
May 5, 2009
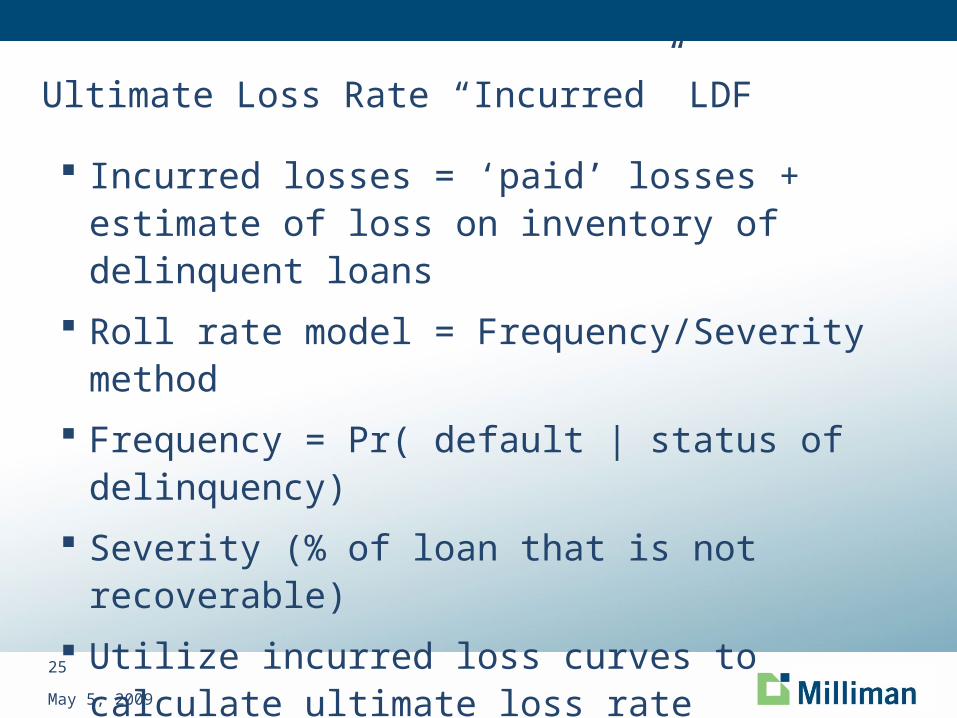
Ultimate Loss Rate “Incurred” LDF
Incurred losses = ‘paid’ losses + estimate of loss on inventory of delinquent loans
Roll rate model = Frequency/Severity method Frequency = Pr( default | status of delinquency) Severity (% of loan that is not recoverable) Utilize incurred loss curves to calculate ultimate
loss rate Challenges/pitfalls
26
May 5, 2009
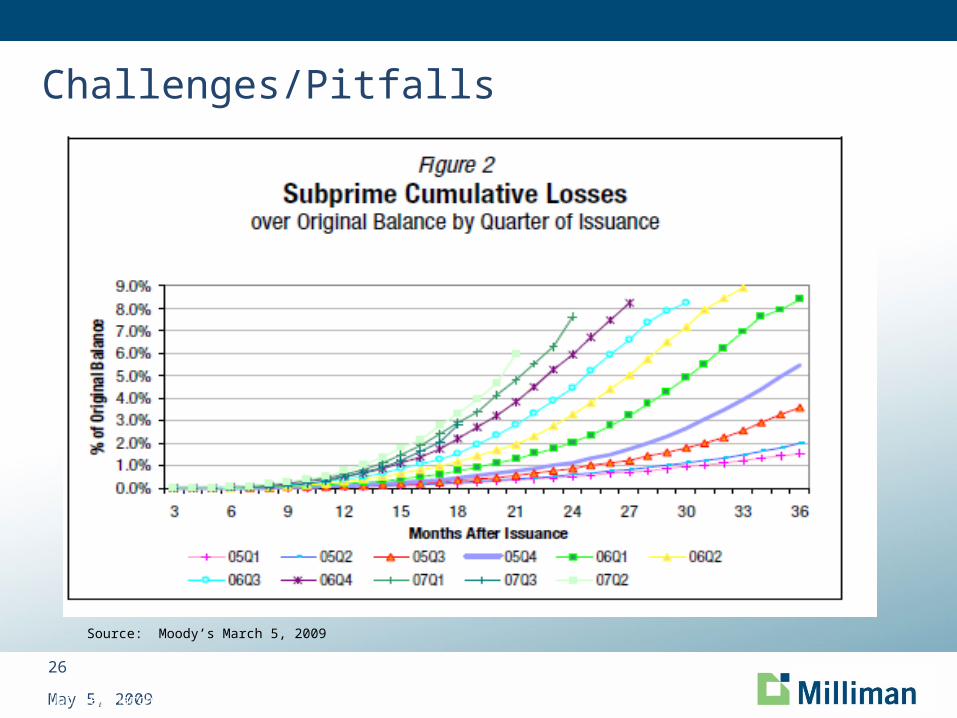
Challenges/Pitfalls
Source: Moody’s Subprime RMBS Loss Projection Update, March 5, 2009
Source: Moody’s March 5, 2009
27
May 5, 2009
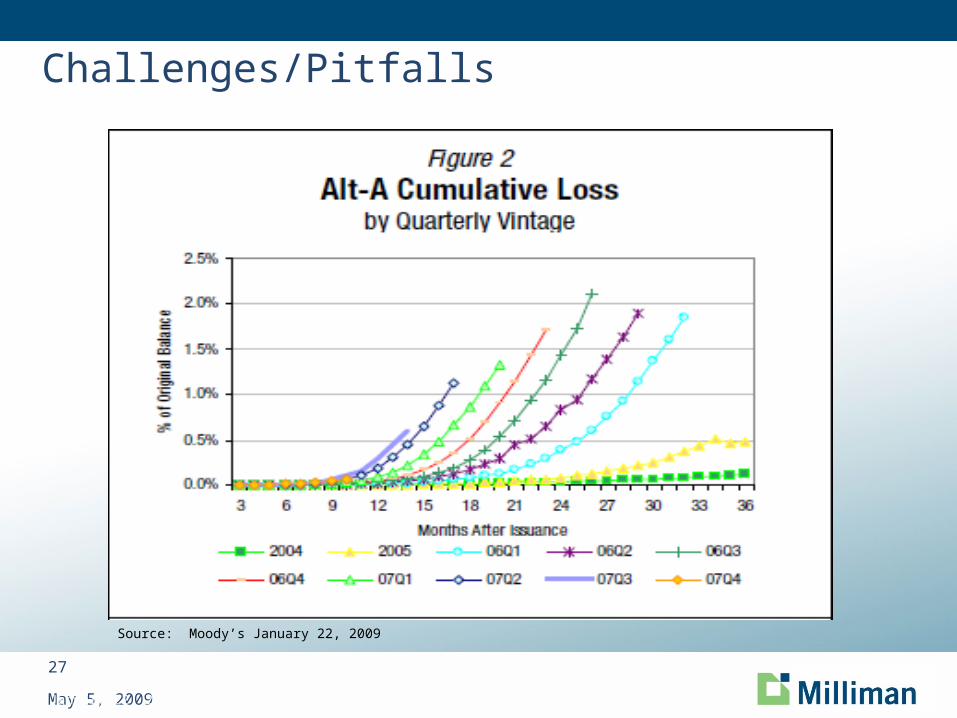
Challenges/Pitfalls
Source: Moody’s Alt-A RMBS Loss Projection Update, January 22, 2009
Source: Moody’s January 22, 2009
28
May 5, 2009
B/F Method
• A Priori ULR Development• Frequency of default
• Severity given default
• Unadjusted a priori ultimate loss rate = frequency x severity
• Critical considerations for loan level collateral• Underwriting characteristics (FICO, LTV, documentation, etc.)
• Economic factors
29
May 5, 2009
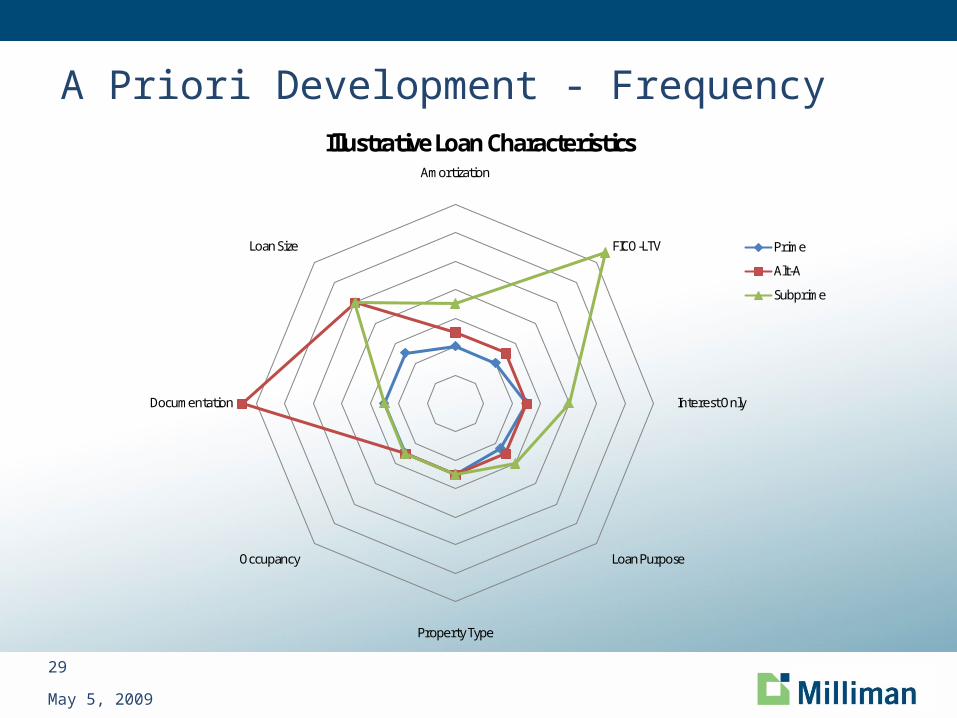
A Priori Development - Frequency
Amortization
FICO-LTV
Interest Only
Loan Purpose
Property Type
Occupancy
Documentation
Loan Size
Illustrative Loan Characteristics
Prime
Alt-A
Subprime
30
May 5, 2009
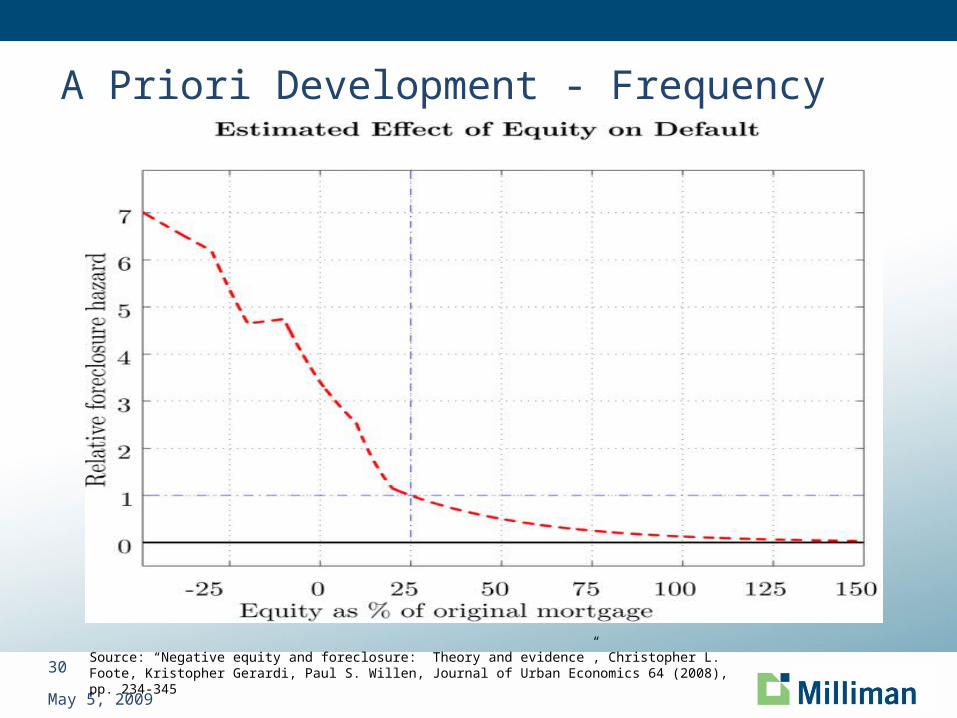
A Priori Development - Frequency
Source: “Negative equity and foreclosure: Theory and evidence”, Christopher L. Foote, Kristopher Gerardi, Paul S. Willen, Journal of Urban Economics 64 (2008), pp. 234-345
31
May 5, 2009
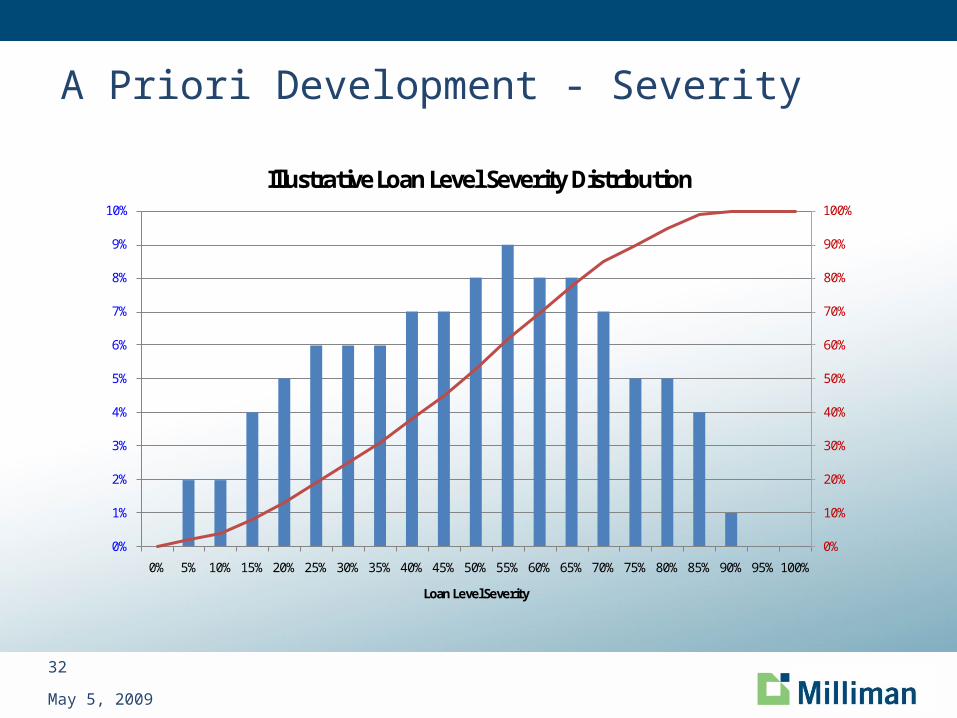
A Priori Development - Severity
• Severity of Default– Home price changes– Costs of foreclosure (realtor, legal, upkeep)– Accrued interest– Stressed sale– Government intervention may impact severity
32
May 5, 2009
A Priori Development - Severity
0%
1%
2%
3%
4%
5%
6%
7%
8%
9%
10%
0% 5% 10% 15% 20% 25% 30% 35% 40% 45% 50% 55% 60% 65% 70% 75% 80% 85% 90% 95% 100%
0%
10%
20%
30%
40%
50%
60%
70%
80%
90%
100%
Loan Level Severity
Illustrative Loan Level Severity Distribution
33
May 5, 2009
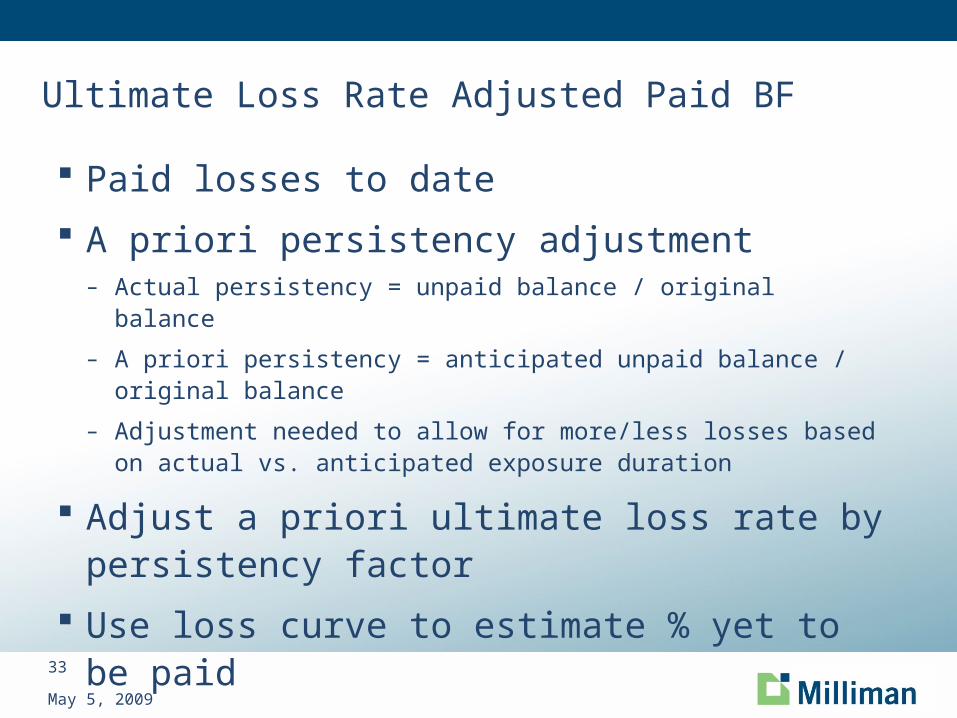
Ultimate Loss Rate Adjusted Paid BF
Paid losses to date A priori persistency adjustment
– Actual persistency = unpaid balance / original balance– A priori persistency = anticipated unpaid balance / original balance– Adjustment needed to allow for more/less losses based on actual vs.
anticipated exposure duration
Adjust a priori ultimate loss rate by persistency factor
Use loss curve to estimate % yet to be paid
34
May 5, 2009
Ultimate Loss Rate “Incurred” BF
Utilize incurred loss curve Take a priori ultimate loss rate (from a priori
development) – Utilize incurred loss curves to estimate % yet to be paid
Incurred BF ultimate loss = incurred to date + estimate of yet to be incurred
35
May 5, 2009
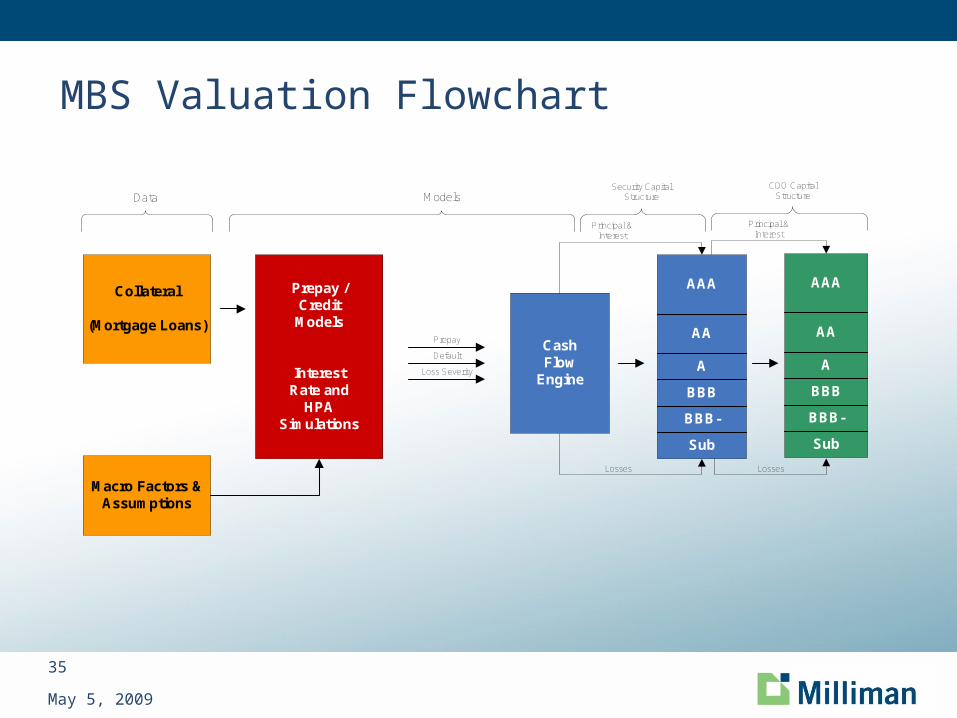
MBS Valuation Flowchart
Collateral
(Mortgage Loans)
Macro Factors &Assumptions
Prepay /Credit
Models
InterestRate and
HPASimulations
CashFlow
EngineA
BBB
BBB-
Sub
AA
AAA
A
BBB
BBB-
Sub
AA
AAA
LossesLosses
Principal &Interest
Principal &Interest
Data ModelsSecurity Capital
StructureCDO Capital
Structure
Prepay
Default
Loss Severity
36
May 5, 2009
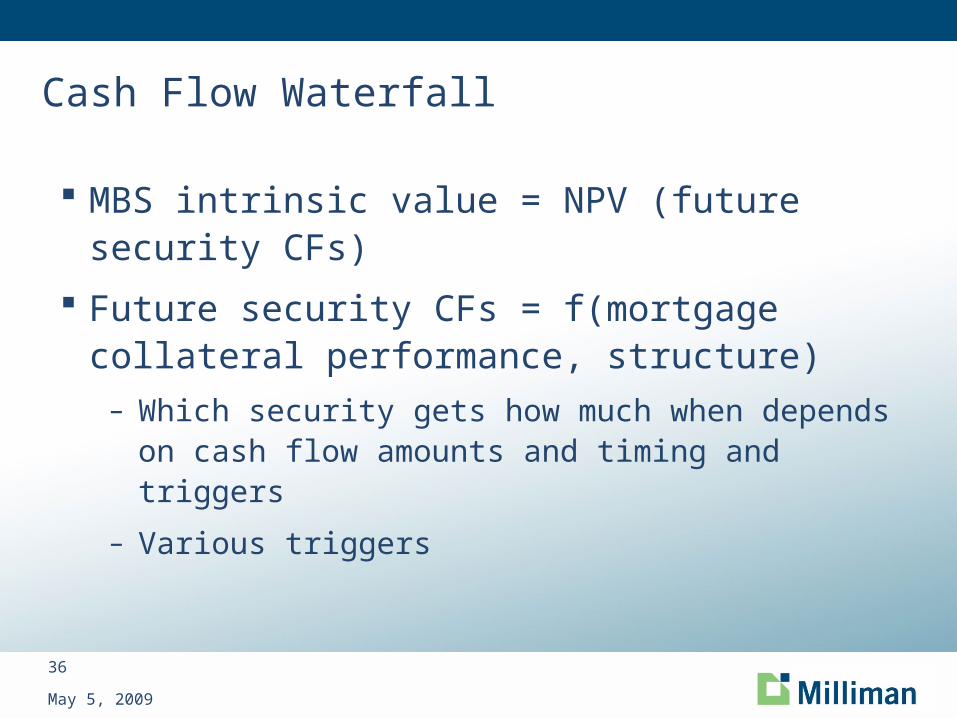
Cash Flow Waterfall
MBS intrinsic value = NPV (future security CFs) Future security CFs = f(mortgage collateral
performance, structure)– Which security gets how much when depends on cash
flow amounts and timing and triggers– Various triggers

37
May 5, 2009
Cash Flow Waterfall
Illustrative NPV of Cash Flow Waterfall OutputNet Present Value (NPV)
RMBS Tranche Original Rating Scenario 1 Scenario 2 Scenario 3
A AAA 99.71 99.66 99.70
B AAA 77.63 78.52 69.03
C AA 79.09 7.81 1.64
D AA 78.64 9.96 1.66
E A 80.16 2.79 0.70
F BBB 86.83 0.64 0.39
G BBB 85.62 0.49 0.39
H BB 0.94 0.40 0.39
I BB 0.78 0.40 0.39
J Not Rated 5.46 5.34 0.39
K Not Rated 0.40 0.40 0.39
38
May 5, 2009
MORTGAGE BACKED SECURITIES AN ACTUARIAL APPROACH TO
CASH FLOW ANALYSIS
Questions?
[email protected]@Milliman.com