2011 Commonwealth Actuarial Valuation Report
48
Commonwealth ACTUARIAL VALUATION REPORT JANUAR Y 1, 2011 PUBLIC EMPLOYEE RE TIREMENT ADMINISTRATION COMMISSION COMMONWEALTH OF MASSACHUSE T TS
Transcript of 2011 Commonwealth Actuarial Valuation Report

Commonwealth ACTUARIAL VALUATION REPORT
JANUAR Y 1, 20 11
PUBLIC EMPLOYEE RE T IREMENT ADMINISTRATION COMMISSION
COMMONWEALTH OF MASSACHUSE T TS

COMMONWEALTH ACTUARIAL VALUATION REPORT
January 1, 2011
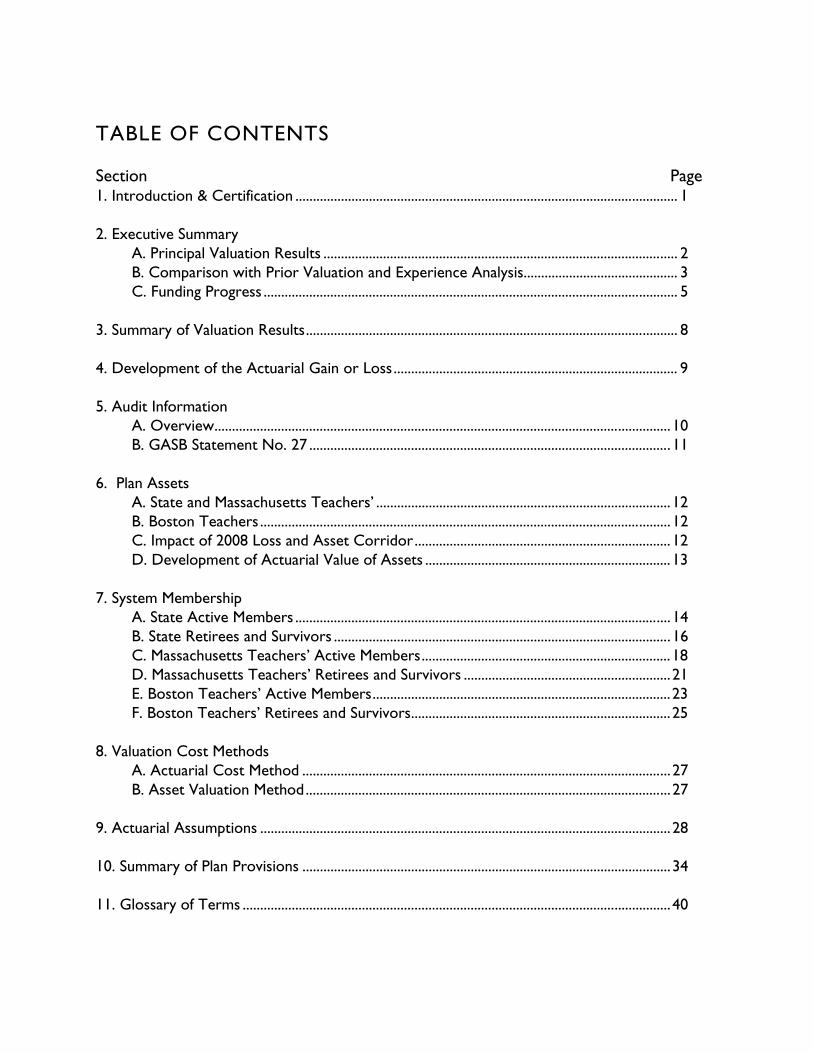
TABLE OF CONTENTS Section Page 1. Introduction & Certification ............................................................................................................. 1 2. Executive Summary A. Principal Valuation Results ..................................................................................................... 2 B. Comparison with Prior Valuation and Experience Analysis............................................ 3 C. Funding Progress ...................................................................................................................... 5 3. Summary of Valuation Results.......................................................................................................... 8 4. Development of the Actuarial Gain or Loss................................................................................. 9 5. Audit Information A. Overview..................................................................................................................................10 B. GASB Statement No. 27 .......................................................................................................11 6. Plan Assets A. State and Massachusetts Teachers’ ....................................................................................12 B. Boston Teachers .....................................................................................................................12 C. Impact of 2008 Loss and Asset Corridor.........................................................................12 D. Development of Actuarial Value of Assets ......................................................................13 7. System Membership A. State Active Members ...........................................................................................................14 B. State Retirees and Survivors ................................................................................................16 C. Massachusetts Teachers’ Active Members.......................................................................18 D. Massachusetts Teachers’ Retirees and Survivors ...........................................................21 E. Boston Teachers’ Active Members.....................................................................................23 F. Boston Teachers’ Retirees and Survivors..........................................................................25 8. Valuation Cost Methods A. Actuarial Cost Method .........................................................................................................27 B. Asset Valuation Method........................................................................................................27 9. Actuarial Assumptions .....................................................................................................................28 10. Summary of Plan Provisions .........................................................................................................34 11. Glossary of Terms ..........................................................................................................................40

C O MM O NW E A L T H A C T U A R I A L V AL U A T I O N R E P OR T | J A N U A R Y 1 , 2 0 1 1 1
1. INTRODUCTION & CERTIFICATION This report presents the results of the actuarial valuation of the pension benefits that are the obligation of the Commonwealth of Massachusetts. The four components are: - State Employees’ Retirement System - Massachusetts Teachers’ Retirement System - Boston Teachers - Cost of Living Allowance Reimbursements to Local Systems The valuation was performed as of January 1, 2011 pursuant to Chapter 32 of the General Laws of the Commonwealth of Massachusetts, and is based on the plan provisions in effect at that time. The actuarial assumptions used to calculate the accrued liability and the normal cost reflect the updated Experience Study Analysis reports we issued in 2007 (State) and 2008 (Teachers). This valuation is based on member data as of December 31, 2010, which was supplied by the State, Massachusetts Teachers’, and Boston Retirement Boards. We performed a number of tests on the data to ensure reasonableness and made specific assumptions for a number of Massachusetts Teacher data items. Asset information as of December 31, 2010 was provided by the Pension Reserves Investment Management Board and by the Boston Retirement Board’s 2010 Annual Statement of Financial Condition. We reviewed both the membership data and financial information for reasonableness but we did not audit this information. We believe this report represents an accurate appraisal of the actuarial status of the Commonwealth’s total pension obligation performed in accordance with generally accepted actuarial principles and practices relating to pension plans. In our opinion, the actuarial assumptions used in this report are reasonable, are related to plan experience and expectations, and represent our best estimate of anticipated experience.
Respectfully submitted, Public Employee Retirement Administration Commission ___________________________________ James R. Lamenzo Member of the American Academy of Actuaries Associate of the Society of Actuaries Enrolled Actuary Number 11-4709 ___________________________________ Joseph E. Connarton Executive Director Dated: September 30, 2011

C O MM O NW E A L T H A C T U A R I A L V AL U A T I O N R E P OR T | J A N U A R Y 1 , 2 0 1 1 2
2. EXECUTIVE SUMMARY PART A | PRINCIPAL VALUATION RESULTS
Section 22C of G.L. c. 32 mandates the establishment of a funding schedule for the pension obligation of the Commonwealth of Massachusetts. The schedule, as mandated by law, calls for payment of the Normal Cost plus an amortization payment on the Unfunded Actuarial Liability (UAL). The provisions of Chapter 32, Section 22C require amortization payments such that the UAL is reduced to 0 by June 30, 2040. Under the current schedule filed earlier this year, the FY12 appropriation is $1.478 billion. This amount will increase 5% in FY13 and FY14 and 6% in FY15, FY16, and FY17. Beginning in FY18, the remaining UAL will be amortized on a 4.0% annual increasing basis to 2040. In no event can appropriations be less than the current schedule through FY17.
The results of the January 1, 2011 actuarial valuation are as follows (in thousands):
Total Normal Cost $1,305,018
Expected Employee Contributions 999,109
Net Normal Cost $305,909
Total Actuarial Liability $64,219,135
Assets 45,630,507
Unfunded Actuarial Liability $18,588,628

C O MM O NW E A L T H A C T U A R I A L V AL U A T I O N R E P OR T | J A N U A R Y 1 , 2 0 1 1 3
2. EXECUTIVE SUMMARY (continued)
PART B | COMPARISON WITH PRIOR VALUATION AND EXPERIENCE ANALYSIS
A comparison of the results of the current valuation and the January 1, 2010 valuation is shown below. ($000’s omitted)
1/1/11 1/1/10 Increase (Decrease)
Increase (Decrease)
Total Normal Cost 1,305,018 $1,266,427 $38,591 3.0%
Expected Employee Contributions
999,109 978,902 20,207 2.1%
Net Normal Cost 305,909 $287,525 $18,384 6.4%
Actuarial Liability
Actives 28,739,414 $28,212,825 $526,589 1.9%
Retirees and Inactives 35,479,721 33,362,851 2,116,870 6.3%
Total 64,219,135 $61,575,676 $2,643,459 4.3%
Assets 45,630,507 41,589,706 4,040,801 9.7%
Unfunded Actuarial Liability 18,588,628 $19,985,970 ($1,397,342) (7.0%)
Funded Ratio 71.1% 67.5% 3.6%
The development of the actuarial gain/(loss) is shown on page 9. During 2010, there was an overall actuarial gain of $2.2 billion. There was a non-investment gain on actuarial liability of approximately $344 million and a gain on assets (on an actuarial value basis) of approximately $1.9 billion.
Since 1998, PERAC has valued system assets using a smoothing technique which spreads gains and losses over short periods (5 years). As a result, it is expected that the follow-on impact of the 2008 investment loss will lead to increases in the unfunded actuarial liability (UAL) in the next few years. In contrast, the smoothing technique as applied to 2010 experience contributes to the decrease in UAL reflected in this report.
State
Chapter 61 of the Acts of 2009, as amended by Chapter 102 of the Acts of 2009, transferred active members of the county sheriffs’ departments in Barnstable, Bristol, Dukes, Norfolk, Plymouth, and Suffolk Counties to the State Retirement System effective January 1, 2010. Approximately 2,750 members transferred to the State under this law. As of January 1, 2011, the Annuity Savings Fund (ASF) balances for these members have been transferred with the exception of Plymouth County (520 members)

C O MM O NW E A L T H A C T U A R I A L V AL U A T I O N R E P OR T | J A N U A R Y 1 , 2 0 1 1 4
2. EXECUTIVE SUMMARY (cont inued) PART B | COMPARISON WITH PRIOR VALUATION AND
EXPERIENCE ANALYSIS (cont inued)
and the union employees of Suffolk County (500 members). The data provided for these members reflects total service of one year or less (the date of transfer). Therefore, we estimated the actuarial costs and liabilities for these members and assumed their average pay and service were the similar to all other transferred sheriffs’ department employees.
The increase in actuarial liability for these transferred members is $341 million. The ASF balance transferred and remaining to be transferred is approximately $116 million. Therefore, the increase in unfunded liability on a market value basis is approximately $225 million. The increase in employer normal cost is approximately $22 million. In the absence of this development, the unfunded liability for the Commonwealth would be $18.4 billion and the funded ratio would be 71.2% rather than 71.1%.
In our 2010 actuarial valuation, we indicated that the liabilities for former members of the Massachusetts Turnpike Authority Employees’ Retirement System who transferred to the State Retirement System were included in our results. The market value of assets is maintained in a separate fund and was not included in the January 1, 2010 valuation results. The market value of assets is $193 million as of December 31, 2010.
Teachers
We have once again detailed a number of the assumptions we made for missing or questionable data for active members of the Massachusetts Teachers’ Retirement System (TRS) in Part C of Section 7. Because of the implementation of a new system, the TRS submission of active data was delayed this year. We performed a number of additional data checks as part of this valuation. We believe these assumptions provide reasonable valuation results on an overall basis for the Commonwealth. We will continue to work with the TRS as the system implementation moves forward.
Boston Teachers
In prior valuations, the assets allocated to Boston teachers were based on the allocation of the total actuarial accrued liability between Boston teachers and other members of the State-Boston Retirement System (29.91% of total). On May 22, 2010, the Governor signed Chapter 112 of the Acts of 2010. Sections 7-18, 48, and 50 of Chapter 112 changes the methodology for funding Boston teachers. Key components of Chapter 112 include direct funding by the Commonwealth of the Boston teacher liability and management of Boston teacher assets by PRIT. In an agreement signed by the City of Boston, the Boston Retirement Board, Administration and Finance, the Comptroller, and PERAC, 27% of Boston assets as of the date(s) of transfer were determined to be assets for Boston teacher liabilities. With this adjustment, the overall Commonwealth unfunded liability increased by approximately $127 million.
An initial transfer of approximately $1.04 billion was made by Boston to PRIT in July 2010. The remaining transfer of approximately $3.1 million was made in December 2010. In addition, a payment of $126 million was transferred from the Massachusetts Teachers’ Retirement System appropriation to the City of Boston and then to the Boston Retirement System. Future appropriations from the State for Boston teachers will be made directly to the Boston Retirement System.

2. EXECUTIVE SUMMARY
PART C | FUNDING PROGRESS UNFUNDED LIABILITY
The chart below shows the Commonwealth’s unfunded actuarial accrued liability (UAL) since 1990. The UAL represents the actuarial accrued liability less the actuarial value of
plan assets. When there is no UAL, a system is said to be “fully funded.” In this exhibit, for years prior to 2000, estimates were developed to reflect implementation of new actuarial software.
COMMONWEALTH ACTUARIAL VALUATION REPORT | JANUARY 1, 2011 5
0
$3.0
$6.0
$9.0
$12.0
$15.0
$18.0
$21.0
$24.0
1/06 1/071/051/041/031/021/011/001/981/961/951/931/90
$12.2
$11.1
$9.8
$8.4$7.9
$4.8
COMMONWEALTH UNFUNDED LIABILITY(in billions of dollars)
$6.4
$7.4
$13.4 $13.3
$12.0
$13.4
$14.5
$22.1
$20.0
$18.6
1/08 1/09 1/10 1/11
$12.1
COMMONWEALTH UNFUNDED L IAB IL ITY ( i n b i l l i on s o f do l l a r s )

2. EXECUTIVE SUMMARY
PART C | FUNDING PROGRESS FUNDED RATIO
The chart below shows the Commonwealth’s funded ratio progress since 1990. The funded ratio represents the actuarial value of plan assets divided by the actuarial accrued liability. When the funded ratio reaches 100%, a system is said to be “fully funded.” In this exhibit, for years prior to 2000, estimates were developed to reflect implementation of new actuarial software.
COMMONWEALTH ACTUARIAL VALUATION REPORT | JANUARY 1, 2011 6
COMMONWEALTH FUNDED RATIO
20%
40%
60%
80%
100%
1/06 1/07 1/08 1/09 1/101/111/051/041/031/021/011/001/981/961/951/931/90
39.0%
48.8%
55.8%
64.9%
72.6%
85.2%
82.1%81.1%
68.9%
73.9%
72.3%71.5%
75.2%78.6%
62.7%
67.5%
71.1%
COMMONWEALTH FUNDED RATIO

2. EXECUTIVE SUMMARY
PART C | FUNDING PROGRESS COMPARISON OF MARKET AND ACTUARIAL VALUE OF ASSETS
In valuations prior to 1998, plan assets were determined at market value. As part of the 1998 valuation, this methodology was adjusted to reduce the potential volatility in the market value
approach from year to year. The actuarial method smoothes gains and losses over a five-year period. Investment gains and losses are not fully realized until five years have elapsed. Therefore,
in some years the actuarial value will be less than the market value, and in other years, it will exceed the market value.
COMMONWEALTH ACTUARIAL VALUATION REPORT | JANUARY 1, 2011 7
$15.0
$20.0
$25.0
$30.0
$35.0
$40.0
$45.0
1/06 1/07 1/08 1/09 1/10 1/111/051/041/031/021/011/001/981/96
Market Value
Actuarial Value
$15.5
$20.8
$27.9$29.2
$31.7
$21.4
$30.7 $30.2$28.7
$25.8
$29.6
$31.7
$34.0
COMPARISON of ASSET METHODOLOGIES(in b i l l ions of dol lars)
$50.0
$34.9
$35.5
$39.0
$36.4
$40.4
$44.5$44.9
$49.2
$33.7
$37.1
$37.8
$41.5$41.6
$45.6
COMPARISON o f ASSET METHODOLOGIES ( i n b i l l i on s o f do l l a r s )
C O MM O NW E A L T H A C T U A R I A L V AL U A T I O N R E P OR T | J A N U A R Y 1 , 2 0 1 1 8
3. SUMMARY OF VALUATION RESULTS (Dollars in thousands)
A. Number of Members State Mass. Teachers
Boston Teachers
Local COLA
Total
Active 86,586 87,136 5,617 179,339
Vested Terminated 3,973 N/A 169 4,142
Retired/ Beneficiaries 53,627 55,690 4,075 113,392
Total 144,186 142,826 9,861 296,873
B. Total Payroll $4,808,250 $5,558,311 $445,414 $10,811,975
C. Normal Cost
Superannuation $423,294 $539,548 $42,698 $1,005,540
Death 43,702 28,599 2,181 74,482
Disability 73,715 8,633 650 82,998
Termination 61,601 74,016 6,381 141,998
Total Normal Cost $602,312 $650,796 $51,910 $1,305,018
Expected Employee Contributions 411,821 543,832 43,456 999,109
Net Employer Normal Cost $190,491 $106,964 $8,454 $305,909
D. Actuarial Liability
Active
Superannuation $11,934,462 $14,054,110 $1,054,627 $27,043,199
Death 304,709 216,659 17,120 538,488
Disability 359,453 79,787 6,258 445,498
Termination 303,304 380,534 28,391 712,229
Total Active $12,901,928 $14,731,090 $1,106,396 $28,739,414
Vested Terminated (a) 541,871 500,000 33,941 1,075,812
Non-Vested Terminated 168,347 0 25,437 193,784
Retirees and Survivors 12,630,630 19,659,901 1,637,894 281,700 34,210,125
Total Actuarial Liability $26,242,776 $34,890,991 $2,803,668 $281,700 $64,219,135
E. Actuarial Value of Assets 21,244,900 23,117,952 1,267,655 0 45,630,507
F. Unfunded Actuarial Liability $4,997,876 $11,773,039 $1,536,013 $281,700 $18,588,628
G. Funded Ratio: E/D 81.0% 66.3% 45.2% 0.0% 71.1%
(a) Massachusetts Teachers’ amount is estimated and includes non-vested terminated members.

C O MM O NW E A L T H A C T U A R I A L V AL U A T I O N R E P OR T | J A N U A R Y 1 , 2 0 1 1 9
4. DEVELOPMENT OF THE ACTUARIAL GAIN OR LOSS ( in mi l l ions)
State Mass. Teachers
Boston Teachers
Local COLA
Total
A. Gain/(loss) on Actuarial Liability
1. Actuarial Liability 1/1/10 24,862 33,739 2,672 302 61,575
2. Total Normal Cost 1/1/10 578 640 48 0 1,266
3. Interest on (1) and (2) at 8.25% 2,099 2,836 224 25 5,184
4. Benefits paid during 2010 [a] 1,368 2,070 170 44 3,652
5. Interest on (4) assuming mid year payment 56 85 7 2 151
6. Expected Actuarial Liability before Sheriff transfer 1/1/11: 26,114 35,060 2,767 281 64,223
(1)+(2)+(3)-(4)-(5)
7. Increase in Liability due to transfer of sheriff’s departments 341 0 0 0 341
8. Expected Actuarial Liability after sheriff transfer 1/1/11: 26,455 35,060 2,767 281 64,564
(6)+(7)
9. Actuarial Liability 1/1/11 26,243 34,891 2,804 282 64,220
10. Gain/(loss): (8)-(9) 212 169 (37) (1) 344
B. Gain/(loss) on assets
11. Actuarial Value of Assets (AVA) 1/1/10 19,019 21,263 1,308 0 41,590
12. Interest on (11) at 8.25% 1,569 1,754 108 0 3,431
13. Net Receipts [b] 546 605 170 0 1,321
14. Net Disbursements [b] 1,072 1,480 180 0 2,732
15. Net Cash Flow: (13)-(14) (526) (875) (10) 0 (1,411)
16. Interest on (15) [c] (22) (39) (0) 0 (61)
17. Expected AVA before transfers 1/1/11: 20,040 22,103 1,405 0 43,549
(11)+(12)+(15)+(16)
18. Sheriff transfer 116 0 0 0 116
19. Mass Turnpike transfer 193 0 0 0 193
20. Boston teacher adjustment 0 0 (127) 0 (127)
21. Expected AVA after transfers 1/1/11: 20,349 22,103 1,278 0 43,731
(17)+(18)+(19) +(20)
22. AVA 1/1/11 21,245 23,118 1,268 0 45,631
23. Gain/(loss): (22)-(21) 896 1,015 (10) 0 1,900
C. Total Gain/(loss): (10)+(23) 1,108 1,184 (47) (1) 2,244
[a] Estimated
[b] Amounts actually received or disbursed by the fund. Boston Teachers estimated.
[c] Assumes time weighting based on monthly cash flow. Boston Teachers assumed mid year.

C O MM O NW E A L T H A C T U A R I A L V AL U A T I O N R E P OR T | J A N U A R Y 1 , 2 0 1 1 10
5. AUDIT INFORMATION PART A | OVERVIEW We have included the actuarial information required by GASB Statement No. 27 in this report. The Commonwealth of Massachusetts began implementing Statement No. 27 in Fiscal Year 1996. Under GASB Statement No. 27, an Annual Required Contribution (ARC) must be calculated each year. The same methods and assumptions that are used to determine funding requirements are used in this calculation. At this time, the methods and assumptions used by the Commonwealth to determine the funding schedule are well within the parameters established by Statement No. 27. When GASB 27 was implemented in FY96, a Net Pension Obligation (NPO) at transition was calculated. This was essentially the cumulative difference between the employer’s required contributions and the contributions actually made by the employer for all years, beginning with Fiscal Year 1988. In each year since FY96, the NPO has been updated. After the January 1, 2006 actuarial valuation was released, the Comptroller’s office requested we recalculate the GASB 27 development from inception through FY06 assuming a zero pension obligation as of June 30, 1997. Those results were first shown in the January 1, 2007 valuation report. As part of this valuation, we brought the NPO forward from FY10 to FY11. For FY11, the amortization cost was determined using a 4.0% increasing amortization to FY40. The current schedule used by the Commonwealth has a FY12 appropriation of $1.478 billion and increases by 5% in FY13 and FY14 and by 6% in FY15, FY16, and FY17. Beginning in FY18, the remaining UAL will be amortized on a 4.0% annual increasing basis to 2040. In no event can appropriations be less than the current schedule through FY17. Note that, in any year, the amount of the ARC will not equal the Commonwealth’s appropriation amounts for the following reasons: 1. The ARC is based upon the most recent valuation, whereas the funding schedule is generally
submitted to the legislature 15 months after the valuation upon which it is based. The funding schedule is then set for the upcoming three fiscal years.
2. Amortization bases of actuarial gains and losses and plan amendments may be amortized on a
different basis than the rest of the funding schedule. However, the amortization cost that GASB 27 reflects is an amortization of the entire unfunded liability which is roughly equivalent to the current schedule.
3. Although there is no difference in the totals, contributions have been allocated in a slightly different
manner between the State and COLA portions. For purposes of Statement No. 27, a larger contribution was made to the State, with a lesser amount to the COLA. This was done so the NPO for the local COLA remains at zero. No assets are attributed to the local COLA.

C O MM O NW E A L T H A C T U A R I A L V AL U A T I O N R E P OR T | J A N U A R Y 1 , 2 0 1 1 11
5. AUDIT INFORMATION (continued) PART B | GASB STATEMENT NO. 27 ($000’s omitted)
State
Mass. Teachers
Boston Teachers
Local COLA
Total
1. Annual Required Contribution (ARC) for FY11
a. Normal Cost 190,491 106,964 8,454 0 305,909 b. Amortization Cost 280,605 660,996 86,239 15,816 1,043,656 c. ARC: (a) + (b) 471,096 767,960 94,693 15,816 1,349,565 2. Amount under (over) funded from prior year (NPO) 219,225 863,620 153,506 0 1,236,351 3. Interest on NPO 18,086 71,249 12,664 0 101,999 4. Amortization of NPO 12,308 48,488 8,619 0 69,415 5. Pension Cost: (1c) + (3) – (4) 476,874 790,721 98,739 15,816 1,382,150 6. Actual Contribution * 503,161 831,321 88,646 18,872 1,442,000 7. (5) – (6) (26,287) (40,600) 10,093 (3,056) (59,850) 8. Net Pension Obligation/(Asset): (2)+ (7) 192,938 823,020 163,599 (3,056) 1,176,501 * estimated allocation Totals may not add exactly due to rounding.

C O MM O NW E A L T H A C T U A R I A L V AL U A T I O N R E P OR T | J A N U A R Y 1 , 2 0 1 1 12
6. ASSETS PART A | STATE AND MASS. TEACHERS’ (Dol lars shown in thousands)
State Mass. Teachers Pension Reserves Investment Trust Market Value $19,313,545 $21,016,320 Actuarial Value $21,244,900 23,117,952 Actuarial Value as a Percentage of Market Value 110% 110%
The Market Value of Assets shown above for the State consists of the assets as of December 31, 2010 for the State Employees’ Retirement System ($19,078,247), the assets for the Massachusetts Turnpike Authority Employees Retirement System ($193,298) and the Annuity Savings Fund balances of the Sheriffs’ Department employees in Plymouth County and Suffolk County that were not yet transferred (estimated to be $42,000).
The actuarial value of assets is determined so that 20% of the investment gain and loss in a given year is recognized annually for the next five years. Therefore, these investment gains and losses are fully recognized after five years. In addition to this treatment of gains and losses, we use a “corridor” approach so that the actuarial value of assets can never be too far from the market value of assets. Under our approach for the Commonwealth, the actuarial value cannot be less than 90% nor greater than 110% of the market value.
PART B | BOSTON TEACHERS Based on the enactment of Chapter 112 of the Acts of 2010, 27% of the assets of the
Boston Retirement System was determined to be allocated to Boston teachers. The transfer of these assets to PRIT occurred during 2010. We set the actuarial value of assets to 110% of the market value based on the results for State and Massachusetts Teachers.
Market Value $1,152,414 Actuarial Value (110% of Market Value) $1,267,655
PART C | IMPACT OF 2008 LOSS AND ASSET CORRIDOR
Due to the severity of the 2008 investment loss, the actuarial value of assets has been 110% of the market value since the January 1, 2009 valuation. The calculated actuarial values were 133.8%, 120.0%, and 110.5% of the market value on January 1, 2009, 2010, and 2011, respectively. Since the 110% corridor applied each year, the actual returns on an actuarial and market value basis are almost identical in both 2009 and 2010.
The unfunded actuarial liability decreased from $20.0 billion on January 1, 2010 to $18.6 billion on January 1, 2011. This decrease is a result of the plan being subject to the 110% corridor in both years and the13.7% return in 2010. It is important to note that we expect the unfunded liability to increase in the next few years as the remaining 2008 loss is recognized and the corridor no longer applies.
C O MM O NW E A L T H A C T U A R I A L V AL U A T I O N R E P OR T | J A N U A R Y 1 , 2 0 1 1 13
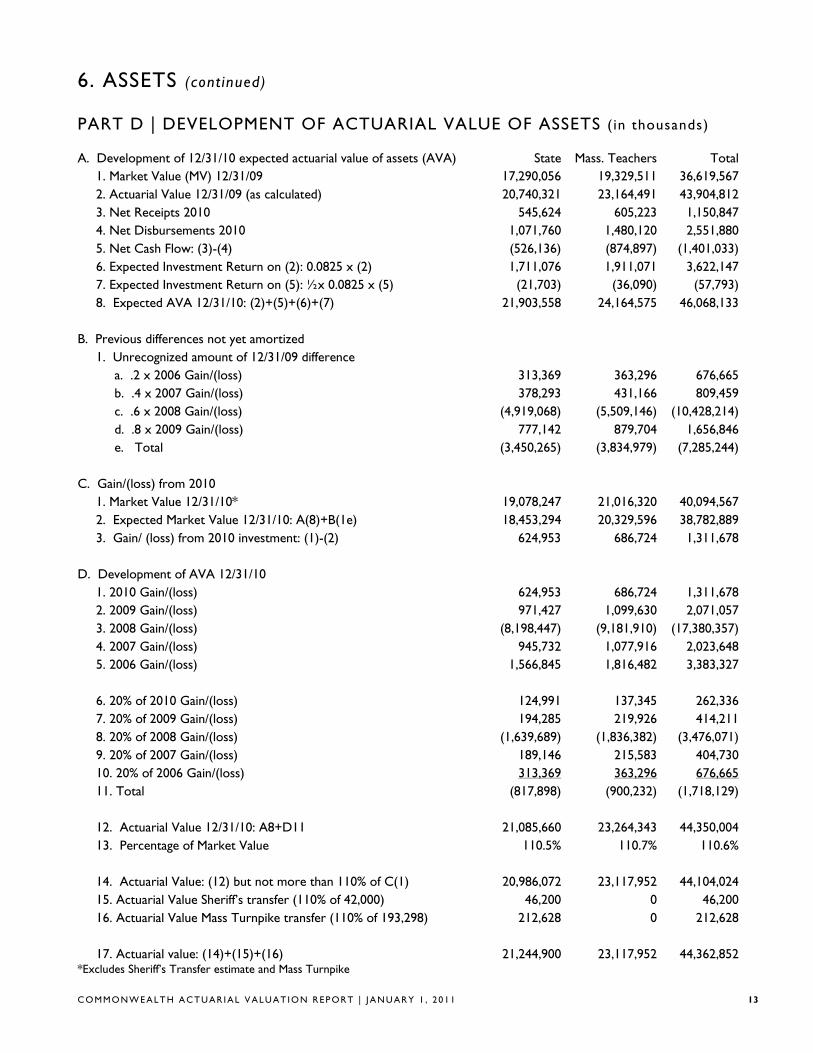
6. ASSETS (cont inued) PART D | DEVELOPMENT OF ACTUARIAL VALUE OF ASSETS ( in thousands)
A. Development of 12/31/10 expected actuarial value of assets (AVA) State Mass. Teachers Total 1. Market Value (MV) 12/31/09 17,290,056 19,329,511 36,619,567 2. Actuarial Value 12/31/09 (as calculated) 20,740,321 23,164,491 43,904,812 3. Net Receipts 2010 545,624 605,223 1,150,847 4. Net Disbursements 2010 1,071,760 1,480,120 2,551,880 5. Net Cash Flow: (3)-(4) (526,136) (874,897) (1,401,033) 6. Expected Investment Return on (2): 0.0825 x (2) 1,711,076 1,911,071 3,622,147 7. Expected Investment Return on (5): ½x 0.0825 x (5) (21,703) (36,090) (57,793) 8. Expected AVA 12/31/10: (2)+(5)+(6)+(7) 21,903,558 24,164,575 46,068,133 B. Previous differences not yet amortized 1. Unrecognized amount of 12/31/09 difference a. .2 x 2006 Gain/(loss) 313,369 363,296 676,665 b. .4 x 2007 Gain/(loss) 378,293 431,166 809,459 c. .6 x 2008 Gain/(loss) (4,919,068) (5,509,146) (10,428,214) d. .8 x 2009 Gain/(loss) 777,142 879,704 1,656,846 e. Total (3,450,265) (3,834,979) (7,285,244) C. Gain/(loss) from 2010 1. Market Value 12/31/10* 19,078,247 21,016,320 40,094,567 2. Expected Market Value 12/31/10: A(8)+B(1e) 18,453,294 20,329,596 38,782,889 3. Gain/ (loss) from 2010 investment: (1)-(2) 624,953 686,724 1,311,678 D. Development of AVA 12/31/10 1. 2010 Gain/(loss) 624,953 686,724 1,311,678 2. 2009 Gain/(loss) 971,427 1,099,630 2,071,057 3. 2008 Gain/(loss) (8,198,447) (9,181,910) (17,380,357) 4. 2007 Gain/(loss) 945,732 1,077,916 2,023,648 5. 2006 Gain/(loss) 1,566,845 1,816,482 3,383,327 6. 20% of 2010 Gain/(loss) 124,991 137,345 262,336 7. 20% of 2009 Gain/(loss) 194,285 219,926 414,211 8. 20% of 2008 Gain/(loss) (1,639,689) (1,836,382) (3,476,071) 9. 20% of 2007 Gain/(loss) 189,146 215,583 404,730 10. 20% of 2006 Gain/(loss) 313,369 363,296 676,665 11. Total (817,898) (900,232) (1,718,129) 12. Actuarial Value 12/31/10: A8+D11 21,085,660 23,264,343 44,350,004 13. Percentage of Market Value 110.5% 110.7% 110.6% 14. Actuarial Value: (12) but not more than 110% of C(1) 20,986,072 23,117,952 44,104,024 15. Actuarial Value Sheriff’s transfer (110% of 42,000) 46,200 0 46,200 16. Actuarial Value Mass Turnpike transfer (110% of 193,298) 212,628 0 212,628 17. Actuarial value: (14)+(15)+(16) 21,244,900 23,117,952 44,362,852 *Excludes Sheriff’s Transfer estimate and Mass Turnpike

C O MM O NW E A L T H A C T U A R I A L V AL U A T I O N R E P OR T | J A N U A R Y 1 , 2 0 1 1 14
7. SYSTEM MEMBERSHIP
PART A | STATE ACTIVE MEMBERS
A critical element of an actuarial valuation is accurate and up-to-date membership information. As part of this valuation, PERAC analyzed the member data provided by the State Retirement System. Actives Vested Terminations
Number of Members 86,586 3,973
Average Age 47.3 52.6
Average Service 13.3 15.6
Average Salary $55,531 $50,192
Average Annuity Savings Fund Balance
$54,337
$54,576
Age by Service Distribution of Active Members
Years of Service
Present Age
0 – 4 5 -9 10 - 14 15 - 19 20 – 24 25 - 29 30+ Total
0 - 24 1,788 22 1 1,811
25 - 29 5,072 1,075 10 6,157
30 - 34 3,955 2,625 794 7 7,381
35 - 39 2,946 2,222 2,469 671 27 8,335
40 - 44 2,876 2,254 2,570 2,234 1,157 77 1 11,169
45 - 49 2,642 2,047 2,079 1,940 2,636 1,289 113 12,746
50 - 54 2,186 2,024 1,983 1,842 2,328 2,371 1,210 13,944
55 - 59 1,666 1,632 1,736 1,492 1,840 1,968 2,709 13,043
60 - 64 875 1,026 1,143 1,008 1,252 1,262 1,950 8,516
65+ 236 430 512 424 526 492 864 3,484
Total 24,242 15,357 13,297 9,618 9,766 7,459 6,847 86,586

C O MM O NW E A L T H A C T U A R I A L V AL U A T I O N R E P OR T | J A N U A R Y 1 , 2 0 1 1 15
7. SYSTEM MEMBERSHIP (continued)
PART A | STATE ACTIVE MEMBERS (continued)
Salary by Age Distribution of Active Members
Present Age
Number of Members
Total Salary
Average Salary
0 - 24 1,811 $56,769,529 $31,347
25 - 29 6,157 $250,164,344 $40,631
30 - 34 7,381 $347,366,785 $47,062
35 - 39 8,335 $437,434,344 $52,482
40 - 44 11,169 $619,627,361 $55,477
45 - 49 12,746 $724,172,674 $56,816
50 - 54 13,944 $812,162,741 $58,245
55 - 59 13,043 $799,489,881 $61,296
60 - 64 8,516 $538,552,433 $63,240
65+ 3,484 $222,510,194 $63,866
Total 86,586 $4,808,250,285 $55,531

C O MM O NW E A L T H A C T U A R I A L V AL U A T I O N R E P OR T | J A N U A R Y 1 , 2 0 1 1 16
7. SYSTEM MEMBERSHIP (continued)
PART B | STATE RETIREES AND SURVIVORS
Superannuation Ordinary Disability
Accidental Disability
Survivors Total
Number of Members
43,286 653 3,076 6,612 53,627
Average Age 71.9 65.2 62.7 75.3 71.7
Average Annual Benefit
$27,850 $17,482 $34,321 $13,845 $26,363
Benefit by Retirement Type
Superannuation Ordinary Disability
Accidental Disability
Survivors Total
Annuity $206,852,845 $1,651,294 $7,067,564 $13,075,397 $228,647,101
Pension $998,656,646 $9,764,300 $98,226,398 $78,466,002 $1,185,113,346
Total $1,205,509,491 $11,415,594 $105,293,962 $91,541,399 $1,413,760,447

C O MM O NW E A L T H A C T U A R I A L V AL U A T I O N R E P OR T | J A N U A R Y 1 , 2 0 1 1 17
7. SYSTEM MEMBERSHIP (continued)
PART B | STATE RETIREES & SURVIVORS (continued)
Benefit by Age Distribution
Present Age Number of Members
Total Benefits Average Benefits
Less than 40 135 $3,328,991 $24,659
40 – 44 422 $13,298,190 $31,512
45 – 49 947 $28,549,716 $30,148
50 – 54 1,700 $48,805,472 $28,709
55 – 59 3,856 $105,782,803 $27,433
60 – 64 8,372 $260,481,389 $31,113
65 – 69 9,499 $294,033,049 $30,954
70 – 74 7,888 $224,168,736 $28,419
75 – 79 7,267 $179,937,902 $24,761
80 – 84 6,472 $140,001,615 $21,632
85 – 89 4,616 $81,998,685 $17,764
90+ 2,453 $33,373,899 $13,605
Totals 53,627 $1,413,760,447 $26,363

C O MM O NW E A L T H A C T U A R I A L V AL U A T I O N R E P OR T | J A N U A R Y 1 , 2 0 1 1 18
7. SYSTEM MEMBERSHIP (continued)
PART C | MASSACHUSETTS TEACHERS’ ACTIVE MEMBERS
A critical element of an actuarial valuation is accurate and up-to-date membership information. As part of this valuation, PERAC analyzed the member data provided by the Massachusetts Teachers’ Retirement System (TRS). We made several assumptions about missing, questionable, or unavailable data. Until the January 1, 2006 actuarial valuation, we had estimated the total creditable service for each member for the actuarial valuation. The estimate was based on either the employment date (date of hire as a teacher) or the adjusted employment date and was set equal to the greater of the two calculated service amounts. We used this methodology, which we believed was conservative, because we had no way to assess additional costs for members who buy back service near retirement. Several years ago, with the help of the TRS, we compared the service estimated for valuation purposes with actual service for over 6,800 members who retired in 2004 and 2005. We found that, in total, our methodology slightly understated service. To better reflect this cost, we adjusted our normal cost and liability figures as of January 1, 2006 and have again with this valuation. We increased plan liabilities by 1% based on our analysis. For members with a date of birth and/or date of hire that seemed questionable, we assumed (based on credited service or date of birth) the member was hired at age 30 (or at a younger age, if the member was under 30). Based on our experience with prior years’ data, buyback issues, and questions to TRS regarding specific members, we made several adjustments. Members whose pay was less than $3,000 were assumed to be inactive. For members with pay between $3,000 and $10,000, we used an estimated pay of $50,000. For members with submitted pay over $150,000, we compared this year’s figure to the pay used in last year’s valuation. We adjusted this year’s figure based on the amount contributed if we believed it was overstated. Pay for all members hired in 2010 was annualized. We assumed a rate of pay of $50,000 for members hired after October 1. This year there were a number of districts that submitted only partial year information. TRS provided a list showing those departments and the number of months actually provided in the data so we could annualize this information appropriately. In addition, the data for approximately 4000 members with a reported status date in 2010 is not consistent. In some cases reported pay is overstated and in others it is understated. We reviewed over 100 members with TRS and could draw no definitive conclusions. To provide a conservative estimate of the salary for members in both circumstances, we increased plan liabilities by an additional 1% in this valuation. Because we could not determine the number of vested terminations, we estimated a combined inactive (terminated vested plus terminated with an ASF balance) liability. This is the same methodology we have used in prior valuations.

C O MM O NW E A L T H A C T U A R I A L V AL U A T I O N R E P OR T | J A N U A R Y 1 , 2 0 1 1 19
7. SYSTEM MEMBERSHIP (continued)
PART C | MASSACHUSETTS TEACHERS’ ACTIVE MEMBERS (cont inued) Actives
Number of Members 87,136
Average Age 44.3
Average Service 12.9
Average Salary $63,789
Average Annuity Savings Fund Balance
$57,337
Age by Service Distribution of Active Members
Years of Service
Present Age
0 – 4 5 -9 10 - 14 15 - 19 20 – 24 25 - 29 30+ Total
0 - 24 1,471 1,471
25 - 29 7,120 1,980 2 9,102
30 - 34 5,635 6,283 1,398 13,316
35 - 39 1,740 3,240 5,014 883 2 10,879
40 - 44 1,785 2,268 3,459 3,019 488 1 11,020
45 - 49 1,524 2,190 2,111 1,572 2,006 457 1 9,861
50 - 54 1,094 1,978 2,317 1,377 1,640 1,779 871 11,056
55 - 59 690 1,374 2,051 1,533 1,499 1,193 4,612 12,952
60 - 64 208 587 908 815 970 470 2,408 6,366
65+ 24 111 175 116 161 76 450 1,113
Total 21,291 20,011 17,435 9,315 6,766 3,976 8,342 87,136

C O MM O NW E A L T H A C T U A R I A L V AL U A T I O N R E P OR T | J A N U A R Y 1 , 2 0 1 1 20
7. SYSTEM MEMBERSHIP (continued)
PART C | MASSACHUSETTS TEACHERS’ ACTIVE MEMBERS (continued)
Salary by Age Distribution of Active Members
Present Age
Number of Members
Total Salary
Average Salary
0 - 24 1,471 $62,237,453 $42,310
25 - 29 9,102 $443,701,859 $48,748
30 - 34 13,316 $736,238,568 $55,290
35 - 39 10,879 $695,101,181 $63,894
40 - 44 11,020 $724,062,442 $65,704
45 - 49 9,861 $652,981,401 $66,219
50 - 54 11,056 $759,710,024 $68,715
55 - 59 12,952 $932,248,376 $71,977
60 - 64 6,366 $469,136,381 $73,694
65+ 1,113 $82,893,660 $74,478
Total 87,136 $5,558,311,345 $63,789

C O MM O NW E A L T H A C T U A R I A L V AL U A T I O N R E P OR T | J A N U A R Y 1 , 2 0 1 1 21
7. SYSTEM MEMBERSHIP (continued)
PART D | MASSACHUSETTS TEACHERS’ RETIREES AND SURVIVORS
Superannuation Ordinary Disability
Accidental Disability
Survivors Total
Number of Members
51,363 424 313 3,590 55,690
Average Age 70.1 67.4 69.3 72.3 70.2
Average Annual Benefit
$39,888 $19,401 $35,223 $18,186 $38,307
Benefit by Retirement Type
Superannuation Ordinary Disability
Accidental Disability
Survivors Total
Annuity $320,785,862 $840,544 $537,008 $5,431,986 $327,595,400
Pension $1,727,964,761 $7,385,637 $10,487,836 $59,856,580 $1,805,694,814
Total $2,048,750,623 $8,226,181 $11,024,844 $65,288,566 $2,133,290,214

C O MM O NW E A L T H A C T U A R I A L V AL U A T I O N R E P OR T | J A N U A R Y 1 , 2 0 1 1 22
7. SYSTEM MEMBERSHIP (continued)
PART D | MASSACHUSETTS TEACHERS’ RETIREES & SURVIVORS (continued)
Benefit by Age Distribution
Present Age Number of Members
Total Benefits Average Benefits
Less than 40 96 $2,288,473 $23,838
40 – 44 44 $648,061 $14,729
45 – 49 75 $1,348,708 $17,983
50 – 54 182 $3,842,969 $21,115
55 – 59 3,814 $172,083,949 $45,119
60 – 64 15,317 $719,713,208 $46,988
65 – 69 12,861 $547,716,138 $42,587
70 – 74 7,945 $285,895,158 $35,984
75 – 79 6,296 $195,103,980 $30,989
80 – 84 4,734 $120,458,639 $25,445
85 – 89 2,716 $56,539,043 $20,817
90+ 1,610 $27,651,888 $17,175
Totals 55,690 $2,133,290,214 $38,307

C O MM O NW E A L T H A C T U A R I A L V AL U A T I O N R E P OR T | J A N U A R Y 1 , 2 0 1 1 23
7. SYSTEM MEMBERSHIP (continued)
PART E | BOSTON TEACHERS’ ACTIVE MEMBERS
A critical element of an actuarial valuation is accurate and up-to-date membership information. As part of this valuation, PERAC analyzed the member data provided by the Boston Retirement System. Actives Vested Terminations
Number of Members 5,617 169
Average Age 43.4 50.1
Average Service 12.5 21.8
Average Salary $79,297 $66,239
Average Annuity Savings Fund Balance
$70,524 $65,727
Age by Service Distribution of Active Members
Years of Service
Present Age
0 – 4 5 –9 10 – 14 15 - 19 20 - 24 25 – 29 30+ Total
0 - 24 138 138
25 - 29 599 113 2 714
30 - 34 376 433 87 6 902
35 - 39 187 249 272 50 7 765
40 - 44 92 131 174 183 57 8 645
45 - 49 69 92 100 96 138 42 537
50 - 54 62 70 98 97 141 126 38 632
55 - 59 40 62 99 93 141 137 206 778
60 - 64 21 28 46 61 72 70 106 404
65+ 1 7 8 15 18 18 35 102
Total 1,585 1,185 886 601 574 401 385 5,617

C O MM O NW E A L T H A C T U A R I A L V AL U A T I O N R E P OR T | J A N U A R Y 1 , 2 0 1 1 24
7. SYSTEM MEMBERSHIP (continued)
PART E | BOSTON TEACHERS’ ACTIVE MEMBERS (continued)
Salary by Age Distribution of Active Members
Present Age
Number of Members
Total Salary
Average Salary
0 - 24 138 $7,530,105 $54,566
25 - 29 714 $43,923,122 $61,517
30 - 34 902 $64,706,698 $71,737
35 - 39 765 $59,949,736 $78,366
40 - 44 645 $53,468,940 $82,898
45 - 49 537 $44,786,697 $83,402
50 - 54 632 $54,635,862 $86,449
55 - 59 778 $70,052,157 $90,041
60 - 64 404 $37,240,343 $92,179
65+ 102 $9,120,265 $89,414
Total 5,617 $445,413,925 $79,297

C O MM O NW E A L T H A C T U A R I A L V AL U A T I O N R E P OR T | J A N U A R Y 1 , 2 0 1 1 25
7. SYSTEM MEMBERSHIP (continued)
PART F | BOSTON TEACHERS’ RETIREES AND SURVIVORS
Superannuation Ordinary Disability
Accidental Disability
Survivors Total
Number of Members
3,657 41 71 306 4,075
Average Age 70.5 66.6 70.5 73.2 70.6
Average Annual Benefit
$46,598 $21,574 $38,947 $20,978 $44,289
Benefit by Retirement Type Superannuation Ordinary
DisabilityAccidental Disability
Survivors Total
Annuity $30,479,704 $150,691 $250,489 $1,228,211 $32,109,095
Pension $139,930,040 $733,847 $2,514,776 $5,191,090 $148,369,753
Total $170,409,744 $884,538 $2,765,265 $6,419,301 $180,478,848

C O MM O NW E A L T H A C T U A R I A L V AL U A T I O N R E P OR T | J A N U A R Y 1 , 2 0 1 1 26
7. SYSTEM MEMBERSHIP (continued)
PART F | BOSTON TEACHERS’ RETIREES & SURVIVORS (continued)
Benefit by Age Distribution
Present Age Number of Members
Total Benefits Average Benefits
Less than 40 5 $73,935 $14,787
40 - 44 2 $15,207 $7,604
45 - 49 9 $206,391 $22,932
50 - 54 16 $429,129 $26,821
55 - 59 268 $13,294,034 $49,605
60 - 64 1,063 $58,740,429 $55,259
65 - 69 951 $46,395,039 $48,786
70 - 74 590 $24,773,778 $41,989
75 - 79 416 $15,180,270 $36,491
80 - 84 396 $12,669,634 $31,994
85 - 89 219 $5,714,009 $26,091
90+ 140 $2,986,993 $21,336
Totals 4,075 $180,478,848 $44,289

C O MM O NW E A L T H A C T U A R I A L V AL U A T I O N R E P OR T | J A N U A R Y 1 , 2 0 1 1 27
8. VALUATION COST METHODS
PART A | ACTUARIAL COST METHOD
The Actuarial Cost Method which was used to determine pension liabilities in this valuation is known as the Entry Age Normal Cost Method. Under this method, the Normal Cost for each active member on the valuation date is determined as the level percent of salary, which, if paid annually from the date the employee first became a retirement system member, would fully fund by retirement, death, disability or termination, the projected benefits which the member is expected to receive. The Actuarial Liability for each member is determined as the present value as of the valuation date of all projected benefits which the member is expected to receive, minus the present value of future annual Normal Cost payments expected to be made to the fund. Since only active members have a Normal Cost, the Actuarial Liability for inactives, retirees, and survivors is simply equal to the present value of all projected benefits. The Unfunded Actuarial Liability is the Actuarial Liability less current assets.
The Normal Cost for a member will remain a level percent of salary for each year of membership, except for changes in provisions of the plan or the actuarial assumptions employed in projection of benefits and present value determinations. The Normal Cost for the entire system will also be changed by the addition of new members or the retirement, death, disability, or termination of members. The Actuarial Liability for a member will increase each year to reflect the additional accrual of Normal Cost. It will also change if the plan provisions or actuarial assumptions change.
Differences each year between the actual experience of the plan and the experience projected by the actuarial assumptions are reflected by adjustments to the Unfunded Actuarial Liability. An experience difference which increases the Unfunded Actuarial Liability is an Actuarial Loss and one which decreases the Unfunded Actuarial Liability is an Actuarial Gain.
PART B | ASSET VALUATION METHOD The actuarial value of assets is determined in accordance with the deferred recognition method under which 20% of the gains or losses occurring in the prior year are recognized, 40% of those occurring 2 years ago, etc., so that 100% of gains and losses occurring 5 years ago are recognized. The actuarial value of assets will be adjusted, if necessary, in order to remain between 90% and 110% of market value. In valuations prior to 1998, plan assets were determined at market value. As part of the 1998 valuation, this methodology was adjusted to reduce the potential volatility in the market value approach from year to year. The actuarial value of assets as of January 1, 2010 is 110% of the market value.

C O MM O NW E A L T H A C T U A R I A L V AL U A T I O N R E P OR T | J A N U A R Y 1 , 2 0 1 1 28
9. ACTUARIAL ASSUMPTIONS INVESTMENT RETURN
8.25% per year
INTEREST RATE CREDITED TO THE ANNUITY SAVINGS FUND
3.5% per year
COST OF LIVING INCREASES (COLA)
3% per year
MORTALITY Pre-retirement mortality reflects RP-2000 Employees table projected 10 years with Scale AA (gender distinct). Post-retirement mortality reflects RP-2000 Healthy Annuitant table projected 10 years with scale AA (gender distinct). For disabled members, the mortality rate is assumed to be in accordance with the RP-2000 Table (gender distinct) set forward 3 years for males. It is assumed that 55% of pre-retirement deaths are job-related for Group 1 and 2 members and 90% are job-related for Group 3 and 4 members. For members retired under an Accidental Disability, 40% of deaths are assumed to be from the same cause as the disability.
SALARY INCREASE Based on an analysis of past experience. Annual rates are shown below.
Service Groups 1& 2 Group 3 Group 4 Teachers 0 8.00% 8.00% 10.00% 8.00% 1 7.50% 8.00% 9.00% 7.75% 2 7.00% 8.00% 8.50% 7.50% 3 6.50% 8.00% 8.00% 7.25% 4 6.25% 7.50% 7.50% 7.00% 5 6.00% 7.00% 7.00% 6.75% 6 5.75% 6.00% 6.50% 6.50% 7 5.50% 5.50% 6.00% 6.25% 8 5.50% 5.50% 5.50% 6.00% 9 5.50% 5.50% 5.50% 5.75% 10 5.25% 5.25% 5.25% 5.50% 11 5.25% 5.25% 5.25% 5.25% 12 5.25% 5.25% 5.25% 5.00% 13 5.00% 5.25% 5.25% 5.00% 14-15 5.00% 5.25% 5.25% 4.75% 16-19 4.75% 5.25% 5.25% 4.75% 20+ 4.50% 5.00% 5.00% 4.75%
C O MM O NW E A L T H A C T U A R I A L V AL U A T I O N R E P OR T | J A N U A R Y 1 , 2 0 1 1 29
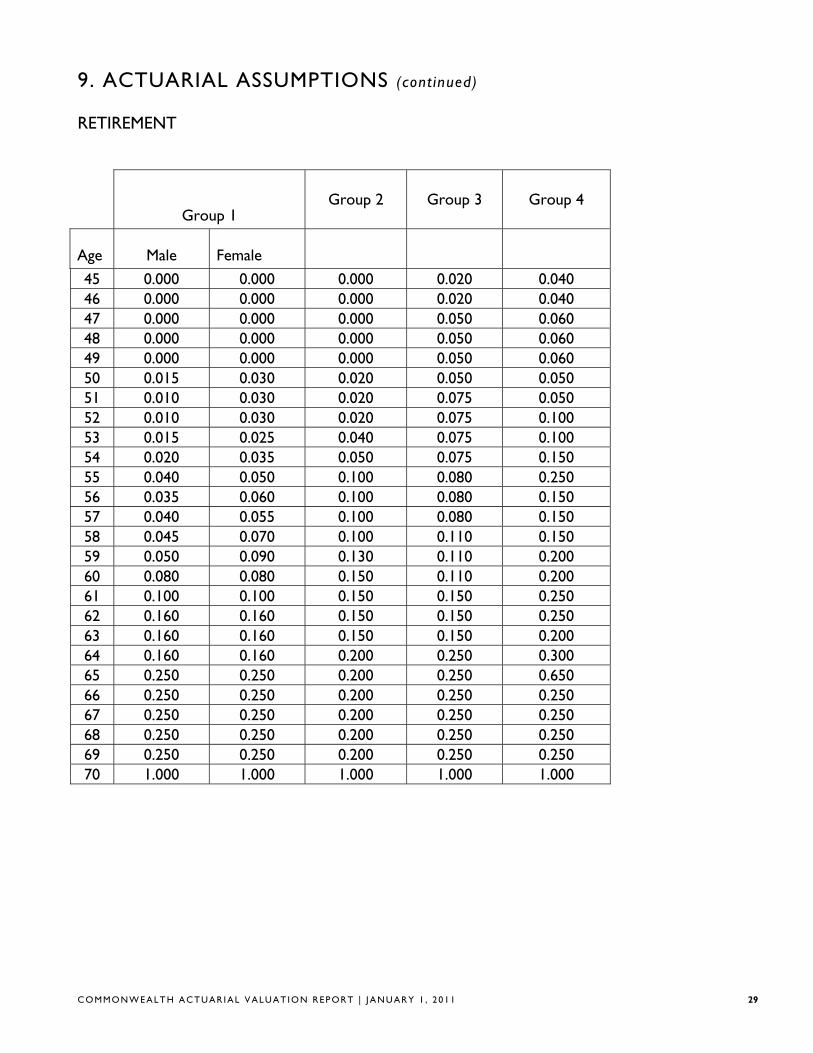
9. ACTUARIAL ASSUMPTIONS (cont inued) RETIREMENT
Group 1
Group 2
Group 3
Group 4
Age Male Female
45 0.000 0.000 0.000 0.020 0.040 46 0.000 0.000 0.000 0.020 0.040 47 0.000 0.000 0.000 0.050 0.060 48 0.000 0.000 0.000 0.050 0.060 49 0.000 0.000 0.000 0.050 0.060 50 0.015 0.030 0.020 0.050 0.050 51 0.010 0.030 0.020 0.075 0.050 52 0.010 0.030 0.020 0.075 0.100 53 0.015 0.025 0.040 0.075 0.100 54 0.020 0.035 0.050 0.075 0.150 55 0.040 0.050 0.100 0.080 0.250 56 0.035 0.060 0.100 0.080 0.150 57 0.040 0.055 0.100 0.080 0.150 58 0.045 0.070 0.100 0.110 0.150 59 0.050 0.090 0.130 0.110 0.200 60 0.080 0.080 0.150 0.110 0.200 61 0.100 0.100 0.150 0.150 0.250 62 0.160 0.160 0.150 0.150 0.250 63 0.160 0.160 0.150 0.150 0.200 64 0.160 0.160 0.200 0.250 0.300 65 0.250 0.250 0.200 0.250 0.650 66 0.250 0.250 0.200 0.250 0.250 67 0.250 0.250 0.200 0.250 0.250 68 0.250 0.250 0.200 0.250 0.250 69 0.250 0.250 0.200 0.250 0.250 70 1.000 1.000 1.000 1.000 1.000

C O MM O NW E A L T H A C T U A R I A L V AL U A T I O N R E P OR T | J A N U A R Y 1 , 2 0 1 1 30
9. ACTUARIAL ASSUMPTIONS (cont inued) Teachers Males
Not in Retirement Plus Retirement Plus Less than 20 20+ Less than 20 20-30 30+
47 0.00 0.00 47 0.00 0.00 0.00 48 0.00 0.00 48 0.00 0.00 0.00 49 0.00 0.00 49 0.00 0.00 0.00 50 0.00 0.02 50 0.00 0.01 0.02 51 0.00 0.02 51 0.00 0.01 0.02 52 0.00 0.02 52 0.00 0.01 0.02 53 0.00 0.02 53 0.00 0.01 0.02 54 0.00 0.02 54 0.00 0.01 0.02 55 0.06 0.05 55 0.03 0.03 0.06 56 0.06 0.05 56 0.08 0.05 0.20 57 0.07 0.05 57 0.15 0.08 0.35 58 0.07 0.06 58 0.15 0.10 0.50 59 0.10 0.07 59 0.20 0.20 0.50 60 0.15 0.20 60 0.15 0.20 0.50 61 0.20 0.35 61 0.30 0.25 0.50 62 0.20 0.35 62 0.20 0.30 0.40 63 0.20 0.35 63 0.30 0.30 0.40 64 0.25 0.35 64 0.40 0.30 0.40 65 0.30 0.40 65 0.40 0.40 0.50 66 0.30 0.30 66 0.40 0.30 0.50 67 0.30 0.30 67 0.40 0.30 0.50 68 0.30 0.30 68 0.40 0.30 0.50 69 0.30 0.30 69 0.40 0.30 0.50
70+ 1.00 1.00 70+ 1.00 1.00 1.00

C O MM O NW E A L T H A C T U A R I A L V AL U A T I O N R E P OR T | J A N U A R Y 1 , 2 0 1 1 31
9. ACTUARIAL ASSUMPTIONS (cont inued) Teachers Females
Not in Retirement Plus Retirement Plus Less than 20 20+ Less than 20 20-30 30+
47 0.00 0.00 47 0.00 0.000 0.00 48 0.00 0.00 48 0.00 0.000 0.00 49 0.00 0.00 49 0.00 0.000 0.00 50 0.00 0.02 50 0.00 0.015 0.02 51 0.00 0.02 51 0.00 0.015 0.02 52 0.00 0.02 52 0.00 0.015 0.02 53 0.00 0.02 53 0.00 0.015 0.02 54 0.00 0.02 54 0.00 0.015 0.02 55 0.06 0.05 55 0.02 0.03 0.06 56 0.06 0.05 56 0.02 0.03 0.15 57 0.07 0.05 57 0.08 0.07 0.30 58 0.07 0.07 58 0.10 0.07 0.35 59 0.10 0.10 59 0.15 0.11 0.35 60 0.15 0.20 60 0.20 0.16 0.35 61 0.20 0.30 61 0.20 0.20 0.35 62 0.20 0.30 62 0.25 0.30 0.40 63 0.20 0.30 63 0.24 0.30 0.30 64 0.25 0.30 64 0.20 0.30 0.35 65 0.30 0.40 65 0.30 0.30 0.35 66 0.30 0.40 66 0.30 0.30 0.35 67 0.30 0.40 67 0.30 0.30 0.30 68 0.30 0.40 68 0.30 0.30 0.30 69 0.30 0.40 69 0.30 0.30 0.30
70+ 1.00 1.00 70+ 1.00 1.00 1.00

C O MM O NW E A L T H A C T U A R I A L V AL U A T I O N R E P OR T | J A N U A R Y 1 , 2 0 1 1 32
9. ACTUARIAL ASSUMPTIONS (continued)
DISABILITY Based on an analysis of past experience. Sample annual rates are shown below.
Age Group 1 Group 2 Group 3 Group 4 Teachers 20 0.00010 0.00060 0.0010 0.0020 0.00004 30 0.00010 0.00080 0.0016 0.0040 0.00006 40 0.00075 0.00166 0.0080 0.0070 0.00010 50 0.00140 0.00425 0.0140 0.0100 0.00050 60 0.00200 0.00550 0.0300 0.0080 0.00100
It is assumed that 75% of disabilities will be job-related for Group 1 and 2 members (other than Teachers), 95% will be job-related for Group 3 and 4 members, and 35% will be job-related for Teachers.
WITHDRAWAL Based on an analysis of past experience. For Groups 1 and 2, rates are both age and service based for service up to 10 years. After 10 years of service, rates are age based. In addition to being age and service based, Teacher rates are also gender based. For Groups 3 and 4, rates are service based. Sample annual rates are shown below. Groups 1 & 2
Age Service 0 5 10+
20 0.270 0.000 0.000 30 0.230 0.100 0.055 40 0.160 0.080 0.040 50 0.140 0.060 0.030
Service Group 3 Group 4 0 0.008 0.080 5 0.008 0.045 10 0.006 0.030 15 0.006 0.025
20+ 0.006 0.040

C O MM O NW E A L T H A C T U A R I A L V AL U A T I O N R E P OR T | J A N U A R Y 1 , 2 0 1 1 33
9. ACTUARIAL ASSUMPTIONS (continued) Teachers
Age Service 0 5 10+
Male Female Male Female Male Female 20 0.120 0.100 0.045 0.090 0.010 0.050 30 0.114 0.120 0.045 0.090 0.010 0.050 40 0.097 0.110 0.054 0.065 0.017 0.029 50 0.100 0.082 0.048 0.042 0.022 0.021
ADMINISTRATIVE EXPENSES An amount of $2 million has been included in the normal cost for Boston Teachers to reflect its share of the implementation of a computer system at the Boston Retirement Board. We expect to make an expense adjustment for the State and Teachers’ Systems in future valuations to reflect administrative and other expenses paid by the fund.

C O MM O NW E A L T H A C T U A R I A L V AL U A T I O N R E P OR T | J A N U A R Y 1 , 2 0 1 1 34
10. SUMMARY OF PLAN PROVISIONS
ADMINISTRATION There are 105 contributory retirement systems for public employees in Massachusetts. Each system is governed by a retirement board and all boards, although operating independently, are governed by Chapter 32 of the Massachusetts General Laws. This law establishes benefits, contribution requirements, and an accounting and funds structure for all systems.
MEMBERSHIP Membership is mandatory for nearly all full-time employees. Eligibility with respect to part-time, provisional, temporary, seasonal, or intermittent employment is governed by regulations promulgated by each retirement board, and approved by PERAC. Membership is optional for certain elected officials. There are 4 classes of membership in the Commonwealth: Group 1: General employees, including clerical, administrative, technical, and all other employees not otherwise classified. Group 2: Certain specified hazardous duty positions. Group 3: State police officers and inspectors Group 4: Police officers, firefighters, corrections officers, and other specified hazardous positions.
MEMBER CONTRIBUTIONS Member contributions vary depending on the most recent date of membership:
Date of Membership Contribution Rate Prior to 1975: 5% of regular compensation 1975 - 1983: 7% of regular compensation 1984 to 6/30/96: 8% of regular compensation 7/1/96 to present: 9% of regular compensation 7/1/96 to present: 12% of regular compensation (State Police) 7/1/01 to present: 11% of regular compensation (for teachers hired after 7/1/01 and
those accepting provisions of Chapter 114 of the Acts of 2000) 1979 to present: an additional 2% of regular compensation in excess of $30,000.
RATE OF INTEREST Interest on regular deductions made after January 1, 1984 is at a rate established by PERAC in consultation with the Commissioner of Banks. The rate is obtained from the average

C O MM O NW E A L T H A C T U A R I A L V AL U A T I O N R E P OR T | J A N U A R Y 1 , 2 0 1 1 35
10. SUMMARY OF PLAN PROVISIONS (cont inued) rates paid on individual savings accounts by a representative sample of at least 10 financial institutions.
RETIREMENT AGE There is no mandatory retirement age for employees in Groups 1 and 2. Most Group 4 members must retire at age 65. As the result of a federal court decision, there is no mandatory retirement age for Group 3 members.
SUPERANNUATION RETIREMENT A member is eligible for a superannuation retirement allowance (service retirement) upon meeting the following conditions: • completion of 20 years of service, or • attainment of age 55 if hired prior to 1978, or if classified in Group 4, or • attainment of age 55 with 10 years of service, if hired after 1978, and if classified in Group 1 or 2
AMOUNT OF BENEFIT A member’s annual allowance is determined by multiplying the member’s average salary by a benefit rate related to the member’s age and job classification at retirement, and the resulting product by his creditable service. The amount determined by the benefit formula cannot exceed 80% of the average salary. For veterans as defined in G.L. c. 32, s. 1, there is an additional benefit of $15 per year for each year of creditable service, up to a maximum of $300. • Salary is defined as gross regular compensation. • Average Salary is the average annual rate of regular compensation received during the 3 consecutive years that produce the highest average, or, if greater, during the last three years (whether or not consecutive) preceding retirement. • The Benefit Rate varies with the member’s retirement age, but the highest rate of 2.5% applies to Group 1 employees who retire at or after age 65, Group 2 employees who retire at or after age 60, and to Group 4 employees who retire at or after age 55. A .1% reduction is applied for each year of age under the maximum age for the member’s group. For Group 2 employees who terminate from service under age 55, the benefit rate for a Group 1 employee shall be used. • For a teacher who is subject to the provisions of Chapter 114 of the Acts of 2000 and who has completed at least 30 years of creditable service, the benefit rate is multiplied by the creditable service and the resulting percentage is increased by 2% per year for

C O MM O NW E A L T H A C T U A R I A L V AL U A T I O N R E P OR T | J A N U A R Y 1 , 2 0 1 1 36
10. SUMMARY OF PLAN PROVISIONS (continued) each year of service in excess of 24. The amount determined cannot exceed 80% of the average salary.
• For Group 3 members, the rate is 3% for any age.
DEFERRED VESTED BENEFIT A participant who has completed 10 or more years of creditable service is eligible for a deferred vested retirement benefit. Elected officials and others who were hired prior to 1978 may be vested after 6 years in accordance with G.L. c. 32, s. 10. The participant’s accrued benefit is payable commencing at age 55, or the completion of 20 years, or may be deferred until later at the participant’s option.
WITHDRAWAL OF CONTRIBUTIONS Member contributions may be withdrawn upon termination of employment. Employees who first become members on or after January 1, 1984, may receive only limited interest on their contributions if they voluntarily terminate their service. Those who leave service with less than 5 years receive no interest; those who leave service with greater than 5 but less than 10 years receive 50% of the interest credited.
ORDINARY DISABILITY Eligibility: Non-veterans who become permanently incapacitated from the essential duties of their positions by reason of a non-job related condition with at least 10 years of creditable service (or 15 years creditable service in systems in which the local option contained in G.L. c. 32, s.6(1) has not been adopted). Veterans with ten years of creditable service who become permanently incapacitated from the essential duties of their positions by reason of a non-job related condition prior to reaching “maximum age”. Retirement Allowance: Equal to the accrued superannuation retirement benefit as if the member was age 55. If the member is a veteran, the benefit is 50% of the member’s final rate of salary during the preceding 12 months, plus an annuity based upon accumulated member contributions plus credited interest. If the member is over age 55, he/she will receive an allowance that is not less than the allowance he/she would have received if retired for superannuation.

C O MM O NW E A L T H A C T U A R I A L V AL U A T I O N R E P OR T | J A N U A R Y 1 , 2 0 1 1 37
10. SUMMARY OF PLAN PROVISIONS (continued)
ACCIDENTAL DISABILITY Eligibility: Applies to members who become permanently incapacitated from the essential duties of the position as a result of a personal injury sustained or hazard undergone while in the performance of duties. There are no minimum age or service requirements. Retirement Allowance: 72% of salary plus an annuity based on accumulated member contributions, with interest. This amount is not to exceed 100% of pay. However, for those who became members in service after January 1, 1988 or who have not been members in service continually since that date, the amount is limited to 75% of pay. There is an additional pension of $729.84 per year, per child who is under 18 at the time of the member’s retirement, with no age limitation if the child is mentally or physically incapacitated from earning. The additional pension may continue up to age 22 for any child who is a full time student at an accredited educational institution.
ACCIDENTAL DEATH Eligibility: Applies to members who die as a result of a work-related injury or if the member was retired for accidental disability and the death was the natural and proximate result of the injury or hazard undergone on account of which such member was retired. Allowance: An immediate payment to a named beneficiary equal to the accumulated deductions at the time of death, plus a pension equal to 72% of current salary and payable to the surviving spouse, dependent children or the dependent parent, plus a supplement of $729.84 per year, per child, payable to the spouse or legal guardian until all dependent children reach age 18 or 22 if a full time student, unless mentally or physically incapacitated. The surviving spouse of a member of a police or fire department or any corrections officer who, under specific and limited circumstances detailed in the statute, suffers an accident and is killed or sustains injuries resulting in his death, may receive a pension equal to the maximum salary for the position held by the member upon his death. In addition, an eligible family member of a firefighter, public prosecutor, police officer or corrections officer killed in the line of duty may receive a one time payment of $100,000 from the State Retirement Board.
C O MM O NW E A L T H A C T U A R I A L V AL U A T I O N R E P OR T | J A N U A R Y 1 , 2 0 1 1 38
10. SUMMARY OF PLAN PROVISIONS (continued)
DEATH AFTER ACCIDENTAL DISABILITY RETIREMENT Effective November 7, 1996, Accidental Disability retirees were allowed to select Option C at retirement and provide a benefit for an eligible survivor. For Accidental Disability retirees prior to November 7, 1996, who could not select Option C, if the member’s death is from a cause unrelated to the condition for which the member received accidental disability benefits, a surviving spouse will receive an annual allowance of $6,000.
DEATH IN ACTIVE SERVICE Eligibility: At least 2 years of service Allowance: An immediate allowance equal to that which would have been payable had the member retired and elected Option C on the day before his or her death. For death occurring prior to the member’s superannuation retirement age, the age 55 benefit rate is used. The minimum annual allowance payable to the surviving spouse of a member-in-service who dies with at least two years of creditable service is $3,000, provided that the member and the spouse were married for at least one year and living together on the member’s date of death. The surviving spouse of such a member-in-service receives an additional allowance equal to the sum of $1,440 per year for the first child and $1,080 per year for each additional child until all dependent children reach age 18 or 22 if full time students, unless mentally or physically incapacitated.
COST OF LIVING Chapter 17 of the Acts of 1997 provides that the first $12,000 of a retiree’s total allowance is subject to an annual cost-of-living adjustment (COLA). Each year PERAC notifies the Massachusetts General Court of the percentage increase in the Consumer Price Index used for indexing Social Security benefits. This COLA is subject to an annual vote of the Massachusetts General Court, but cannot exceed 3.0%.

C O MM O NW E A L T H A C T U A R I A L V AL U A T I O N R E P OR T | J A N U A R Y 1 , 2 0 1 1 39
10. SUMMARY OF PLAN PROVISIONS (continued)
METHODS OF PAYMENT A member may elect to receive his or her retirement allowance in one of 3 forms of payment. Option A: Total annual allowance, payable in monthly installments, commencing at retirement and terminating at the member’s death. Option B: A reduced annual allowance, payable in monthly installments, commencing at retirement and terminating at the death of the member, provided, however, that if the total amount of the annuity portion received by the member is less than the amount of his or her accumulated deductions, including interest, the difference or balance of his accumulated deductions will be paid in a lump sum to the retiree’s beneficiary or beneficiaries of choice. Option C: A reduced annual allowance, payable in monthly installments, commencing at retirement. At the death of the retired employee, 2/3 of the allowance is payable to the member’s designated beneficiary (who may be the spouse, or former spouse who remains unmarried for a member whose retirement becomes effective on or after February 2, 1992, child, parent, sister, or brother of the employee) for the life of the beneficiary. For members who retired on or after January 12, 1988, if the beneficiary predeceases the retiree, the benefit payable increases (or “pops up”) based on the factor used to determine the Option C benefit at retirement. For members who retired prior to January 12, 1988, if the System has accepted Section 288 of Chapter 194 of the Acts of 1998 and the beneficiary predeceases the retiree, the benefit payable “pops up” in the same fashion. The Option C became available to accidental disability retirees on November 7, 1996.
ALLOCATION OF PENSION COSTS If a member’s total creditable service was partly earned by employment in more than one retirement system, the cost of the "pension portion" is allocated between the different systems pro rata based on the member’s service within each retirement system.

C O MM O NW E A L T H A C T U A R I A L V AL U A T I O N R E P OR T | J A N U A R Y 1 , 2 0 1 1 40
11. GLOSSARY OF TERMS
ACTUARIAL ACCRUED LIABILITY That portion of the Actuarial Present Value of pension plan benefits which is not provided by future Normal Costs or employee contributions. It is the portion of the Actuarial Present Value attributable to service rendered as of the Valuation Date.
ACTUARIAL ASSUMPTIONS Assumptions, based upon past experience or standard tables, used to predict the occurrence of future events affecting the amount and duration of pension benefits, such as: mortality, withdrawal, disablement and retirement; changes in compensation; rates of investment earnings and asset appreciation or depreciation; and any other relevant items.
ACTUARIAL COST METHOD (OR FUNDING METHOD) A procedure for allocating the Actuarial Present Value of all past and future pension plan benefits to the Normal Cost and the Actuarial Accrued Liability.
ACTUARIAL GAIN OR LOSS (OR EXPERIENCE GAIN OR LOSS) A measure of the difference between actual experience and that expected based upon the set of Actuarial Assumptions, during the period between two Actuarial Valuation dates. Note: The effect on the Accrued Liability and/or the Normal Cost resulting from changes in the Actuarial Assumptions, the Actuarial Cost Method or pension plan provisions would be described as such, rather than an Actuarial Gain (Loss).
ACTUARIAL PRESENT VALUE The dollar value on the valuation date of all benefits expected to be paid to current members based upon the Actuarial Assumptions and the terms of the Plan.
AMORTIZATION PAYMENT That portion of the pension plan appropriation which represents payments made to pay interest on and reduce the Unfunded Accrued Liability.

C O MM O NW E A L T H A C T U A R I A L V AL U A T I O N R E P OR T | J A N U A R Y 1 , 2 0 1 1 41
11 . GLOSSARY OF TERMS (continued)
ANNUAL STATEMENT The statement submitted to PERAC each year that describes the asset holdings and Fund balances as of December 3l as well as the transactions during the calendar year that affected the financial condition of the retirement system.
ANNUITY RESERVE FUND The fund into which total accumulated deductions, including interest, are transferred at the time a member retires, and from which annuity payments are made.
ANNUITY SAVINGS FUND The fund in which employee contributions plus interest credited are held for active and inactive members.
ASSETS The value of securities held by the plan.
COST OF BENEFITS The estimated payment from the pension system for benefits for the fiscal year.
FUNDING SCHEDULE The schedule, based upon the most recently approved actuarial valuation, which sets forth the amount which would be appropriated to the pension system in accordance with Section 22C of M.G.L. Chapter 32.
GASB Governmental Accounting Standards Board

C O MM O NW E A L T H A C T U A R I A L V AL U A T I O N R E P OR T | J A N U A R Y 1 , 2 0 1 1 42
11. GLOSSARY OF TERMS (continued)
NORMAL COST Total Normal Cost is that portion of the Actuarial Present Value of pension plan benefits, which is to be paid in a single fiscal year. The Employee Normal Cost is the amount of the expected employee contributions for the fiscal year. The Employer Normal Cost is the difference between the Total Normal Cost and the Employee Normal Cost.
PENSION FUND The fund into which appropriation amounts, as determined by PERAC, are paid and from which pension benefits are paid.
PENSION RESERVE FUND The fund that shall be credited with all amounts set aside by a system for the purpose of establishing a reserve to meet future pension liabilities. These amounts would include excess interest earnings.
SPECIAL FUND FOR MILITARY SERVICE CREDIT The fund that is credited with an amount paid by the retirement board equaling the amount that would have been contributed by a member if the member had remained in active service instead of taking a military leave of absence. In the event of retirement or a non-job related death, such amount is transferred to the Annuity Reserve Fund. In the event of termination prior to retirement or death, such amount shall be transferred to the Pension Fund.
UNFUNDED ACCRUED LIABILITY The excess of the Actuarial Accrued Liability over the Assets.


PERAC Five Middlesex Avenue | Suite 304 Somerville, MA 02145 Ph: 617.666.4446 | Fax: 617.628.4002 TTY: 617.591.8917 | Web: www.mass.gov/perac