Wambo Coal Mine and Rail Spur - Peabody Energy€¦ · Global Acoustics were engaged by Wambo Coal...
45
Wambo Coal Mine and Rail Spur ________________________________________ Environmental Noise Monitoring January 2017 Prepared for Wambo Coal Pty Limited ________________________________________
Transcript of Wambo Coal Mine and Rail Spur - Peabody Energy€¦ · Global Acoustics were engaged by Wambo Coal...

Wambo Coal Mine and RailSpur
________________________________________
Environmental Noise Monitoring
January 2017
Prepared for
Wambo Coal Pty Limited
________________________________________

Wambo Coal Mine and Rail Spur - Environmental Noise Monitoring January 201717014_R01 Page i
Wambo Coal Mine and Rail Spur
Environmental Noise MonitoringJanuary 2017
Reference: 17014_R01
Report date: 31 May 2017
Prepared forWambo Coal Pty Limited
PMB 1
Singleton NSW 2330
Prepared byGlobal Acoustics Pty Ltd
PO Box 3115
Thornton NSW 2322
Prepared: Ronni Maciejowski
Acoustics Technician
QA Review: Katie Weekes
Environmental Scientist (Acoustics)
Global Acoustics Pty Ltd ~ Environmental noise modelling and impact assessment ~ Sound power testing ~ Noise
control advice ~ Noise and vibration monitoring ~ OHS noise monitoring and advice ~ Expert evidence in Land and
Environment and Compensation Courts ~ Architectural acoustics ~ Blasting assessments and monitoring ~ Noise
management plans (NMP) ~ Sound level meter and noise logger sales and hire
Wambo Coal Mine and Rail Spur - Environmental Noise Monitoring January 201717014_R01 Page ii
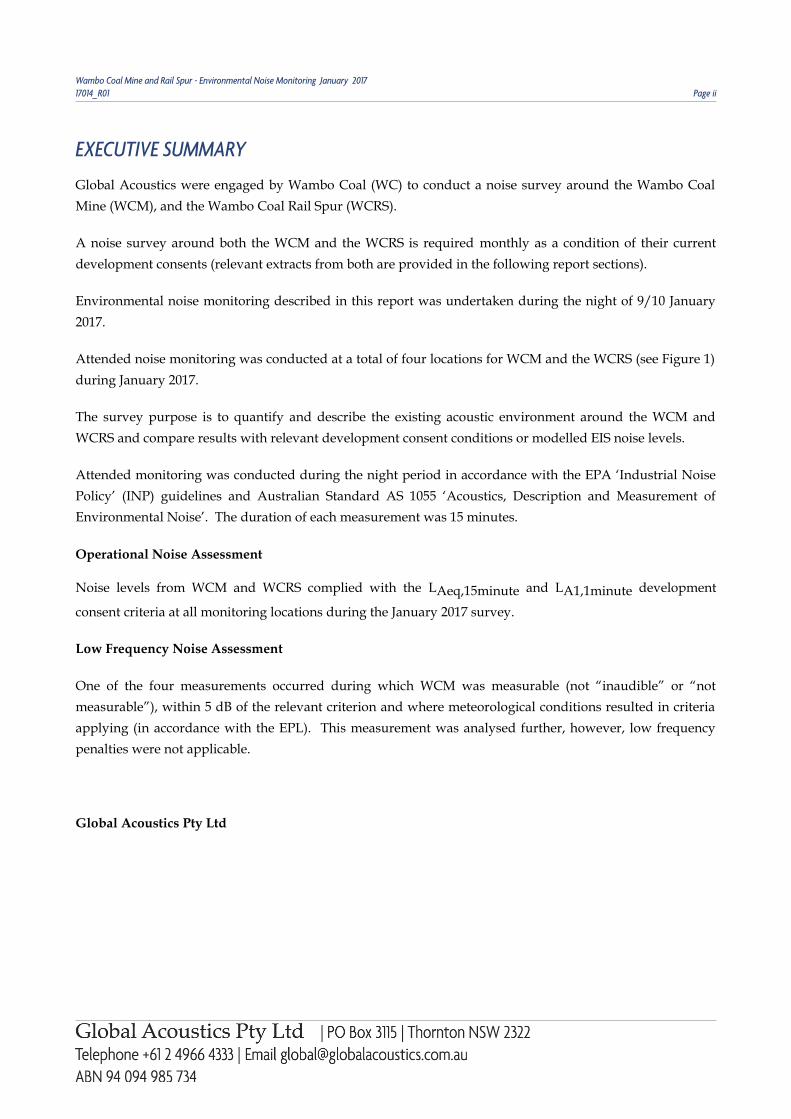
EXECUTIVE SUMMARYGlobal Acoustics were engaged by Wambo Coal (WC) to conduct a noise survey around the Wambo Coal
Mine (WCM), and the Wambo Coal Rail Spur (WCRS).
A noise survey around both the WCM and the WCRS is required monthly as a condition of their current
development consents (relevant extracts from both are provided in the following report sections).
Environmental noise monitoring described in this report was undertaken during the night of 9/10 January
2017.
Attended noise monitoring was conducted at a total of four locations for WCM and the WCRS (see Figure 1)
during January 2017.
The survey purpose is to quantify and describe the existing acoustic environment around the WCM and
WCRS and compare results with relevant development consent conditions or modelled EIS noise levels.
Attended monitoring was conducted during the night period in accordance with the EPA ‘Industrial Noise
Policy’ (INP) guidelines and Australian Standard AS 1055 ‘Acoustics, Description and Measurement of
Environmental Noise’. The duration of each measurement was 15 minutes.
Operational Noise Assessment
Noise levels from WCM and WCRS complied with the LAeq,15minute and LA1,1minute development
consent criteria at all monitoring locations during the January 2017 survey.
Low Frequency Noise Assessment
One of the four measurements occurred during which WCM was measurable (not “inaudible” or “not
measurable”), within 5 dB of the relevant criterion and where meteorological conditions resulted in criteria
applying (in accordance with the EPL). This measurement was analysed further, however, low frequency
penalties were not applicable.
Global Acoustics Pty Ltd
Wambo Coal Mine and Rail Spur - Environmental Noise Monitoring January 201717014_R01 Page iii
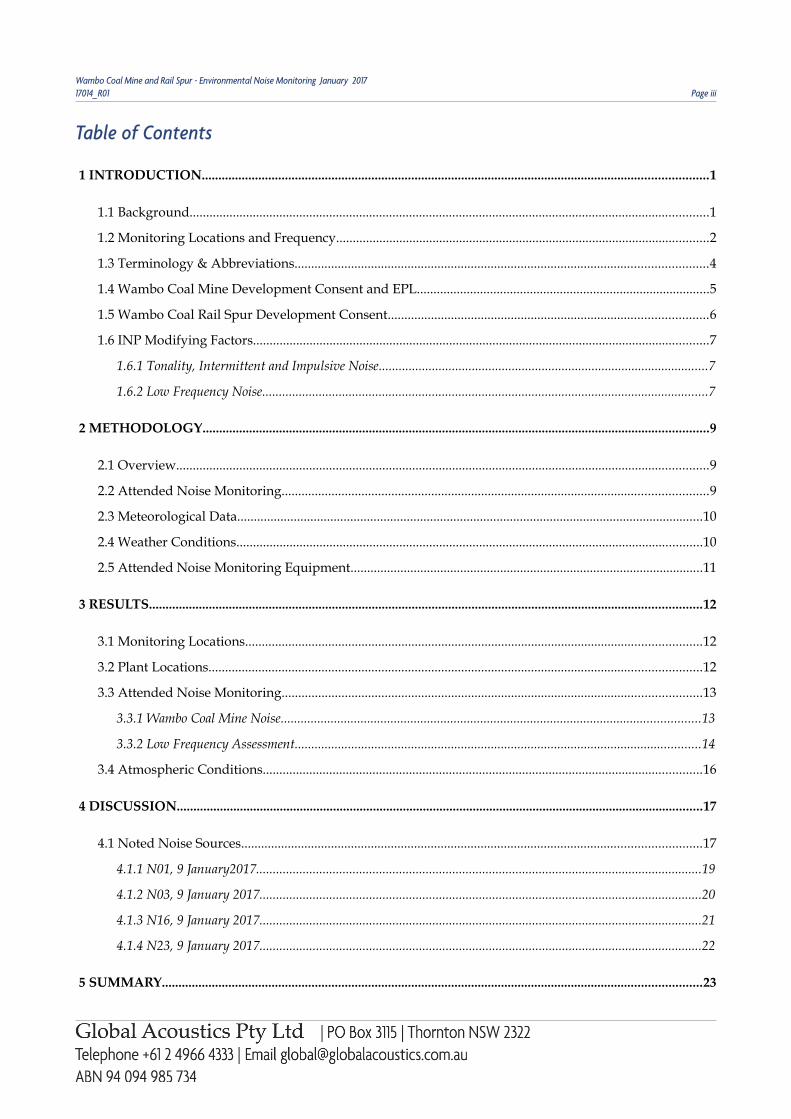
Table of Contents
1 INTRODUCTION........................................................................................................................................................1
1.1 Background............................................................................................................................................................1
1.2 Monitoring Locations and Frequency................................................................................................................2
1.3 Terminology & Abbreviations............................................................................................................................4
1.4 Wambo Coal Mine Development Consent and EPL........................................................................................5
1.5 Wambo Coal Rail Spur Development Consent................................................................................................6
1.6 INP Modifying Factors.........................................................................................................................................7
1.6.1 Tonality, Intermittent and Impulsive Noise...................................................................................................7
1.6.2 Low Frequency Noise......................................................................................................................................7
2 METHODOLOGY........................................................................................................................................................9
2.1 Overview................................................................................................................................................................9
2.2 Attended Noise Monitoring................................................................................................................................9
2.3 Meteorological Data............................................................................................................................................10
2.4 Weather Conditions............................................................................................................................................10
2.5 Attended Noise Monitoring Equipment..........................................................................................................11
3 RESULTS......................................................................................................................................................................12
3.1 Monitoring Locations.........................................................................................................................................12
3.2 Plant Locations....................................................................................................................................................12
3.3 Attended Noise Monitoring..............................................................................................................................13
3.3.1 Wambo Coal Mine Noise..............................................................................................................................13
3.3.2 Low Frequency Assessment..........................................................................................................................14
3.4 Atmospheric Conditions....................................................................................................................................16
4 DISCUSSION..............................................................................................................................................................17
4.1 Noted Noise Sources..........................................................................................................................................17
4.1.1 N01, 9 January2017......................................................................................................................................19
4.1.2 N03, 9 January 2017.....................................................................................................................................20
4.1.3 N16, 9 January 2017.....................................................................................................................................21
4.1.4 N23, 9 January 2017.....................................................................................................................................22
5 SUMMARY..................................................................................................................................................................23

Wambo Coal Mine and Rail Spur - Environmental Noise Monitoring January 201717014_R01 Page iv
5.1 Operational Noise Assessment.........................................................................................................................23
5.2 Low Frequency Assessment..............................................................................................................................23
AppendicesA DEVELOPMENT CONSENT AND EPL................................................................................................................24
B CALIBRATION CERTIFICATES............................................................................................................................34
C METEOROLOGICAL DATA...................................................................................................................................39

Wambo Coal Mine and Rail Spur - Environmental Noise Monitoring January 201717014_R01 Page 1
1 INTRODUCTION
1.1 Background
Global Acoustics were engaged by Wambo Coal (WC) to conduct a noise survey around the Wambo Coal
Mine (WCM), and the Wambo Coal Rail Spur (WCRS). The mine and spur operate under separate
development consents and have been monitored separately. Reporting, however, has been combined in this
document.
Wambo Coal operates both open cut and underground mining operations from their mine at Warkworth,
NSW. The open cut operations include use of heavy mobile equipment in open cut pits, on haul roads and
on waste rock emplacements. The underground operations have surface facilities. Both operations utilise a
coal handling and preparation plant (CHPP) including conveyors, bins and other material-handling
infrastructure.
The WCRS is located between Mt Thorley and Warkworth Village, New South Wales (as shown in Figure 1)
and includes the following components:
• a product coal stockpile and reclaim area, product coal conveyor, train loadout bin, rail loop and a
rail spur from the Wambo Coal Mine to Mount Thorley;
• rail transport of product coal to the market, an intermittent activity that can take place at anytime;
and
• a locomotive refuelling facility.
A noise survey around both the WCM and the WCRS is required monthly as detailed in the Noise
Management Plan (NMP).
Environmental noise monitoring described in this report was undertaken on the night of 9/10 January 2017.
The survey purpose is to quantify and describe the existing acoustic environment around WCM and WCRS
and compare results with relevant limits.

Wambo Coal Mine and Rail Spur - Environmental Noise Monitoring January 201717014_R01 Page 2
1.2 Monitoring Locations and Frequency
Attended noise monitoring was conducted at a total of four locations for WCM and the WCRS. Table 1.1
outlines the monitor type and frequency for the noise monitoring locations shown in Figure 1.
Table 1.1: WAMBO COAL MONITORING LOCATIONS AND FREQUENCY1
Site Reference Site Location2 Monitor Type ConsentRequirements
Frequency
N01 Lambkin Residence Attended Mine DevelopmentConsent
Monthly
N03 Kelly Residence Real-time & Attended Mine and Rail SpurDevelopment Consents
Continuous & Monthly
N16 Muller Residence Real-time & Attended Mine DevelopmentConsent
Continuous & Monthly
N20 Thelander Residence Real-time Mine DevelopmentConsent
Continuous
N21 Wambo SouthResidence
Real-time Mine DevelopmentConsent
Continuous
N23 Redmanvale Road Attended Mine DevelopmentConsent
Monthly
Notes:
1. Sourced from the Wambo Coal Noise Monitoring Plan – EMP008, February 2014; and
2. Monthly attended monitoring locations are shown in italics.

Wambo Coal Mine and Rail Spur - Environmental Noise Monitoring January 201717014_R01 Page 3
Source: Google Maps
Figure 1: WCM Attended Noise Monitoring Locations

Wambo Coal Mine and Rail Spur - Environmental Noise Monitoring January 201717014_R01 Page 4
1.3 Terminology & Abbreviations
Some definitions of terms and abbreviations, which may be used in this report, are provided in Table 1.2.
Table 1.2: TERMINOLOGY & ABBREVIATIONS
Descriptor Definition
LA The A-weighted root mean squared (RMS) noise level at any instant
LAmax The maximum A-weighted noise level over a time period or for an event
LA1 The noise level which is exceeded for 1 per cent of the time
LA10The noise level which is exceeded for 10 percent of the time, which is approximately the
average of the maximum noise levels
LA50 The noise level which is exceeded for 50 per cent of the time
LA90The level exceeded for 90 percent of the time, which is approximately the average of the
minimum noise levels. The LA90 level is often referred to as the “background” noiselevel and is commonly used to determine noise criteria for assessment purposes
LAmin The minimum A-weighted noise level over a time period or for an event
LAeq The average noise energy during a measurement period
dB(A)Noise level measurement units are decibels (dB). The “A” weighting scale is used to
describe human response to noise
SPLSound pressure level (SPL), fluctuations in pressure measured as 10 times a logarithmic
scale, the reference pressure being 20 micropascals
SELSound exposure level (SEL), the A-weighted noise energy during a measurement period
normalised to one second
Hertz (Hz)Cycles per second, the frequency of fluctuations in pressure, sound is usually a
combination of many frequencies together
VTGVertical temperature gradient in degrees Celsius per 100 metres altitude. Estimated from
wind speed and sigma theta data
SC Stability Class. Estimated from wind speed and sigma theta data
Day This is the period 7:00am to 6:00pm
Evening This is the period 6:00pm to 10:00pm
Night This is the period 10:00pm to 7:00am

Wambo Coal Mine and Rail Spur - Environmental Noise Monitoring January 201717014_R01 Page 5
1.4 Wambo Coal Mine Development Consent and EPL
WCM was granted consent (DA 305-7-2003) in February 2004, which enables the extension of current open
cut and underground mining operations. The latest modification to this consent was approved in October
2016. The relevant sections of this modification are reproduced in Appendix A.
The Wambo Coal Environmental Management System, Noise Management Plan (EMP008, February 2014) was
prepared in accordance with Schedule 4. The Noise Management Plan (NMP) indicates that monitoring will
be conducted for WCM activities, and the noise levels to be used for assessment. Monitoring for noise from
mining activities is undertaken at the properties numbered N01, N03, N16 and N23.
It should be noted that properties N01 and N03 are subject to acquisition upon request, as detailed in
Schedule 4, Condition 1 of DA 305-7-2003. As such, there are no operational noise goals that apply directly
to these properties.
Environment protection licence (EPL) number 529 applies to the site and the noise section of the most recent
version is reproduced in Appendix A.
Table 1.3 summarises relevant noise assessment criteria for WCM.
Table 1.3: WCM NOISE CRITERIA
Location Day LAeq,15minute dB
Evening and NightLAeq,15minute dB
Night LA1,1minute dB
N01 2 NA NA NA
N03 2 NA NA NA
N16 1 35 40 50
N23 1 35 38 50
Notes:
1. Criteria from modified development consent DA 305-7-2003; and
2. N01 and N03 are acquisition upon request and criteria are NA ‘not applicable’.
In accordance with the consent and EPL, the noise limits identified in Table 1.3 apply under meteorological
conditions of:
• wind speeds of up to 3 m/s at 10 metres above ground level; or
• temperature inversion conditions of up to 3ºC/100 metres, and wind speeds of up to 2 m/s at
10 metres above ground level.

Wambo Coal Mine and Rail Spur - Environmental Noise Monitoring January 201717014_R01 Page 6
1.5 Wambo Coal Rail Spur Development Consent
The WCRS consists of two Development Applications (DA’s):
• The Wambo Rail Loop (DA 177-8-2004), modified in February 2012 to include a rail refuelling
facility; and
• The Wambo Rail Line (DA 235/97).
The Wambo Coal Environmental Management System, Noise Management Plan (EMP008, February 2014) was
prepared in accordance with Schedule 4. The NMP indicates that monitoring will be conducted for WCRS
activities, and the noise levels to be used for assessment. The relevant section of the consent is reproduced in
Appendix A.
Monitoring for noise from rail activities has previously been undertaken at properties numbered N01, N24
and N25 for rail pass-by noise. Locations N24 and N25 have been removed from the monitoring program
following long-term demonstrated compliance. Monitoring is still undertaken at N01 as part of the mine
consent, however, monitoring of the rail activities is no longer required. As detailed in the NMP, monitoring
at these locations will recommence following any complaints or if there is a change in rolling stock.
It should be noted that properties at N01 are subject to acquisition upon request, as detailed in Schedule 4,
Condition 1 of DA 305-7-2003. As such, there are no operational noise goals that apply directly to this
property.
Quarterly monitoring of the rail loading facility is no longer undertaken at N03, due to a demonstrated
history of compliance. Should anything change with the procedure for refuelling or a resident complaint be
received, further monitoring will be undertaken to determine changes to received noise levels.
Wambo Coal Mine and Rail Spur - Environmental Noise Monitoring January 201717014_R01 Page 7
1.6 INP Modifying Factors
Noise monitoring and reporting is carried out generally in accordance with the Environment Protection
Authority (EPA) 'Industrial Noise Policy' (INP). Chapter 4 of the INP deals specifically with modifying
factors that may apply to industrial noise. The most common modifying factors are addressed in detail
below.
As detailed in L4.3 of the EPL:
The modification factors in Section 4 of the NSW Industrial Noise Policy shall also be applied to the measured
noise levels where applicable.
1.6.1 Tonality, Intermittent and Impulsive Noise
As defined in the Industrial Noise Policy:
Tonal noise contains a prominent frequency and is characterised by a definite pitch.
Impulsive noise has high peaks of short duration and a sequence of such peaks.
Intermittent noise is characterised by the level suddenly dropping to the background noise levels several times
during a measurement, with a noticeable change in noise level of at least 5 dB. Intermittent noise applies to
night-time only.
Years of monitoring have indicated that noise levels from mining operations, particularly those levels
measured at significant distances from the source are relatively continuous. Given this, noise levels from
WCM at the monitoring locations are unlikely to be intermittent. In addition, there is no equipment on site
that is likely to generate tonal or impulsive noise as defined in the INP.
1.6.2 Low Frequency Noise
INP Method
As defined in the Industrial Noise Policy:
Low frequency noise contains major components within the low frequency range (20 Hz to 250 Hz) of the
frequency spectrum.
As detailed in Chapter 4 of the INP, low frequency noise should be assessed by measuring the site only
C- weighted and site only A-weighted level over the same time period. The correction/penalty of 5 dB is
applied if the difference between the two levels is 15 dB or more.

Wambo Coal Mine and Rail Spur - Environmental Noise Monitoring January 201717014_R01 Page 8
Broner Method
Low frequency noise can also be assessed using the method specified in the paper “A Simple Method for Low
Frequency Noise Emission Assessment” (Broner JLFNV Vol29-1 pp1-14 2010). If the site only C-weighted noise
level at a receptor exceeds the relevant modifying factor trigger, a 5 dB penalty (modifying factor) is added
to predicted levels. This method is included to provide a comparison with the INP method.
Low Frequency Assessment Methods
Low frequency assessment methods are detailed in Table 1.4.
Table 1.4: LOW FREQUENCY ASSESSMENT METHODS AND MODIFYING FACTOR TRIGGERS
Method Calculation Method Night Period ModifyingFactor Trigger
Day Period ModifyingFactor Trigger
Broner, 2010 Site only LCeq >60 >65
INP, total Site only LCeq minus site only LAeq >=15 >=15
The EPA is currently undertaking a review of the assessment of low frequency noise. While a Draft
Industrial Noise Guideline (ING) was released in September 2015, low frequency noise results from WCM
have been compared to the assessment methods and modifying factor triggers presented above. The
applicability of these triggers has been considered when applying low frequency modifying factor
corrections.

Wambo Coal Mine and Rail Spur - Environmental Noise Monitoring January 201717014_R01 Page 9
2 METHODOLOGY
2.1 Overview
Noise monitoring was conducted at the nearest residences in accordance with the Environment Protection
Authority (EPA) ‘Industrial Noise Policy’ (INP) guidelines and Australian Standard AS 1055 ‘Acoustics,
Description and Measurement of Environmental Noise’. WCM was in operation for all monitoring.
A measurement of LA1,1minute corresponds to the highest noise level generated for 0.6 second during one
minute. In practical terms this is the highest noise level emitted from the WCM noise source during the
entire measurement period (i.e. the highest level of the worst minute during the 15-minute measurement).
As indicated in the consent conditions, the LA1,1minute measurement should be undertaken at 1 metre from
the dwelling façade and the LAeq,15minute measurement within 30 metres of the dwelling. However, the
direct measurement of noise at 1 metre from the façade is not practical during monitoring for this project. In
most cases, monitoring near the residence is impractical due to barking dogs or issues with obtaining access.
In all cases, measurements for this survey were undertaken at a suitable and representative location.
Weather forecasts of predicted wind speeds and rainfall are always previewed prior to commencement of
monitoring. Approval to undertake monitoring is then sought from our client. This procedure gives the
best chance of monitoring during suitable atmospheric conditions. However, forecasts are computer models
generated for a general area based on a number of atmospheric variables. These models are often generated
12 to 24 hours prior to commencement of monitoring and are only as accurate as the model inputs.
2.2 Attended Noise Monitoring
Attended noise monitoring was conducted at all locations during the night period with the exception of N16,
when monitoring commenced at 21.34. While night period monitoring is the required time to measure the
source of interest, we consider atmospheric conditions during the later stages of the evening period to be the
same as those during the night period and so it is valid to compare results from this measurement to night
period criteria. The duration of all measurements was 15 minutes.
Joel Curran and Jesse Tribby conducted attended monitoring.
Attended monitoring is preferred to the use of loggers when determining compliance with prescribed limits;
it allows an accurate determination of the contribution, if any, to measured noise levels by the source of
interest (in this case WCM).

Wambo Coal Mine and Rail Spur - Environmental Noise Monitoring January 201717014_R01 Page 10
The terms 'Inaudible' (IA) or 'Not Measurable' (NM) may be used in this report. When site noise is noted as
IA, no site noise was audible at the monitoring location. NM indicates that some site noise was audible, but
indeterminate due to one of the following reasons:
• site noise levels were insignificant and unlikely, in many cases, to be even noticed; or
• site noise levels were masked by another relatively loud noise source, but were estimated to be lessthan LAeq 30 dB, which is insignificant in terms of any applicable criterion.
If site noise was NM due to masking but estimated to be significant in relation to a relevant criterion, we
would employ methods as per the Industrial Noise Policy (e.g. measure closer and back calculate) to
determine a value for reporting. All sites noted NM in this report are due to insignificant absolute values.
2.3 Meteorological Data
Meteorological data was obtained from the WCM meteorological station. Atmospheric parameters included
wind speed, wind direction, rainfall and sigma theta. This data allowed correlation of atmospheric
parameters and measured noise levels. Meteorological data was available in 5 minute intervals.
When meteorological data is provided in less than 15-minute intervals, an analysis must be conducted to
determine the meteorological conditions present for the majority of the measurement period and whether
those conditions relate to noise criteria being applicable. In order to accurately compare 5-minute
meteorological data to 15-minute noise level measurement periods, a rolling 15-minute meteorological
interval was produced by converting each 5-minute meteorological interval into an average of the preceding
three 5-minute intervals. The rolling 15-minute meteorological interval which most closely matched the
15-minute noise level measurement period was then adopted as the predominant meteorological conditions
for that measurement period.
Where rolling averages could not be used (such as for VTG and stability class), the predominant condition,
corresponding with the majority of 5-minute meteorological intervals, was adopted.
2.4 Weather Conditions
Weather conditions were recorded at each location during each noise level measurement. Although the
consent is not specific as to where the meteorological data should be sourced, information from WCM has
been used as it is measured with an elevated anemometer as is required by the consent. The anemometer at
WCM is not overly distant from the monitoring locations and is considered to be representative of the
general area. Wind speeds measured at 10 metres above ground are usually higher than those measured
closer to ground level. In accordance with consent conditions, noise criteria only apply in wind speeds up to
3 metres per second.

Wambo Coal Mine and Rail Spur - Environmental Noise Monitoring January 201717014_R01 Page 11
Table 2.1 shows the Beaufort Wind Scale and the corresponding wind speed in metres per second.
Table 2.1: BEAUFORT WIND SCALE
Scale Description Observable Effects Wind Speed km/h
Wind Speed m/s
0 Calm Smoke rises vertically < 1.6 < 0.4
1 Light Air smoke drifts slightly 1.6 – 5 0.4 – 1.4
2 Light breeze Leaves rustle gently 6 – 11 1.7 – 3.1
3 Gentle breeze Leaves and small twigs move 13 – 20 3.6 – 5.6
4 Moderate breeze Small branches move, paper blown around 20 – 30 5.6 – 8.3
5 Fresh breeze Smaller trees sway 30 – 40 8.3 – 11.1
6 Strong breeze Large branches sway 40 – 50 11.1 – 13.9
7 Moderate gale Trees start to sway 50 – 60 13.9 – 16.7
8 Fresh gale Twigs/small branches broken, walkingdifficult
60 – 75 16.7 – 20.8
9 Strong gale Loose exterior fixtures damaged 75 – 85 20.8 – 23.6
10 Whole gale Trees blown down, significant damage 85 – 100 23.6 – 27.8
11 Storm Much damage 100 – 120 27.8
12 Hurricane Major natural disaster 120+ 33.3+
Source: Bush and Alpine Resources.
In Table 2.1, number 2 on the scale is approximately the upper limit for the application of noise criteria
under this consent. As this describes, up to 3 metres per second is a light breeze where leaves rustle gently.
In the Hunter Valley during daytime hours it is unusual (especially during certain months of the year) for
such light breezes to occur, particularly where meteorological stations are situated.
2.5 Attended Noise Monitoring Equipment
Equipment used to measure environmental noise levels are listed in Table 2.2. Calibration certificates are
provided in Appendix B.
Table 2.2: ATTENDED NOISE MONITORING EQUIPMENT
Model Serial Number Calibration Due Date
Rion NA-28 sound level analyser 00370304 16/11/2018
Larson Davis Cal150 acoustic calibrator 3333 30/09/2018
Rion NA-28 sound level analyser 00960042 02/11/2017
Rion NC-73 acoustic calibrator 11248300 25/07/2018

Wambo Coal Mine and Rail Spur - Environmental Noise Monitoring January 201717014_R01 Page 12
3 RESULTS
3.1 Monitoring Locations
There were a total of four attended noise monitoring locations during this survey as listed in Table 3.1 and
shown in Figure 1.
Table 3.1: WCM ATTENDED NOISE MONITORING LOCATIONS
Descriptor Monitoring Location
N01 367 Wambo Road, Bulga
N03 1071 Jerrys Plains Road, Warkworth
N16 Rear of 'Kilburnie', Golden Highway, Jerrys Plains
N23 207 Redmanvale Road, Jerrys Plains
3.2 Plant Locations
During monitoring undertaken on 9/10 January 2017 between 22:00 and 00:00, equipment in operation was
as follows:
• EX215 MP-18-WTAO conventional benching Whynot waste to RL20 inpit dump;
• EX214 ME-03-WMAO double benching Wambo waste to RL160 dump;
• EX213 ME-01-WMAO conventional benching Wambo waste to ME RL120 inpit dump;
• EX212 GM-01-GMAO double benching GM waste to RL150 dump; and
• EX211 MP-23-WRAO conventional benching Rider A waste to RL152 dump.
Wambo Coal Mine and Rail Spur - Environmental Noise Monitoring January 201717014_R01 Page 13
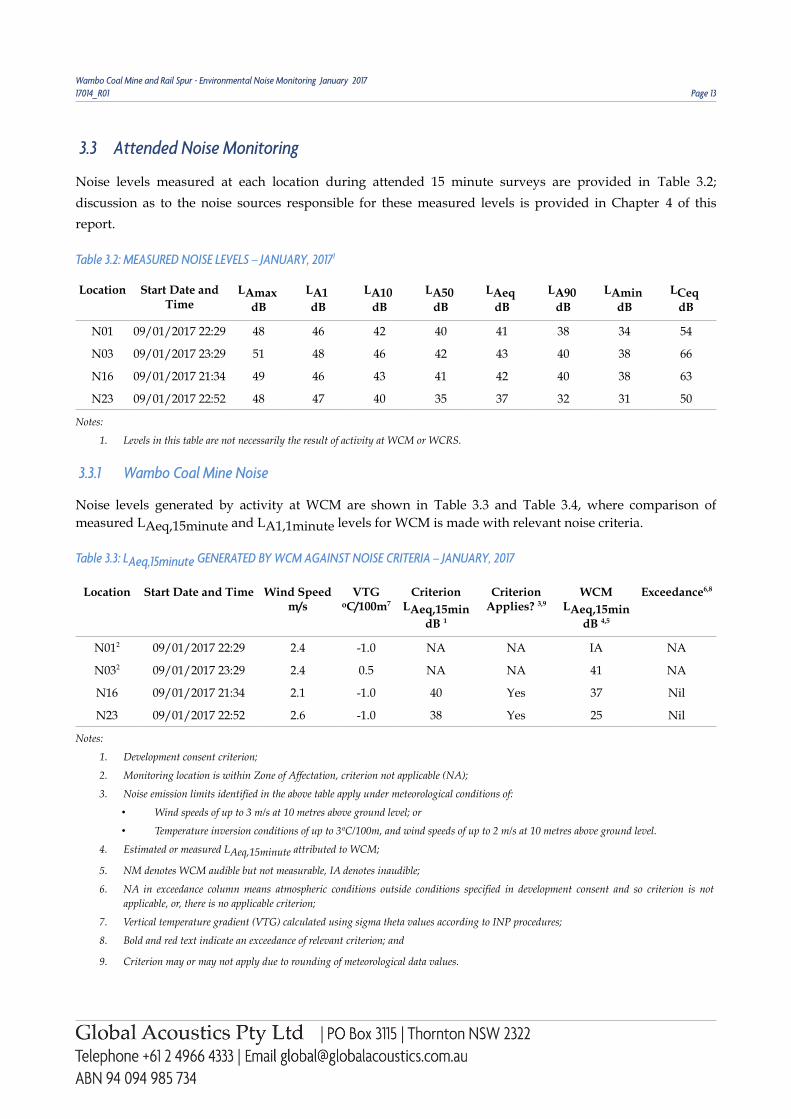
3.3 Attended Noise Monitoring
Noise levels measured at each location during attended 15 minute surveys are provided in Table 3.2;
discussion as to the noise sources responsible for these measured levels is provided in Chapter 4 of this
report.
Table 3.2: MEASURED NOISE LEVELS – JANUARY, 20171
Location Start Date andTime
LAmax dB
LA1 dB
LA10 dB
LA50 dB
LAeq dB
LA90 dB
LAmin dB
LCeq dB
N01 09/01/2017 22:29 48 46 42 40 41 38 34 54
N03 09/01/2017 23:29 51 48 46 42 43 40 38 66
N16 09/01/2017 21:34 49 46 43 41 42 40 38 63
N23 09/01/2017 22:52 48 47 40 35 37 32 31 50
Notes:
1. Levels in this table are not necessarily the result of activity at WCM or WCRS.
3.3.1 Wambo Coal Mine Noise
Noise levels generated by activity at WCM are shown in Table 3.3 and Table 3.4, where comparison ofmeasured LAeq,15minute and LA1,1minute levels for WCM is made with relevant noise criteria.
Table 3.3: LAeq,15minute GENERATED BY WCM AGAINST NOISE CRITERIA – JANUARY, 2017
Location Start Date and Time Wind Speedm/s
VTGoC/100m7
CriterionLAeq,15min
dB 1
CriterionApplies? 3,9
WCMLAeq,15min
dB 4,5
Exceedance6,8
N012 09/01/2017 22:29 2.4 -1.0 NA NA IA NA
N032 09/01/2017 23:29 2.4 0.5 NA NA 41 NA
N16 09/01/2017 21:34 2.1 -1.0 40 Yes 37 Nil
N23 09/01/2017 22:52 2.6 -1.0 38 Yes 25 Nil
Notes:
1. Development consent criterion;
2. Monitoring location is within Zone of Affectation, criterion not applicable (NA);
3. Noise emission limits identified in the above table apply under meteorological conditions of:
• Wind speeds of up to 3 m/s at 10 metres above ground level; or
• Temperature inversion conditions of up to 3ºC/100m, and wind speeds of up to 2 m/s at 10 metres above ground level.
4. Estimated or measured LAeq,15minute attributed to WCM;
5. NM denotes WCM audible but not measurable, IA denotes inaudible;
6. NA in exceedance column means atmospheric conditions outside conditions specified in development consent and so criterion is notapplicable, or, there is no applicable criterion;
7. Vertical temperature gradient (VTG) calculated using sigma theta values according to INP procedures;
8. Bold and red text indicate an exceedance of relevant criterion; and
9. Criterion may or may not apply due to rounding of meteorological data values.

Wambo Coal Mine and Rail Spur - Environmental Noise Monitoring January 201717014_R01 Page 14
Table 3.4: LA1,1minute GENERATED BY WCM AGAINST NOISE CRITERIA – JANUARY, 2017
Location Start Date and Time Wind Speedm/s
VTGoC/100m7
CriterionLA1,1min
dB 1
CriterionApplies? 3,9
WCMLA1,1min
dB 4,5
Exceedance6,8
N012 09/01/2017 22:29 2.4 -1.0 NA NA IA NA
N032 09/01/2017 23:29 2.4 0.5 NA NA 45 NA
N16 09/01/2017 21:34 2.1 -1.0 50 Yes 43 Nil
N23 09/01/2017 22:52 2.6 -1.0 50 Yes 32 Nil
Notes:
1. Development consent criterion;
2. Monitoring location is within Zone of Affectation, criterion not applicable (NA);
3. The noise emission limits identified in the above table apply under meteorological conditions of:
• Wind speeds of up to 3 m/s at 10 metres above ground level; or
• Temperature inversion conditions of up to 3ºC/100m, and wind speeds of up to 2 m/s at 10 metres above ground level.
4. Estimated or measured LA1,1minute attributed to WCM;
5. NM denotes WCM audible but not measurable, IA denotes inaudible;
6. NA in exceedance column means atmospheric conditions outside conditions specified in development consent and so criterion is notapplicable, or, there is no applicable criterion;
7. Vertical temperature gradient (VTG) calculated using sigma theta values according to INP procedures;
8. Bold and red text indicate an exceedance of relevant criterion; and
9. Criterion may or may not apply due to rounding of meteorological data values.
3.3.2 Low Frequency Assessment
Table 3.5 provides statistics for attended noise monitoring undertaken around WCM during January 2017.
Table 3.5: ATTENDED MEASUREMENT STATISTICS FOR WCM – JANUARY, 2017
Conditions Total for January 2017
Number of measurements 4
Number of measurements where WCM was measurable,within 5 dB of the relevant criterion and criterion applied
1
One of the four measurements occurred during which WCM was measurable (not “inaudible” or 'not
measurable”), within 5 dB of the relevant criterion and where meteorological conditions resulted in criteria
applying (in accordance with the EPL). Further analysis of low frequency noise applicable to this
measurement are provided in Table 3.6.

Wambo Coal Mine and Rail Spur - Environmental Noise Monitoring January 201717014_R01 Page 15
Table 3.6: LOW FREQUENCY NOISE MODIFYING FACTOR ASSESSMENT – JANUARY 2017
Location Start Date and Time Broner lowfrequencymodifying
factor triggerdB1
Broner, Siteonly LCeq dB
2, 3
INP lowfrequencymodifying
factor triggerdB4
INP, Site onlyLCeq minus
site only LAeq
dB3,5
Site only LAeq
dB6
Comments
N16 09/01/2017 21:34 >60 NA >=15 NA 37 WCM audible, other mine continuum dominant
Notes:1. Night LCeq modifying factor trigger as detailed in Broner (2010);2. These are measured or calculated site only Broner C-weighted noise levels, NM denotes site levels were audible but not measurable, IA denotes site noise was inaudible. Where it is not possible to determine the site
only Broner result due to the presence of other low frequency noise sources occurring during the measurement, or if measurement was 5 dB less than the relevant criterion, this is noted as NA (not available) and nofurther assessment is required. Guidance is provided in the Comments column;
3. Bold results in red are greater than the relevant modifying factor trigger (if applicable);4. Low frequency modifying factor trigger as detailed in the INP;
5. These are measured or calculated site only INP results (site only LCeq minus site only LAeq), NM denotes site levels were audible but not measurable, IA denotes site noise was inaudible. Where it is not possible todetermine the site only INP result due to the presence of other low frequency noise sources occurring during the measurement, or if measurement was 5 dB less than the relevant criterion, this is noted as NA (notavailable) and no further assessment is required. Guidance is provided in the Comments column; and
6. WCM LAeq,15minute provided as a guide.

Wambo Coal Mine and Rail Spur - Environmental Noise Monitoring January 201717014_R01 Page 16
3.4 Atmospheric Conditions
Atmospheric condition data measured at each location are shown in Table 3.7. Data is routinely recorded on
a site-by-site basis to show conditions during the monitoring period. Monitoring is not undertaken during
periods of rain or hail.
Table 3.7: MEASURED ATMOSPHERIC CONDITIONS – JANUARY, 2017
Location Start Date and Time Temperaturedegrees
Wind Speed m/s
Wind DirectionMN
Cloud Covereighths
N01 09/01/2017 22:29 30 1.8 190 7
N03 09/01/2017 23:29 29 0.7 170 3
N16 09/01/2017 21:34 31 2.1 140 4
N23 09/01/2017 22:52 31 0.9 130 4
Notes:
1. Wind speed and direction measured at 1.8 metres; and
2. '-' indicates calm conditions.
Data obtained concurrently by the meteorological station and used for compliance assessment is provided in
Appendix C.

Wambo Coal Mine and Rail Spur - Environmental Noise Monitoring January 201717014_R01 Page 17
4 DISCUSSION
4.1 Noted Noise Sources
Table 3.2 presents data gathered during attended monitoring. These noise levels are the result of many
sounds reaching the sound level meter microphone during monitoring. Received levels from various noise
sources were noted during attended monitoring and particular attention was paid to the contribution ofWCM, if any, to measured levels. At each receptor location, the LAeq,15minute and LA1,1minute (night-
time only) for the WCM (in the absence of any other noise) was, where possible, measured directly, or,
determined by frequency analysis. These levels are summarised in Table 3.3 and Table 3.4. Time variations
of noise sources in each measurement, their temporal characteristics, are taken into account via statistical
descriptors.
From these observations summaries have been derived for each location. The following chapter sections
provide these summaries. Statistical 1/3 octave band analysis of environmental noise was undertaken, andFigure 3 to Figure 6 display the frequency ranges for various noise sources at each location for LA1, LA10,
LA90, and LAeq. These figures also provide, graphically, statistical information for these noise levels.
An example is provided as Figure 2 where it can be seen that frogs and insects are generating noise at
frequencies above 1000 Hz; mining noise is at frequencies less than 1000 Hz (this is typical). Adding levels at
frequencies that relate to mining only allows separate statistical results to be calculated. This analysis cannot
always be performed if there are significant levels of other noise at the same frequencies as mining; this can
be dogs, cows, or, most commonly, road traffic.
It should be noted that the method of summing statistical values up to a cut-off frequency can overstate theLA1 result by a small margin but is entirely accurate for LAeq.

Wambo Coal Mine and Rail Spur - Environmental Noise Monitoring January 201717014_R01 Page 18
Figure 2: Sample graph (see Section 5.1 for explanatory note)

Wambo Coal Mine and Rail Spur - Environmental Noise Monitoring January 201717014_R01 Page 19
4.1.1 N01, 9 January2017
WCM was inaudible.
Frogs and insects were primarily responsible for measured levels. A nearby tractor contributed to themeasured LA10, LAeq and LA90.
Breeze in foliage and breeze on the microphone were also noted.
Figure 3: Environmental Noise Levels, N01 - Lambkin
Wambo Coal Mine and Rail Spur - Environmental Noise Monitoring January 201717014_R01 Page 20
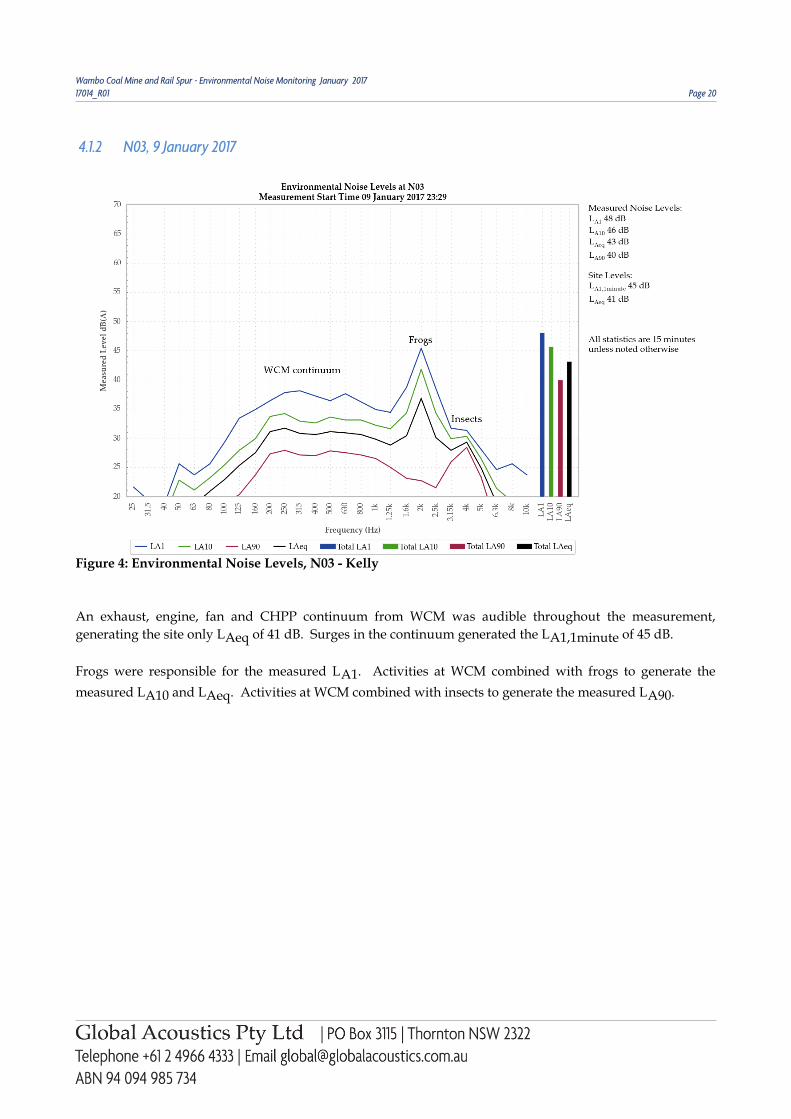
4.1.2 N03, 9 January 2017
An exhaust, engine, fan and CHPP continuum from WCM was audible throughout the measurement,generating the site only LAeq of 41 dB. Surges in the continuum generated the LA1,1minute of 45 dB.
Frogs were responsible for the measured LA1. Activities at WCM combined with frogs to generate the
measured LA10 and LAeq. Activities at WCM combined with insects to generate the measured LA90.
Figure 4: Environmental Noise Levels, N03 - Kelly

Wambo Coal Mine and Rail Spur - Environmental Noise Monitoring January 201717014_R01 Page 21
4.1.3 N16, 9 January 2017
An exhaust, engine and fan continuum from WCM was audible during the measurement, generating the siteonly LAeq of 37 dB. Surges in fan noise generated the LA1,1minute of 43 dB.
Insects were responsible for the measured LA1. WCM combined with a continuum from another mine, frogs
and insects, as well as breeze in foliage and breeze on the microphone to generate all other measured levels.
Figure 5: Environmental Noise Levels, N16 - Muller

Wambo Coal Mine and Rail Spur - Environmental Noise Monitoring January 201717014_R01 Page 22
4.1.4 N23, 9 January 2017
An exhaust continuum from WCM was audible during the measurement and generated the site only LAeqof 25 dB and LA1,1minute of 32 dB.
Insects were primarily responsible for measured levels. Breeze in foliage and frogs were minor contributorsto the LAeq and LA90.
Distant road traffic noise was also noted.
Figure 6: Environmental Noise Levels, N23 - Carter

Wambo Coal Mine and Rail Spur - Environmental Noise Monitoring January 201717014_R01 Page 23
5 SUMMARY
Environmental noise monitoring described in this report was undertaken during the night of 9/10 January
2017. It is noted that wind speeds and/or temperature inversion conditions may have been at levels greater
than which development consent conditions would apply for WCM activities.
5.1 Operational Noise AssessmentNoise levels from WCM complied with the LAeq,15minute and LA1,1minute development consent criteria
at all monitoring locations during the January 2017 survey.
5.2 Low Frequency Assessment
One of the 4 measurements occurred during which WCM was measurable (not “inaudible” or “not
measurable”), within 5 dB of the relevant criterion and where meteorological conditions resulted in criteria
applying (in accordance with the EPL). This measurement was analysed further, however, low frequency
penalties were not applicable.
Global Acoustics Pty Ltd

Wambo Coal Mine and Rail Spur - Environmental Noise Monitoring January 201717014_R01 Page 24
APPENDIX
A DEVELOPMENT CONSENT AND EPL

Wambo Coal Mine and Rail Spur - Environmental Noise Monitoring January 201717014_R01 Page 25
A.1 WAMBO COAL MINE DEVELOPMENT CONSENTA.1.1 Relevant Wambo Coal Mine Development Consent Conditions
The relevant sections of the October 2016 modified conditions are reproduced below:

Wambo Coal Mine and Rail Spur - Environmental Noise Monitoring January 201717014_R01 Page 26

Wambo Coal Mine and Rail Spur - Environmental Noise Monitoring January 201717014_R01 Page 27

Wambo Coal Mine and Rail Spur - Environmental Noise Monitoring January 201717014_R01 Page 28
Wambo Coal Mine and Rail Spur - Environmental Noise Monitoring January 201717014_R01 Page 29
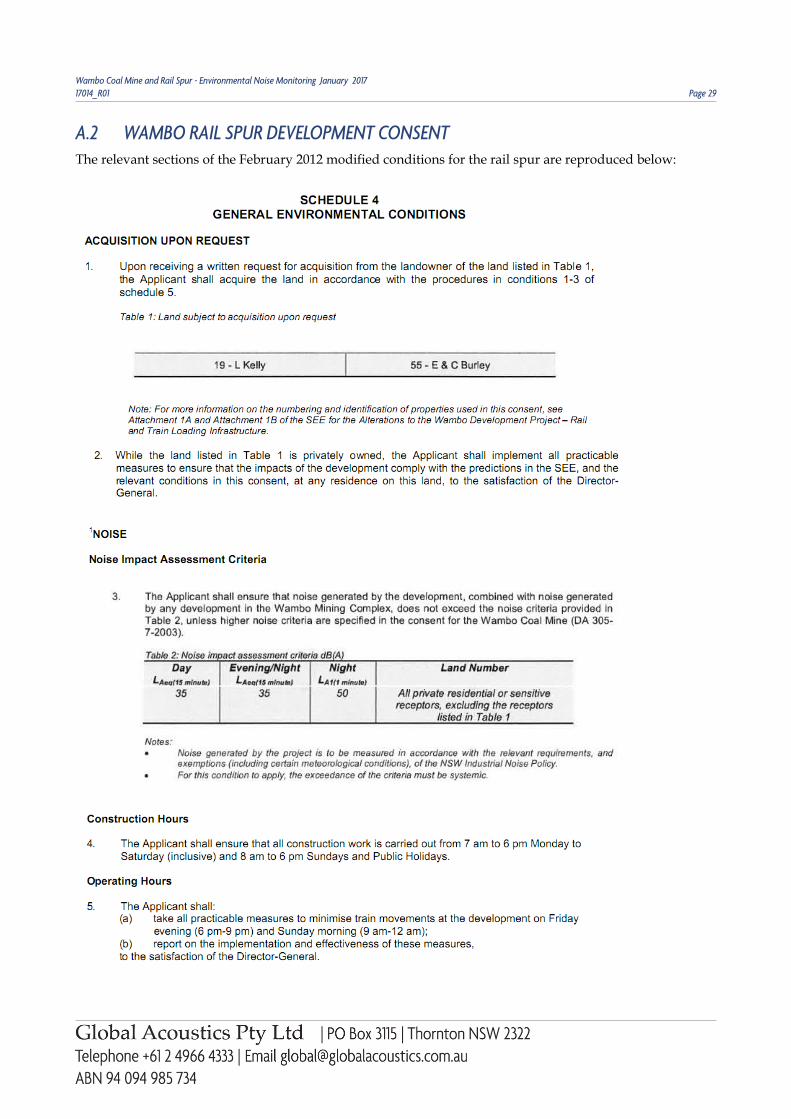
A.2 WAMBO RAIL SPUR DEVELOPMENT CONSENTThe relevant sections of the February 2012 modified conditions for the rail spur are reproduced below:
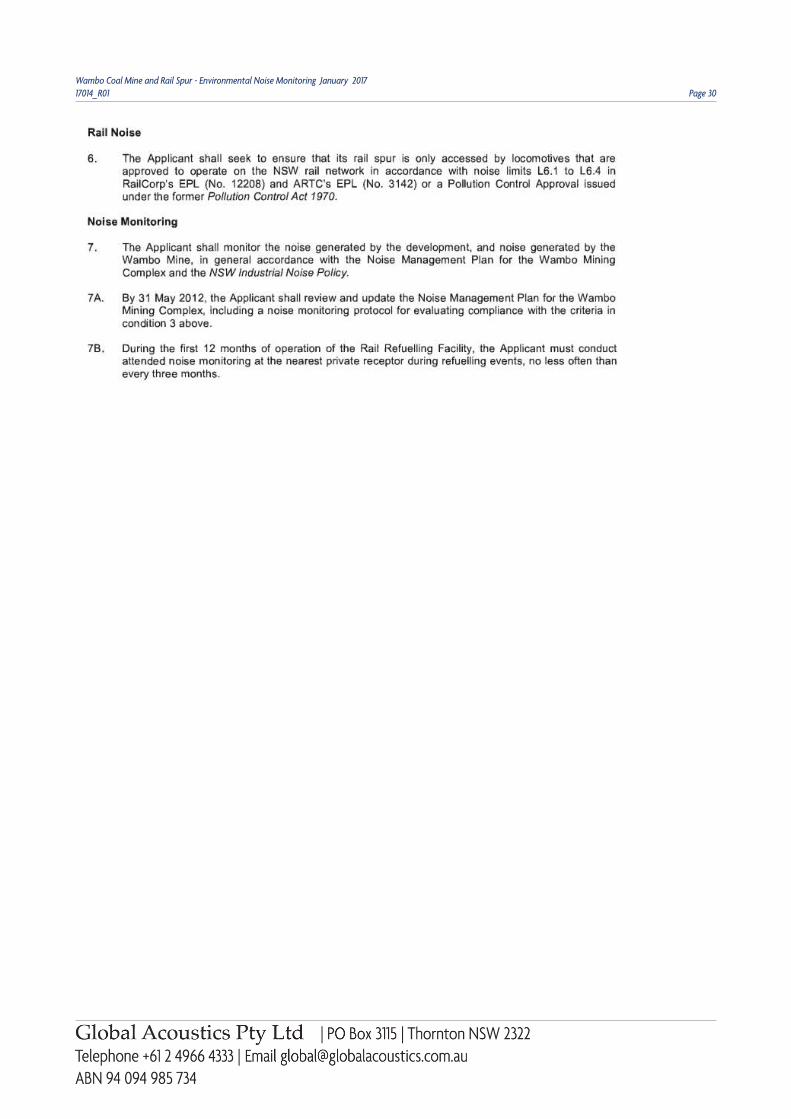
Wambo Coal Mine and Rail Spur - Environmental Noise Monitoring January 201717014_R01 Page 30

Wambo Coal Mine and Rail Spur - Environmental Noise Monitoring January 201717014_R01 Page 31
A.3 WAMBO RAIL LINE DEVELOPMENT CONSENTThe relevant sections of the 1998 conditions for the rail line are reproduced below:

Wambo Coal Mine and Rail Spur - Environmental Noise Monitoring January 201717014_R01 Page 32
A.4 WAMBO ENVIRONMENT PROTECTION LICENCE NUMBER 529The relevant sections of the EPL are reproduced below:
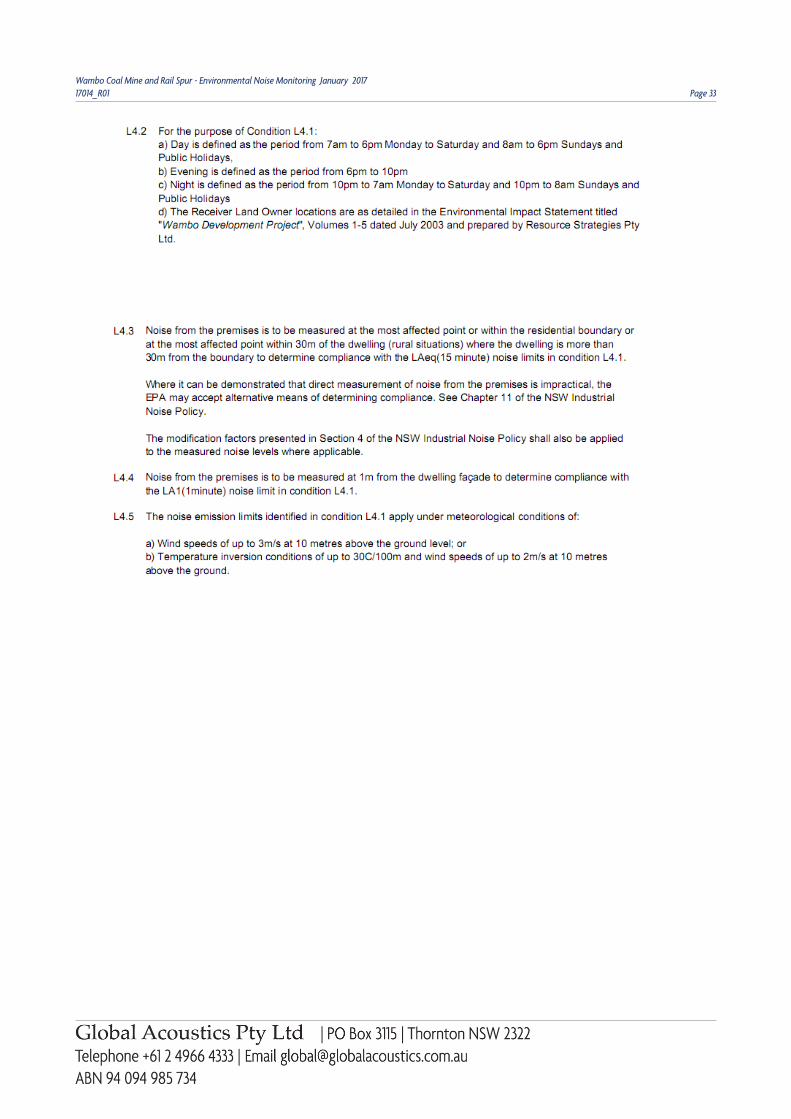
Wambo Coal Mine and Rail Spur - Environmental Noise Monitoring January 201717014_R01 Page 33

Wambo Coal Mine and Rail Spur - Environmental Noise Monitoring January 201717014_R01 Page 34
APPENDIX
B CALIBRATION CERTIFICATES

Wambo Coal Mine and Rail Spur - Environmental Noise Monitoring January 201717014_R01 Page 35

Wambo Coal Mine and Rail Spur - Environmental Noise Monitoring January 201717014_R01 Page 36

Wambo Coal Mine and Rail Spur - Environmental Noise Monitoring January 201717014_R01 Page 37

Wambo Coal Mine and Rail Spur - Environmental Noise Monitoring January 201717014_R01 Page 38

Wambo Coal Mine and Rail Spur - Environmental Noise Monitoring January 201717014_R01 Page 39
APPENDIX
C METEOROLOGICAL DATA

Wambo Coal Mine and Rail Spur - Environmental Noise Monitoring January 201717014_R01 Page 40
METEOROLOGICAL DATA FROM WAMBO WEATHER STATION
End Date and Time Wind Speed Average m/s Wind Direction AverageDegrees
Sigma Theta
09/01/2017 21:20 1.6 136 5.6
09/01/2017 21:25 1.6 138 6.3
09/01/2017 21:30 2.1 128 12.4
09/01/2017 21:35 2.2 141 12.5
09/01/2017 21:40 2.1 140 9.7
09/01/2017 21:45 2.2 126 12.4
09/01/2017 21:50 2.1 129 10.6
09/01/2017 21:55 2.2 133 11.9
09/01/2017 22:00 2.3 133 12.6
09/01/2017 22:05 2.3 125 10.4
09/01/2017 22:10 1.8 144 13.9
09/01/2017 22:15 2.3 137 12.9
09/01/2017 22:20 2.6 135 15.9
09/01/2017 22:25 2.1 133 12.4
09/01/2017 22:30 2.0 138 14.5
09/01/2017 22:35 2.3 139 10.5
09/01/2017 22:40 2.5 132 16.5
09/01/2017 22:45 2.4 133 10.7
09/01/2017 22:50 2.3 129 13.5
09/01/2017 22:55 2.1 133 11.7
09/01/2017 23:00 2.5 130 15.1
09/01/2017 23:05 3.0 139 14.7
09/01/2017 23:10 2.6 134 13.7
09/01/2017 23:15 2.5 141 13.9
09/01/2017 23:20 2.4 147 12.3
09/01/2017 23:25 2.6 148 14
09/01/2017 23:30 2.2 148 9.7
09/01/2017 23:35 2.0 150 14.5
09/01/2017 23:40 2.5 146 11.2
09/01/2017 23:45 2.6 148 18.2
09/01/2017 23:50 2.1 145 16.3
09/01/2017 23:55 3.1 146 17.9
Notes - “NA” indicates data was not available.