Wambo Coal Site Specific Particulate Matter Control Best … · · 2017-03-22WCPL Open Cut Run of...
112
Wambo Coal Site Specific Particulate Matter Control Best Practice Assessment Report Number 610.11105.01000-R1 30 August 2012 Wambo Coal Pty Ltd Jerry's Plain Road Warkworth via Singleton NSW 2330 Version: Draft 2
Transcript of Wambo Coal Site Specific Particulate Matter Control Best … · · 2017-03-22WCPL Open Cut Run of...

Wambo Coal
Site Specific Particulate Matter Control
Best Practice Assessment
Report Number 610.11105.01000-R1
30 August 2012
Wambo Coal Pty Ltd
Jerry's Plain Road
Warkworth via Singleton NSW 2330
Version: Draft 2

Wambo Coal Pty Ltd Wambo Coal Site Specific Particulate Matter Control Best Practice Assessment
Report Number 610.11105.01000-R1 30 August 2012
Draft 2 Page 2
SLR Consulting Australia Pty Ltd
Wambo Coal
Site Specific Particulate Matter Control
Best Practice Assessment
PREPARED BY:
SLR Consulting Australia Pty Ltd ABN 29 001 584 612
2 Lincoln Street Lane Cove NSW 2066 Australia
(PO Box 176 Lane Cove NSW 1595 Australia)
T: 61 2 9428 8100 F: 61 2 9427 8200
E: [email protected] www.slrconsulting.com
DOCUMENT CONTROL
Reference Status Date Prepared Checked Authorised
610.11105.01000 Draft 2 30-Aug-2012 Sandy Lonergan Martin Doyle
Gary Graham DRAFT
610.11105.01000 Draft 1 01-Jun-2012 Sandy Lonergan Martin Doyle
Gary Graham DRAFT

Wambo Coal Pty Ltd Wambo Coal Site Specific Particulate Matter Control Best Practice Assessment
Report Number 610.11105.01000-R1 30 August 2012
Draft 2 Page 3
EXECUTIVE SUMMARY
SLR Consulting Australia Pty Ltd
Background
Peabody Energy owns 75% and operates the Wambo Coal Colliery (WCPL), at Warkworth, near Singleton, New South Wales. WCPL is a combined open cut and underground mining operation in the Hunter Valley. It produces thermal coal for export and Pulverised Coal Injection coal for domestic customers.
The open-cut operations are been contracted out to Downer EDI mining, whilst the underground operation is operated by WCPL.
WCPL Open Cut Run of Mine coal produced was 4.015 million tonnes in the AEMR reporting period 2010/2011, while WCPL underground Run of Mine coal produced was 4.715 million tonnes. Following coal processing, the total WCPL coal product for the 2010/2011 AEMR reporting period was 5.68 million tonnes.
Current coal extraction operations at WCPL are in accordance with NSW Department of Planning and Infrastructure Consent Conditions under DA305-7-2003 and Environment Protection Licence number 529.
Pollution Reduction Program
In 2011, the NSW Environmental Protection Authority required, through a Pollution Reduction Program, that WCPL provide a report which examines in detail the potential measures which could be employed to further reduce particulate emissions from the mine. This is part of a larger program which aims to reduce particulate emissions from the coal mining industry as a whole in NSW.
Emissions were required to be quantified using United States Environmental Protection Agency approved emission factors without controls applied. Emission controls currently in place at WCPL were identified, and the control efficiency afforded by each applied measure, obtained through a literature review and site specific data were applied to these emissions.
Particulate emission sources were ranked according to the scale of emissions over a one year period with sources contributing to 95% of total site Total Suspended Particulate emissions identified and taken forward for further assessment. The assessment required that additional controls were investigated, and the feasibility of implementing each control option was assessed with consideration to implementation costs, regulatory requirements, environmental impacts, safety implications and compatibility with current processes and any proposed future developments.
Following this feasibility assessment, a timeframe for implementation of particulate management measures was required to be provided.
Findings
Particulate emission sources representing 95% of WCPL TSP emissions have been calculated to include haul roads, wind erosion from exposed areas and storage piles, the use of bulldozers on coal and the loading of trucks with coal and coarse reject material at the CHPP. Potential control measures for each of these sources have been investigated with regards to regulatory requirements, environmental impacts, safety implications and compatibility with current processes and any proposed future developments. Where these feasibility measures have been satisfied, the cost of implementation of each remaining measure has been calculated with those representing cost effective reductions taken forward for site trials.

Wambo Coal Pty Ltd Wambo Coal Site Specific Particulate Matter Control Best Practice Assessment
Report Number 610.11105.01000-R1 30 August 2012
Draft 2 Page 4
EXECUTIVE SUMMARY
SLR Consulting Australia Pty Ltd
Ongoing Actions and Implementation Timeframe
WCPL commit to the trial of the following dust suppression measures at the WCPL. Each trial will be complemented with a comprehensive field assessment to quantify particulate emissions from haul roads with and without the measure applied. A control efficiency will then be calculated which will assist in the confirmation of the assumptions used within this report.
Certain trials are currently being performed at the WCPL, including a trial of PetroTac (tar emulsion) which is planned to be extended.
Commitment 1 Polymer/tar and bitumen emulsions (PetroTac) will continue to be trialled on a 1 km stretch of the South Bates Haul Road over a period of 6 months. Following the trial, if measures are shown to provide reductions in particulate emissions at reasonable cost, widespread roll-out of measures will be implemented.
Commitment 2 Fencing and shelterbelts will be trialled on a 1 ha area of the RL160 dump over a period of 6 months. Following the trial, if the measure is shown to provide reductions in particulate emissions at reasonable cost, widespread roll-out of this measure will be implemented.
Commitment 3 Vegetative wind breaks and wind screens will be trialled on the ROM stockpile and on a 1 ha area of the product stockpile over a period of 6 months. Following the trial, if the measure is shown to provide reductions in particulate emissions at reasonable cost, widespread roll-out of this measure will be implemented.
Monitoring of Control Measures
The success of the trialled particulate reduction measures to be implemented at the WCPL will involve the monitoring of a range of parameters to ensure that each measure results in particulate reductions. A detailed monitoring plan will be designed for each trialled measure and may include (but not be limited to) the following monitoring methods:
The use of video cameras at the junction between treated and untreated haul roads to visually/subjectively identify the success of the measure in reducing haulage generated particulate matter emissions.
The sampling of the silt content of haul roads following the application of the PetroTac trial to allow the quantification of emission reductions (using emission estimation techniques).
The success of the installation of tree screens and shelterbelts will be measured through a site specific particulate monitoring program, with particulate measurements taken pre- and post- installation. In conjunction with meteorological data, this will allow the quantification of the success of the trial.

Wambo Coal Pty Ltd Wambo Coal Site Specific Particulate Matter Control Best Practice Assessment
Report Number 610.11105.01000-R1 30 August 2012
Draft 2 Page 5
TABLE OF CONTENTS
SLR Consulting Australia Pty Ltd
1 INTRODUCTION ............................................................................................................................ 9
1.1 Background .......................................................................................................................... 9
1.2 Guidance .............................................................................................................................. 9
1.3 Description of the Coal Mine ..............................................................................................11
1.3.1 Background to Wambo Coal Mine .........................................................................11
1.3.2 Mining and Coal Processing Operations ...............................................................11
1.4 Project Approval Conditions ...............................................................................................19
1.5 Environmental Licence Conditions.....................................................................................19
1.6 Environmental Performance ..............................................................................................20
2 IDENTIFICATION OF EXISTING CONTROL MEASURES & EMISSION ESTIMATION ...........22
2.1 Estimation of Baseline Particulate Emissions ....................................................................22
2.1.1 Activity Data ...........................................................................................................23
2.1.2 Uncontrolled Particulate Emissions .......................................................................26
2.2 Existing Control Measures .................................................................................................30
2.2.1 Behaviour and Operation Modification ..................................................................30
2.2.2 Rehabilitation .........................................................................................................31
2.2.3 Dust Suppression ..................................................................................................32
2.3 Ranking of Mining Activities and Identification of Top Four PM Sources ..........................42
3 POTENTIAL CONTROL MEASURES .........................................................................................43
3.1 Haul Roads ........................................................................................................................43
3.2 Wind Erosion ......................................................................................................................45
3.2.1 Exposed Areas and Overburden Emplacements ..................................................45
3.2.2 Coal Stockpiles ......................................................................................................46
3.3 Bulldozers on Coal .............................................................................................................48
3.4 Loading Coal and Reject Trucks ........................................................................................49
3.5 Quantification of Potential Particulate Management Measures .........................................49
4 EVALUATION OF ADDITIONAL CONTROL MEASURES ..........................................................69
4.1 Evaluation Findings – Haul Roads .....................................................................................70
4.1.1 Practicality of Implementation................................................................................70
4.1.2 Implementation Costs ............................................................................................72

Wambo Coal Pty Ltd Wambo Coal Site Specific Particulate Matter Control Best Practice Assessment
Report Number 610.11105.01000-R1 30 August 2012
Draft 2 Page 6
TABLE OF CONTENTS
SLR Consulting Australia Pty Ltd
4.2 Evaluation Findings – Wind Erosion of Overburden Dumps .............................................73
4.2.1 Practicality of Implementation................................................................................73
4.2.2 Implementation Costs ............................................................................................74
4.3 Evaluation Findings – Wind Erosion of Coal Stockpiles ....................................................75
4.3.1 Practicality of Implementation................................................................................75
4.3.2 Implementation Costs ............................................................................................76
4.4 Evaluation Findings – Bulldozer on Coal at CHPP ............................................................77
4.4.1 Practicality of Implementation................................................................................77
4.4.2 Implementation Costs ............................................................................................77
4.5 Evaluation Findings – Loading Coal to Trucks ..................................................................78
4.5.1 Practicality of Implementation................................................................................78
4.5.2 Implementation Costs ............................................................................................79
4.6 Evaluation Findings – Loading Coarse Rejects to Trucks .................................................79
4.6.1 Practicality of Implementation................................................................................79
4.6.2 Implementation Costs ............................................................................................80
4.7 Summary of Evaluation Findings .......................................................................................80
4.8 Cost Curves .......................................................................................................................84
4.9 Identification of Dust Control Measures for WCPL ............................................................86
4.9.1 Haul Roads ............................................................................................................87
4.9.2 Wind Erosion of the RL160 Overburden Dump .....................................................88
4.9.3 Wind Erosion of Coal Stockpiles ...........................................................................88
4.9.4 Monitoring of Control Measures ............................................................................89
5 IMPLEMENTATION TIMEFRAME ...............................................................................................90
6 REFERENCES .............................................................................................................................91
7 CLOSURE ....................................................................................................................................92
TABLES
Table 1 Production and Waste Summary, WCPL 2010.2011 12 Table 2 Details of Haul Roads 17 Table 3 Details of Conveyors 17 Table 4 Characteristics of Handled Materials and Haul Routes 18 Table 5 Material Handling Equipment, Tonnages Handled and Operational Hours 18 Table 6 Impact Assessment Criteria for Particulate Matter and Dust Deposition 19 Table 7 Particulate Emissions Sources and Relevant USEPA AP-42 Emission Factors 23 Table 8 Annual Activity Data for Material Handling Operations 24 Table 9 Annual Activity Data for Wind Erosion Sources 25 Table 10 Uncontrolled Annual Particulate Emissions – WCPL 27

Wambo Coal Pty Ltd Wambo Coal Site Specific Particulate Matter Control Best Practice Assessment
Report Number 610.11105.01000-R1 30 August 2012
Draft 2 Page 7
TABLE OF CONTENTS
SLR Consulting Australia Pty Ltd
Table 11 Annual Water Usage in Haul Road Dust Suppression (kL) 34 Table 12 Details of Haul Roads and Annual Water Usage in Haul Road Dust Suppression (kL) 34 Table 13 Water Application Intensity for Haul Routes 34 Table 14 Control Factors Assumed for Existing Control Measures 35 Table 15 Controlled Annual Particulate Emissions – WCPL 37 Table 16 Comparison of Uncontrolled and Controlled Particulate Emissions 40 Table 17 Controlled Particulate Matter Sources Representing 95% of Wambo Coal Mine TSP
Emissions 42 Table 18 Best Practice Control Measures - Haul Roads 45 Table 19 Best Practice Control Measures – Wind Erosion of Exposed Areas 46 Table 20 Best Practice Control Measures – Wind Erosion of Coal Stockpiles 48 Table 21 Best Practice Control Measures – Bulldozers 49 Table 22 Best Practice Control Measures – Loading Coal and Rejects to Trucks 49 Table 23 Control Factors Assumed for Potential Control Measures 50 Table 24 Locations of Estimated Emissions Tables - Controlled 51 Table 25 Estimated Emissions RL160 Dump Haul Road – Potential Controls 52 Table 26 Estimated Emissions Montrose Haul Road – Potential Controls 53 Table 27 Estimated Emissions South Bates Haul Road – Potential Controls 54 Table 28 Estimated Emissions Main Coal Haul Road, ROM to Open Cut Pit – Potential Controls55 Table 29 Estimated Emissions Main Coal Haul Road, ROM to Underground Stockpile – Potential
Controls 56 Table 30 Estimated Emissions Homestead Pit to ROM Haul Road – Potential Controls 57 Table 31 Estimated Emissions RL160 Dump – Wind Erosion – Potential Controls 58 Table 32 Estimated Emissions ROM Stockpile at CHPP – Wind Erosion – Potential Controls 59 Table 33 Estimated Emissions Product Coal Stockpile – Wind Erosion – Potential Controls 60 Table 34 Estimated Emissions Bulldozers at CHPP – Potential Controls 60 Table 35 Estimated Emissions Loading Coal to Trucks – Potential Controls 61 Table 36 Estimated Emissions Coarse Rejects to Trucks – Potential Controls 61 Table 37 Practicability of Implementing Control Measures on Haul Roads 70 Table 38 Practicability of Implementing Control Measures on Wind Eroded Areas – Overburden
Dumps 73 Table 39 Practicability of Implementing Control Measures on Wind Eroded Areas – Coal
Stockpiles 75 Table 40 Practicability of Implementing Control Measures for Bulldozers Operating on Coal 77 Table 41 Practicability of Implementing Control Measures on Dumping of ROM Coal to Trucks 78 Table 42 Practicability of Implementing Control Measures on Loading Coarse Rejects to Trucks79 Table 43 Summary of Control Options Evaluation 81 Table 44 Proposed PM2.5 / PM10 Particle Size Ratios 2
FIGURES
Figure 1 Current Mining Operations 14 Figure 2 Current Waste Emplacement Areas 16 Figure 3 High Volume Air Sampling (HVAS) Results for TSP – WCPL 2010/2011 20 Figure 4 Tapered Element Oscillating Microbalance (TEOM) Results for PM10 – WCPL
2010/2011 21 Figure 5 Dust Deposition Monitoring Results – WCPL 2010/2011 21 Figure 6 Uncontrolled Annual Particulate Emissions – WCPL 28 Figure 7 Watering Control Effectiveness for Unpaved Roads 33 Figure 8 Controlled Annual Particulate Emissions – Wambo Coal Mine 38 Figure 9 Comparison of Uncontrolled versus Controlled Particulate Emissions – Wambo Coal
Mine 39 Figure 10 Representation of Major Controlled Particulate Emission Sources -WCPL 41

Wambo Coal Pty Ltd Wambo Coal Site Specific Particulate Matter Control Best Practice Assessment
Report Number 610.11105.01000-R1 30 August 2012
Draft 2 Page 8
TABLE OF CONTENTS
SLR Consulting Australia Pty Ltd
Figure 11 Potential Reductions in PM Emissions due to Additional Controls Haulage on RL160 Dump Haul Road 62
Figure 12 Potential Reductions in PM Emissions due to Additional Controls Haulage on Montrose Haul Road 62
Figure 13 Potential Reductions in PM Emissions due to Additional Controls Haulage on South Bates Haul Road 63
Figure 14 Potential Reductions in PM Emissions due to Additional Controls Haulage on Main Coal Haul Road – ROM to Open Cut Pit 63
Figure 15 Potential Reductions in PM Emissions due to Additional Controls Haulage on South Bates Haul Road 64
Figure 16 Potential Reductions in PM Emissions due to Additional Controls Haulage on Main Coal Haul Road – ROM to Underground Stockpile 64
Figure 17 Potential Reductions in PM Emissions due to Additional Controls Haulage on Homestead Pit to ROM Haul Road 65
Figure 18 Potential Reductions in PM Emissions due to Additional Controls Wind Erosion from RL160 Dump 65
Figure 19 Potential Reductions in PM Emissions due to Additional Controls Wind Erosion from ROM Stockpile at CHPP 66
Figure 20 Potential Reductions in PM Emissions due to Additional Controls Wind Erosion from Product Coal Stockpile 66
Figure 21 Potential Reductions in PM Emissions due to Additional Controls Bulldozers on Coal at CHPP 67
Figure 22 Potential Reductions in PM Emissions due to Additional Controls Loading ROM Coal to Trucks 67
Figure 23 Potential Reductions in PM Emissions due to Additional Controls Loading Coarse Rejects to Trucks 68
Figure 24 PM10 Abatement Cost Curve 84
APPENDICES
Appendix A NSW EPA Coal Mine Particulate Matter Control Best Practice – Site Specific Determination Guideline
Appendix B USEPA AP-42 Emission Factors used in Calculation of Particulate Emissions Appendix C Assay Certificates for Material Composition Appendix D Standard Operating Procedures for Dust Management and Report Form Appendix E Detailed Cost/Benefit Tables for Selected Dust Management Measures

Wambo Coal Pty Ltd Wambo Coal Site Specific Particulate Matter Control Best Practice Assessment
Report Number 610.11105.01000-R1 30 August 2012
Draft 2 Page 9
SLR Consulting Australia Pty Ltd
1 INTRODUCTION
SLR Consulting Australia Pty Ltd (SLR Consulting) was commissioned by Wambo Coal Pty Ltd (WCPL, a subsidiary of Peabody Energy Australia Pty Ltd) to perform this assessment, which has included a site inspection, emissions estimation and the identification, quantification and justification of existing and proposed control measures for the site. The study was performed in accordance with the
Coal Mine Particulate Matter Control – Best Practice: Site Specific Determination Guideline1 issued by the New South Wales (NSW) Environmental Protection Authority (EPA) in November 2011.
The findings of this assessment are presented in the following report for submission to EPA.
1.1 Background
In 2010, the NSW EPA commissioned a detailed review of particulate matter (PM) emissions from coal mining activities in the Greater Metropolitan Region (GMR) of NSW. This review was completed in 2011 and issued as NSW (OEH) (2011) NSW Coal Mining Benchmarking Study: International Best Practice Measures to Prevent and/or minimise Emissions of Particulate Matter from Coal Mining (hereafter ‘the Katestone report’). One of the key recommendations of the study was that each mine should carry out a site-specific determination of best management practice. This recommendation has been adopted by the EPA through the implementation of the “Dust Stop” program.
The Dust Stop program aims to ensure that the most reasonable and practical particulate control options are implemented by each coal mine. Under this program, all coal mines in NSW are required to prepare a report that compares their current operation with international best practice. Mines are also required to report on the practicability of implementing each best practice measure and for any measures found to be practicable are required to provide a timetable for implementation. Once complete, copies of each report are required to be available on the mine’s website.
The Dust Stop program is being implemented through pollution-reduction programs (PRPs) as operating conditions under the Environmental Protection Licence (EPL). A PRP was issued to Wambo Coal in August 2011 requiring that a Site Specific Particulate Matter Control Best Practice Assessment be prepared for the site.
1.2 Guidance
EPA has provided guidance on the general structure and methodology of the assessment report. For clarification, the guidance provided has been reproduced in Appendix A.
Briefly, the process that is required is indicated below. For each required step in the procedure, reference has been provided to the relevant sections in this assessment report:
1. Identify, quantify and justify existing measures that are being used to minimise
particle emissions Section 2
2. Identify, quantify and justify best practice measures that could be used to minimise particle emissions
Section 3
3. Evaluate the practicability of implementing these best practice measures Section 4
4. Propose a timeframe for implementing all practicable best practice measures Section 5
Further to this provided guidance, EPA held a workshop for coal mining companies and their consultants on 8 May 2012. The outcome of this workshop was further clarified guidance relating to the requirements of EPA. These clarifications are summarised:
1 http://www.environment.nsw.gov.au/resources/air/20110813coalmineparticulate.pdf
Wambo Coal Pty Ltd Wambo Coal Site Specific Particulate Matter Control Best Practice Assessment
Report Number 610.11105.01000-R1 30 August 2012
Draft 2 Page 10
SLR Consulting Australia Pty Ltd
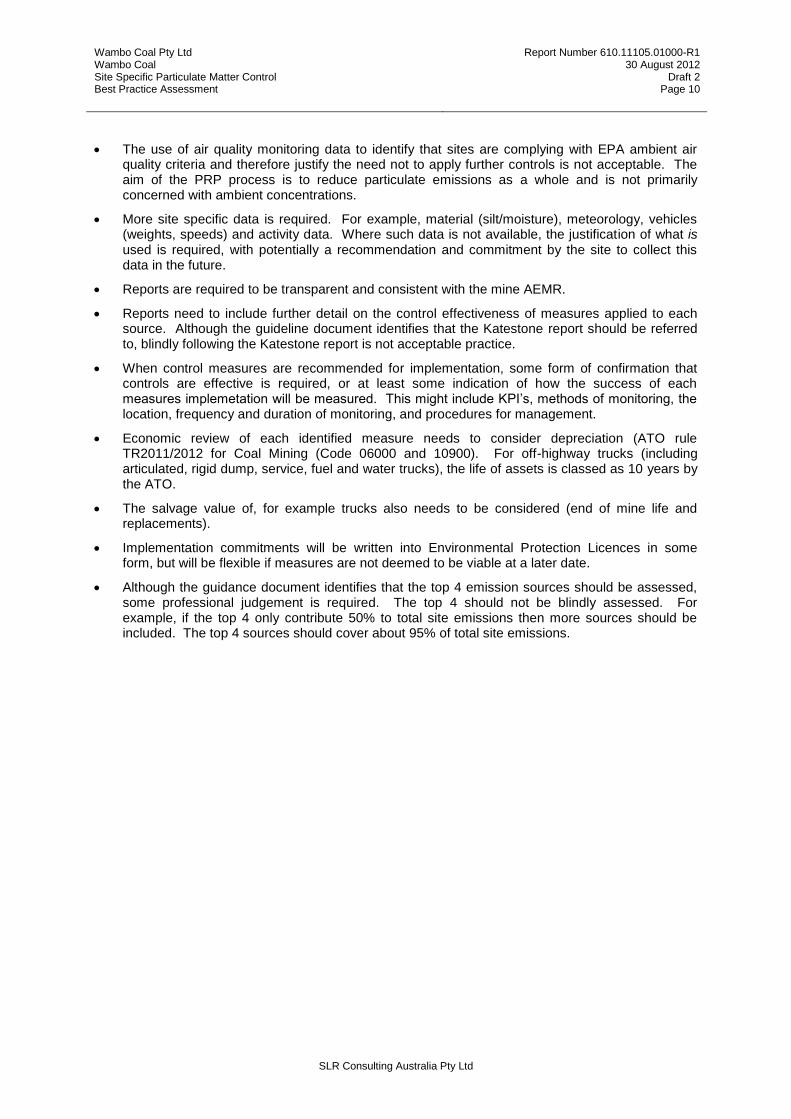
The use of air quality monitoring data to identify that sites are complying with EPA ambient air quality criteria and therefore justify the need not to apply further controls is not acceptable. The aim of the PRP process is to reduce particulate emissions as a whole and is not primarily concerned with ambient concentrations.
More site specific data is required. For example, material (silt/moisture), meteorology, vehicles (weights, speeds) and activity data. Where such data is not available, the justification of what is used is required, with potentially a recommendation and commitment by the site to collect this data in the future.
Reports are required to be transparent and consistent with the mine AEMR.
Reports need to include further detail on the control effectiveness of measures applied to each source. Although the guideline document identifies that the Katestone report should be referred to, blindly following the Katestone report is not acceptable practice.
When control measures are recommended for implementation, some form of confirmation that controls are effective is required, or at least some indication of how the success of each measures implemetation will be measured. This might include KPI’s, methods of monitoring, the location, frequency and duration of monitoring, and procedures for management.
Economic review of each identified measure needs to consider depreciation (ATO rule TR2011/2012 for Coal Mining (Code 06000 and 10900). For off-highway trucks (including articulated, rigid dump, service, fuel and water trucks), the life of assets is classed as 10 years by the ATO.
The salvage value of, for example trucks also needs to be considered (end of mine life and replacements).
Implementation commitments will be written into Environmental Protection Licences in some form, but will be flexible if measures are not deemed to be viable at a later date.
Although the guidance document identifies that the top 4 emission sources should be assessed, some professional judgement is required. The top 4 should not be blindly assessed. For example, if the top 4 only contribute 50% to total site emissions then more sources should be included. The top 4 sources should cover about 95% of total site emissions.
Wambo Coal Pty Ltd Wambo Coal Site Specific Particulate Matter Control Best Practice Assessment
Report Number 610.11105.01000-R1 30 August 2012
Draft 2 Page 11
SLR Consulting Australia Pty Ltd
1.3 Description of the Coal Mine
1.3.1 Background to Wambo Coal Mine
Wambo Coal Pty Ltd (WCPL) is owned by Peabody Energy Australia Pty Limited (75%) and Sumiseki Materials Co, Ltd (25%). WCPL is an Open Cut and Underground mining operation located approximately 15 kilometres (km) west of Singleton near the locality of Warkworth. It is bounded by Wollombi Brook to the east, coal mining operations to the north, grazing land to the south and north-west and the Wollemi National Park to the west and south-west.
WCPL was granted development consent by Patrick Plains Shire Council in 1969 with Open Cut and Underground mining commencing shortly after. Subsequent development consents issued in 1972, 1974 and 1977 covered a range of early Open Cut and Underground operations. Singleton Shire Council (SSC) approved extensions to mining operations, construction activities and modifications to road haulage rates in the period between 1980 and 1991.
In July 1991, a Development Application (DA) was lodged with SSC seeking approval for the expansion of Open Cut and Underground mining activities and the consolidation of earlier development consents. Development consent was granted in February 1992.
The Homestead Underground Mine commenced in 1979 and operated until 1999. In 2003 the mine entries were sealed.
The Wollemi Underground Mine commenced production in 1997 and was placed under care and maintenance in October 2002 after the available longwall reserves were exhausted.
Open Cut operations were suspended between March 1999 and August 2001. Following the closure of the Wollemi Underground Mine, Open Cut operations were expanded to maintain an overall production rate of 3 million tonnes per annum (Mtpa) of product coal. Development of the North Wambo Underground Mine (the Underground) commenced in November 2005, with longwall operations commencing in October 2007.
Coal from the Open Cut and the Underground operations is washed at the Coal Handling and Preparation Plant (CHPP). Until June 2006 product coal was transported by highway rated trucks via the Golden Highway to the Mount Thorley Coal Loader for rail transport to the Port of Newcastle. The construction and commissioning of the WCPL Rail Development (WRD) in May 2006, which includes the rail line from Mount Thorley and WCPL rail spur and coal terminal, allows the direct rail transportation of all product coal from WCPL to the Port of Newcastle.
1.3.2 Mining and Coal Processing Operations
During the most recent Annual Environmental Management Report (AEMR) period of 2010/2011 (1 July 2010 to 30 June 2011), the quantities of coal production and waste generation were reported as presented in Table 1 (replicated from Table 2.1, AEMR, 2011 p21).

Wambo Coal Pty Ltd Wambo Coal Site Specific Particulate Matter Control Best Practice Assessment
Report Number 610.11105.01000-R1 30 August 2012
Draft 2 Page 12
SLR Consulting Australia Pty Ltd
Table 1 Production and Waste Summary, WCPL 2010.2011
Parameter Reporting Period 1 July 2010 to 30 June 2011
Topsoil stripped 194,750.5 m3
Topsoil Used/Spread 9,800 m3
Overburden Moved 27,583,359 bcm
Processing Waste 3.036 Mt
ROM Coal Mined 8.730 Mt
Open Cut 4.015 Mt
Underground 4.715 Mt
Product 5.680 Mt
Taken from Table 2.1, WCPL AEMR 2010/2011 p21
Coal Mining
Coal extracted from underground workings is conveyed to a stockpile with an approximate 70,000 tonne (t) capacity. When a sufficient stockpile is present, coal is loaded onto trucks and transported to the CHPP (AEMR, 2011 p22).
Downer EDI Mining are contracted to undertake open cut mining operations at WCPL. Open cut mining is divided into pits known as the Bates Pit, Bates South Pit, Montrose Pit and the Homestead Pit (refer Figure 1). Mining of the open cut areas commences with the removal of vegetation and topsoil.
Where possible, direct placement of topsoil onto re-profiled areas is preferred to stockpiling to avoid rehandling. However, during the reporting period 2010/2011 this was not possible. If topsoil stockpiles are to be left for more than three months, they are generally shaped into elongated mounds and seeded with pasture to keep the soil fertile, prevent weed growth and reduce soil loss (AEMR, 2011 p18).
Following land preparation, excavators and trucks remove any weathered material as a “free dig” operation. Material which can be removed in this way ranges from one metre to ten metres in thickness. Remaining overburden is drilled, blasted and removed using excavators and rear dump haul trucks to uncover coal.
Exposed coal is mined using excavators and loaded into haul trucks. Coal is mined without the need for blasting. The majority (approximately 80%) of ROM coal is delivered directly from the open cut operations to the ROM dump hopper using haul trucks with the balance (approximately 20%) temporarily stockpiled on the ROM coal stockpile pad.
Coal Processing and Load-Out
Coal from the underground and open cut operations is transferred to the CHPP via haul trucks on internal roads. Coal is tipped directly into the 400 t ROM bin or stockpiled adjacent to the ROM bin and subsequently loaded into the ROM crusher using a front-end-loader (FEL) as required.
Three stages are used to crush and screen the coal, with product coal being transferred to the clean coal stockpile. Underground reclaimers are used to transfer coal onto the load-out conveyor which transfers coal to the train load-out bin. Average coal recovery in the CHPP was 65% in the 2010/2011 AEMR reporting period (AEMR, 2011 p23).

Wambo Coal Pty Ltd Wambo Coal Site Specific Particulate Matter Control Best Practice Assessment
Report Number 610.11105.01000-R1 30 August 2012
Draft 2 Page 13
SLR Consulting Australia Pty Ltd
The WCPL train loading facility is designed to load trains at a rate of 4,500 tonnes per hour (tph). Appendix 1 of the AEMR (2011, Appendix 1 p19) indicates that a total of 6,038,011.82 tonnes of product coal was loaded to trains between 30 June 2010 and 29 June 2011. It is noted that the quantity of coal loaded to trains in the 2010/2011 reporting period was 388,011.8 t greater than the quantity of coal produced (refer Table 1). The capacity of the clean coal stockpile is 500,000 t which accounts for this discrepancy.

Wambo Coal Pty Ltd Wambo Coal Site Specific Particulate Matter Control Best Practice Assessment
Report Number 610.11105.01000-R1 30 August 2012
Draft 2 Page 14
SLR Consulting Australia Pty Ltd
Figure 1 Current Mining Operations
Source: AEMR 2010/2011, Figure 2.2 p24

Wambo Coal Pty Ltd Wambo Coal Site Specific Particulate Matter Control Best Practice Assessment
Report Number 610.11105.01000-R1 30 August 2012
Draft 2 Page 15
SLR Consulting Australia Pty Ltd
Waste Handling and Placement
Overburden Emplacement
Approximately 27,583,359 bank cubic metres (bcm) of overburden material were removed during the 2010/2011 AEMR reporting period (AEMR, 2011 Table 2.1 p21). During the reporting period, backfilling of the Wombat Pit (refer Figure 2) continued, reducing the need for out of pit dump space (AEMR, 2011 p23). A material density for overburden has been provided by WCPL as 2.36 t/bcm. For comparison, Coal & Allied (Hunter Valley Operations) reference an overburden density of 2.4 t/bcm, with USEPA AP-42 emission factor documentation (Chapter 11.9) stating an average overburden density of 2.09 t/bcm. A value of 2.36 t/bcm has been used in this assessment.
CHPP Reject Material
Rejects from the CHPP represent approximately 30-35% of processed ROM coal and are classified as either coarse or fine rejects. Coarse reject typically represent two-thirds of the material and are made up of <50mm fragments of carbonaceous shale, sandstone, mudstone and gravels. Coarse rejects are co-disposed of with overburden.
Fine rejects make up the remaining one-third and are a slurry material with a solids content of approximately 30% by weight. Tailings comprise <70 micrometer (µm) carbonaceous shale, sand and clay materials.
Several waste emplacement areas (tailings dams) have been approved, although many are now capped and/or rehabilitated. The Hunter Pit Tailing Dam (refer Figure 2) is the only current operational area for tailings.

Wambo Coal Pty Ltd Wambo Coal Site Specific Particulate Matter Control Best Practice Assessment
Report Number 610.11105.01000-R1 30 August 2012
Draft 2 Page 16
SLR Consulting Australia Pty Ltd
Figure 2 Current Waste Emplacement Areas
Source: AEMR 2010/2011, Figure 1.4 p12

Wambo Coal Pty Ltd Wambo Coal Site Specific Particulate Matter Control Best Practice Assessment
Report Number 610.11105.01000-R1 30 August 2012
Draft 2 Page 17
SLR Consulting Australia Pty Ltd
Material Movement
As previously outlined, material is moved around the Wambo Coal Mine by a combination of conveyor and haul truck on internal haul roads. All product coal is transported off site by trains.
Conveyors are located in the Homestead Pit to transport coal from the North Wambo Underground to the Underground ROM stockpile (70,000 t capacity) where coal is loaded onto trucks for transport to the CHPP. Coal extracted in the Montrose, Bates, Bates South and Homestead open cut is transported to the CHPP by haul trucks. Overburden generated in each of the open cut areas is transported to the RL160 Dump.
The length of each haul road is presented in Table 2 with information on the haul road width, annual use and mean vehicle weight.
Table 2 Details of Haul Roads
Haul Road Length (m)
Width (m)
Annual Trip Frequency
Mean Vehicle Weight (tonnes)
Main Coal Haul Road ROM to Open Cut 4,826 30 6,784 502
Main Coal Haul Road ROM to U/G Stockpile 2,531 35 17,074 249
RL160 Dump Road 3,570 40 20,332 502
Homestead Pit to ROM 1,918 30 9,990 324
South Bates Road 936 35 45,229 337
Montrose Road 1,937 35 33,479 337
Source: WCPL pers. comm. 2012
WCPL has provided details and number of conveyors on site. These are presented in Table 3.
Table 3 Details of Conveyors
Name Number Length (m)
Number of Transfer
Points
Quantity of Coal Conveyed (per year)
ROM Coal Conveyor 1 160 1 8.730 Mt
Coarse Reject Conveyor – Reject bin 1 60 0 2.017 Mt (35% of ROM^
and 66% of rejects≠)
Product Coal Conveyor 5 685 3 5.675 Mt (65% of ROM)^
Underground Inpit Conveyor 3 700 3 4.715 Mt
Overland Conveyor to Rail Load Out 2 980 2 6.038 Mt#
^ AEMR, 2011 p23
≠ AEMR, 2011 p26
# AEMR, 2011, Appendix 1 p19 – noted that coal loaded to trains in the 2010/2011 reporting period was 388,011.8 t greater
than the quantity of coal produced (refer Table 1). The capacity of the clean coal stockpile is 500,000 t which accounts for this discrepancy.
Material Placement
Coal
The majority of coal which is transported by haul truck to the CHPP is delivered directly to the ROM dump hopper with the balance temporarily stockpiled on the ROM coal stockpile pad (AEMR, 2011 p23). In the absence of further information and for the purposes of this assessment it has been assumed that 80% of coal transported to the CHPP is dumped directly into the ROM hopper, with 20% being stockpiled at the 200 m by 200 m (4 hectare [ha]) stockpile area which has a capacity of 250,000 tonnes (AEMR, 2011 p27).
Wambo Coal Pty Ltd Wambo Coal Site Specific Particulate Matter Control Best Practice Assessment
Report Number 610.11105.01000-R1 30 August 2012
Draft 2 Page 18
SLR Consulting Australia Pty Ltd
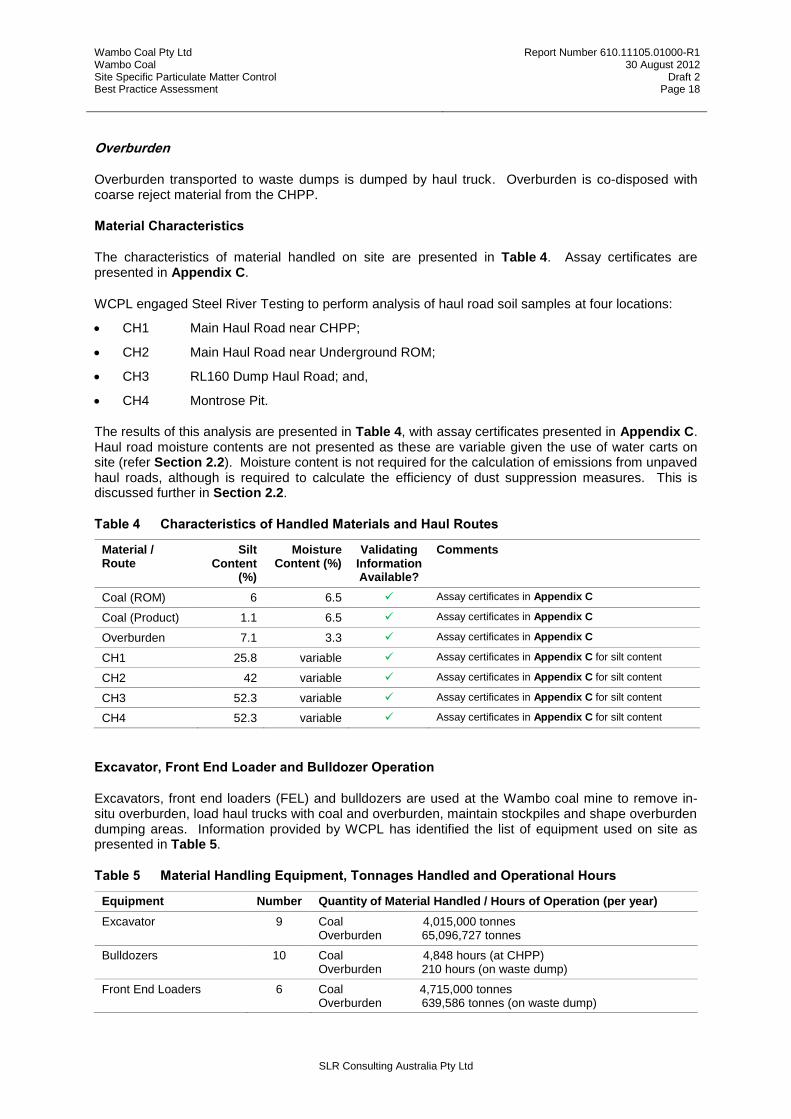
Overburden
Overburden transported to waste dumps is dumped by haul truck. Overburden is co-disposed with coarse reject material from the CHPP.
Material Characteristics
The characteristics of material handled on site are presented in Table 4. Assay certificates are presented in Appendix C.
WCPL engaged Steel River Testing to perform analysis of haul road soil samples at four locations:
CH1 Main Haul Road near CHPP;
CH2 Main Haul Road near Underground ROM;
CH3 RL160 Dump Haul Road; and,
CH4 Montrose Pit.
The results of this analysis are presented in Table 4, with assay certificates presented in Appendix C. Haul road moisture contents are not presented as these are variable given the use of water carts on site (refer Section 2.2). Moisture content is not required for the calculation of emissions from unpaved haul roads, although is required to calculate the efficiency of dust suppression measures. This is discussed further in Section 2.2.
Table 4 Characteristics of Handled Materials and Haul Routes
Material / Route
Silt Content
(%)
Moisture Content (%)
Validating Information Available?
Comments
Coal (ROM) 6 6.5 Assay certificates in Appendix C
Coal (Product) 1.1 6.5 Assay certificates in Appendix C
Overburden 7.1 3.3 Assay certificates in Appendix C
CH1 25.8 variable Assay certificates in Appendix C for silt content
CH2 42 variable Assay certificates in Appendix C for silt content
CH3 52.3 variable Assay certificates in Appendix C for silt content
CH4 52.3 variable Assay certificates in Appendix C for silt content
Excavator, Front End Loader and Bulldozer Operation
Excavators, front end loaders (FEL) and bulldozers are used at the Wambo coal mine to remove in-situ overburden, load haul trucks with coal and overburden, maintain stockpiles and shape overburden dumping areas. Information provided by WCPL has identified the list of equipment used on site as presented in Table 5.
Table 5 Material Handling Equipment, Tonnages Handled and Operational Hours
Equipment Number Quantity of Material Handled / Hours of Operation (per year)
Excavator 9 Coal 4,015,000 tonnes Overburden 65,096,727 tonnes
Bulldozers 10 Coal 4,848 hours (at CHPP) Overburden 210 hours (on waste dump)
Front End Loaders 6 Coal 4,715,000 tonnes Overburden 639,586 tonnes (on waste dump)

Wambo Coal Pty Ltd Wambo Coal Site Specific Particulate Matter Control Best Practice Assessment
Report Number 610.11105.01000-R1 30 August 2012
Draft 2 Page 19
SLR Consulting Australia Pty Ltd
Drilling and Blasting
The AEMR for the reporting period 2010/2011 identifies that a total of 318 boreholes were drilled for surface exploration purposes (AEMR, 2011 p18). Further to this, holes are drilled for the placement of blast charges and in the AEMR reporting period 2010/2011 totalled 34,219 for a total of 68 blasts (AEMR, 2011 p64).
Supplementary information provided by WCPL indicates that the typical area of each blast is 16,167 m
2 (1.6ha) with a typical depth of blast of 15.9 m. Moisture content of blasted material
(overburden only) is 3.3% (refer Table 4).
1.4 Project Approval Conditions
Project Approval Conditions for the WCPL under Section 75J of the Environmental and Planning Assessment Act 1979, dated 7 September 2010 include air quality criteria to ensure that the dust emissions generated by the Colliery do not cause additional exceedances of air quality criteria. These criteria are outlined in Table 6 and are not to be exceeded at any residence on privately owned land, or on more than 25% of any privately owned land.
Table 6 Impact Assessment Criteria for Particulate Matter and Dust Deposition
Pollutant Averaging Period Criterion
Total suspended particulate matter (TSP)
Annual 90 µg/m3
Particulate matter <10 µm (PM10)
Annual 30 µg/m3
24 hour 50 µg/m3
Maximum increase in deposited dust level
Maximum total deposited dust level
Deposited dust Annual 2 g/m2/month 4 g/m2/month
1.5 Environmental Licence Conditions
The EPA regulates the operations conducted at WCPL through an Environmental Protection Licence issued under the Protection of the Environment Operations Act 1997 (POEO Act). Environmental Protection Licence number 529 contains the following conditions in relation to dust (with the exception of the requirements in condition U1, which are considered within this report):
O3.1 The premises must be maintained in a condition which minimises or prevents the emission of dust from the premises.
O3.2 All trafficable areas, coal storage areas and vehicle manoeuvring areas in or on the premises must be maintained, at all times, in a condition that will minimise the generation, or emission from the premises, of wind-blown or traffic generated dust.
WCPL operates a complaints recording and management system as part of their over-arching management system and in accordance with Condition M4 of the EPL. In the last 12 months, WCPL has received two complaints relating to dust generation; both were made by DoPI officers.
EPA do not have any current Notices issued to WCPL.

Wambo Coal Pty Ltd Wambo Coal Site Specific Particulate Matter Control Best Practice Assessment
Report Number 610.11105.01000-R1 30 August 2012
Draft 2 Page 20
SLR Consulting Australia Pty Ltd
1.6 Environmental Performance
Considering the requirements of both the Project approval and EPL, WCPL operates an air quality monitoring program for TSP, PM10 and dust deposition.
WCPL currently performs TSP monitoring at four locations using High Volume Air Samplers (HVAS), PM10 is monitored using four real time TEOM units. Dust deposition monitoring is performed at a total of 16 locations surrounding the mine.
Monitoring results for TSP and PM10 are presented in Figure 3 and Figure 4 the period 15 October 2010 to 14 October 2011 and demonstrate that for both PM10 and TSP, compliance with the Project Approval Conditions is being achieved at the monitoring sites. Raw data can be seen in the AEMR (2011) in Appendix 2B.
Results of air quality monitoring are presented for contextual information only. It is acknowledged that evidence of compliance with Project Approval conditions is not adequate justification to not implement further dust controls on site.
Figure 3 High Volume Air Sampling (HVAS) Results for TSP – WCPL 2010/2011
High Volume Air Sampling
HV01 - Coralie
0
50
100
150
200
250
300
Ju
l 1
0
Au
g 1
0
Se
p 1
0
Oct 1
0
No
v 1
0
De
c 1
0
Ja
n 1
1
Fe
b 1
1
Ma
r 1
1
Ap
r 1
1
Ma
y 1
1
Ju
n 1
1
To
tal S
usp
en
de
d P
art
icu
late
s (
ug
/m3)
TSP
Results
Yearly
Average
Annual
Limit
High Volume Air Sampling
HV02 - Caban
0
50
100
150
200
250
300
Ju
l 1
0
Au
g 1
0
Se
p 1
0
Oct 1
0
No
v 1
0
De
c 1
0
Ja
n 1
1
Fe
b 1
1
Ma
r 1
1
Ap
r 1
1
Ma
y 1
1
Ju
n 1
1To
tal S
usp
en
de
d P
art
icu
late
s (
ug
/m3)
TSP
Results
Yearly
Average
Annual
Limit
High Volume Air Sampling
HV03 - Thelander
0
50
100
150
200
250
300
Ju
l 1
0
Au
g 1
0
Se
p 1
0
Oct 1
0
No
v 1
0
De
c 1
0
Ja
n 1
1
Fe
b 1
1
Ma
r 1
1
Ap
r 1
1
Ma
y 1
1
Ju
n 1
1
To
tal S
usp
en
de
d P
art
icu
late
s (
ug
/m3)
TSP
Results
Yearly
Average
Annual
Limit
High Volume Air Sampling
HV04 - Muller
0
50
100
150
200
250
300
Ju
l 1
0
Au
g 1
0
Se
p 1
0
Oct 1
0
No
v 1
0
De
c 1
0
Ja
n 1
1
Fe
b 1
1
Ma
r 1
1
Ap
r 1
1
Ma
y 1
1
Ju
n 1
1
To
tal S
usp
en
de
d P
art
icu
late
s (
ug
/m3)
TSP
Results
Yearly
Average
Annual
Limit

Wambo Coal Pty Ltd Wambo Coal Site Specific Particulate Matter Control Best Practice Assessment
Report Number 610.11105.01000-R1 30 August 2012
Draft 2 Page 21
SLR Consulting Australia Pty Ltd
Figure 4 Tapered Element Oscillating Microbalance (TEOM) Results for PM10 – WCPL 2010/2011
Monitoring results for dust deposition are presented in Figure 5 for the period 15 October 2010 to 14 October 2011. Dust deposition gauges D07 and D14 are located on WCPL owned land and therefore the dust deposition criteria do not apply. Site D07 is located near a regularly used internal unsealed road and site D14 is located directly west of the advancing open cut operations.
The results demonstrate that for dust deposition, compliance with the Project Approval Conditions is being achieved on privately owned land. Raw data can be seen in the AEMR (2011) in Appendix 2B.
Figure 5 Dust Deposition Monitoring Results – WCPL 2010/2011
Particulate Matter
AQ01 (Coralie - Wambo Coal site enterance road)
0
10
20
30
40
50
60
70
80
90
100
Jul-10
Aug-1
0
Sep-1
0
Oct-
10
Nov-1
0
Dec-1
0
Jan-1
1
Feb-1
1
Mar-
11
Apr-
11
May-1
1
Jun-1
1
Pa
rtic
ula
te M
atte
r (1
0 m
icro
n)
(ug
/m3)
PM10 Results Yearly Average Annual Limit Daily Limit
Particulate Matter
AQ02 (Wambo Road)
0
10
20
30
40
50
60
70
80
90
100
Jul 10
Aug 1
0
Sep 1
0
Oct
10
Nov 1
0
Dec 1
0
Jan 1
1
Feb 1
1
Mar
11
Apr
11
May 1
1
Jun 1
1
Pa
rtic
ula
te M
atte
r (1
0 m
icro
n)
(ug
/m3)
PM10 Results Yearly Average Annual Limit Daily Limit
Particulate Matter
AQ03 (Thelander)
0
10
20
30
40
50
60
70
80
90
100
Jul 10
Aug 1
0
Sep 1
0
Oct
10
Nov 1
0
Dec 1
0
Jan 1
1
Feb 1
1
Mar
11
Apr
11
May 1
1
Jun 1
1
Pa
rtic
ula
te M
atte
r (1
0 m
icro
n)
(ug
/m3)
PM10 Results Yearly Average Annual Limit Daily Limit
Particulate Matter
AQ04 (Muller)
0
10
20
30
40
50
60
70
80
90
100
Jul-10
Aug-1
0
Sep-1
0
Oct-
10
Nov-1
0
Dec-1
0
Jan-1
1
Feb-1
1
Mar-
11
Apr-
11
May-1
1
Jun-1
1
Pa
rtic
ula
te M
atte
r (1
0 m
icro
n)
(ug
/m3)
PM10 Results Yearly Average Annual Limit Daily Limit
Monthly Deposited Dust Monitoring
Yearly Average
0
2
4
6
8
10
12
D01
D03
D07
D09
D11
D12
D14
D17
D19
D20
D21
D22
D23
D24
D25
D26
g/m
2/m
on
th
Insoluble Solids Ash Residue Project Criteria

Wambo Coal Pty Ltd Wambo Coal Site Specific Particulate Matter Control Best Practice Assessment
Report Number 610.11105.01000-R1 30 August 2012
Draft 2 Page 22
SLR Consulting Australia Pty Ltd
2 IDENTIFICATION OF EXISTING CONTROL MEASURES & EMISSION ESTIMATION
1. Identify, quantify and justify existing measures that are being used to minimise particle
emissions
1.1 Estimate baseline emissions of TSP, PM10 and PM2.5 (tonne per year) from each mining
activity. This estimate must:
Utilise USEPA AP-42 emission estimation techniques (or other method as approved in
writing by the EPA),
Calculate uncontrolled emissions (with no particulate matter controls in place), and
Calculate controlled emissions (with current particulate matter controls in place).
Notes: These particulate matter controls must be clearly identified, quantified and justified
with supporting information. This means adding supporting information and evidence,
including monitoring data, record keeping, management plans and/or operator training.
1.2 Using the results of the controlled emission estimates generated from Step 1.1, rank the mining
activities according to the mass of TSP, PM10 and PM2.5 emitted by each mining activity per
year from highest to lowest.
1.3 Identify the top four mining activities from step 1.2 that contribute the highest emissions of
TSP, PM10 and PM2.5.
2.1 Estimation of Baseline Particulate Emissions
In the estimation of baseline emissions of particulate matter, United States Environmental Protection Agency (USEPA) AP-42, Compilation of Air Pollutant Emission Factors estimation techniques have been utilised, as prescribed in the methodology presented in Appendix A and reproduced above.
AP-42 Chapter 11 (Mineral Products Industry) and AP-42 Chapter 13 (Miscellaneous Sources) have been referenced to estimate emissions from mining activities occurring at the WCPL.
Table 7 presents a summary of the AP-42 reference sections for the various emission factors used in this assessment report.

Wambo Coal Pty Ltd Wambo Coal Site Specific Particulate Matter Control Best Practice Assessment
Report Number 610.11105.01000-R1 30 August 2012
Draft 2 Page 23
SLR Consulting Australia Pty Ltd
Table 7 Particulate Emissions Sources and Relevant USEPA AP-42 Emission Factors
Emissions Source AP-42 Chapter Notes
Blasting Chapter 11.9 Western Surface Coal Mining (1998)
Drilling Chapter 11.9 Western Surface Coal Mining (1998)
Bulldozing coal Chapter 11.9 Western Surface Coal Mining (1998)
Front end loaders and excavators on coal
Chapter 11.9 Western Surface Coal Mining (1998)
Material transfer of coal by conveyor
Loading coal stockpiles Chapter 11.9 Western Surface Coal Mining (1998)
Wind erosion of coal stockpiles Chapter 11.9 Western Surface Coal Mining (1998)
Coal crushing Chapter 11.24 Metallic Minerals Processing (1982) Adopted in the NPI in absence of coal specific factors
Coal screening Chapter 11.24 Metallic Minerals Processing (1982)
Loading coal to trains Chapter 11.9 Western Surface Coal Mining (1998)
Loading coal to trucks Chapter 11.9 Western Surface Coal Mining (1998)
Bulldozing overburden Chapter 11.9 Western Surface Coal Mining (1998)
Front end loaders and excavators on overburden
Chapter 11.9 Western Surface Coal Mining (1998)
Loading and dumping of overburden
Chapter 11.9 Western Surface Coal Mining (1998)
Wind erosion of overburden Chapter 11.9 Western Surface Coal Mining (1998)
Wheel generated particulates on unpaved roads
Chapter 13.2.2 Unpaved Roads (2006)
Graders operating on unpaved roads / overburden
Chapter 11.9 Western Surface Coal Mining (1998)
Appendix B outlines the emission factors used for each activity occurring at WCPL.
A discussion of the annual activity related to each action and the subsequent calculated emission rates of TSP, PM10 and PM2.5 are provided in Section 2.1.1. As required by the EPA, emissions are presented firstly as uncontrolled emissions, and secondly as emissions with controls currently employed in place.
2.1.1 Activity Data
Annual activity data for the activities presented in Table 7 are provided in Table 8 for material handling operations and in Table 9 for wind erosion sources. Information on haul roads has previously been provided in Table 2 and for conveyor systems in Table 3.

Wambo Coal Pty Ltd Wambo Coal Site Specific Particulate Matter Control Best Practice Assessment
Report Number 610.11105.01000-R1 30 August 2012
Draft 2 Page 24
SLR Consulting Australia Pty Ltd
Table 8 Annual Activity Data for Material Handling Operations
Operation / Activity Activity Rate (Annual)
Units Notes
COAL
UG Conveyor to ROM Transfer Pad 14,145,000 tonnes 3 Material transfer points (3 x 4,715,000 tonnes)
Loading Coal to UG Stockpile 4,715,000 tonnes
Loading Coal to Trucks 8,730,000 tonnes Loading trucks in pit
Dumping of ROM Coal at ROM Hopper (80%) 6,984,000 tonnes 80% of ROM Coal
Dumping of ROM Coal at ROM Stockpile (20%) 1,746,000 tonnes 20% of ROM Coal
Conveyor to CHPP 8,730,000 tonnes 100% of ROM Coal
Coal Crushing 8,730,000 tonnes as above
Coal Screening 8,730,000 tonnes as above
Coarse Rejects to Reject Bin (Conveyor) 2,017,000 tonnes 35% of ROM coal and 66% of total reject material
Coarse Rejects to Reject Bin 2,017,000 tonnes as above
Coarse Rejects to Trucks 2,017,000 tonnes as above
Product Coal to Product Stockpile Conveyor 5,675,000 tonnes 65% of ROM coal
Loading Product Coal Stockpile 5,675,000 tonnes as above
Bulldozers at CHPP 4,848 hours
Conveyor to Rail Load Out 6,038,000 tonnes 388,012 tonnes greater than ROM coal extracted. Stockpile capacity of 500,000 tonnes accounts for discrepancy
Loading Trains 6,038,000 as above
OVERBURDEN
Drilling 34,537 holes 34,219 for blast charge, 318 for surface exploration
Blasting 68 blasts Area of blast typically 16,167m2
Loading Overburden to Trucks 66,200,062 tonnes 27,583,359 bcm (density of 2.4 t/m3)
Trucks Dumping Overburden and Coarse Rejects 68,217,062 tonnes as above
Bulldozer on Overburden 210 hours

Wambo Coal Pty Ltd Wambo Coal Site Specific Particulate Matter Control Best Practice Assessment
Report Number 610.11105.01000-R1 30 August 2012
Draft 2 Page 25
SLR Consulting Australia Pty Ltd
Table 9 Annual Activity Data for Wind Erosion Sources
Open Area Total Area (ha)
Active Area (ha)
Emission Factor Applied to Active Area Notes
Highwall Clearance Area 55.7 55.7 Wind Erosion of Exposed Areas (AP-42 Chapter 11.9)
Mulch layer applied
Hunter Pit Tailings Dam 27.1 0.0 Wind Erosion of Exposed Areas (AP-42 Chapter 11.9)
Wet
North East Tailings Dam 24.1 12.0 Wind Erosion of Exposed Areas (AP-42 Chapter 11.9)
Assumed 50% wet
Sarah Marie Dump 42.1 42.1 Wind Erosion of Exposed Areas (AP-42 Chapter 11.9)
RL160 Dump 92.7 92.7 Wind Erosion of Exposed Areas (AP-42 Chapter 11.9)
Rug Dump 44.6 44.6 Wind Erosion of Exposed Areas (AP-42 Chapter 11.9)
Sarah’s Sister Dump 11.9 11.9 Wind Erosion of Exposed Areas (AP-42 Chapter 11.9)
Homestead Pit ROM Stockpile 1.3 1.3 Wind Erosion of Active Storage Pile (AP-42 Chapter 11.9)
ROM Stockpile at CHPP 4.0 4.0 Wind Erosion of Active Storage Pile (AP-42 Chapter 11.9)
Product Coal Stockpile 8.4 8.4 Wind Erosion of Active Storage Pile (AP-42 Chapter 11.9)

Wambo Coal Pty Ltd Wambo Coal Site Specific Particulate Matter Control Best Practice Assessment
Report Number 610.11105.01000-R1 30 August 2012
Draft 2 Page 26
SLR Consulting Australia Pty Ltd
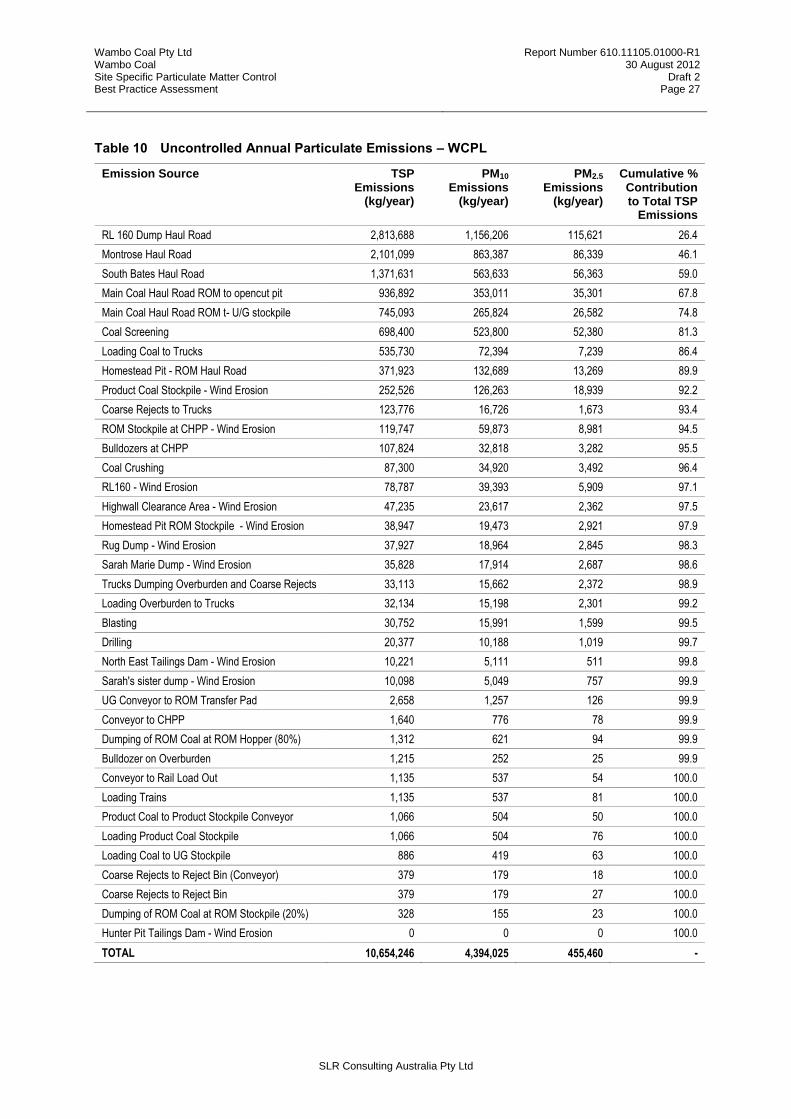
2.1.2 Uncontrolled Particulate Emissions
Using the emission factors calculated in Appendix B and the annual activity data presented in Section 2.1.1, the annual (uncontrolled) particulate emissions from WCPL are presented in Table 10 and graphically in Figure 6.
Wambo Coal Pty Ltd Wambo Coal Site Specific Particulate Matter Control Best Practice Assessment
Report Number 610.11105.01000-R1 30 August 2012
Draft 2 Page 27
SLR Consulting Australia Pty Ltd
Table 10 Uncontrolled Annual Particulate Emissions – WCPL
Emission Source TSP Emissions
(kg/year)
PM10 Emissions
(kg/year)
PM2.5 Emissions
(kg/year)
Cumulative % Contribution to Total TSP
Emissions
RL 160 Dump Haul Road 2,813,688 1,156,206 115,621 26.4
Montrose Haul Road 2,101,099 863,387 86,339 46.1
South Bates Haul Road 1,371,631 563,633 56,363 59.0
Main Coal Haul Road ROM to opencut pit 936,892 353,011 35,301 67.8
Main Coal Haul Road ROM t- U/G stockpile 745,093 265,824 26,582 74.8
Coal Screening 698,400 523,800 52,380 81.3
Loading Coal to Trucks 535,730 72,394 7,239 86.4
Homestead Pit - ROM Haul Road 371,923 132,689 13,269 89.9
Product Coal Stockpile - Wind Erosion 252,526 126,263 18,939 92.2
Coarse Rejects to Trucks 123,776 16,726 1,673 93.4
ROM Stockpile at CHPP - Wind Erosion 119,747 59,873 8,981 94.5
Bulldozers at CHPP 107,824 32,818 3,282 95.5
Coal Crushing 87,300 34,920 3,492 96.4
RL160 - Wind Erosion 78,787 39,393 5,909 97.1
Highwall Clearance Area - Wind Erosion 47,235 23,617 2,362 97.5
Homestead Pit ROM Stockpile - Wind Erosion 38,947 19,473 2,921 97.9
Rug Dump - Wind Erosion 37,927 18,964 2,845 98.3
Sarah Marie Dump - Wind Erosion 35,828 17,914 2,687 98.6
Trucks Dumping Overburden and Coarse Rejects 33,113 15,662 2,372 98.9
Loading Overburden to Trucks 32,134 15,198 2,301 99.2
Blasting 30,752 15,991 1,599 99.5
Drilling 20,377 10,188 1,019 99.7
North East Tailings Dam - Wind Erosion 10,221 5,111 511 99.8
Sarah's sister dump - Wind Erosion 10,098 5,049 757 99.9
UG Conveyor to ROM Transfer Pad 2,658 1,257 126 99.9
Conveyor to CHPP 1,640 776 78 99.9
Dumping of ROM Coal at ROM Hopper (80%) 1,312 621 94 99.9
Bulldozer on Overburden 1,215 252 25 99.9
Conveyor to Rail Load Out 1,135 537 54 100.0
Loading Trains 1,135 537 81 100.0
Product Coal to Product Stockpile Conveyor 1,066 504 50 100.0
Loading Product Coal Stockpile 1,066 504 76 100.0
Loading Coal to UG Stockpile 886 419 63 100.0
Coarse Rejects to Reject Bin (Conveyor) 379 179 18 100.0
Coarse Rejects to Reject Bin 379 179 27 100.0
Dumping of ROM Coal at ROM Stockpile (20%) 328 155 23 100.0
Hunter Pit Tailings Dam - Wind Erosion 0 0 0 100.0
TOTAL 10,654,246 4,394,025 455,460 -

Wambo Coal Pty Ltd Wambo Coal Site Specific Particulate Matter Control Best Practice Assessment
Report Number 610.11105.01000-R1 30 August 2012
Draft 2 Page 28
SLR Consulting Australia Pty Ltd
Figure 6 Uncontrolled Annual Particulate Emissions – WCPL

Wambo Coal Pty Ltd Wambo Coal Site Specific Particulate Matter Control Best Practice Assessment
Report Number 610.11105.01000-R1 30 August 2012
Draft 2 Page 29
SLR Consulting Australia Pty Ltd

Wambo Coal Pty Ltd Wambo Coal Site Specific Particulate Matter Control Best Practice Assessment
Report Number 610.11105.01000-R1 30 August 2012
Draft 2 Page 30
SLR Consulting Australia Pty Ltd
2.2 Existing Control Measures
WCPL operate an Air Quality Management Plan with the measures identified in the following sections being implemented as part of that plan (refer Section 3.2.1, AEMR, 2011) p40). Where relevant, emission control factors for each dust suppression activity are provided. Control factors are sourced from a number of publications including:
Katestone Environmental 2010, “NSW Coal Mining Benchmarking Study: International Best Practice Measures to Prevent and/or Minimise Emissions of Particulate Matter from Coal Mining”, December 2010.
Australian Government Department of Sustainability, Environment, Water, Population and Communities 2012, “National Pollutant Inventory Emission Estimation Technique for Mining”, Version 3.1, January 2012.
Countess Environmental 2006, “WRAP Fugitive Dust Handbook”, September, 2006.
US Department of Health and Human Services 2012, “Dust Control Handbook for Industrial Minerals Mining and Processing”, January 2012.
It is acknowledged that emission control factors can be highly variable, and are generally based on site and material specific field trials. Where possible, the entire range of control factors for each relevant activity from the references above are presented with the most appropriate factor, taking into consideration the source of the data, being taken forward for application within this report.
Where a considerable level of uncertainty exists, or where the emission source has the potential to contribute a significant percentage to the site dust balance, further work is proposed.
2.2.1 Behaviour and Operation Modification
Induction training to all employees highlighting their responsibility to limit the level of dust produced.
Modifying mining operations during unfavourable weather conditions to reduce dust generation
There are no definitive rules governing the meteorological conditions under which mining operations are modified at WCPL. Rather, WCPL operates four dust monitoring stations (refer Section 1.6) that provide real time information to Downer EDI Mining operational personnel. This is achieved by an automatically produced SMS alert being sent from dust monitors to the Open Cut Examiner (OCE) in the event that high dust levels are detected.
Dust alarms are triggered when the 15 minute PM10 results are above 90µg/m3 for two consecutive 15
minute periods. If the 15 minute results come below 75µg/m3 and then go above 90µg/m
3 again it is
considered to be a new dust alarm. The alarms filter out wind conditions so alarms are only received when the wind is blowing from the direction of Wambo’s operations.
In the event that an SMS Alert for high dust level is received by the OCE or excessive dust is noted on site but an SMS Dust Alert has not been received the following steps are required to be taken be taken:
Identify the major sources of dust
Apply appropriate actions listed in ‘Dust Reduction Methods’:
Assign water cart to high priority areas
Reduce speed of trucks
Utilise lower RL dumps
Stop operations in high exposure areas i.e. topsoil loading and dumping, rehab areas

Wambo Coal Pty Ltd Wambo Coal Site Specific Particulate Matter Control Best Practice Assessment
Report Number 610.11105.01000-R1 30 August 2012
Draft 2 Page 31
SLR Consulting Australia Pty Ltd
Minimise areas of operation (shut down a circuit/s)
Stop all operations
Record information in 4842-SE-F1027 Dust Management Response located in the OCE office.
This SWP and Dust Management Record form are included as Appendix D.
Given that no particular wind conditions are identified as being triggers for modification of activities, particulate control efficiencies cannot be calculated.
WCPL will review Dust Management Record forms and perform an analysis to identify if particular meteorological conditions result in dust alarms. Where conditions are identified as being likely to cause dust alarms, WCPL will provide the OCE with warnings when such meteorological conditions are anticipated.
Constraints on blasting operations to reduce impact of immediate neighbours (e.g. re-scheduling blasts when wind blowing towards immediate neighbours).
Implementing speed limits on roadways.
Haul road speeds are limited to 60 km/hr at WCPL. The USDHHS (2012) provide information that reducing vehicle speeds can reduce the potential generation of PM10 particles by approximately:
58% when speeds reduce from 40 km/hr to 16 km/hr.
42% when speeds reduce from 40 km/hr to 24 km/hr.
44% when speed limited to 40 km/hr.
Katestone Environmental (2010) reference the following effectiveness for vehicle speed restrictions on unpaved roads:
40% to 75% when speeds reduce from 75 km/hr to 50 km/hr
50% to 85% when speeds reduce from 65 km/hr to 30 km/hr
2.2.2 Rehabilitation
Rehabilitation of disturbed land on a progressive basis to reduce total disturbed area
In the AEMR reporting period (2010/2011), a total of 14.2 ha of land was rehabilitated (AEMR, 2011 p82).
Published particulate emission control factors following the rehabilitation of land are presented in DSEWPC (2012) as:
30% for primary rehabilitation.
40% for vegetation established but not demonstrated to be self-sustaining.
60% for secondary rehabilitation.
99% for revegetation.
100% for fully rehabilitated (release) vegetation.
Countess Environmental (1996) identify particulate control efficiencies for agricultural land (taken to be overburden type) as:
90% for cover crops.

Wambo Coal Pty Ltd Wambo Coal Site Specific Particulate Matter Control Best Practice Assessment
Report Number 610.11105.01000-R1 30 August 2012
Draft 2 Page 32
SLR Consulting Australia Pty Ltd
Rehabilitation monitoring is performed using the Ecosystem Function Analysis (EFA) tool. The data derived from the monitoring program provides a robust platform against which the effectiveness of rehabilitation techniques can be assessed and where required, amended. The purpose of the assessment is to determine whether rehabilitated areas are on a trajectory toward self sustainability and functionality (AEMR, 2011 p86). A summary of the EFA results can be found in the AEMR, p86.
Keeping disturbance areas to a minimum by minimising the disturbance in advance of mining operations until mining is due to commence in the area and clearly defining roads.
Revegetating topsoil stockpiles which are not planned to be used for over three months.
2.2.3 Dust Suppression
Dust suppression equipment is fitted and operated on drills
Dust skirts are used on drills with water injection use to minimise dust emissions. According to WCPL, 80% of holes are drilled in pit.
Particulate control efficiencies for the use of water when drilling and are dependent on the water flow, although Katestone Environmental (2010) quote control efficiencies of between 3.1% and 96.3% which is supported by the USDHHS (2012) which quotes wet drilling as achieving up to 96% dust control efficiency. DSEWPC (2012) quote a control efficiency of 70% when using water sprays during drilling operations.
The installation of a dust skirt on drill rigs is predicted to afford a 63% to 88% reduction in respirable particulate matter emissions from drill rigs (Katestone Environmental, 2010).
Performing drilling in pit will result in a reduction in particulate emissions due to shielding from the ambient wind. DSEWPC (2012) quote control efficiency for operations occurring in pit of 50% for TSP and 5% for PM10 emissions.
Designing blast holes with stemming to provide optimum confinement of the blast charge
Particulate emission control effectiveness due to appropriate stemming of blast holes is not quantified although is identified in all references as representing best practice.
Regular servicing of water carts for effective road watering and continual operation
Use of additional contractor water trucks to water frequently used roads around the CHPP as required
Operation of two water truck fill points during the reporting period to reduce the time between road watering
The use of water trucks on unpaved haul roads is discussed widely in the literature, due to its widespread use as a primary control of dust emissions at mine sites. Detailed discussion of wet suppression of unpaved roads is provided in Countess Environmental (2006). Particulate control efficiency is heavily dependent upon the time taken for the road to dry following water application. In turn, this is dependent upon:
The quantity of water (per unit road surface area) added during each application.
The period of time between applications.
The weight, speed and number of vehicles travelling over the watered road during the period between applications.
Meteorological conditions (temperature, wind speed, cloud cover etc.) that affect evaporation during the period.

Wambo Coal Pty Ltd Wambo Coal Site Specific Particulate Matter Control Best Practice Assessment
Report Number 610.11105.01000-R1 30 August 2012
Draft 2 Page 33
SLR Consulting Australia Pty Ltd
Figure 7 presents a simple relationship between haul road moisture content and instantaneous particulate control efficiency (Countess Environmental, 2006). The moisture ratio (M) is derived by dividing the surface moisture content of the watered road by the surface moisture content of the unwatered road. As the road surface dries, M is reduced and thus the particulate control efficiency is also reduced.
Figure 7 Watering Control Effectiveness for Unpaved Roads
DSEWPC (2012) provides generic particulate control efficiencies associated with haul road watering:
50% for Level 1 watering (2L/m2/hr).
75% for Level 2 watering (>2L/m2/hr).
Particulate control efficiencies are quoted in USDHHS (2012) for a range of trials as:
95% control for TSP for an application rate of 0.41 L/m2 for half an hour after watering.
74% control for TSP for an application rate of 1.5 L/m2 for 3 to 4 hours after watering.
However, as noted in US DHHS (2012), the control efficiency is highly variable and strongly related to road material type, traffic and weather conditions.
An empirical model for the calculation of the control efficiency of haul road watering has been developed by USEPA (1987) and uses the formula:
(
)
Where:
= potential average hourly daytime evaporation rate (mm/hr) = average hourly daytime traffic rate (veh/hr) = time between applications (hr) = application intensity (L/m
2)
For operations at the Wambo Coal Mine, four water trucks are in use, two with a capacity of 50,000 L and two with a capacity of 70,000 L. Information on the annual water use on all haul roads has been provided by WCPL and is provided in Table 11. More detailed information on water use on each haul road is provided in Table 12.
Wambo Coal Pty Ltd Wambo Coal Site Specific Particulate Matter Control Best Practice Assessment
Report Number 610.11105.01000-R1 30 August 2012
Draft 2 Page 34
SLR Consulting Australia Pty Ltd
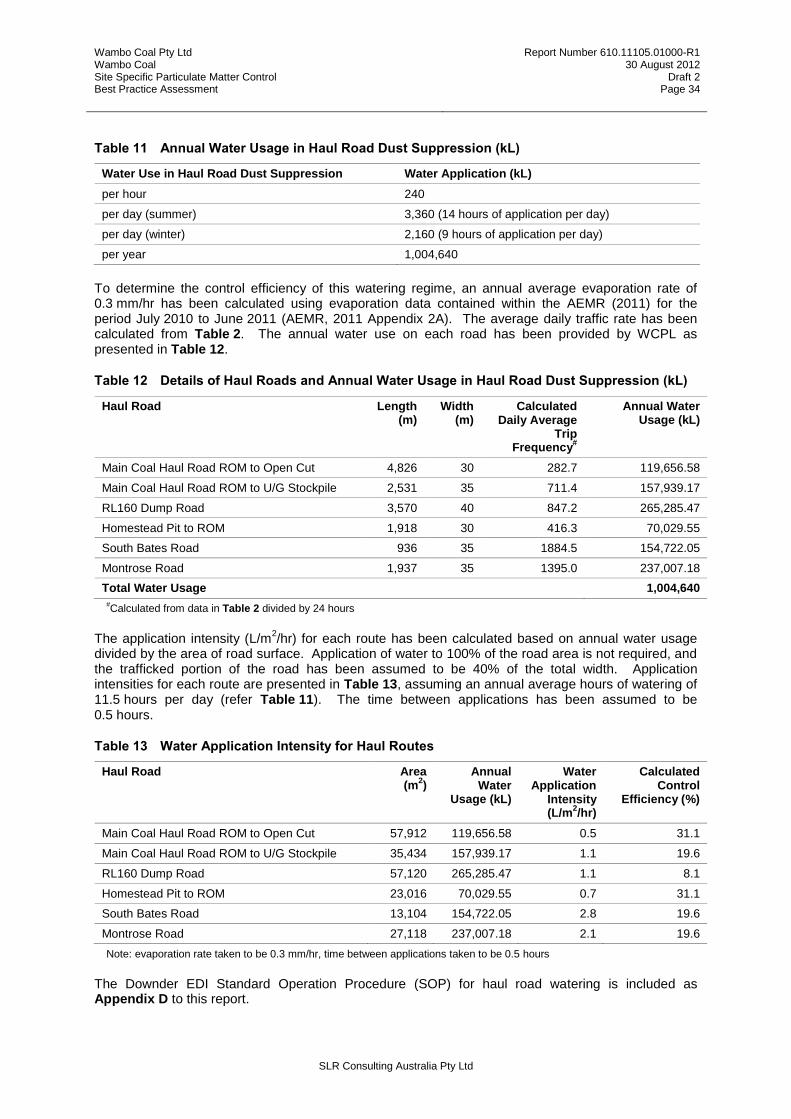
Table 11 Annual Water Usage in Haul Road Dust Suppression (kL)
Water Use in Haul Road Dust Suppression Water Application (kL)
per hour 240
per day (summer) 3,360 (14 hours of application per day)
per day (winter) 2,160 (9 hours of application per day)
per year 1,004,640
To determine the control efficiency of this watering regime, an annual average evaporation rate of 0.3 mm/hr has been calculated using evaporation data contained within the AEMR (2011) for the period July 2010 to June 2011 (AEMR, 2011 Appendix 2A). The average daily traffic rate has been calculated from Table 2. The annual water use on each road has been provided by WCPL as presented in Table 12.
Table 12 Details of Haul Roads and Annual Water Usage in Haul Road Dust Suppression (kL)
Haul Road Length (m)
Width (m)
Calculated Daily Average
Trip Frequency
#
Annual Water Usage (kL)
Main Coal Haul Road ROM to Open Cut 4,826 30 282.7 119,656.58
Main Coal Haul Road ROM to U/G Stockpile 2,531 35 711.4 157,939.17
RL160 Dump Road 3,570 40 847.2 265,285.47
Homestead Pit to ROM 1,918 30 416.3 70,029.55
South Bates Road 936 35 1884.5 154,722.05
Montrose Road 1,937 35 1395.0 237,007.18
Total Water Usage 1,004,640
#Calculated from data in Table 2 divided by 24 hours
The application intensity (L/m2/hr) for each route has been calculated based on annual water usage
divided by the area of road surface. Application of water to 100% of the road area is not required, and the trafficked portion of the road has been assumed to be 40% of the total width. Application intensities for each route are presented in Table 13, assuming an annual average hours of watering of 11.5 hours per day (refer Table 11). The time between applications has been assumed to be 0.5 hours.
Table 13 Water Application Intensity for Haul Routes
Haul Road Area (m
2)
Annual Water
Usage (kL)
Water Application
Intensity (L/m
2/hr)
Calculated Control
Efficiency (%)
Main Coal Haul Road ROM to Open Cut 57,912 119,656.58 0.5 31.1
Main Coal Haul Road ROM to U/G Stockpile 35,434 157,939.17 1.1 19.6
RL160 Dump Road 57,120 265,285.47 1.1 8.1
Homestead Pit to ROM 23,016 70,029.55 0.7 31.1
South Bates Road 13,104 154,722.05 2.8 19.6
Montrose Road 27,118 237,007.18 2.1 19.6
Note: evaporation rate taken to be 0.3 mm/hr, time between applications taken to be 0.5 hours
The Downder EDI Standard Operation Procedure (SOP) for haul road watering is included as Appendix D to this report.

Wambo Coal Pty Ltd Wambo Coal Site Specific Particulate Matter Control Best Practice Assessment
Report Number 610.11105.01000-R1 30 August 2012
Draft 2 Page 35
SLR Consulting Australia Pty Ltd
Operation of water sprays during raw coal unloading at the ROM dump hopper.
Watering is the principal means of dust suppression at Wambo Coal Mine. Various emission control factors are quoted in literature, and include:
70% for water sprays during truck dumping operations (DSEWPC, 2012).
62% for continuous water spray at transfer point (Countess Environmental, 2006).
50% for water sprays on ROM bin (Katestone Environmental, 2010).
The particulate control efficiency of 62% taken from Countess Environmental (2006) uses the USEPA AP42 emission factor for batch loading and calculates the reduction in emissions due to an increase in the moisture content of the loaded material following water spraying. No information is available as to the change in moisture content of coal during dumping into the ROM hopper. However, for the purposes of this assessment, it is estimated that moisture content is increased by 2% during hopper loading (from 6.5% to 8.5%) following water spraying.
Inclusion of this moisture content increase results in a particulate control efficiency (using site specific wind speed measurements) of 45%.
To validate this assumption, WCPL will perform an assessment of coal moisture content prior to, during and following ROM dump hopper loading.
Cleaning up coal spillage around the CHPP to prevent dust.
Fitting dust suppression systems at transfer points where necessary.
As part of this assessment, a site audit was conducted in January 2012 to identify and verify the current dust control measures being implemented at WCPL. A summary of the existing control measures identified as currently being implemented at the WCPL is provided in Table 14.
Table 14 Control Factors Assumed for Existing Control Measures
Dust Mitigation Measure Applied Control Factor Additional Information
Induction Training NA No quantification can be made
Modification of operations (including blasting) in unfavourable weather conditions
NA No quantification can be made
Speed limits 40% Taken to be the lower quoted efficiency from Katestone Environmental (2010) for a reduction in speed from 75 km/hr to 50 km/hr
Rehabilitation of disturbed land 60% Taken to be for secondary revegetation
Minimising disturbed areas NA No quantification can be made
Revegetating topsoil stockpiles 30% Taken to be for primary revegetation
Dust suppression equipment on drills
96% From USDHHS (2012) for wet drilling. Assumed maximum quoted control efficiency due to additional use of dust skirts.
Blast hole stemming NA No quantification can be made
Haul Road Watering Between 8% and 31% Refer Table 13
Servicing of water carts NA No quantification can be made
Use of additional water trucks as NA No quantification can be made

Wambo Coal Pty Ltd Wambo Coal Site Specific Particulate Matter Control Best Practice Assessment
Report Number 610.11105.01000-R1 30 August 2012
Draft 2 Page 36
SLR Consulting Australia Pty Ltd
Dust Mitigation Measure Applied Control Factor Additional Information
required around CHPP
Operation of two water truck fill points
NA No quantification can be made
Water sprays on ROM dump hopper
45% Assuming a 2% increase in moisture content during spraying
Cleaning up coal spillage at CHPP NA No quantification can be made
Dust suppression systems at transfer points
NA No information available as
In addition to the dust management measures identified above, a progressive rehabilitation program is also undertaken at the WCPL (refer Section 5 of the AEMR, 2011 p82). Short term and long term measures are outlined with objectives in relation to air quality concerned with the minimisation of wind induced erosion.
Presented in Table 15 are the calculated particulate emissions from WCPL with current emission controls applied. These are also presented graphically in Figure 8. A comparison of the total emissions by source (controlled and uncontrolled) are presented in Figure 9.

Wambo Coal Pty Ltd Wambo Coal Site Specific Particulate Matter Control Best Practice Assessment
Report Number 610.11105.01000-R1 30 August 2012
Draft 2 Page 37
SLR Consulting Australia Pty Ltd
Table 15 Controlled Annual Particulate Emissions – WCPL
Emission Source TSP Emissions
(kg/year)
PM10 Emissions
(kg/year)
PM2.5 Emissions
(kg/year)
Cumulative % Contribution to Total TSP
Emissions
RL 160 Dump Haul Road 1,551,171 637,410 63,741 29.1
Montrose Haul Road 1,013,538 416,485 41,648 48.1
South Bates Haul Road 661,619 271,874 27,187 60.5
Loading Coal to Trucks 535,730 72,394 7,239 70.6
Main Coal Haul Road ROM to opencut pit 387,410 145,972 14,597 77.9
Main Coal Haul Road ROM t- U/G stockpile 359,400 128,222 12,822 84.6
Homestead Pit - ROM Haul Road 153,791 54,867 5,487 87.5
Product Coal Stockpile - Wind Erosion 126,263 63,132 9,470 89.8
Coarse Rejects to Trucks 61,888 8,363 836 91.0
RL160 - Wind Erosion 78,787 39,393 5,909 92.5
ROM Stockpile at CHPP - Wind Erosion 59,873 29,937 4,491 93.6
Bulldozers at CHPP 59,303 18,050 1,805 94.7
Highwall Clearance Area - Wind Erosion 47,235 23,617 2,362 95.6
Homestead Pit ROM Stockpile - Wind Erosion 38,947 19,473 2,921 96.3
Rug Dump - Wind Erosion 37,927 18,964 2,845 97.1
Sarah Marie Dump - Wind Erosion 35,828 17,914 2,687 97.7
Loading Overburden to Trucks 32,134 15,198 2,301 98.3
Blasting 30,752 15,991 1,599 98.9
Trucks Dumping Overburden and Coarse Rejects 29,802 14,095 2,134 99.5
North East Tailings Dam - Wind Erosion 10,221 5,111 511 99.7
Sarah's sister dump - Wind Erosion 10,098 5,049 757 99.8
UG Conveyor to ROM Transfer Pad 2,658 1,257 126 99.9
Bulldozer on Overburden 1,215 252 25 99.9
Loading Coal to UG Stockpile 886 419 63 99.9
Dumping of ROM Coal at ROM Hopper (80%) 722 341 52 99.9
Loading Product Coal Stockpile 587 277 42 100.0
Conveyor to CHPP 492 233 23 100.0
Drilling 489 391 39 100.0
Conveyor to Rail Load Out 340 161 16 100.0
Loading Trains 340 161 24 100.0
Product Coal to Product Stockpile Conveyor 160 76 8 100.0
Dumping of ROM Coal at ROM Stockpile (20%) 180 85 13 100.0
Coarse Rejects to Reject Bin (Conveyor) 114 54 5 100.0
Coarse Rejects to Reject Bin 57 27 4 100.0
Coal Crushing 0 0 0 100.0
Coal Screening 0 0 0 100.0
Hunter Pit Tailings Dam - Wind Erosion 0 0 0 100.0
TOTAL 5,329,957 2,025,245 213,792 -

Wambo Coal Pty Ltd Wambo Coal Site Specific Particulate Matter Control Best Practice Assessment
Report Number 610.11105.01000-R1 30 August 2012
Draft 2 Page 38
SLR Consulting Australia Pty Ltd
Figure 8 Controlled Annual Particulate Emissions – Wambo Coal Mine

Wambo Coal Pty Ltd Wambo Coal Site Specific Particulate Matter Control Best Practice Assessment
Report Number 610.11105.01000-R1 30 August 2012
Draft 2 Page 39
SLR Consulting Australia Pty Ltd
Figure 9 Comparison of Uncontrolled versus Controlled Particulate Emissions – Wambo Coal Mine

Wambo Coal Pty Ltd Wambo Coal Site Specific Particulate Matter Control Best Practice Assessment
Report Number 610.11105.01000-R1 30 August 2012
Draft 2 Page 40
SLR Consulting Australia Pty Ltd
Particulate emissions are presented by source group (wind erosion, haul roads, material handling and extraction and CHPP and coal loading operations at the CHPP and product stockpile areas) in Table 16.
Table 16 Comparison of Uncontrolled and Controlled Particulate Emissions
Emission Source Group Uncontrolled Emissions (kg/annum) Controlled Emissions (kg/annum)
TSP PM10 PM2.5 TSP PM10 PM2.5
Wind Erosion 631,315 315,657 45,912 445,178 222,589 31,952
Haul Roads 8,340,325 3,334,750 333,475 4,126,929 1,654,830 165,483
Material Handling and Extraction 656,865 131,361 14,745 633,666 119,998 13,528
CHPP and Coal Load Out 1,025,741 612,256 61,328 124,184 27,828 2,829
TOTAL 10,654,246 4,394,025 455,460 5,329,957 2,025,245 213,792

Wambo Coal Pty Ltd Wambo Coal Site Specific Particulate Matter Control Best Practice Assessment
Report Number 610.11105.01000-R1 30 August 2012
Draft 2 Page 41
SLR Consulting Australia Pty Ltd
Figure 10 Representation of Major Controlled Particulate Emission Sources -WCPL

Wambo Coal Pty Ltd Wambo Coal Site Specific Particulate Matter Control Best Practice Assessment
Report Number 610.11105.01000-R1 30 August 2012
Draft 2 Page 42
SLR Consulting Australia Pty Ltd
2.3 Ranking of Mining Activities and Identification of Top Four PM Sources
NSW EPA requirements for the assessment of particulate control measures are provided in Appendix A. This advice requires the top four controlled particulate emissions sources are assessed for the feasibility of further control measures being applied.
However, further advice from the EPA has indicated that these top four sources should represent a significant proportion of mine emissions. Within this report, the assessment of further control measures has been applied to all sources which cumulatively represent 95% of total site emissions (of TSP). These sources, and the corresponding emission totals, are presented in Table 17. Those data cover the broad emission sources of haul roads, wind erosion from exposed areas and storage piles, the use of bulldozers on coal and the loading of trucks with coal and coarse reject material at the CHPP.
Potential control measures to be applied to these sources are discussed in detail in Section 3.
Table 17 Controlled Particulate Matter Sources Representing 95% of Wambo Coal Mine TSP Emissions
Emission Source TSP Emissions
(kg/year)
PM10 Emissions
(kg/year)
PM2.5 Emissions
(kg/year)
Cumulative % Contribution to Total TSP
Emissions
RL 160 Dump Haul Road 1,551,171 637,410 63,741 29.1
Montrose Haul Road 1,013,538 416,485 41,648 48.1
South Bates Haul Road 661,619 271,874 27,187 60.5
Loading Coal to Trucks 535,730 72,394 7,239 70.6
Main Coal Haul Road ROM to opencut pit 387,410 145,972 14,597 77.9
Main Coal Haul Road ROM to U/G stockpile 359,400 128,222 12,822 84.6
Homestead Pit - ROM Haul Road 153,791 54,867 5,487 87.5
Product Coal Stockpile - Wind Erosion 126,263 63,132 9,470 89.8
Coarse Rejects to Trucks 61,888 8,363 836 91.0
RL160 - Wind Erosion 78,787 39,393 5,909 92.5
ROM Stockpile at CHPP - Wind Erosion 59,873 29,937 4,491 93.6
Bulldozers at CHPP 59,303 18,050 1,805 94.7

Wambo Coal Pty Ltd Wambo Coal Site Specific Particulate Matter Control Best Practice Assessment
Report Number 610.11105.01000-R1 30 August 2012
Draft 2 Page 43
SLR Consulting Australia Pty Ltd
3 POTENTIAL CONTROL MEASURES
2. Identify, quantify and justify best practice measures that could be used to minimise particle
emissions
2.1 For each of the top four activities identified in step 1.3, identify the measures that could be
implemented to reduce emissions, taking into consideration:
The findings of Katestone (June 2011) “NSW coal mining benchmarking study –
international best practice measures to prevent and/or minimise emissions of particulate
matter from coal mining”,
Any other relevant published information, and
Any relevant industry experience from either Australia or overseas.
2.2 For each of the top four activities identified in step 1.3, estimate the emissions of TSP, PM10
and PM2.5 from each mining activity after applying the measures identified in step 2.1.
Current particulate matter controls being used at the mine must be clearly identified, quantified and
justified. This means adding supporting information and evidence, including monitoring data,
recorded keeping, management plans and/or operator training.
The emission reductions quoted within this Section are generic published control factors which do not take into account the specific nature of operations at Wambo Coal Mine. In the absence of costly site specific trials for each control measure being available, these generic factors are used to guide the selection of control measures which may be broadly appropriate for further investigation or application at the site.
Following an assessment of the feasibility of each measure (refer Section 4) some control measures are taken forward for an assessment of costs and benefits. Where a measure is identified as potentially providing particulate emissions reductions for a source at an acceptable cost, the implementation of the measure is committed to by WCPL, following site specific trials of the measure. These trials are essential and are proposed to:
1 Confirm current particulate emissions from the source in question.
2 Confirm the potential particulate emissions reductions following control measure implementation.
It is not considered to be appropriate to commit to widespread implementation of potentially costly and ineffective particulate control measures on the basis of non-site specific data.
Trials of each control measure will be implemented within 6 months of report submission, and a reassessment of the likely emission reductions afforded by each measure will be performed. Such reassessment will include field trials and comprehensive data collection and analysis.
Where measures are still identified as providing significant emission reductions at acceptable cost following these field trials, these will be implemented on a wider scale.
3.1 Haul Roads
Options for the control of dust emissions from unpaved haul roads fall into the following three categories:
Vehicle restrictions that limit the speed, weight or number of vehicles on the road.
Surface improvement by measures such as (a) paving or (b) adding gravel or slag to a dirt road.
Surface treatment such as watering or treatment with chemical dust suppressants.

Wambo Coal Pty Ltd Wambo Coal Site Specific Particulate Matter Control Best Practice Assessment
Report Number 610.11105.01000-R1 30 August 2012
Draft 2 Page 44
SLR Consulting Australia Pty Ltd
The applicability of the above control methods varies significantly due to the costs of installing and operating the various options, the timing of the implementation of the controls (for example at planning stage or applied retrospectively when the mine is operating) and the scale of the mining operation.
For example, vehicle restrictions that are considered at the mine planning phase might be relatively easy to apply, such as the replacement of a large number of small haul trucks with a smaller fleet of larger trucks, or other considerations such as upward facing vehicle exhausts. However, implementation of these control options retrospectively during mine operation would represent a significant capital expenditure. Vehicle speed restrictions may offer an effective control, but may pose a logistical or economic constraint if it restricts the transport of materials in the mine and may be difficult to manage and enforce.
Clearly, replacement of haul trucks with automated material handling systems, such as conveyors may offer a significant opportunity to reduce particulate emissions, if feasible.
The improvement of the road structure using non-sealed surfaces (such as gravelled surfaces) or substrata design (such as design to limit water penetration and pooling, and reduced surface wear through design of cambers and corners) are easier to implement during the planning phases rather than retrofitted improvements as they may require site planning considerations including the location / configuration of plant and processes to be altered. The use of non-sealed surfaces may require significant maintenance, particularly during adverse weather conditions or heavily trafficked periods. Surface improvements may not be cost-effective with heavy haul vehicles that require high-grade engineered road structures to carry the load without disintegration of the road structure.
Surface watering is a commonly applied control option, however the availability of water supplies may represent a significant constraint to its effective use, particularly during peak water demand periods such as during periods of high winds and/or prolonged dry episodes. The use of chemical suppressants or surface binding agents may offer enhanced dust control and may additionally reduce the volume, rate and/or frequency of water applications for dust suppression. In some instances, watering after the application of chemical suppressants may reduce the efficacy of the overall dust control offered by the chemical suppressants or water if applied independently of each other. Generally, chemical additives and suppressants offer improved dust control efficiency than water, but this generalisation may not be true in all situations, for example along temporary roads.
A summary of the potential control measures for minimising particulate emissions from haul roads and the corresponding estimate of their effectiveness is provided in Table 18 (Katestone, 2010).

Wambo Coal Pty Ltd Wambo Coal Site Specific Particulate Matter Control Best Practice Assessment
Report Number 610.11105.01000-R1 30 August 2012
Draft 2 Page 45
SLR Consulting Australia Pty Ltd
Table 18 Best Practice Control Measures - Haul Roads
Control Type Control Measure Effectiveness
Vehicle Restrictions Reduction from 75 km/hr to 50 km/hr 40-75
Reduction from 65 km/hr to 30 km/hr 50-85
Surface Improvements Pave the surface >90%
Low silt aggregate 30%
Oil and double chip surface 80%
Surface Treatments Watering (standard procedure) 10-74%
Watering Level 2 (>2 l/m²/hr) 75%
Watering twice a day for industrial unpaved road 55%
Hygroscopic salts1 Av. 45% over 14 days
82% within 2 weeks
Lignosulphonates 66-70% over 23 days
Polymer emulsions 70% over 58 days
Tar and bitumen emulsions 70% over 20 days
Other Use larger vehicles rather than smaller vehicles to minimise number of trips
90t to 220t: 40% 2
140t to 220t: 20%2
140t to 360t: 45% 2
Use conveyors in place of haul roads >95%
Note: 1 Use of hygroscopic salts can also act to extend the required time between watering by 33% to 50% (USDHHS, 2012)
2 Reductions achieved by the use of larger vehicles, conveyors and lower grader speeds have been calculated from the emission factors for these activities
SOURCE: Katestone (2010), Table 66
3.2 Wind Erosion
3.2.1 Exposed Areas and Overburden Emplacements
To control the generation and/or propagation of particulate emissions due to wind erosion, the following techniques have been identified, including those proposed as options in the Katestone report:
Minimise pre-strip areas as far as practicable.
Minimise out-of-pit dumping and maximise in-pit dumping to ensure that overburden dumps have shielding from the prevailing wind and the pit offers as much retention of liberated dust as possible.
Sealing of exposed surfaces through paving.
Providing upgraded non-sealed surfaces (e.g. gravel) to reduce surface fines content and to reduce the surface wind speed.
Fencing, bunding or shelterbelts to reduce near-surface wind speed and the resultant wind-shear velocity across open areas and/or overburden storage piles.
The temporary revegetation of exposed areas to minimise emissions of particulate matter from areas that may be exposed for an extended period of time.
Rehabilitation of land after use by revegetation and land contouring to produce the final post-mining land form.
Improved housekeeping, including the rapid and effective clean-up of material spillages.

Wambo Coal Pty Ltd Wambo Coal Site Specific Particulate Matter Control Best Practice Assessment
Report Number 610.11105.01000-R1 30 August 2012
Draft 2 Page 46
SLR Consulting Australia Pty Ltd
Surface watering to reduce weathering through increased soil particle cohesion, and the suppression of dust emissions.
The addition of chemical suppressants to minimise surface dust emission (‘lift-off’).
A summary of the potential control measures for minimising particulate emissions from wind erosion in exposed areas, and their effectiveness, is provided in Table 19, reproduced from Katestone (2011).
Table 19 Best Practice Control Measures – Wind Erosion of Exposed Areas
Control Type Control Measure Effectiveness1
Avoidance Minimise pre-strip. EMP should specify a benchmark for optimal performance and report annually against benchmark
100% per m2 of pre-strip avoided
Surface stabilisation Watering 50%
Chemical suppressants 70%
84%
Paving and cleaning >95%
Apply gravel to stabilise disturbed open areas 84%
Rehabilitation. EMP should specify a rehabilitation goal and report annually against progress to meeting goal.
99%
Wind speed reduction Fencing, bunding, shelterbelts or in-pit dump. Height should be greater than the height of the erodible surface
30%
70-80%
Vegetative ground cover 70%
Note 1 In some instances, the respective control has varying control efficiencies that are referenced through independent studies, and the table represents a simplified summary of those studies.
SOURCE: Katestone (2011), Table 71
3.2.2 Coal Stockpiles
Stockpiles of coal provide a source (often elevated) for the potential generation of wind-eroded material and the subsequent propagation of emissions. In addition to stockpile dimensions, emissions generated by wind erosion from stockpiles are also dependent on the frequency of disturbance of the exposed surface. Over time the surface of an undisturbed stockpile will become depleted of erodible material and emissions of particulate matter will reduce correspondingly. However, the nature of ROM and product coal stockpiles is that they are frequently disturbed by the removal of materials and addition of fresh coal, causing a previously unexposed surface to be available for subsequent erosion
(Katestone, 2011).
For existing stockpiles, the control measures identified in the literature to minimise particulate emissions include:
Bypassing stockpiles to load directly into ROM bin or directly to off-site transportation (i.e. train wagons or haulage trucks).
Fencing, bunding or shelterbelts to reduce near-surface wind speed and the resultant wind-shear velocity across open areas and/or coal storage piles.
Watering to minimise lift-off, with automatic water application control through continuous cycling and variable application based on measured or forecast meteorological conditions.
The addition of chemical suppressants to bind loose fine surface material in response to adverse meteorological conditions.
Minimising residence time of coal in stockpiles, so that the surface material does not lose its erodible material.
Improved housekeeping, including the rapid and effective clean-up of material spillages.
The provision of surface covers.

Wambo Coal Pty Ltd Wambo Coal Site Specific Particulate Matter Control Best Practice Assessment
Report Number 610.11105.01000-R1 30 August 2012
Draft 2 Page 47
SLR Consulting Australia Pty Ltd
Structures can be used to reduce emissions of particulate matter, such as earth walls (berms), fences or mine buildings / structures. Berms can act as a windbreak by reducing the near-surface wind-shear velocity across the stockpile, and minimising the erosive and drying effects of the wind. Berms and wind screens can also reduce the amount of water and use of suppressants required for effective dust control, making it a cost-effective option in many cases. A study was conducted of the effectiveness of wind screens and determined that the most effective screens for reducing the wind speed had the following typical dimensional relationship to the dimensions of the corresponding stockpile (Katestone, 2011):
Height: 1.25 times the height of the stockpile.
Width: 1.5 times the height of the stockpile.
Distance upwind: 2.0 times the height of the stockpile.
Wind breaks and screens offer an alternative to reduce wind erosion from stockpiled materials or areas with no vegetative cover. Recent studies have demonstrated a wide range of control efficiencies for screens and windbreaks, as summarised in Katestone 2011. Vegetative wind breaks are reported with control efficiency of 30% and wind screens and fences up to 80%. Studies regarding windbreak design and size have been shown to influence its effectiveness, particularly its relative height to the height of the stockpile, its distance downwind and its structural porosity (Katestone, 2011). Reducing the height of the stockpile may also offer a significant reduction in the wind erosion potential by reducing the wind speed over the stockpile surface.
Similarly, stockpile size and orientation has been shown to affect the efficacy of wind breaks, with “smooth whaleback” profiles being more effective at reducing wind erosion than pointed stockpiles and orientation with the smallest face towards the prevailing wind offering increased protection from wind erosion. Studies suggest a control efficiency of 60% may be attributed to stockpile size, design and orientation.
Chemical binders and suppressants may be applied to the surface of stockpiles to enhance the cohesion of particles and reduce the potential for wind erosion. These binding agents are usually applied in solution and are sprayed onto the surface. Water sprays by themselves have been shown to offer in the region of 50% to 80% control efficiency. However, the effectiveness of spray additives is reduced by mechanical disturbance as it breaks the surface ‘crust’, which may be caused by stockpile working (i.e. the addition or removal of material), vehicle disturbance or the action of wild animals.
The use of multiple controls, such as the use of chemical stabilisers and binders with wind breaks may offer enhanced dust control. Studies have reported a reduction in windblown dust emissions of up to 85% for up to 10 days of moderate to high wind speeds through the combined use of chemical stabilisers and wind breaks (Katestone, 2011).
A summary of the potential control measures for minimising particulate emissions from wind erosion from coal stockpiles, and their effectiveness, is provided in Table 20 (Katestone, 2011).

Wambo Coal Pty Ltd Wambo Coal Site Specific Particulate Matter Control Best Practice Assessment
Report Number 610.11105.01000-R1 30 August 2012
Draft 2 Page 48
SLR Consulting Australia Pty Ltd
Table 20 Best Practice Control Measures – Wind Erosion of Coal Stockpiles
Control Type Control Measure Effectiveness1
Avoidance Bypassing stockpiles 100% reduction in wind erosion for coal bypassing stockpiles
Surface stabilisation Water spray 50%
Chemical wetting agents 80-99%
85%
90%
Surface crusting agent 95%
Carry over wetting from load in 80%
Enclosure Silo with bag house 100%
95-99%
99%
Cover storage pile with a tarp during high winds 99%
Wind speed reduction Vegetative wind breaks 30%
Reduced pile height 30%
Wind screens/wind fences >80%
75-80%
Pile shaping/orientation <60%
Erect 3-sided enclosure around storage piles 75%
Note 1 In some instances, the respective control has varying control efficiencies that are referenced through independent studies, and the table represents a simplified summary of those studies.
SOURCE: Katestone (2011), Table 72
3.3 Bulldozers on Coal
Katestone (2011) presents a comprehensive summary of an options appraisal conducted by Connell Hatch for the control of particulate emissions from bulldozers at the RG Tanna Coal Terminal. Options considered in the study included:
Minimising travel speed and travel distance.
Stabilising bulldozer travel routes and use of water or suppressants on travel routes.
Manage coal moisture to ensure coal is sufficiently moist when working.
Modify design of the bulldozer to minimise emissions.
Based upon the data available, the emission of particulate from bulldozer operation can only be quantified by hours of operation, and not the speed of the vehicles.
A summary of the potential control measures for minimising particulate emissions from bulldozers, and their effectiveness, is provided in Table 21 (Katestone, 2011).

Wambo Coal Pty Ltd Wambo Coal Site Specific Particulate Matter Control Best Practice Assessment
Report Number 610.11105.01000-R1 30 August 2012
Draft 2 Page 49
SLR Consulting Australia Pty Ltd
Table 21 Best Practice Control Measures – Bulldozers
Control Measure Effectiveness
Bulldozer Minimise travel speed and distance Not quantified
Keep travel routes and materials moist 50%
SOURCE: Katestone (2011), Table 76
3.4 Loading Coal and Reject Trucks
Loading trucks with ROM coal and coal rejects may give rise to particulate emissions as a result of the air turbulence induced by dropping of coal from height. The potential impacts of this process may be controlled by a range of factors including a reduction in the drop height, the application of water sprays to increase the moisture level in the material and to suppress emissions and through the erection of enclosures (where appropriate) to reduce the potential for entrainment in crosswinds.
A summary of the potential control measures for minimising particulate emissions from the loading of coal trucks, and their effectiveness, is provided in Table 22 (DSEWPC, 2012). It is noted that the loading of coal to trucks occurs by loader within the open cut or at the underground ROM, where loading of coal reject trucks occurs via the reject bin. Therefore, each control measure in Table 22 may not be appropriate for both sources. This is discussed further in Section 4.
Table 22 Best Practice Control Measures – Loading Coal and Rejects to Trucks
Control Measure Effectiveness
Enclosure 100%
Telescopic chute with water spray 75%
Water sprays 50%
Hooding with cyclones 70%
Hooding with scrubbers 85%
Hooding with fabric filters 83%
SOURCE: DSEWPC (2012), Table 4
3.5 Quantification of Potential Particulate Management Measures
Table 23 presents the emission control factors assumed in this assessment for the potential particulate management measures identified.

Wambo Coal Pty Ltd Wambo Coal Site Specific Particulate Matter Control Best Practice Assessment
Report Number 610.11105.01000-R1 30 August 2012
Draft 2 Page 50
SLR Consulting Australia Pty Ltd
Table 23 Control Factors Assumed for Potential Control Measures
Emission Source Control Measure Control Factor Assumed
Reference
Unpaved Haul Roads Pave the surface 90% Katestone (2011)
Low silt aggregate 30% Katestone (2011)
Oil and double chip surface 80% Katestone (2011)
Watering Level 2 (>2 l/m²/hr) 75% Katestone (2011)
Suppressants 84% Katestone (2011)
Hygroscopic salts 82% Katestone (2011)
Lignosulphonates 77% Katestone (2011)
Polymer emulsions 70% Katestone (2011)
Tar and bitumen emulsions 70% Katestone (2011)
Use conveyors in place of haul roads 95% Katestone (2011)
Wind Erosion Minimise pre-strip. EMP should specify a benchmark for optimal performance and report annually against benchmark
100% per m2 of pre-strip avoided
Katestone (2011)
Watering 50% Katestone (2011)
Chemical suppressants 70% Katestone (2011)
Paving and cleaning 95% Katestone (2011)
Apply gravel to stabilise disturbed open areas 84% Katestone (2011)
Rehabilitation. EMP should specify a rehabilitation goal and report annually against progress to meeting goal.
99% Katestone (2011)
Fencing, bunding, shelterbelts or in-pit dump. Height should be greater than the height of the erodible surface
30% Katestone (2011)
Vegetative ground cover 70% Katestone (2011)
Bulldozers on Coal Keep travel routes and materials moist 50% Katestone (2011)
Loading Coal / Rejects to Trucks
Enclosure 100% DSEPWC (2012)
Telescopic chute with water sprays 75% DSEPWC (2012)
Water sprays 50% DSEPWC (2012)
Hooding with cyclones 65% DSEPWC (2012)
Hooding with scrubbers 75% DSEPWC (2012)
Hooding with fabric filters 83% DSEPWC (2012)
Table 24 provides the location of each table providing the calculated controlled emissions for each source category and individual source.
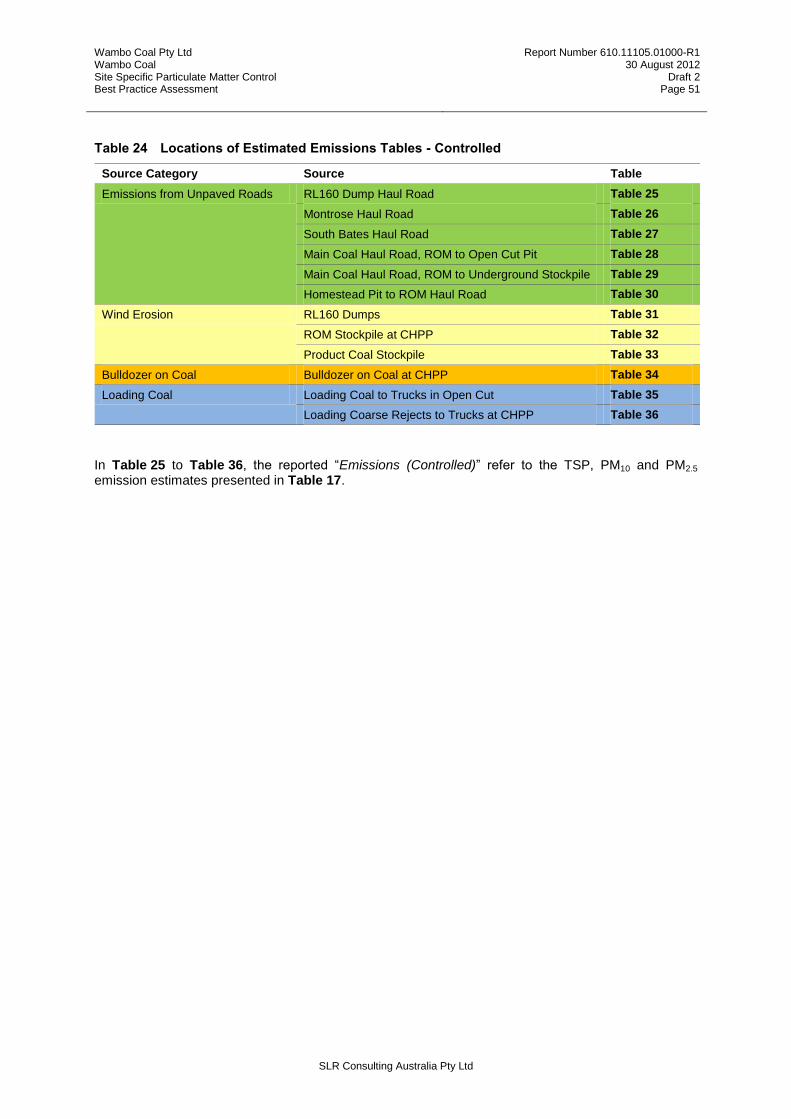
Wambo Coal Pty Ltd Wambo Coal Site Specific Particulate Matter Control Best Practice Assessment
Report Number 610.11105.01000-R1 30 August 2012
Draft 2 Page 51
SLR Consulting Australia Pty Ltd
Table 24 Locations of Estimated Emissions Tables - Controlled
Source Category Source Table
Emissions from Unpaved Roads RL160 Dump Haul Road Table 25
Montrose Haul Road Table 26
South Bates Haul Road Table 27
Main Coal Haul Road, ROM to Open Cut Pit Table 28
Main Coal Haul Road, ROM to Underground Stockpile Table 29
Homestead Pit to ROM Haul Road Table 30
Wind Erosion RL160 Dumps Table 31
ROM Stockpile at CHPP Table 32
Product Coal Stockpile Table 33
Bulldozer on Coal Bulldozer on Coal at CHPP Table 34
Loading Coal Loading Coal to Trucks in Open Cut Table 35
Loading Coarse Rejects to Trucks at CHPP Table 36
In Table 25 to Table 36, the reported “Emissions (Controlled)” refer to the TSP, PM10 and PM2.5 emission estimates presented in Table 17.
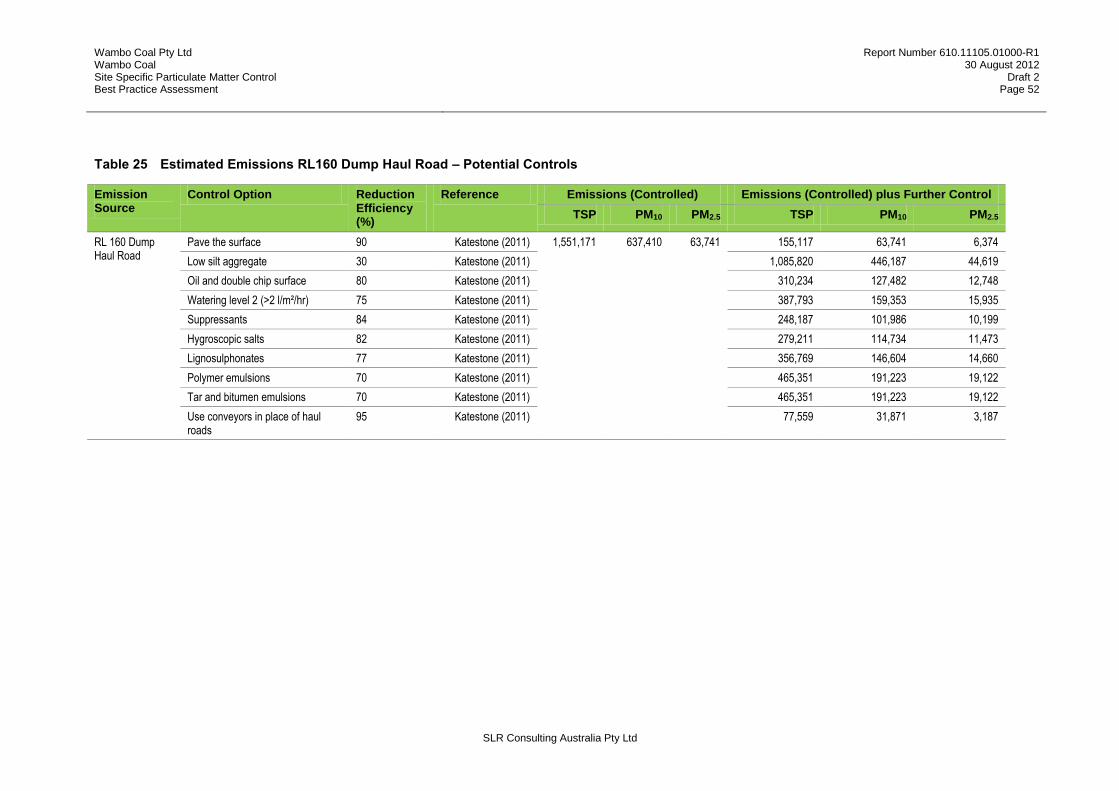
Wambo Coal Pty Ltd Wambo Coal Site Specific Particulate Matter Control Best Practice Assessment
Report Number 610.11105.01000-R1 30 August 2012
Draft 2 Page 52
SLR Consulting Australia Pty Ltd
Table 25 Estimated Emissions RL160 Dump Haul Road – Potential Controls
Emission Source
Control Option Reduction Efficiency (%)
Reference Emissions (Controlled) Emissions (Controlled) plus Further Control
TSP PM10 PM2.5 TSP PM10 PM2.5
RL 160 Dump Haul Road
Pave the surface 90 Katestone (2011) 1,551,171 637,410 63,741 155,117 63,741 6,374
Low silt aggregate 30 Katestone (2011) 1,085,820 446,187 44,619
Oil and double chip surface 80 Katestone (2011) 310,234 127,482 12,748
Watering level 2 (>2 l/m²/hr) 75 Katestone (2011) 387,793 159,353 15,935
Suppressants 84 Katestone (2011) 248,187 101,986 10,199
Hygroscopic salts 82 Katestone (2011) 279,211 114,734 11,473
Lignosulphonates 77 Katestone (2011) 356,769 146,604 14,660
Polymer emulsions 70 Katestone (2011) 465,351 191,223 19,122
Tar and bitumen emulsions 70 Katestone (2011) 465,351 191,223 19,122
Use conveyors in place of haul roads
95 Katestone (2011) 77,559 31,871 3,187

Wambo Coal Pty Ltd Wambo Coal Site Specific Particulate Matter Control Best Practice Assessment
Report Number 610.11105.01000-R1 30 August 2012
Draft 2 Page 53
SLR Consulting Australia Pty Ltd
Table 26 Estimated Emissions Montrose Haul Road – Potential Controls
Emission Source
Control Option Reduction Efficiency (%)
Reference Emissions (Controlled) Emissions (Controlled) plus Further Control
TSP PM10 PM2.5 TSP PM10 PM2.5
Montrose Haul Road
Pave the surface 90 Katestone (2011) 1,013,538 416,485 41,648 101,354 41,648 4,165
Low silt aggregate 30 Katestone (2011) 709,477 291,539 29,154
Oil and double chip surface 80 Katestone (2011) 202,708 83,297 8,330
Watering level 2 (>2 l/m²/hr) 75 Katestone (2011) 253,384 104,121 10,412
Suppressants 84 Katestone (2011) 162,166 66,638 6,664
Hygroscopic salts 82 Katestone (2011) 182,437 74,967 7,497
Lignosulphonates 77 Katestone (2011) 233,114 95,792 9,579
Polymer emulsions 70 Katestone (2011) 304,061 124,945 12,495
Tar and bitumen emulsions 70 Katestone (2011) 304,061 124,945 12,495
Use conveyors in place of haul roads
95 Katestone (2011) 50,677 20,824 2,082

Wambo Coal Pty Ltd Wambo Coal Site Specific Particulate Matter Control Best Practice Assessment
Report Number 610.11105.01000-R1 30 August 2012
Draft 2 Page 54
SLR Consulting Australia Pty Ltd
Table 27 Estimated Emissions South Bates Haul Road – Potential Controls
Emission Source
Control Option Reduction Efficiency (%)
Reference Emissions (Controlled) Emissions (Controlled) plus Further Control
TSP PM10 PM2.5 TSP PM10 PM2.5
South Bates Haul Road
Pave the surface 90 Katestone (2011) 661,619 271,874 27,187 66,162 27,187 2,719
Low silt aggregate 30 Katestone (2011) 463,134 190,312 19,031
Oil and double chip surface 80 Katestone (2011) 132,324 54,375 5,437
Watering level 2 (>2 l/m²/hr) 75 Katestone (2011) 165,405 67,968 6,797
Suppressants 84 Katestone (2011) 105,859 43,500 4,350
Hygroscopic salts 82 Katestone (2011) 119,091 48,937 4,894
Lignosulphonates 77 Katestone (2011) 152,172 62,531 6,253
Polymer emulsions 70 Katestone (2011) 198,486 81,562 8,156
Tar and bitumen emulsions 70 Katestone (2011) 198,486 81,562 8,156
Use conveyors in place of haul roads
95 Katestone (2011) 33,081 13,594 1,359

Wambo Coal Pty Ltd Wambo Coal Site Specific Particulate Matter Control Best Practice Assessment
Report Number 610.11105.01000-R1 30 August 2012
Draft 2 Page 55
SLR Consulting Australia Pty Ltd
Table 28 Estimated Emissions Main Coal Haul Road, ROM to Open Cut Pit – Potential Controls
Emission Source
Control Option Reduction Efficiency (%)
Reference Emissions (Controlled) Emissions (Controlled) plus Further Control
TSP PM10 PM2.5 TSP PM10 PM2.5
Main Coal Haul Road ROM to Open Cut Pit
Pave the surface 90 Katestone (2011) 387,410 145,972 14,597 38,741 14,597 1,460
Low silt aggregate 30 Katestone (2011) 271,187 102,180 10,218
Oil and double chip surface 80 Katestone (2011) 77,482 29,194 2,919
Watering level 2 (>2 l/m²/hr) 75 Katestone (2011) 96,852 36,493 3,649
Suppressants 84 Katestone (2011) 61,986 23,356 2,336
Hygroscopic salts 82 Katestone (2011) 69,734 26,275 2,627
Lignosulphonates 77 Katestone (2011) 89,104 33,574 3,357
Polymer emulsions 70 Katestone (2011) 116,223 43,792 4,379
Tar and bitumen emulsions 70 Katestone (2011) 116,223 43,792 4,379
Use conveyors in place of haul roads
95 Katestone (2011) 19,370 7,299 730

Wambo Coal Pty Ltd Wambo Coal Site Specific Particulate Matter Control Best Practice Assessment
Report Number 610.11105.01000-R1 30 August 2012
Draft 2 Page 56
SLR Consulting Australia Pty Ltd
Table 29 Estimated Emissions Main Coal Haul Road, ROM to Underground Stockpile – Potential Controls
Emission Source
Control Option Reduction Efficiency (%)
Reference Emissions (Controlled) Emissions (Controlled) plus Further Control
TSP PM10 PM2.5 TSP PM10 PM2.5
Main Coal Haul Road ROM to Underground Stockpile
Pave the surface 90 Katestone (2011) 359,400 128,222 12,822 35,940 12,822 1,282
Low silt aggregate 30 Katestone (2011) 251,580 89,755 8,976
Oil and double chip surface 80 Katestone (2011) 71,880 25,644 2,564
Watering level 2 (>2 l/m²/hr) 75 Katestone (2011) 89,850 32,055 3,206
Suppressants 84 Katestone (2011) 57,504 20,515 2,052
Hygroscopic salts 82 Katestone (2011) 64,692 23,080 2,308
Lignosulphonates 77 Katestone (2011) 82,662 29,491 2,949
Polymer emulsions 70 Katestone (2011) 107,820 38,466 3,847
Tar and bitumen emulsions 70 Katestone (2011) 107,820 38,466 3,847
Use conveyors in place of haul roads
95 Katestone (2011) 17,970 6,411 641
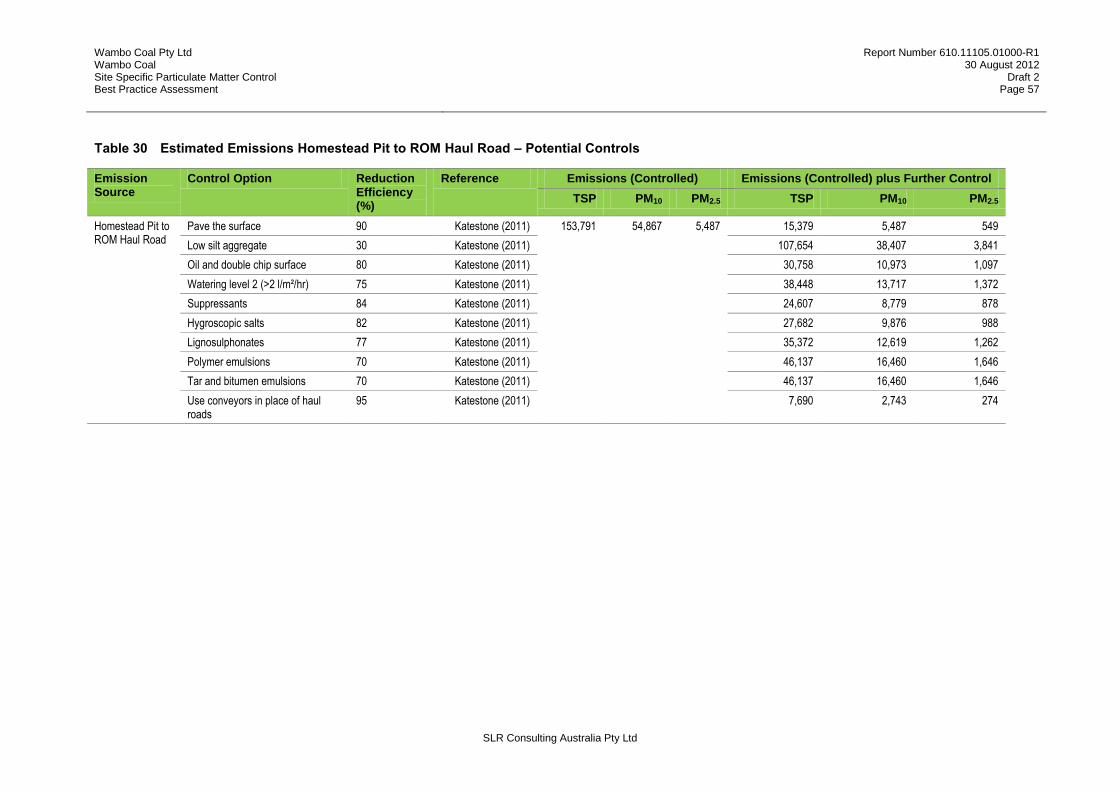
Wambo Coal Pty Ltd Wambo Coal Site Specific Particulate Matter Control Best Practice Assessment
Report Number 610.11105.01000-R1 30 August 2012
Draft 2 Page 57
SLR Consulting Australia Pty Ltd
Table 30 Estimated Emissions Homestead Pit to ROM Haul Road – Potential Controls
Emission Source
Control Option Reduction Efficiency (%)
Reference Emissions (Controlled) Emissions (Controlled) plus Further Control
TSP PM10 PM2.5 TSP PM10 PM2.5
Homestead Pit to ROM Haul Road
Pave the surface 90 Katestone (2011) 153,791 54,867 5,487 15,379 5,487 549
Low silt aggregate 30 Katestone (2011) 107,654 38,407 3,841
Oil and double chip surface 80 Katestone (2011) 30,758 10,973 1,097
Watering level 2 (>2 l/m²/hr) 75 Katestone (2011) 38,448 13,717 1,372
Suppressants 84 Katestone (2011) 24,607 8,779 878
Hygroscopic salts 82 Katestone (2011) 27,682 9,876 988
Lignosulphonates 77 Katestone (2011) 35,372 12,619 1,262
Polymer emulsions 70 Katestone (2011) 46,137 16,460 1,646
Tar and bitumen emulsions 70 Katestone (2011) 46,137 16,460 1,646
Use conveyors in place of haul roads
95 Katestone (2011) 7,690 2,743 274
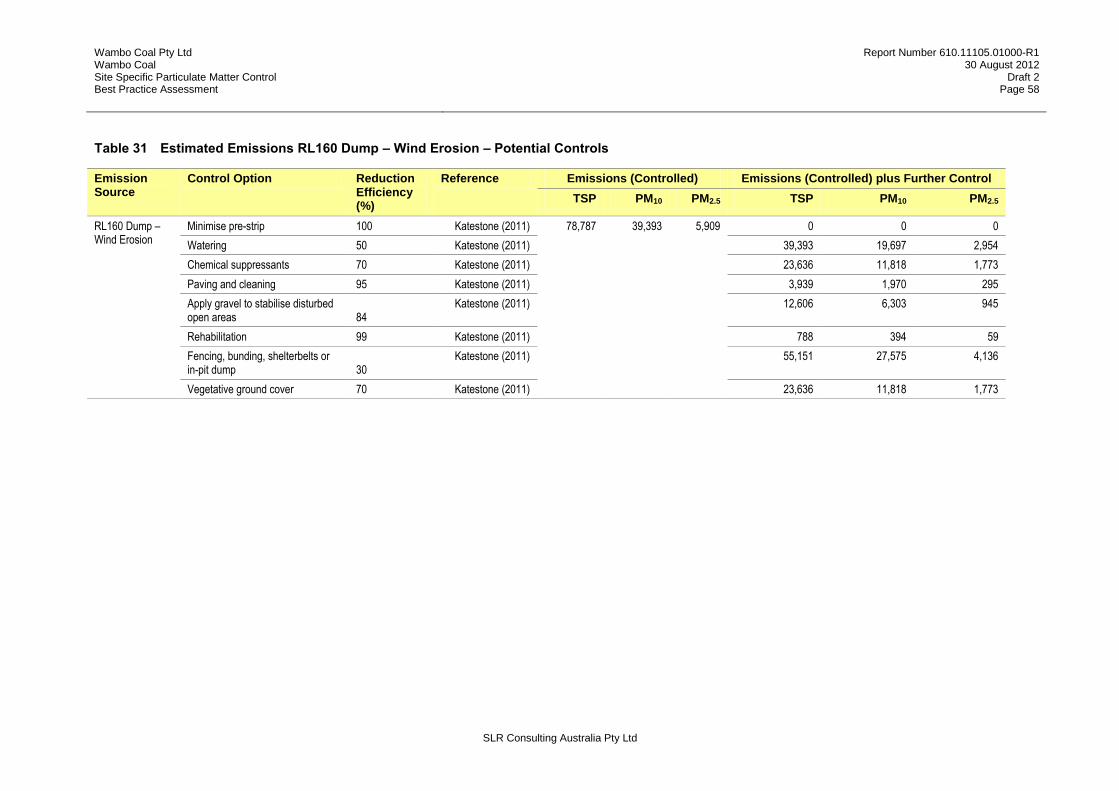
Wambo Coal Pty Ltd Wambo Coal Site Specific Particulate Matter Control Best Practice Assessment
Report Number 610.11105.01000-R1 30 August 2012
Draft 2 Page 58
SLR Consulting Australia Pty Ltd
Table 31 Estimated Emissions RL160 Dump – Wind Erosion – Potential Controls
Emission Source
Control Option Reduction Efficiency (%)
Reference Emissions (Controlled) Emissions (Controlled) plus Further Control
TSP PM10 PM2.5 TSP PM10 PM2.5
RL160 Dump – Wind Erosion
Minimise pre-strip 100 Katestone (2011) 78,787 39,393 5,909 0 0 0
Watering 50 Katestone (2011) 39,393 19,697 2,954
Chemical suppressants 70 Katestone (2011) 23,636 11,818 1,773
Paving and cleaning 95 Katestone (2011) 3,939 1,970 295
Apply gravel to stabilise disturbed open areas 84
Katestone (2011) 12,606 6,303 945
Rehabilitation 99 Katestone (2011) 788 394 59
Fencing, bunding, shelterbelts or in-pit dump 30
Katestone (2011) 55,151 27,575 4,136
Vegetative ground cover 70 Katestone (2011) 23,636 11,818 1,773

Wambo Coal Pty Ltd Wambo Coal Site Specific Particulate Matter Control Best Practice Assessment
Report Number 610.11105.01000-R1 30 August 2012
Draft 2 Page 59
SLR Consulting Australia Pty Ltd
Table 32 Estimated Emissions ROM Stockpile at CHPP – Wind Erosion – Potential Controls
Emission Source
Control Option Reduction Efficiency (%)
Reference Emissions (Controlled) Emissions (Controlled) plus Further Control
TSP PM10 PM2.5 TSP PM10 PM2.5
ROM Stockpile at CHPP – Wind Erosion
Bypassing stockpiles 100 Katestone (2011) 59,873 29,937 4,491 0 0 0
Water sprays 50 Katestone (2011) 29,937 14,968 2,245
Chemical wetting agents 80 Katestone (2011) 11,975 5,987 898
Surface crusting agents 95 Katestone (2011) 2,994 1,497 225
Carry over wetting from load in 80 Katestone (2011) 11,975 5,987 898
Silo with bag house 95 Katestone (2011) 2,994 1,497 225
Cover storage pile with a tarp during high winds 99
Katestone (2011) 599 299 45
Vegetative wind breaks 30 Katestone (2011) 41,911 20,956 3,143
Reduced pile height 30 Katestone (2011) 41,911 20,956 3,143
Wind screens / wind fences 75 Katestone (2011) 14,968 7,484 1,123
Pile shaping / orientation 60 Katestone (2011) 23,949 11,975 1,796
Erect 3-sided enclosure around storage piles 75
Katestone (2011) 14,968 7,484 1,123

Wambo Coal Pty Ltd Wambo Coal Site Specific Particulate Matter Control Best Practice Assessment
Report Number 610.11105.01000-R1 30 August 2012
Draft 2 Page 60
SLR Consulting Australia Pty Ltd
Table 33 Estimated Emissions Product Coal Stockpile – Wind Erosion – Potential Controls
Table 34 Estimated Emissions Bulldozers at CHPP – Potential Controls
Emission Source
Control Option Reduction Efficiency (%)
Reference Emissions (Controlled) Emissions (Controlled) plus Further Control
TSP PM10 PM2.5 TSP PM10 PM2.5
Product Coal Stockpile – Wind Erosion
Bypassing stockpiles 100 Katestone (2011) 59,873 29,937 4,491 0 0 0
Water sprays 50 Katestone (2011) 29,937 14,968 2,245
Chemical wetting agents 80 Katestone (2011) 11,975 5,987 898
Surface crusting agents 95 Katestone (2011) 2,994 1,497 225
Carry over wetting from load in 80 Katestone (2011) 11,975 5,987 898
Silo with bag house 95 Katestone (2011) 2,994 1,497 225
Cover storage pile with a tarp during high winds 99
Katestone (2011) 599 299 45
Vegetative wind breaks 30 Katestone (2011) 41,911 20,956 3,143
Reduced pile height 30 Katestone (2011) 41,911 20,956 3,143
Wind screens / wind fences 75 Katestone (2011) 14,968 7,484 1,123
Pile shaping / orientation 60 Katestone (2011) 23,949 11,975 1,796
Erect 3-sided enclosure around storage piles 75
Katestone (2011) 14,968 7,484 1,123
Emission Source
Control Option Reduction Efficiency (%)
Reference Emissions (Controlled) Emissions (Controlled) plus Further Control
TSP PM10 PM2.5 TSP PM10 PM2.5
Bulldozers at CHPP
Keep travel routes and materials moist 50
Katestone (2011) 59,303 18,050 1,805 29,652 9,025 902

Wambo Coal Pty Ltd Wambo Coal Site Specific Particulate Matter Control Best Practice Assessment
Report Number 610.11105.01000-R1 30 August 2012
Draft 2 Page 61
SLR Consulting Australia Pty Ltd
Table 35 Estimated Emissions Loading Coal to Trucks – Potential Controls
Table 36 Estimated Emissions Coarse Rejects to Trucks – Potential Controls
Emission Source
Control Option Reduction Efficiency (%)
Reference Emissions (Controlled) Emissions (Controlled) plus Further Control
TSP PM10 PM2.5 TSP PM10 PM2.5
Loading Coal to Trucks
Enclosure 100 DSEPWC (2012) 535,730 72,394 7,239 0 0 0
Telescopic chute with water sprays 75 DSEPWC (2012) 133,933 18,098 1,810
Water sprays 50 DSEPWC (2012) 267,865 36,197 3,620
Hooding with cyclones 65 DSEPWC (2012) 187,506 25,338 2,534
Hooding with scrubbers 75 DSEPWC (2012) 133,933 18,098 1,810
Hooding with fabric filters 83 DSEPWC (2012) 91,074 12,307 1,231
Emission Source
Control Option Reduction Efficiency (%)
Reference Emissions (Controlled) Emissions (Controlled) plus Further Control
TSP PM10 PM2.5 TSP PM10 PM2.5
Coarse Rejects to Trucks
Enclosure 100 DSEPWC (2012) 61,888 8,363 836 0 0 0
Telescopic chute with water Sprays 75 DSEPWC (2012) 15,472 2,091 209
Water sprays 50 DSEPWC (2012) 30,944 4,181 418
Hooding with cyclones 65 DSEPWC (2012) 21,661 2,927 293
Hooding with scrubbers 75 DSEPWC (2012) 15,472 2,091 209
Hooding with fabric filters 83 DSEPWC (2012) 10,521 1,422 142

Wambo Coal Pty Ltd Wambo Coal Site Specific Particulate Matter Control Best Practice Assessment
Report Number 610.11105.01000-R1 30 August 2012
Draft 2 Page 62
SLR Consulting Australia Pty Ltd
A comparison of emissions following each control measure application against original (with existing controls) emissions of particulate are presented in Figure 11 to Figure 23.
Figure 11 Potential Reductions in PM Emissions due to Additional Controls Haulage on RL160 Dump Haul Road
Figure 12 Potential Reductions in PM Emissions due to Additional Controls Haulage on Montrose Haul Road

Wambo Coal Pty Ltd Wambo Coal Site Specific Particulate Matter Control Best Practice Assessment
Report Number 610.11105.01000-R1 30 August 2012
Draft 2 Page 63
SLR Consulting Australia Pty Ltd
Figure 13 Potential Reductions in PM Emissions due to Additional Controls Haulage on South Bates Haul Road
Figure 14 Potential Reductions in PM Emissions due to Additional Controls Haulage on Main Coal Haul Road – ROM to Open Cut Pit

Wambo Coal Pty Ltd Wambo Coal Site Specific Particulate Matter Control Best Practice Assessment
Report Number 610.11105.01000-R1 30 August 2012
Draft 2 Page 64
SLR Consulting Australia Pty Ltd
Figure 15 Potential Reductions in PM Emissions due to Additional Controls Haulage on South Bates Haul Road
Figure 16 Potential Reductions in PM Emissions due to Additional Controls Haulage on Main Coal Haul Road – ROM to Underground Stockpile
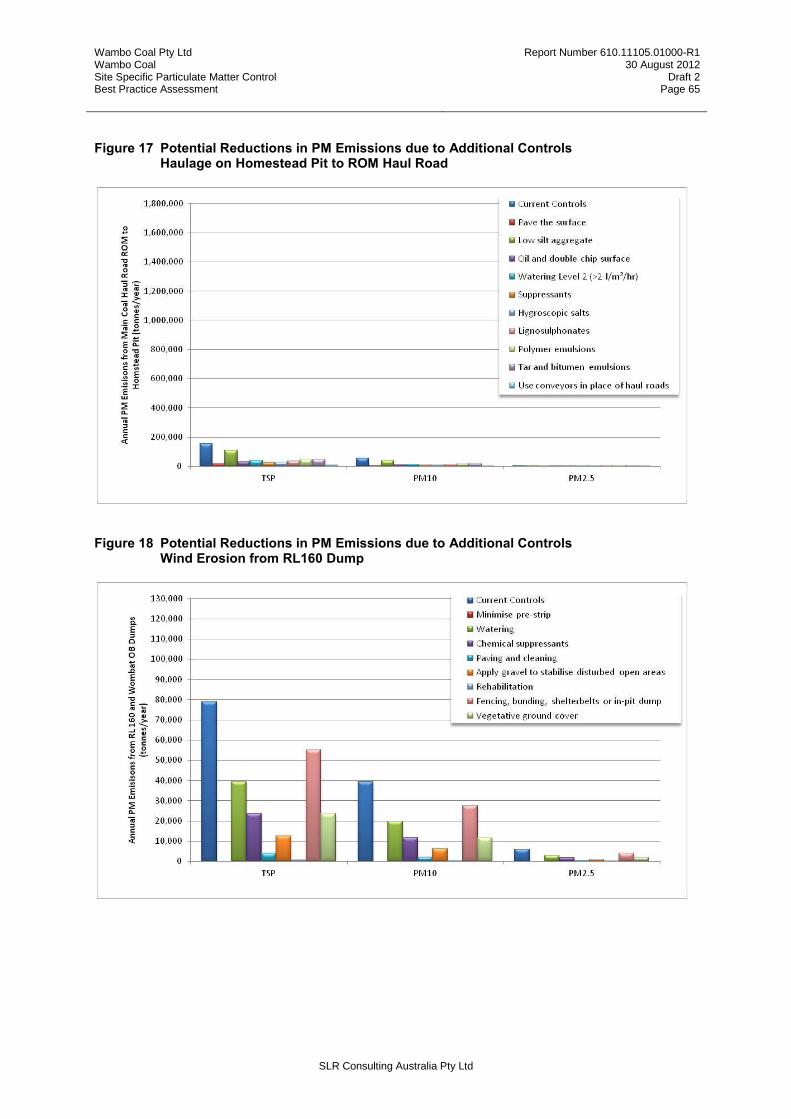
Wambo Coal Pty Ltd Wambo Coal Site Specific Particulate Matter Control Best Practice Assessment
Report Number 610.11105.01000-R1 30 August 2012
Draft 2 Page 65
SLR Consulting Australia Pty Ltd
Figure 17 Potential Reductions in PM Emissions due to Additional Controls Haulage on Homestead Pit to ROM Haul Road
Figure 18 Potential Reductions in PM Emissions due to Additional Controls Wind Erosion from RL160 Dump

Wambo Coal Pty Ltd Wambo Coal Site Specific Particulate Matter Control Best Practice Assessment
Report Number 610.11105.01000-R1 30 August 2012
Draft 2 Page 66
SLR Consulting Australia Pty Ltd
Figure 19 Potential Reductions in PM Emissions due to Additional Controls Wind Erosion from ROM Stockpile at CHPP
Figure 20 Potential Reductions in PM Emissions due to Additional Controls Wind Erosion from Product Coal Stockpile

Wambo Coal Pty Ltd Wambo Coal Site Specific Particulate Matter Control Best Practice Assessment
Report Number 610.11105.01000-R1 30 August 2012
Draft 2 Page 67
SLR Consulting Australia Pty Ltd
Figure 21 Potential Reductions in PM Emissions due to Additional Controls Bulldozers on Coal at CHPP
Figure 22 Potential Reductions in PM Emissions due to Additional Controls Loading ROM Coal to Trucks

Wambo Coal Pty Ltd Wambo Coal Site Specific Particulate Matter Control Best Practice Assessment
Report Number 610.11105.01000-R1 30 August 2012
Draft 2 Page 68
SLR Consulting Australia Pty Ltd
Figure 23 Potential Reductions in PM Emissions due to Additional Controls Loading Coarse Rejects to Trucks
Wambo Coal Pty Ltd Wambo Coal Site Specific Particulate Matter Control Best Practice Assessment
Report Number 610.11105.01000-R1 30 August 2012
Draft 2 Page 69
SLR Consulting Australia Pty Ltd
4 EVALUATION OF ADDITIONAL CONTROL MEASURES
3. Evaluate the practicability of implementing these best practice measures
3.1 For each of the best practice measures identified in step 2.1, assess how practicable each one is
to implement by taking into consideration:
implementation costs;
regulatory requirements;
environmental impacts;
safety implications; and,
compatibility with current processes and proposed future developments.
3.2 Identify those best practice measures that will be implemented at the premises to reduce particle
emissions.
As required by EPA, the practicability of implementing each of the particulate control options identified in Section 3 is to be assessed with due consideration given to:
implementation costs.
regulatory requirements.
environmental impacts.
safety implications.
compatibility with current processes and proposed future developments.
The following sections examine the measures that may constrain the implementation of the particulate control measures outlined in Table 23, namely the regulatory requirements, environmental impacts, safety implications and compatibility with current processes and future development.
Each measure is provided a risk rating (low, medium or high) which identifies the constraints which may result in the implementation of the measure not being practical at WCPL. Where any of the four measures of practicability are rated as high, these measures are not taken forward for an assessment of cost implication and feasibility.
Section 0 examines the potential control measures identified for haul road sources, Section 0 for wind erosion of overburden, Section 0 for wind erosion of coal stockpiles, Section 4.4 for the operation of bulldozers on coal, Section 4.5 for the loading of ROM coal to trucks and Section 4.6 for the loading of coarse rejects to trucks.

Wambo Coal Pty Ltd Wambo Coal Site Specific Particulate Matter Control Best Practice Assessment
Report Number 610.11105.01000-R1 30 August 2012
Draft 2 Page 70
SLR Consulting Australia Pty Ltd
4.1 Evaluation Findings – Haul Roads
4.1.1 Practicality of Implementation
Table 37 provides a discussion of the feasibility of control measures for haul roads. Feasibility measures are provided considering all haul roads, as measures display commonality across the site.
Table 37 Practicability of Implementing Control Measures on Haul Roads
Control Measure – Haul Roads
Regulatory Requirements RISK
Environmental Impacts RISK
Safety Implications RISK
Compatibility with Current Processes and Future Developments RISK
Conclusions of Evaluation
Pave the surface
RISK = LOW Follow industry practice for the safe design of haul roads.
RISK = HIGH As part of mine development and rehabilitation, removal of the road will generate significant quantities of waste materials requiring disposal.
RISK = LOW Safety would likely be improved following paving as risk of accidents would be reduced. Speed restrictions would need to be closely monitored
RISK = HIGH Changes in pit locations etc would potentially require costly changes in haul road routes and repaving.
Not considered further in this assessment
Low silt aggregate
RISK = LOW Follow industry practice for the safe design of haul roads.
RISK = MEDIUM As part of mine development and rehabilitation, removal of the road will generate significant quantities of waste materials requiring disposal or re-use.
RISK = MEDIUM Safety may be compromised following application of gravelling as risk of accidents may be increased as risk of skidding increases. Speed restrictions would need to be closely monitored to ensure this is not an issue
RISK = LOW Compatible
Adopted potential measure HR1
Oil and double chip surface
RISK = LOW Ensure all chemicals are registered on-site with relevant MSDS at Stores
RISK = HIGH Very little information or data is available to support this control option, and as such it is not considered likely to represent best practice.
RISK = MEDIUM Ensure road surface provides adequate traction for haul trucks to prevent skidding/slipping.
RISK = LOW Compatible
Not considered further in this assessment
Watering Level 2 (>2 l/m²/hr)
RISK = LOW Ensure that run off is appropriately captured, filtered and discharged or recycled to on-site dams
RISK = LOW Ensure that run off is appropriately captured, filtered and discharged or recycled to on-site dams
RISK = MEDIUM Ensure road surface provides adequate traction for haul trucks to prevent skidding/slipping.
RISK = LOW Compatible
Adopted potential measure HR2

Wambo Coal Pty Ltd Wambo Coal Site Specific Particulate Matter Control Best Practice Assessment
Report Number 610.11105.01000-R1 30 August 2012
Draft 2 Page 71
SLR Consulting Australia Pty Ltd
Control Measure – Haul Roads
Regulatory Requirements RISK
Environmental Impacts RISK
Safety Implications RISK
Compatibility with Current Processes and Future Developments RISK
Conclusions of Evaluation
Hygroscopic salts
RISK = LOW Ensure all chemicals are registered on-site with relevant MSDS at Stores
RISK = LOW Ensure that application rate is appropriate to avoid run off into watercourses. Ensure application is performed during appropriate meteorological conditions to avoid wash/blow off onto non-haul road areas Based on the MSDS, a spill management program should be formulated.
RISK = MEDIUM Ensure road surface provides adequate traction for haul trucks to prevent skidding/slipping.
Ensure suitable storage and handling procedures are implemented to prevent harmful exposure to any chemicals in the suppressant product
RISK = LOW Compatible
Adopted potential measure HR3
Ligno-sulphonates
RISK = LOW Ensure all chemicals are registered on-site with relevant MSDS at Stores
RISK = LOW Ensure that application rate is appropriate to avoid run off into watercourses. Ensure application is performed during appropriate meteorological conditions to avoid wash/blow off onto non-haul road areas Based on the MSDS, a spill management program should be formulated.
RISK = MEDIUM Ensure road surface provides adequate traction for haul trucks to prevent skidding/slipping.
Ensure suitable storage and handling procedures are implemented to prevent harmful exposure to any chemicals in the suppressant product
RISK = LOW Compatible
Adopted potential measure HR4
Polymer emulsions
RISK = LOW Ensure all chemicals are registered on-site with relevant MSDS at Stores
RISK = LOW Ensure that application rate is appropriate to avoid run off into watercourses. Ensure application is performed during appropriate meteorological conditions to avoid wash/blow off onto non-haul road areas Based on the MSDS, a spill management program should be formulated.
RISK = MEDIUM Ensure road surface provides adequate traction for haul trucks to prevent skidding/slipping.
Ensure suitable storage and handling procedures are implemented to prevent harmful exposure to any chemicals in the suppressant product
RISK = LOW Compatible
Adopted potential measure HR5

Wambo Coal Pty Ltd Wambo Coal Site Specific Particulate Matter Control Best Practice Assessment
Report Number 610.11105.01000-R1 30 August 2012
Draft 2 Page 72
SLR Consulting Australia Pty Ltd
Control Measure – Haul Roads
Regulatory Requirements RISK
Environmental Impacts RISK
Safety Implications RISK
Compatibility with Current Processes and Future Developments RISK
Conclusions of Evaluation
Tar and bitumen emulsions
RISK = LOW Ensure all chemicals are registered on-site with relevant MSDS at Stores
RISK = LOW Ensure that application rate is appropriate to avoid run off into watercourses. Ensure application is performed during appropriate meteorological conditions to avoid wash/blow off onto non-haul road areas Based on the MSDS, a spill management program should be formulated.
RISK = MEDIUM Ensure road surface provides adequate traction for haul trucks to prevent skidding/slipping.
Ensure suitable storage and handling procedures are implemented to prevent harmful exposure to any chemicals in the suppressant product
RISK = LOW Compatible
Adopted potential measure HR6
Use conveyors in place of haul roads
RISK = LOW Already considered for existing conveyors
RISK = LOW Additional use of electricity offset and likely surpassed by reduction in diesel fuel use
RISK = LOW Already considered for existing conveyors
RISK = HIGH Changes in pit locations etc would potentially require costly changes in conveyor routes and infrastructure.
Not considered further in this assessment
4.1.2 Implementation Costs
As required by EPA, the cost implication of each potential particulate control measure has been assessed, taking into account (where applicable):
Estimated capital expenditure.
Labour costs.
Material costs.,
Potential cost savings.
An estimation of the cost and net cost per tonne of TSP, PM10 and PM2.5 suppressed is provided for each mitigation measure APPENDIX E.
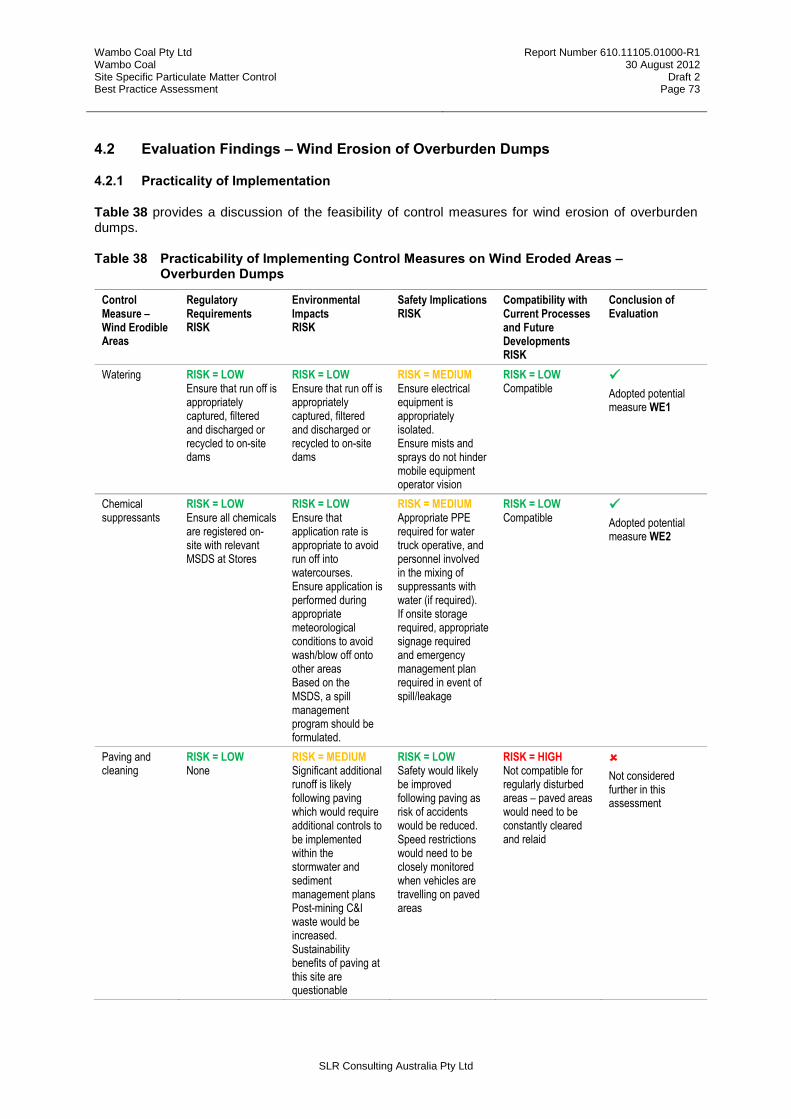
Wambo Coal Pty Ltd Wambo Coal Site Specific Particulate Matter Control Best Practice Assessment
Report Number 610.11105.01000-R1 30 August 2012
Draft 2 Page 73
SLR Consulting Australia Pty Ltd
4.2 Evaluation Findings – Wind Erosion of Overburden Dumps
4.2.1 Practicality of Implementation
Table 38 provides a discussion of the feasibility of control measures for wind erosion of overburden dumps.
Table 38 Practicability of Implementing Control Measures on Wind Eroded Areas – Overburden Dumps
Control Measure – Wind Erodible Areas
Regulatory Requirements RISK
Environmental Impacts RISK
Safety Implications RISK
Compatibility with Current Processes and Future Developments RISK
Conclusion of Evaluation
Watering RISK = LOW Ensure that run off is appropriately captured, filtered and discharged or recycled to on-site dams
RISK = LOW Ensure that run off is appropriately captured, filtered and discharged or recycled to on-site dams
RISK = MEDIUM Ensure electrical equipment is appropriately isolated. Ensure mists and sprays do not hinder mobile equipment operator vision
RISK = LOW Compatible
Adopted potential measure WE1
Chemical suppressants
RISK = LOW Ensure all chemicals are registered on-site with relevant MSDS at Stores
RISK = LOW Ensure that application rate is appropriate to avoid run off into watercourses. Ensure application is performed during appropriate meteorological conditions to avoid wash/blow off onto other areas Based on the MSDS, a spill management program should be formulated.
RISK = MEDIUM Appropriate PPE required for water truck operative, and personnel involved in the mixing of suppressants with water (if required). If onsite storage required, appropriate signage required and emergency management plan required in event of spill/leakage
RISK = LOW Compatible
Adopted potential measure WE2
Paving and cleaning
RISK = LOW None
RISK = MEDIUM Significant additional runoff is likely following paving which would require additional controls to be implemented within the stormwater and sediment management plans Post-mining C&I waste would be increased. Sustainability benefits of paving at this site are questionable
RISK = LOW Safety would likely be improved following paving as risk of accidents would be reduced. Speed restrictions would need to be closely monitored when vehicles are travelling on paved areas
RISK = HIGH Not compatible for regularly disturbed areas – paved areas would need to be constantly cleared and relaid
Not considered further in this assessment
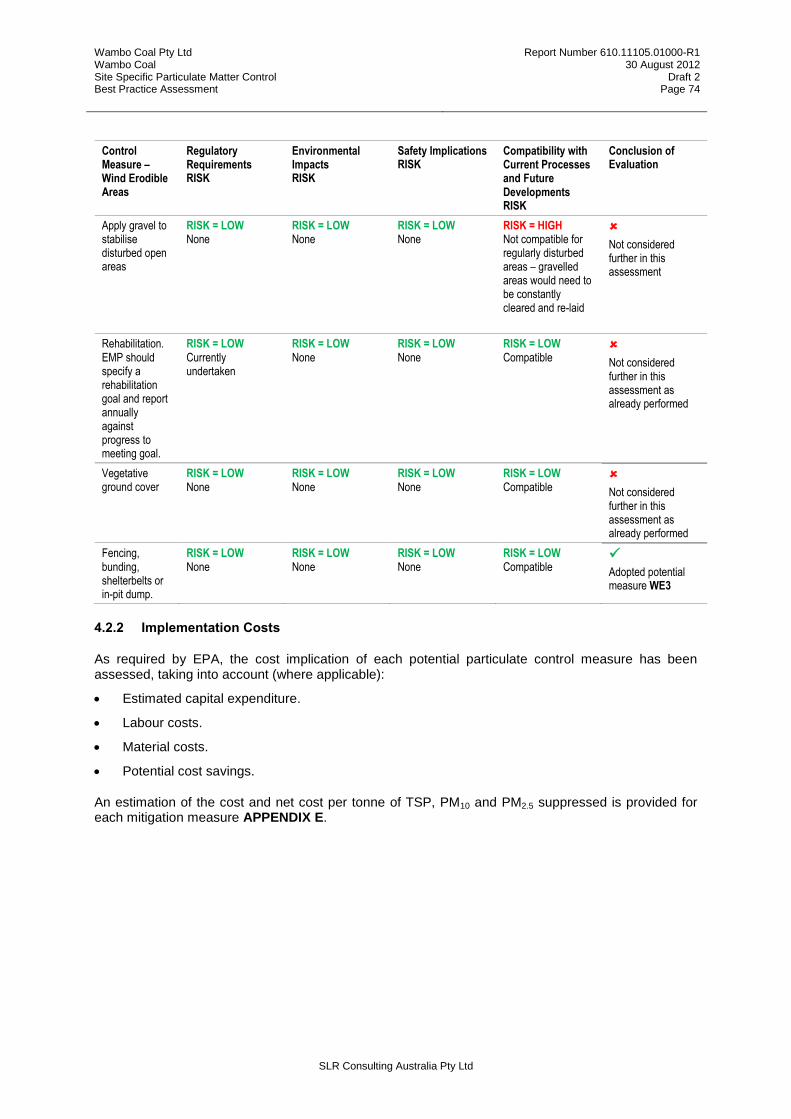
Wambo Coal Pty Ltd Wambo Coal Site Specific Particulate Matter Control Best Practice Assessment
Report Number 610.11105.01000-R1 30 August 2012
Draft 2 Page 74
SLR Consulting Australia Pty Ltd
Control Measure – Wind Erodible Areas
Regulatory Requirements RISK
Environmental Impacts RISK
Safety Implications RISK
Compatibility with Current Processes and Future Developments RISK
Conclusion of Evaluation
Apply gravel to stabilise disturbed open areas
RISK = LOW None
RISK = LOW None
RISK = LOW None
RISK = HIGH Not compatible for regularly disturbed areas – gravelled areas would need to be constantly cleared and re-laid
Not considered further in this assessment
Rehabilitation. EMP should specify a rehabilitation goal and report annually against progress to meeting goal.
RISK = LOW Currently undertaken
RISK = LOW None
RISK = LOW None
RISK = LOW Compatible
Not considered further in this assessment as already performed
Vegetative ground cover
RISK = LOW None
RISK = LOW None
RISK = LOW None
RISK = LOW Compatible
Not considered further in this assessment as already performed
Fencing, bunding, shelterbelts or in-pit dump.
RISK = LOW None
RISK = LOW None
RISK = LOW None
RISK = LOW Compatible
Adopted potential measure WE3
4.2.2 Implementation Costs
As required by EPA, the cost implication of each potential particulate control measure has been assessed, taking into account (where applicable):
Estimated capital expenditure.
Labour costs.
Material costs.
Potential cost savings.
An estimation of the cost and net cost per tonne of TSP, PM10 and PM2.5 suppressed is provided for each mitigation measure APPENDIX E.

Wambo Coal Pty Ltd Wambo Coal Site Specific Particulate Matter Control Best Practice Assessment
Report Number 610.11105.01000-R1 30 August 2012
Draft 2 Page 75
SLR Consulting Australia Pty Ltd
4.3 Evaluation Findings – Wind Erosion of Coal Stockpiles
4.3.1 Practicality of Implementation
Table 39 provides a discussion of the feasibility of control measures for wind erosion of coal stockpiles.
Table 39 Practicability of Implementing Control Measures on Wind Eroded Areas – Coal Stockpiles
Control Measure – Wind Erodible Areas
Regulatory Requirements RISK
Environmental Impacts RISK
Safety Implications RISK
Compatibility with Current Processes and Future Developments RISK
Conclusion of Evaluation
Bypassing stockpiles
RISK = LOW None
RISK = LOW Improvements in dust emissions would be realised
RISK = LOW None
RISK = HIGH Not compatible. Storage area is required for periods when coal cannot be accepted at the CHPP.
Not considered further in this assessment
Water Sprays RISK = LOW Ensure that run off is appropriately captured, filtered and discharged or recycled to on-site dams
RISK = LOW Ensure that run off is appropriately captured, filtered and discharged or recycled to on-site dams
RISK = MEDIUM Ensure electrical equipment is appropriately isolated. Ensure mists and sprays do not hinder mobile equipment operator vision
RISK = LOW Compatible
Not considered further in this assessment – already implemented
Chemical wetting agents
RISK = LOW Ensure all chemicals are registered on-site with relevant MSDS at Stores
RISK = MEDIUM Ensure that application rate is appropriate to avoid run off into watercourses. Ensure application is performed during appropriate meteorological conditions to avoid wash/blow off onto other areas Based on the MSDS, a spill management program should be formulated.
RISK = MEDIUM Appropriate PPE required for water truck operative, and personnel involved in the mixing of suppressants with water (if required). If onsite storage required, appropriate signage required and emergency management plan required in event of spill/leakage
RISK = MEDIUM Not entirely compatible for regularly disturbed areas. Application of wetting agents would need to be performed constantly
Adopted potential measure WEC1*
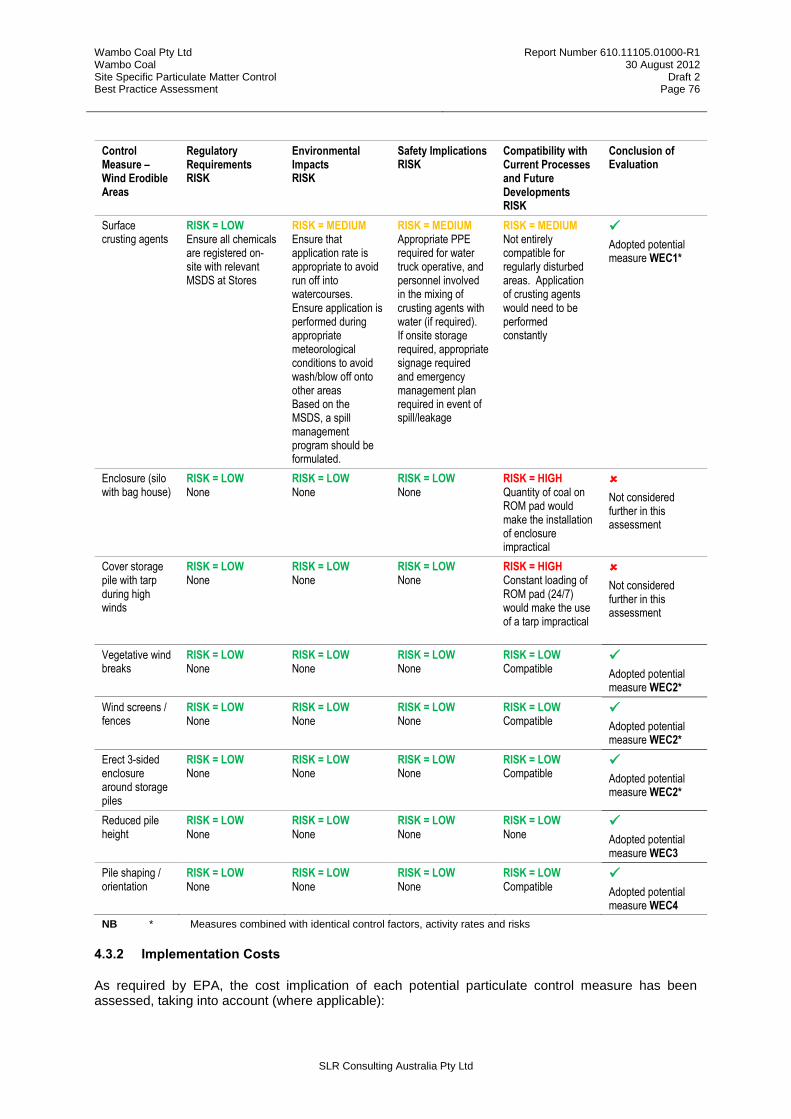
Wambo Coal Pty Ltd Wambo Coal Site Specific Particulate Matter Control Best Practice Assessment
Report Number 610.11105.01000-R1 30 August 2012
Draft 2 Page 76
SLR Consulting Australia Pty Ltd
Control Measure – Wind Erodible Areas
Regulatory Requirements RISK
Environmental Impacts RISK
Safety Implications RISK
Compatibility with Current Processes and Future Developments RISK
Conclusion of Evaluation
Surface crusting agents
RISK = LOW Ensure all chemicals are registered on-site with relevant MSDS at Stores
RISK = MEDIUM Ensure that application rate is appropriate to avoid run off into watercourses. Ensure application is performed during appropriate meteorological conditions to avoid wash/blow off onto other areas Based on the MSDS, a spill management program should be formulated.
RISK = MEDIUM Appropriate PPE required for water truck operative, and personnel involved in the mixing of crusting agents with water (if required). If onsite storage required, appropriate signage required and emergency management plan required in event of spill/leakage
RISK = MEDIUM Not entirely compatible for regularly disturbed areas. Application of crusting agents would need to be performed constantly
Adopted potential measure WEC1*
Enclosure (silo with bag house)
RISK = LOW None
RISK = LOW None
RISK = LOW None
RISK = HIGH Quantity of coal on ROM pad would make the installation of enclosure impractical
Not considered further in this assessment
Cover storage pile with tarp during high winds
RISK = LOW None
RISK = LOW None
RISK = LOW None
RISK = HIGH Constant loading of ROM pad (24/7) would make the use of a tarp impractical
Not considered further in this assessment
Vegetative wind breaks
RISK = LOW None
RISK = LOW None
RISK = LOW None
RISK = LOW Compatible
Adopted potential measure WEC2*
Wind screens / fences
RISK = LOW None
RISK = LOW None
RISK = LOW None
RISK = LOW Compatible
Adopted potential measure WEC2*
Erect 3-sided enclosure around storage piles
RISK = LOW None
RISK = LOW None
RISK = LOW None
RISK = LOW Compatible
Adopted potential measure WEC2*
Reduced pile height
RISK = LOW None
RISK = LOW None
RISK = LOW None
RISK = LOW None
Adopted potential measure WEC3
Pile shaping / orientation
RISK = LOW None
RISK = LOW None
RISK = LOW None
RISK = LOW Compatible
Adopted potential measure WEC4
NB * Measures combined with identical control factors, activity rates and risks
4.3.2 Implementation Costs
As required by EPA, the cost implication of each potential particulate control measure has been assessed, taking into account (where applicable):

Wambo Coal Pty Ltd Wambo Coal Site Specific Particulate Matter Control Best Practice Assessment
Report Number 610.11105.01000-R1 30 August 2012
Draft 2 Page 77
SLR Consulting Australia Pty Ltd
Estimated capital expenditure.
Labour costs.
Material costs.
Potential cost savings.
An estimation of the cost and net cost per tonne of TSP, PM10 and PM2.5 suppressed is provided for each mitigation measure APPENDIX E.
4.4 Evaluation Findings – Bulldozer on Coal at CHPP
4.4.1 Practicality of Implementation
Table 40 provides a discussion of the feasibility of control measures for bulldozers operating on coal.
Table 40 Practicability of Implementing Control Measures for Bulldozers Operating on Coal
Control Measure – Bulldozers
Regulatory Requirements RISK
Environmental Impacts RISK
Safety Implications RISK
Compatibility with Current Processes and Future Developments RISK
Conclusions of Evaluation
Keep travel routes and materials moist with water sprays
RISK = LOW
Ensure that run off is appropriately captured, filtered and discharged or recycled to on-site dams
RISK = LOW
Ensure that run off is appropriately captured, filtered and discharged or recycled to on-site dams Additional GHG emissions due to fuel consumption
RISK = MEDIUM Ensure road surface provides adequate traction for dozers to prevent slipping.
RISK = LOW to MEDIUM Partially compatible; excess moisture in coal product would result in moisture being transported offsite with financial implications to purchaser and transport provider. E.g. additional 2% moisture (w/w) in product would result in 2 tonnes of water being transported per 100 tonnes coal – additional trucks/wagons required to transport.
Not considered further in this assessment as water spraying already occurs on the ROM pad at the CHPP and Product Stockpile
4.4.2 Implementation Costs
As required by EPA, the cost implication of each potential particulate control measure has been assessed, taking into account (where applicable):
Estimated capital expenditure.
Labour costs.
Material costs.
Potential cost savings.
An estimation of the cost and net cost per tonne of TSP, PM10 and PM2.5 suppressed is provided for each mitigation measure APPENDIX E.
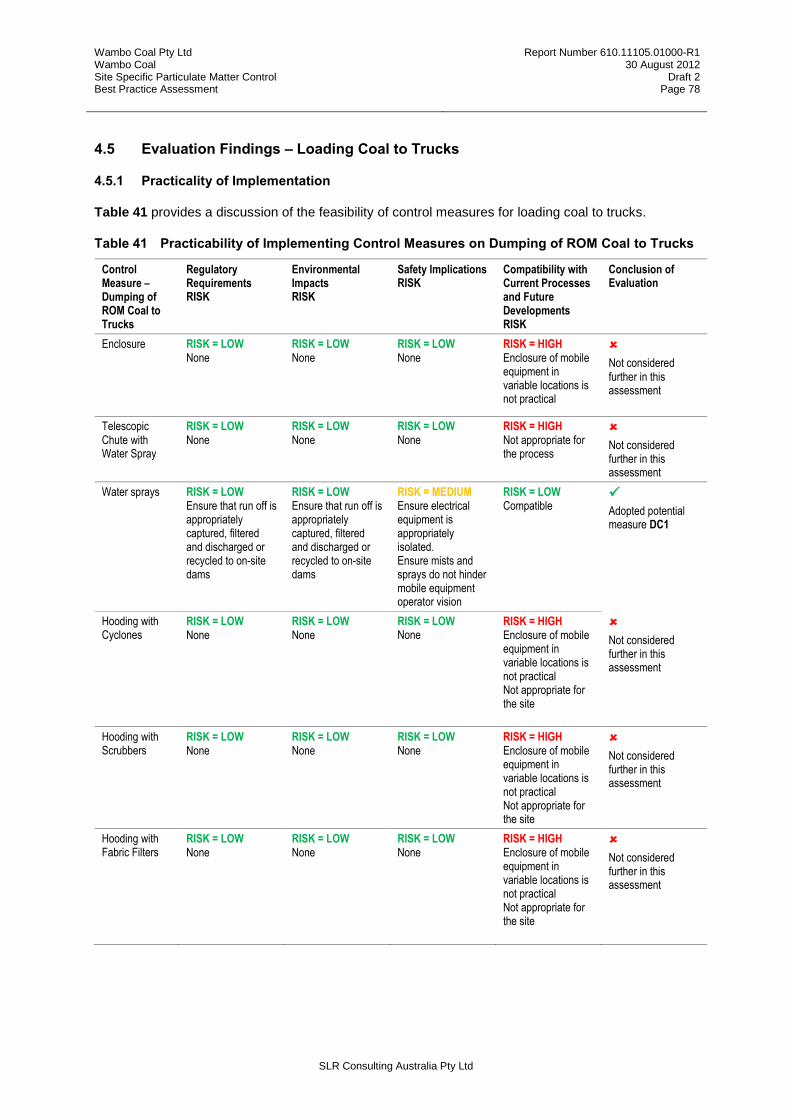
Wambo Coal Pty Ltd Wambo Coal Site Specific Particulate Matter Control Best Practice Assessment
Report Number 610.11105.01000-R1 30 August 2012
Draft 2 Page 78
SLR Consulting Australia Pty Ltd
4.5 Evaluation Findings – Loading Coal to Trucks
4.5.1 Practicality of Implementation
Table 41 provides a discussion of the feasibility of control measures for loading coal to trucks.
Table 41 Practicability of Implementing Control Measures on Dumping of ROM Coal to Trucks
Control Measure – Dumping of ROM Coal to Trucks
Regulatory Requirements RISK
Environmental Impacts RISK
Safety Implications RISK
Compatibility with Current Processes and Future Developments RISK
Conclusion of Evaluation
Enclosure RISK = LOW None
RISK = LOW None
RISK = LOW None
RISK = HIGH Enclosure of mobile equipment in variable locations is not practical
Not considered further in this assessment
Telescopic Chute with Water Spray
RISK = LOW None
RISK = LOW None
RISK = LOW None
RISK = HIGH Not appropriate for the process
Not considered further in this assessment
Water sprays RISK = LOW Ensure that run off is appropriately captured, filtered and discharged or recycled to on-site dams
RISK = LOW Ensure that run off is appropriately captured, filtered and discharged or recycled to on-site dams
RISK = MEDIUM Ensure electrical equipment is appropriately isolated. Ensure mists and sprays do not hinder mobile equipment operator vision
RISK = LOW Compatible
Adopted potential measure DC1
Hooding with Cyclones
RISK = LOW None
RISK = LOW None
RISK = LOW None
RISK = HIGH Enclosure of mobile equipment in variable locations is not practical Not appropriate for the site
Not considered further in this assessment
Hooding with Scrubbers
RISK = LOW None
RISK = LOW None
RISK = LOW None
RISK = HIGH Enclosure of mobile equipment in variable locations is not practical Not appropriate for the site
Not considered further in this assessment
Hooding with Fabric Filters
RISK = LOW None
RISK = LOW None
RISK = LOW None
RISK = HIGH Enclosure of mobile equipment in variable locations is not practical Not appropriate for the site
Not considered further in this assessment

Wambo Coal Pty Ltd Wambo Coal Site Specific Particulate Matter Control Best Practice Assessment
Report Number 610.11105.01000-R1 30 August 2012
Draft 2 Page 79
SLR Consulting Australia Pty Ltd
4.5.2 Implementation Costs
As required by EPA, the cost implication of each potential particulate control measure has been assessed, taking into account (where applicable):
Estimated capital expenditure.
Labour costs.
Material costs.
Potential cost savings.
An estimation of the cost and net cost per tonne of TSP, PM10 and PM2.5 suppressed is provided for each mitigation measure APPENDIX E.
4.6 Evaluation Findings – Loading Coarse Rejects to Trucks
4.6.1 Practicality of Implementation
Table 41 provides a discussion of the feasibility of control measures for loading coarse rejects to trucks.
Table 42 Practicability of Implementing Control Measures on Loading Coarse Rejects to Trucks
Control Measure – Loading Coarse Rejects to Trucks
Regulatory Requirements RISK
Environmental Impacts RISK
Safety Implications RISK
Compatibility with Current Processes and Future Developments RISK
Conclusion of Evaluation
Enclosure RISK = LOW None
RISK = LOW None
RISK = LOW None
RISK = HIGH Enclosure of mobile equipment in variable locations is not practical
Not considered further in this assessment
Telescopic Chute with Water Spray
RISK = LOW None
RISK = LOW None
RISK = LOW None
RISK = LOW Compatible
Adopted potential measure LCR1
Water sprays RISK = LOW Ensure that run off is appropriately captured, filtered and discharged or recycled to on-site dams
RISK = LOW Ensure that run off is appropriately captured, filtered and discharged or recycled to on-site dams
RISK = MEDIUM Ensure electrical equipment is appropriately isolated. Ensure mists and sprays do not hinder mobile equipment operator vision
RISK = LOW Compatible
Adopted potential measure LCR2
Hooding with Cyclones
RISK = LOW None
RISK = LOW None
RISK = LOW None
RISK = HIGH Not considered to be appropriate control
Not considered further in this assessment
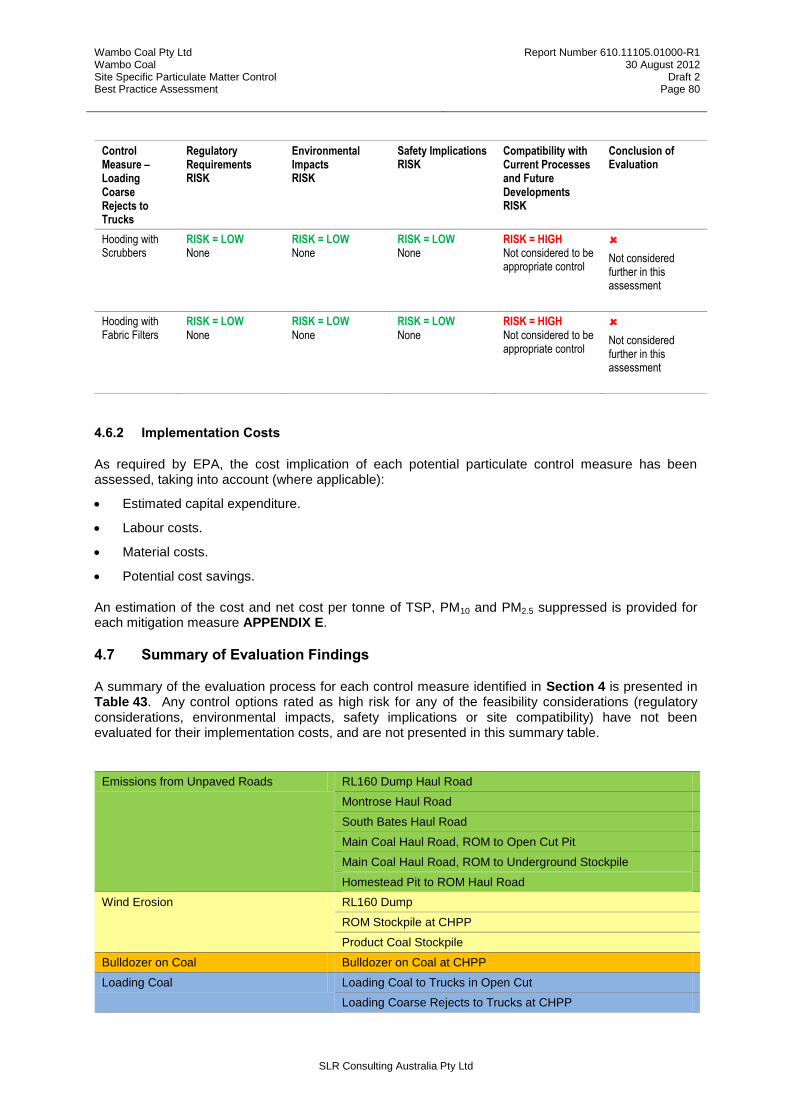
Wambo Coal Pty Ltd Wambo Coal Site Specific Particulate Matter Control Best Practice Assessment
Report Number 610.11105.01000-R1 30 August 2012
Draft 2 Page 80
SLR Consulting Australia Pty Ltd
Control Measure – Loading Coarse Rejects to Trucks
Regulatory Requirements RISK
Environmental Impacts RISK
Safety Implications RISK
Compatibility with Current Processes and Future Developments RISK
Conclusion of Evaluation
Hooding with Scrubbers
RISK = LOW None
RISK = LOW None
RISK = LOW None
RISK = HIGH Not considered to be appropriate control
Not considered further in this assessment
Hooding with Fabric Filters
RISK = LOW None
RISK = LOW None
RISK = LOW None
RISK = HIGH Not considered to be appropriate control
Not considered further in this assessment
4.6.2 Implementation Costs
As required by EPA, the cost implication of each potential particulate control measure has been assessed, taking into account (where applicable):
Estimated capital expenditure.
Labour costs.
Material costs.
Potential cost savings.
An estimation of the cost and net cost per tonne of TSP, PM10 and PM2.5 suppressed is provided for each mitigation measure APPENDIX E.
4.7 Summary of Evaluation Findings
A summary of the evaluation process for each control measure identified in Section 4 is presented in Table 43. Any control options rated as high risk for any of the feasibility considerations (regulatory considerations, environmental impacts, safety implications or site compatibility) have not been evaluated for their implementation costs, and are not presented in this summary table.
Emissions from Unpaved Roads RL160 Dump Haul Road
Montrose Haul Road
South Bates Haul Road
Main Coal Haul Road, ROM to Open Cut Pit
Main Coal Haul Road, ROM to Underground Stockpile
Homestead Pit to ROM Haul Road
Wind Erosion RL160 Dump
ROM Stockpile at CHPP
Product Coal Stockpile
Bulldozer on Coal Bulldozer on Coal at CHPP
Loading Coal Loading Coal to Trucks in Open Cut
Loading Coarse Rejects to Trucks at CHPP
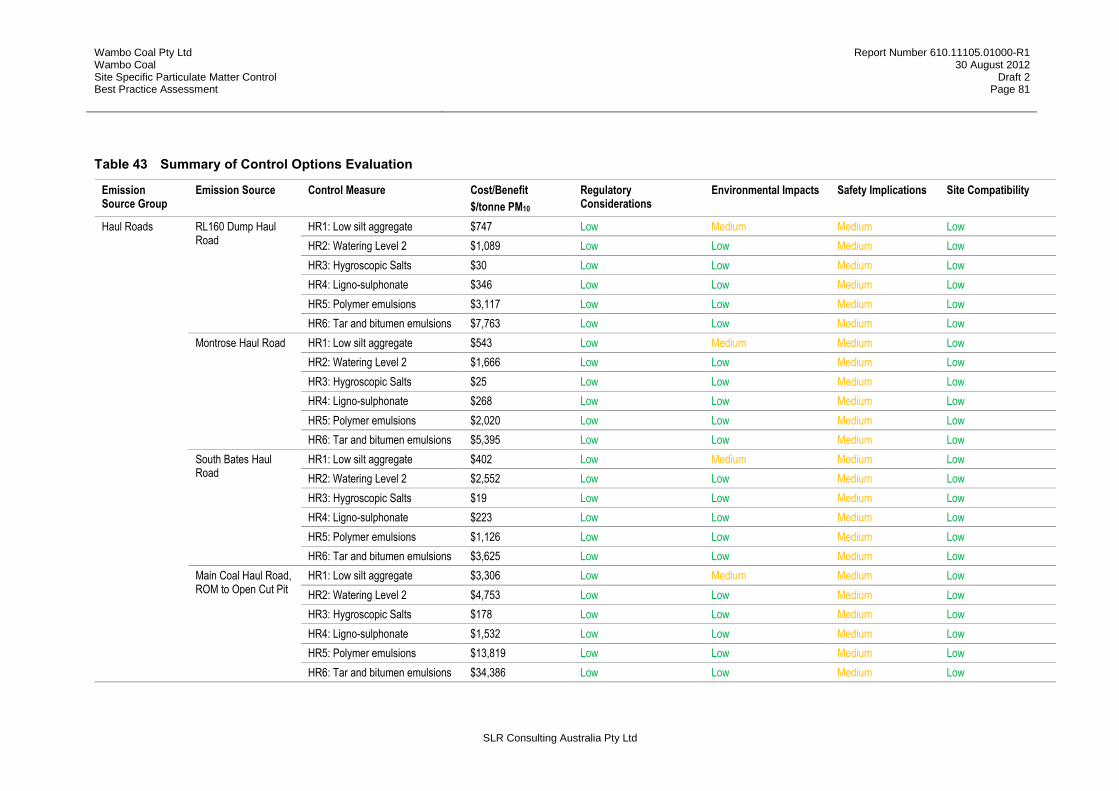
Wambo Coal Pty Ltd Wambo Coal Site Specific Particulate Matter Control Best Practice Assessment
Report Number 610.11105.01000-R1 30 August 2012
Draft 2 Page 81
SLR Consulting Australia Pty Ltd
Table 43 Summary of Control Options Evaluation
Emission Source Group
Emission Source Control Measure Cost/Benefit
$/tonne PM10
Regulatory Considerations
Environmental Impacts Safety Implications Site Compatibility
Haul Roads RL160 Dump Haul Road
HR1: Low silt aggregate $747 Low Medium Medium Low
HR2: Watering Level 2 $1,089 Low Low Medium Low
HR3: Hygroscopic Salts $30 Low Low Medium Low
HR4: Ligno-sulphonate $346 Low Low Medium Low
HR5: Polymer emulsions $3,117 Low Low Medium Low
HR6: Tar and bitumen emulsions $7,763 Low Low Medium Low
Montrose Haul Road HR1: Low silt aggregate $543 Low Medium Medium Low
HR2: Watering Level 2 $1,666 Low Low Medium Low
HR3: Hygroscopic Salts $25 Low Low Medium Low
HR4: Ligno-sulphonate $268 Low Low Medium Low
HR5: Polymer emulsions $2,020 Low Low Medium Low
HR6: Tar and bitumen emulsions $5,395 Low Low Medium Low
South Bates Haul Road
HR1: Low silt aggregate $402 Low Medium Medium Low
HR2: Watering Level 2 $2,552 Low Low Medium Low
HR3: Hygroscopic Salts $19 Low Low Medium Low
HR4: Ligno-sulphonate $223 Low Low Medium Low
HR5: Polymer emulsions $1,126 Low Low Medium Low
HR6: Tar and bitumen emulsions $3,625 Low Low Medium Low
Main Coal Haul Road, ROM to Open Cut Pit
HR1: Low silt aggregate $3,306 Low Medium Medium Low
HR2: Watering Level 2 $4,753 Low Low Medium Low
HR3: Hygroscopic Salts $178 Low Low Medium Low
HR4: Ligno-sulphonate $1,532 Low Low Medium Low
HR5: Polymer emulsions $13,819 Low Low Medium Low
HR6: Tar and bitumen emulsions $34,386 Low Low Medium Low

Wambo Coal Pty Ltd Wambo Coal Site Specific Particulate Matter Control Best Practice Assessment
Report Number 610.11105.01000-R1 30 August 2012
Draft 2 Page 82
SLR Consulting Australia Pty Ltd
Emission Source Group
Emission Source Control Measure Cost/Benefit
$/tonne PM10
Regulatory Considerations
Environmental Impacts Safety Implications Site Compatibility
Main Coal Haul Road, ROM to Underground Stockpile
HR1: Low silt aggregate $2,303 Low Medium Medium Low
HR2: Watering Level 2 $5,411 Low Low Medium Low
HR3: Hygroscopic Salts $107 Low Low Medium Low
HR4: Ligno-sulphonate $1,106 Low Low Medium Low
HR5: Polymer emulsions $9,037 Low Low Medium Low
HR6: Tar and bitumen emulsions $23,364 Low Low Medium Low
Homestead Pit to ROM Haul Road
HR1: Low silt aggregate $3,496 Low Medium Medium Low
HR2: Watering Level 2 $12,646 Low Low Medium Low
HR3: Hygroscopic Salts $189 Low Low Medium Low
HR4: Ligno-sulphonate $1,762 Low Low Medium Low
HR5: Polymer emulsions $12,477 Low Low Medium Low
HR6: Tar and bitumen emulsions $34,225 Low Low Medium Low
Wind Erosion of Overburden
RL160 Dump WE1:Watering $35,813 Low Low Medium Low
WE2: Chemical Suppressants $178,653 Low Low Medium Low
WE3: Fencing, bunding, shelterbelts
$1,810 Low Low Low Low
Wind Erosion of Coal Stockpiles
ROM Stockpile at CHPP
WEC1 Chemical wetting agents, surface crusting agents
$14,247 Low Medium Medium Medium
WEC2: Vegetative wind breaks, wind screens, 3-sided enclosures
$753 Low Low Low Low
WEC3: Reduce pile height $0 Low Low Low Low
WEC4: Pile shaping / orientation $0 Low Low Low Low
Product Coal Stockpile
WEC1: Chemical wetting agents, surface crusting agents
$13,927 Low Medium Medium Medium
WEC2: Vegetative wind breaks, wind screens, 3-sided enclosures
$386 Low Low Low Low
WEC3: Reduce pile height $0 Low Low Low Low
WEC4: Pile shaping / orientation $0 Low Low Low Low

Wambo Coal Pty Ltd Wambo Coal Site Specific Particulate Matter Control Best Practice Assessment
Report Number 610.11105.01000-R1 30 August 2012
Draft 2 Page 83
SLR Consulting Australia Pty Ltd
Emission Source Group
Emission Source Control Measure Cost/Benefit
$/tonne PM10
Regulatory Considerations
Environmental Impacts Safety Implications Site Compatibility
Loading Coal Loading Coal to Trucks in Open Cut
DC1: Water sprays $1,732 Low Low Medium Low
Loading Coarse Rejects to Trucks at CHPP
LCR1: Telescopic chute with water sprays
$9,996 Low Low Low Low
LCR2: Water sprays $14,995 Low Low Medium Low

Wambo Coal Pty Ltd Wambo Coal Site Specific Particulate Matter Control Best Practice Assessment
Report Number 610.11105.01000-R1 30 August 2012
Draft 2 Page 84
SLR Consulting Australia Pty Ltd
4.8 Cost Curves
For each identified control measure evaluated as part of this process for the emission sources ranked as contributing the top 95% of TSP emissions in Table 17 a cost curve has been prepared to graphically display the relative effectiveness and relative cost of those controls. Displaying the collated data as a cost curve is a recognised industry-standard approach to visually identifying the preferential options.
The width of the each bar indicates the particulate mitigation afforded by each measure, with the height of each bar indicating the cost per unit of mitigation. Therefore, a wide and short bar indicates a measure that could potentially (and relatively) provide a greater level of particulate mitigation at a lower cost. These are the measures that should be prioritised for further investigation.
Figure 24 PM10 Abatement Cost Curve
Key:
1 ROM Stockpile at CHPP: WEC3: Reduce pile height
2 ROM Stockpile at CHPP: WEC4: Pile shaping / orientation
3 Product Coal Stockpile: WEC3: Reduce pile height
4 Product Coal Stockpile: WEC4: Pile shaping / orientation
5 South Bates Haul Road: HR3: Hygroscopic Salts
6 Montrose Haul Road: HR3: Hygroscopic Salts
7 RL160 Dump Haul Road: HR3: Hygroscopic Salts
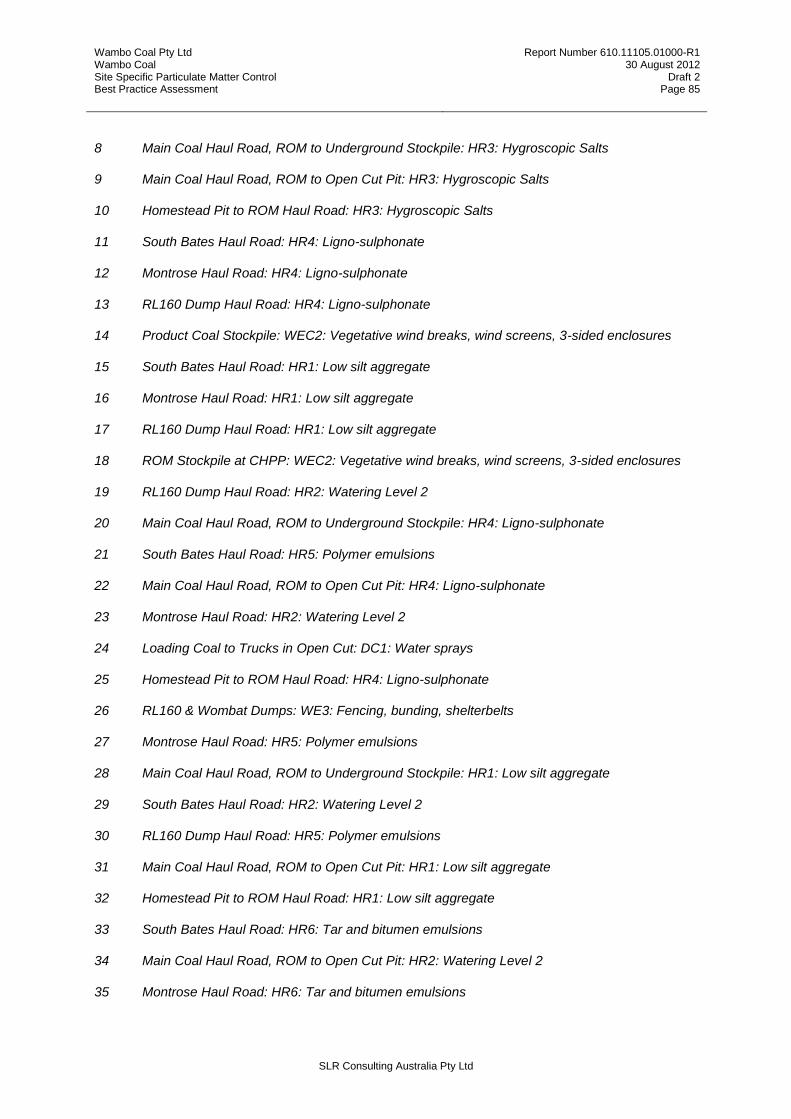
Wambo Coal Pty Ltd Wambo Coal Site Specific Particulate Matter Control Best Practice Assessment
Report Number 610.11105.01000-R1 30 August 2012
Draft 2 Page 85
SLR Consulting Australia Pty Ltd
8 Main Coal Haul Road, ROM to Underground Stockpile: HR3: Hygroscopic Salts
9 Main Coal Haul Road, ROM to Open Cut Pit: HR3: Hygroscopic Salts
10 Homestead Pit to ROM Haul Road: HR3: Hygroscopic Salts
11 South Bates Haul Road: HR4: Ligno-sulphonate
12 Montrose Haul Road: HR4: Ligno-sulphonate
13 RL160 Dump Haul Road: HR4: Ligno-sulphonate
14 Product Coal Stockpile: WEC2: Vegetative wind breaks, wind screens, 3-sided enclosures
15 South Bates Haul Road: HR1: Low silt aggregate
16 Montrose Haul Road: HR1: Low silt aggregate
17 RL160 Dump Haul Road: HR1: Low silt aggregate
18 ROM Stockpile at CHPP: WEC2: Vegetative wind breaks, wind screens, 3-sided enclosures
19 RL160 Dump Haul Road: HR2: Watering Level 2
20 Main Coal Haul Road, ROM to Underground Stockpile: HR4: Ligno-sulphonate
21 South Bates Haul Road: HR5: Polymer emulsions
22 Main Coal Haul Road, ROM to Open Cut Pit: HR4: Ligno-sulphonate
23 Montrose Haul Road: HR2: Watering Level 2
24 Loading Coal to Trucks in Open Cut: DC1: Water sprays
25 Homestead Pit to ROM Haul Road: HR4: Ligno-sulphonate
26 RL160 & Wombat Dumps: WE3: Fencing, bunding, shelterbelts
27 Montrose Haul Road: HR5: Polymer emulsions
28 Main Coal Haul Road, ROM to Underground Stockpile: HR1: Low silt aggregate
29 South Bates Haul Road: HR2: Watering Level 2
30 RL160 Dump Haul Road: HR5: Polymer emulsions
31 Main Coal Haul Road, ROM to Open Cut Pit: HR1: Low silt aggregate
32 Homestead Pit to ROM Haul Road: HR1: Low silt aggregate
33 South Bates Haul Road: HR6: Tar and bitumen emulsions
34 Main Coal Haul Road, ROM to Open Cut Pit: HR2: Watering Level 2
35 Montrose Haul Road: HR6: Tar and bitumen emulsions
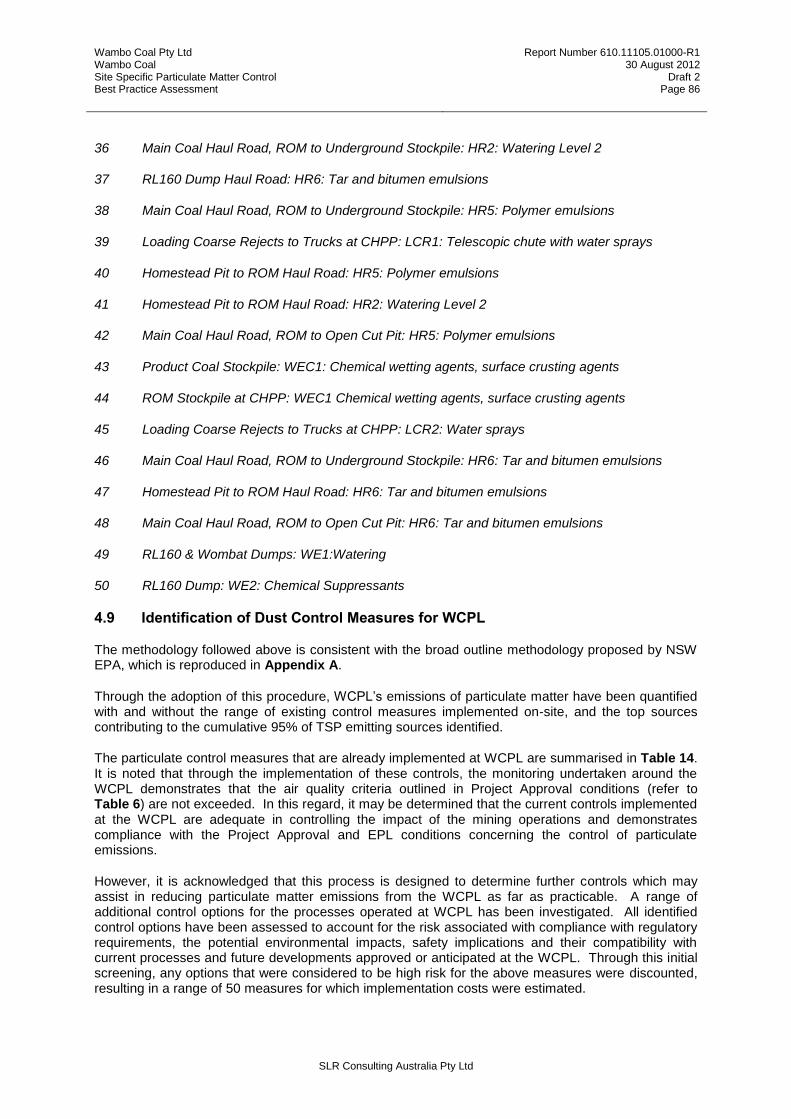
Wambo Coal Pty Ltd Wambo Coal Site Specific Particulate Matter Control Best Practice Assessment
Report Number 610.11105.01000-R1 30 August 2012
Draft 2 Page 86
SLR Consulting Australia Pty Ltd
36 Main Coal Haul Road, ROM to Underground Stockpile: HR2: Watering Level 2
37 RL160 Dump Haul Road: HR6: Tar and bitumen emulsions
38 Main Coal Haul Road, ROM to Underground Stockpile: HR5: Polymer emulsions
39 Loading Coarse Rejects to Trucks at CHPP: LCR1: Telescopic chute with water sprays
40 Homestead Pit to ROM Haul Road: HR5: Polymer emulsions
41 Homestead Pit to ROM Haul Road: HR2: Watering Level 2
42 Main Coal Haul Road, ROM to Open Cut Pit: HR5: Polymer emulsions
43 Product Coal Stockpile: WEC1: Chemical wetting agents, surface crusting agents
44 ROM Stockpile at CHPP: WEC1 Chemical wetting agents, surface crusting agents
45 Loading Coarse Rejects to Trucks at CHPP: LCR2: Water sprays
46 Main Coal Haul Road, ROM to Underground Stockpile: HR6: Tar and bitumen emulsions
47 Homestead Pit to ROM Haul Road: HR6: Tar and bitumen emulsions
48 Main Coal Haul Road, ROM to Open Cut Pit: HR6: Tar and bitumen emulsions
49 RL160 & Wombat Dumps: WE1:Watering
50 RL160 Dump: WE2: Chemical Suppressants
4.9 Identification of Dust Control Measures for WCPL
The methodology followed above is consistent with the broad outline methodology proposed by NSW EPA, which is reproduced in Appendix A.
Through the adoption of this procedure, WCPL’s emissions of particulate matter have been quantified with and without the range of existing control measures implemented on-site, and the top sources contributing to the cumulative 95% of TSP emitting sources identified.
The particulate control measures that are already implemented at WCPL are summarised in Table 14. It is noted that through the implementation of these controls, the monitoring undertaken around the WCPL demonstrates that the air quality criteria outlined in Project Approval conditions (refer to Table 6) are not exceeded. In this regard, it may be determined that the current controls implemented at the WCPL are adequate in controlling the impact of the mining operations and demonstrates compliance with the Project Approval and EPL conditions concerning the control of particulate emissions.
However, it is acknowledged that this process is designed to determine further controls which may assist in reducing particulate matter emissions from the WCPL as far as practicable. A range of additional control options for the processes operated at WCPL has been investigated. All identified control options have been assessed to account for the risk associated with compliance with regulatory requirements, the potential environmental impacts, safety implications and their compatibility with current processes and future developments approved or anticipated at the WCPL. Through this initial screening, any options that were considered to be high risk for the above measures were discounted, resulting in a range of 50 measures for which implementation costs were estimated.

Wambo Coal Pty Ltd Wambo Coal Site Specific Particulate Matter Control Best Practice Assessment
Report Number 610.11105.01000-R1 30 August 2012
Draft 2 Page 87
SLR Consulting Australia Pty Ltd
The cost estimates have been prepared with reference to published and referenced data sources, experience or estimates from WCPL and a range of assumptions. All assumptions have been provided for clarification and transparency.
The cost / benefit ratio of the control options are presented in Table 43 and presented graphically in Figure 24. This analysis has identified the following control options as providing a significant potential to reduce the total emission of particulates from all sources at site.
4.9.1 Haul Roads
The use of low silt aggregate has been shown to provide cost effective particulate reductions for the following haul roads:
RL160 Dump Haul Road $747 per tonne PM10 suppressed
Montrose Haul Road $543 per tonne PM10 suppressed
South Bates Haul Road $402 per tonne PM10 suppressed
The use of hygroscopic salts has been identified as providing cost effective particulate reductions for the following haul roads:
RL160 Dump Haul Road $30 per tonne PM10 suppressed
Montrose Haul Road $25 per tonne PM10 suppressed
South Bates Haul Road $19 per tonne PM10 suppressed
Main Coal Haul Road ROM to Open Cut Pit $178 per tonne PM10 suppressed
Main Coal Haul Road ROM to Underground Stockpile $107 per tonne PM10 suppressed
Homestead Pit to ROM Haul Road $189 per tonne PM10 suppressed
Increased haul road watering has been identified as providing cost effective particulate reductions for the following haul roads:
RL160 Dump Haul Road $1,089 per tonne PM10 suppressed
A new water truck fill point has recently been installed at the WCPL to reduce the time taken for water trucks to travel between fill points. This will increase the rate of haul road watering at the WCPL.
The use of ligno-sulphonates have been identified as providing cost effective particulate reductions for the following haul roads:
RL160 Dump Haul Road $346 per tonne PM10 suppressed
Montrose Haul Road $268 per tonne PM10 suppressed
South Bates Haul Road $223 per tonne PM10 suppressed
Main Coal Haul Road ROM to Underground Stockpile $1,106 per tonne PM10 suppressed
The use of polymer or tar and bitumen emulsions have been identified as providing cost effective particulate reductions for the following haul roads:
South Bates Haul Road $3,625 per tonne PM10 suppressed
Main Coal Haul Road ROM to Open Cut Pit $34,386 per tonne PM10 suppressed
Main Coal Haul Road ROM to Underground Stockpile $23,364 per tonne PM10 suppressed
Homestead Pit to ROM Haul Road $34,225 per tonne PM10 suppressed

Wambo Coal Pty Ltd Wambo Coal Site Specific Particulate Matter Control Best Practice Assessment
Report Number 610.11105.01000-R1 30 August 2012
Draft 2 Page 88
SLR Consulting Australia Pty Ltd
Certain trials are currently being performed at the WCPL, including a trial of PetroTac (tar emulsion) which is planned to be extended.
Commitments
WCPL commit to the trial of the following dust suppression measures at the WCPL. Each trial will be complemented with a comprehensive field assessment to quantify particulate emissions from haul roads with and without the measure applied. A control efficiency will then be calculated which will assist in the confirmation of the assumptions used within this report.
Commitment 1 Polymer/tar and bitumen emulsions (PetroTac) will continue to be trialled on a 1 km stretch of the South Bates Haul Road over a period of 6 months. Following the trial, if measures are shown to provide reductions in particulate emissions at reasonable cost, widespread roll-out of measures will be implemented.
4.9.2 Wind Erosion of the RL160 Overburden Dump
The use of shelterbelts have been identified as the most cost-effective particulate reduction measure on the overburden dumps at a cost of $1,810 per tonne of PM10 suppressed. Additional watering and the use of chemical suppressants were shown to be restrictively expensive options.
Commitments
WCPL commit to the trial of vegetative shelterbelts on the RL160 dump. A trial will be complemented with a comprehensive field assessment to quantify particulate emissions from overburden dumps with and without the measure applied. A control efficiency will then be calculated which will assist in the confirmation of the assumptions used within this report.
Commitment 2 Vegetative wind breaks and wind screens will be trialled on the RL160 Dump over a period of 6 months. Following the trial, if the measure is shown to provide reductions in particulate emissions at reasonable cost, widespread roll-out of this measure will be implemented.
In addition to this commitment, the majority of the RL160 Dump will have been rehabilitated by the end of October 2012.
4.9.3 Wind Erosion of Coal Stockpiles
The reduction in coal stockpile heights and pile shaping and orientation are shown to provide emissions reductions at no additional costs.
The use of vegetative wind breaks and wind screens have also been identified as potentially proving emissions reductions at costs of $753 per tonne PM10 at the ROM Stockpile and $386 per tonne PM10 at the Product Coal Stockpile.
Commitments
WCPL commit to the trial of vegetative wind breaks and wind screens on the ROM coal and Product coal stockpiles. A trial will be complemented with a comprehensive field assessment to quantify particulate emissions from coal stockpiles with and without the measure applied. A control efficiency will then be calculated which will assist in the confirmation of the assumptions used within this report.
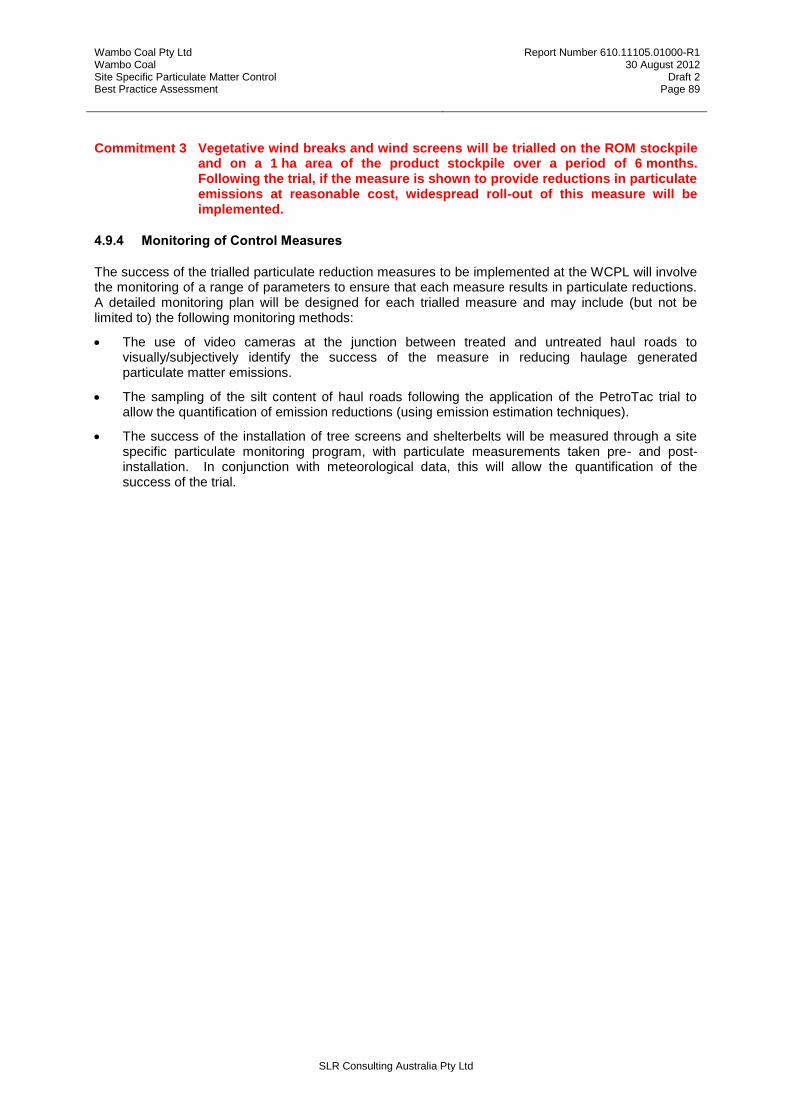
Wambo Coal Pty Ltd Wambo Coal Site Specific Particulate Matter Control Best Practice Assessment
Report Number 610.11105.01000-R1 30 August 2012
Draft 2 Page 89
SLR Consulting Australia Pty Ltd
Commitment 3 Vegetative wind breaks and wind screens will be trialled on the ROM stockpile and on a 1 ha area of the product stockpile over a period of 6 months. Following the trial, if the measure is shown to provide reductions in particulate emissions at reasonable cost, widespread roll-out of this measure will be implemented.
4.9.4 Monitoring of Control Measures
The success of the trialled particulate reduction measures to be implemented at the WCPL will involve the monitoring of a range of parameters to ensure that each measure results in particulate reductions. A detailed monitoring plan will be designed for each trialled measure and may include (but not be limited to) the following monitoring methods:
The use of video cameras at the junction between treated and untreated haul roads to visually/subjectively identify the success of the measure in reducing haulage generated particulate matter emissions.
The sampling of the silt content of haul roads following the application of the PetroTac trial to allow the quantification of emission reductions (using emission estimation techniques).
The success of the installation of tree screens and shelterbelts will be measured through a site specific particulate monitoring program, with particulate measurements taken pre- and post- installation. In conjunction with meteorological data, this will allow the quantification of the success of the trial.

Wambo Coal Pty Ltd Wambo Coal Site Specific Particulate Matter Control Best Practice Assessment
Report Number 610.11105.01000-R1 30 August 2012
Draft 2 Page 90
SLR Consulting Australia Pty Ltd
5 IMPLEMENTATION TIMEFRAME
4. Propose a timeframe for implementing all practicable best practice measures
4.1 For each of the best practice measures identified as being practicable in Step 3.2, provide a
timeframe for their implementation.
As discussed in Section 4.9, a range of particulate control measures have been identified which are compatible with a range of considerations (regulatory, environmental, safety and site compatibility). The most cost effective measures have been identified and WCPL has committed to a trial of all measures which demonstrate particulate reductions at costs of less than $1,500 per tonne of PM10 suppressed.
The widespread implementation of any measure has not been committed to at this time, as the control efficiencies afforded by each measure have been taken from literature. Site specific measurements of the control efficiencies are proposed as they will enable a refinement of the likely particulate reductions expected, prior to commitment to measures which may not realise the reductions estimated.
A comprehensive test program will be implemented within 6 months of report acceptance.
Wambo Coal Pty Ltd Wambo Coal Site Specific Particulate Matter Control Best Practice Assessment
Report Number 610.11105.01000-R1 30 August 2012
Draft 2 Page 91
SLR Consulting Australia Pty Ltd
6 REFERENCES
Countess Environmental (2006), WRAP Fugitive Dust Handbook.
Katestone (2010), NSW Coal Mining Benchmarking Study - International Best Practice Measures to Prevent and/or Minimise Emissions of Particulate Matter from Coal Mining.
US Department of Health and Human Services (2012), Dust Control Handbook for Industrial Minerals Mining and Processing.
USEPA (1995), AP 42, Fifth Edition, Compilation of Air Pollutant Emission Factors, Volume 1: Stationary Point and Area Sources, Technology Transfer Network - Clearinghouse for Inventories & Emissions Factors, United States Environmental Protection Agency, Office of Air Quality Planning and Standards, Research Triangle Park, NC 27711, USA.
USEPA (1998), AP 42, Chapter 11.9 Western Surface Coal Mining, Technology Transfer Network - Clearinghouse for Inventories & Emissions Factors, United States Environmental Protection Agency, Office of Air Quality Planning and Standards, Research Triangle Park, NC 27711, USA
USEPA (1982), AP 42, Chapter 11.24 Metallic Minerals Processing, Technology Transfer Network - Clearinghouse for Inventories & Emissions Factors, United States Environmental Protection Agency, Office of Air Quality Planning and Standards, Research Triangle Park, NC 27711, USA
USEPA (2006), AP 42, Chapter 13.2.2 Unpaved Roads, Technology Transfer Network - Clearinghouse for Inventories & Emissions Factors, United States Environmental Protection Agency, Office of Air Quality Planning and Standards, Research Triangle Park, NC 27711, USA
USEPA (2006), AP 42, Chapter 13.2.4 Aggregate Handling and Storage Piles, Technology Transfer Network - Clearinghouse for Inventories & Emissions Factors, United States Environmental Protection Agency, Office of Air Quality Planning and Standards, Research Triangle Park, NC 27711, USA.
USEPA (2006), AP 42, Chapter 13.2.5 Industrial Wind Erosion, Technology Transfer Network - Clearinghouse for Inventories & Emissions Factors, United States Environmental Protection Agency, Office of Air Quality Planning and Standards, Research Triangle Park, NC 27711, USA.
DCCEE (2011), National Pollutant Inventory Emission Estimation Technique Manual for Mining , Version 3, Australian Government Department of Sustainability, Environment, Water, Population and Communities.
WCPL (2011), Annual Environmental Management Report

Wambo Coal Pty Ltd Wambo Coal Site Specific Particulate Matter Control Best Practice Assessment
Report Number 610.11105.01000-R1 30 August 2012
Draft 2 Page 92
SLR Consulting Australia Pty Ltd
7 CLOSURE
This report has been prepared by SLR Consulting Australia Pty Ltd with all reasonable skill, care and diligence, and taking account of the manpower and resources devoted to it by agreement with the client. Information reported herein is based on the interpretation of data collected and has been accepted in good faith as being accurate and valid.
This report is for the exclusive use of Wambo Coal Pty Ltd. No warranties or guarantees are expressed or should be inferred by any third parties. This report may not be relied upon by other parties without written consent from SLR Consulting.
SLR Consulting disclaims any responsibility to the client and others in respect of any matters outside the agreed scope of the work.

Appendix A Report Number 610.11105.01000-R1
Page 1 of 3
SLR Consulting Australia Pty Ltd
COAL MINE PARTICULATE MATTER CONTROL BEST PRACTICE – SITE SPECIFIC DETERMINATION GUIDELINE
PURPOSE OF THIS GUIDELINE
The purpose of this guideline is to provide detail of the process to be followed in conducting a site specific determination of best practice measures to reduce emissions of particulate matter from coal mining activities.
This guideline also provides the required content and format of the report required for the Pollution Reduction Program “Coal Mine Particulate Matter Best Practice - Assessment and Report”.
THE SITE SPECIFIC DETERMINATION PROCESS
In preparing the Report, the following steps must be followed, as a minimum:
5. Identify, quantify and justify existing measures that are being used to minimise
particle emissions 5.1. Estimate baseline emissions of TSP, PM10 and PM2.5 (tonne per year) from each
mining activity. This estimate must:
utilise USEPA AP42 emission estimation techniques;
calculate uncontrolled emissions (with no particulate matter controls in place); and
calculate controlled emissions (with current particulate matter controls in place).
(Note: These particulate matter controls must be clearly identified, quantified and justified with supporting information). 5.2. Using the results of the controlled emissions estimates generated from Step 1.1,
rank the mining activities according to the mass of TSP, PM10 and PM2.5 emitted by each mining activity per year from highest to lowest.
5.3. Identify the top four mining activities from Step 1.2 that contribute the highest emissions of TSP, PM10 and PM2.5.
6. Identify, quantify and justify best practice measures that could be used to
minimise particle emissions 6.1. For each of the top four activities identified in Step 1.3, identify the best practice
measures that could be implemented to reduce emissions taking into consideration:
the findings of Katestone (2010), NSW Coal Mining Benchmarking Study - International Best Practice Measures to Prevent and/or Minimise Emissions of Particulate Matter from Coal Mining, Katestone Environmental Pty Ltd, Terrace 5, 249 Coronation Drive, PO Box 2217, Milton 4064, Queensland, Australia. http://www.environment.nsw.gov.au/resources/air/KE1006953coalminebmpreport.pdf ;
any other relevant published information; and
any relevant industry experience from either Australia or overseas. 6.2. For each of the top four activities identified in Step 1.3, estimate emissions of TSP,
PM10 and PM2.5 from each mining activity following the application of the best practice measures identified in Step 2.1.

Appendix A Report Number 610.11105.01000-R1
Page 2 of 3
SLR Consulting Australia Pty Ltd
7. Evaluate the practicability of implementing these best practice measures 7.1. For each of the best practice measures identified in Step 2.1, assess the
practicability associated with their implementation, by taking into consideration:
implementation costs;
regulatory requirements;
environmental impacts;
safety implications; and
compatibility with current processes and proposed future developments. 7.2. Identify those best practice measures that will be implemented at the premises to
reduce particle emissions. 8. Propose a timeframe for implementing all practicable best practice measures
8.1. For each of the best practice measures identified as being practicable in Step 3.2, provide a timeframe for their implementation.
REPORT CONTENT
The report must clearly identify the methodologies utilised and all assumptions made.
The report must contain detailed information justifying and supporting all of the information used in each step of the process. For example, in calculating controlled emissions in Step 1, current particulate matter controls being used at the mine must be clearly identified, quantified and justified with supporting information and evidence including monitoring data, record keeping, management plans and/or operator training etc.
In evaluating practicability in Step 3, the licensee must document the following specific information:
estimated capital, labour, materials and other costs for each best practice measure on an annual basis for a ten year period. This information must be set out in the format provided in Appendix A;
The details of any restrictions on the implementation of each best practice measure due to an existing approval or licence;
Quantification of any new or additional environmental impacts that may arise from the application of a particular best practice measure, such as increased noise or fresh water use;
The details of safety impacts that may result from the application of a particular best practice measure;
The details of any incompatibility with current operational practices on the premises; and
The details of any incompatibility with future development proposals on the premises.
REPORT FORMAT
The report must be structured according to the process outlined above and submitted in both electronic format as .PDF format and hard copy format in triplicate. All emission estimates, costs and supporting calculations must be submitted in electronic format as .XLS format.
ABBREVIATIONS AND DEFINITIONS
USEPA AP42 Emission Estimation Techniques – all of the following:
USEPA (1995), AP 42, Fifth Edition, Compilation of Air Pollutant Emission Factors, Volume 1: Stationary Point and Area Sources, Technology Transfer Network - Clearinghouse for Inventories & Emissions Factors, United States Environmental Protection Agency, Office of Air Quality Planning and

Appendix A Report Number 610.11105.01000-R1
Page 3 of 3
SLR Consulting Australia Pty Ltd
Standards, Research Triangle Park, NC 27711, USA. http://www.epa.gov/ttn/chief/ap42/index.html ;
USEPA (1998), AP 42, Chapter 11.9 Western Surface Coal Mining, Technology Transfer Network - Clearinghouse for Inventories & Emissions Factors, United States Environmental Protection Agency, Office of Air Quality Planning and Standards, Research Triangle Park, NC 27711, USA. http://www.epa.gov/ttn/chief/ap42/ch11/final/c11s09.pdf ;
USEPA (2006), AP 42, Chapter 13.2.2 Unpaved Roads, Technology Transfer Network - Clearinghouse for Inventories & Emissions Factors, United States Environmental Protection Agency, Office of Air Quality Planning and Standards, Research Triangle Park, NC 27711, USA. http://www.epa.gov/ttn/chief/ap42/ch13/final/c13s0202.pdf ;
USEPA (2006), AP 42, Chapter 13.2.4 Aggregate Handling and Storage Piles, Technology Transfer Network - Clearinghouse for Inventories & Emissions Factors, United States Environmental Protection Agency, Office of Air Quality Planning and Standards, Research Triangle Park, NC 27711, USA. http://www.epa.gov/ttn/chief/ap42/ch13/final/c13s0204.pdf ; and
USEPA (2006), AP 42, Chapter 13.2.5 Industrial Wind Erosion, Technology Transfer Network - Clearinghouse for Inventories & Emissions Factors, United States Environmental Protection Agency, Office of Air Quality Planning and Standards, Research Triangle Park, NC 27711, USA. http://www.epa.gov/ttn/chief/ap42/ch13/final/c13s0205.pdf .
PM10 – Particulate matter of 10 micrometres or less in diameter
PM2.5 - Particulate matter of 2.5 micrometres or less in diameter
Mining Activities – means:
Wheel generated particulates on unpaved roads
Wind erosion of overburden
Blasting
Bulldozing Coal
Trucks unloading overburden
Bulldozing overburden
Front-end loaders on overburden
Wind erosion of exposed areas
Wind erosion of coal stockpiles
Unloading from coal stockpiles
Dragline
Front-end loaders on overburden
Trucks unloading coal
Loading coal stockpiles
Graders
Drilling
Coal crushing
Material transfer of coal
Scrapers on overburden
Train loading
Screening; or
Material transfer of overburden
TSP - Total Suspended Particulate Matter

Appendix B Report Number 610.11105.01000-R1
Page 1 of 4
Emission Factors
SLR Consulting Australia Pty Ltd
Bulldozing coal
The emission factors for bulldozing coal are taken from Table 11.9-2 of Chapter 11.9 of AP-42 (USEPA, 1998):
( ⁄ ) ( )
( )
( ⁄ ) ( ( )
( ) )
( ⁄ ) ( ( )
( ) )
Where M is equal to the coal moisture content and s is equal to the coal silt content as provided in Table 4.
Front end loaders and excavators on coal and overburden
Specific emission factors for the operation of front end loaders and excavators on coal and overburden are not provided within AP-42. However, a default factor for TSP of 0.018 kg/t is provided in Table 11.9-4 of Chapter 11.9 of AP-42 (USEPA, 1998) for the activity of “truck loading by power shovel (batch drop)”. The note provided with this figure however, encourages the user to make use of the predictive emission factor equations in Chapter 13 of AP-42 instead.
The quantity of particulate emissions (kg) generated by a batch drop process (per tonne) (e.g. a truck dumping to a storage pile, or loading out from a pile to a truck) may be estimated using the following expression:
( ⁄ ) ( )
( )
Where EF is the emission factor for TSP, PM10 or PM2.5, k is the aerodynamic size multiplier (0.74 for TSP, 0.35 for PM10 and 0.053 for PM2.5), U is the mean wind speed in m/s and M is the moisture content of coal and overburden (refer Table 4).
An average wind speed of 1.9 m/s has been adopted for the WCPL, based on onsite meteorological monitoring for calendar year 2011.
Material transfer of coal by conveyor
Specific emission factors for the transfer of material by conveyor at transfer points are not provided within AP-42. The Environment Australia Document “National Pollutant Inventory for Mining (Version 3.0)” (June, 2011) identifies that emissions of particulates at miscellaneous transfer points (including conveying) are estimated using the same emission factor as outlined in Front end Loaders and excavators on coal and this emission factor has been adopted within this report, using specific information for coal as outlined in Table 4 of the main report.
Loading coal stockpiles
See Front end Loaders and excavators on coal.

Appendix B Report Number 610.11105.01000-R1
Page 2 of 4
Emission Factors
SLR Consulting Australia Pty Ltd
Wind erosion of coal stockpiles and overburden/disturbed areas
The emission factors for wind erosion of coal stockpiles and overburden are taken from Table 11.9-2 of Chapter 11.9 of AP-42 (USEPA, 1998) as discussed in Section 2.1.1.
( ⁄ )
Where u is equal to the wind speed (m/s). Hourly wind speed data from the WCPL for 8,760 hours
monitored during 2008 has been adopted.
Based on this data, an emission rate of TSP of 37,882 kg/ha/yr has been applied within this assessment. This equates to an average emission rate of 4 kg/ha/hr.
As discussed in Section 2.1, the application of the AP-42 emission factor equation relating to industrial wind erosion of overburden (Chapter 13.2.5) yielded unrealistic emissions when the threshold friction velocity for overburden (and coal dust) was applied. Therefore the emission factor for coal stockpiles has been applied to all areas subject to wind erosion.
No emission factors for PM10 are provided for this emission source within Table 11.9-2 of Chapter 11.9 of AP-42. An assumption that 50% of the TSP is emitted as PM10 has been adopted for the purposes of this assessment. This is in line with the PM10/TSP ratio quoted within the “National Pollutant Inventory for Mining (Version 3.0)” (June, 2011) for wind erosion sources.
Certain emission factors contained within the US EPA emission factor handbook AP-42 do not contain emission factors for PM2.5 as often little validated research has been undertaken to assess the fraction of PM10 which would be emitted as PM2.5 from the wide range of sources involved.
Limited research has been conducted by the Midwest Research Institute (MRI) on behalf of the Western Regional Air Partnership (WRAP) with findings published within the document entitled ‘Background Document for Revisions to Fine Fraction Ratios Used for AP-42 Fugitive Dust Emission Factors’ (MRI, 2006). This document provides seven proposed PM2.5/PM10 ratios for fugitive dust source categories as presented in Table 44.
Table 44 Proposed PM2.5 / PM10 Particle Size Ratios
Fugitive Dust Source AP-42 Section Proposed PM2.5 / PM10 Ratio
Paved Roads 13.2.1 0.15
Unpaved Roads 13.2.2 0.1
Aggregate Handling and Storage Piles 13.2.4 0.1
Industrial Wind Erosion 13.2.5 0.15
Open Area Wind Erosion - 0.15
The PM2.5 / PM10 ratios presented in Table 44 have been used within this report to calculate the emissions of PM2.5 attributable to the activities occurring at WCPL, where specific PM2.5 emission factors or scaling factors are not provided.
Coal crushing and screening
Emission factors for coal crushing are not provided specifically in AP-42 but are taken from AP-42 Chapter 11.24 Metallic Minerals Processing (1982). This approach is also taken within the National Pollutant Inventory for Mining (Version 3.0, June 2011).
Of relevance to this report are emission factors relating to primary coal crushing of high moisture (>4% by weight) coal and coal screening. Default emission factors for TSP and PM10 are provided for coal crushing as:
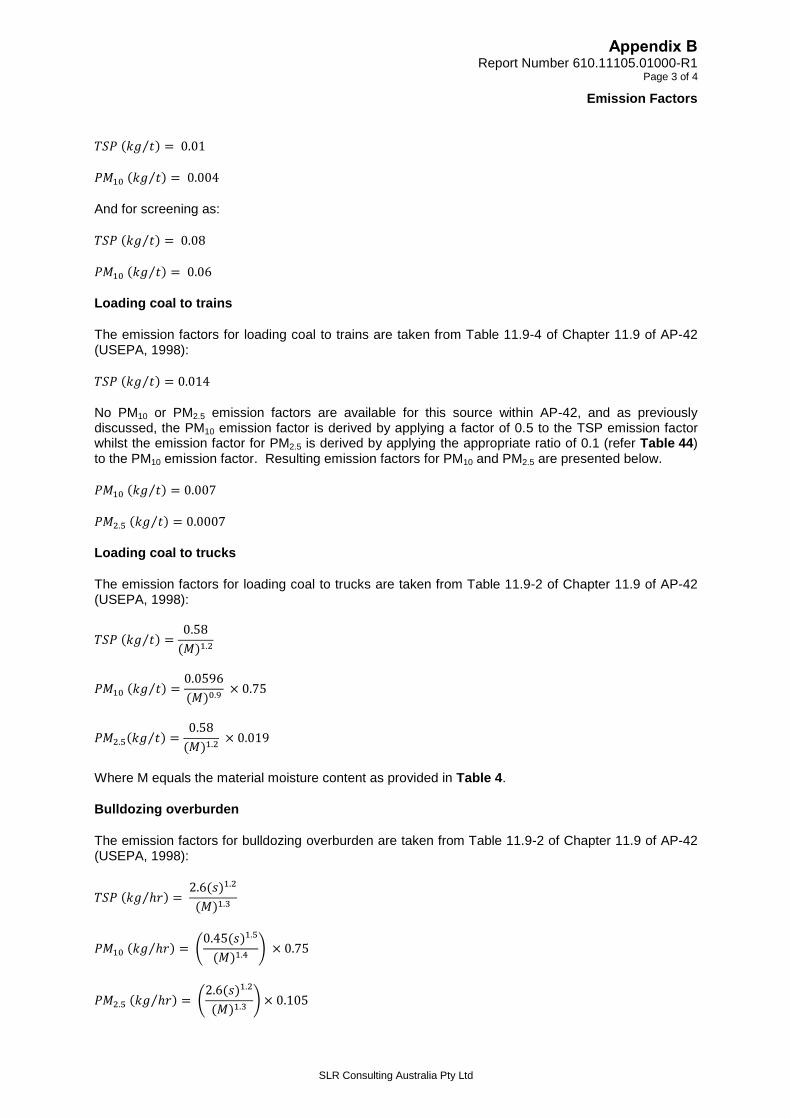
Appendix B Report Number 610.11105.01000-R1
Page 3 of 4
Emission Factors
SLR Consulting Australia Pty Ltd
( ⁄ )
( ⁄ )
And for screening as:
( ⁄ )
( ⁄ )
Loading coal to trains
The emission factors for loading coal to trains are taken from Table 11.9-4 of Chapter 11.9 of AP-42 (USEPA, 1998):
( ⁄ )
No PM10 or PM2.5 emission factors are available for this source within AP-42, and as previously discussed, the PM10 emission factor is derived by applying a factor of 0.5 to the TSP emission factor whilst the emission factor for PM2.5 is derived by applying the appropriate ratio of 0.1 (refer Table 44) to the PM10 emission factor. Resulting emission factors for PM10 and PM2.5 are presented below.
( ⁄ )
( ⁄ )
Loading coal to trucks
The emission factors for loading coal to trucks are taken from Table 11.9-2 of Chapter 11.9 of AP-42 (USEPA, 1998):
( ⁄ )
( )
( ⁄ )
( )
( ⁄ )
( )
Where M equals the material moisture content as provided in Table 4.
Bulldozing overburden
The emission factors for bulldozing overburden are taken from Table 11.9-2 of Chapter 11.9 of AP-42 (USEPA, 1998):
( ⁄ ) ( )
( )
( ⁄ ) ( ( )
( ) )
( ⁄ ) ( ( )
( ) )
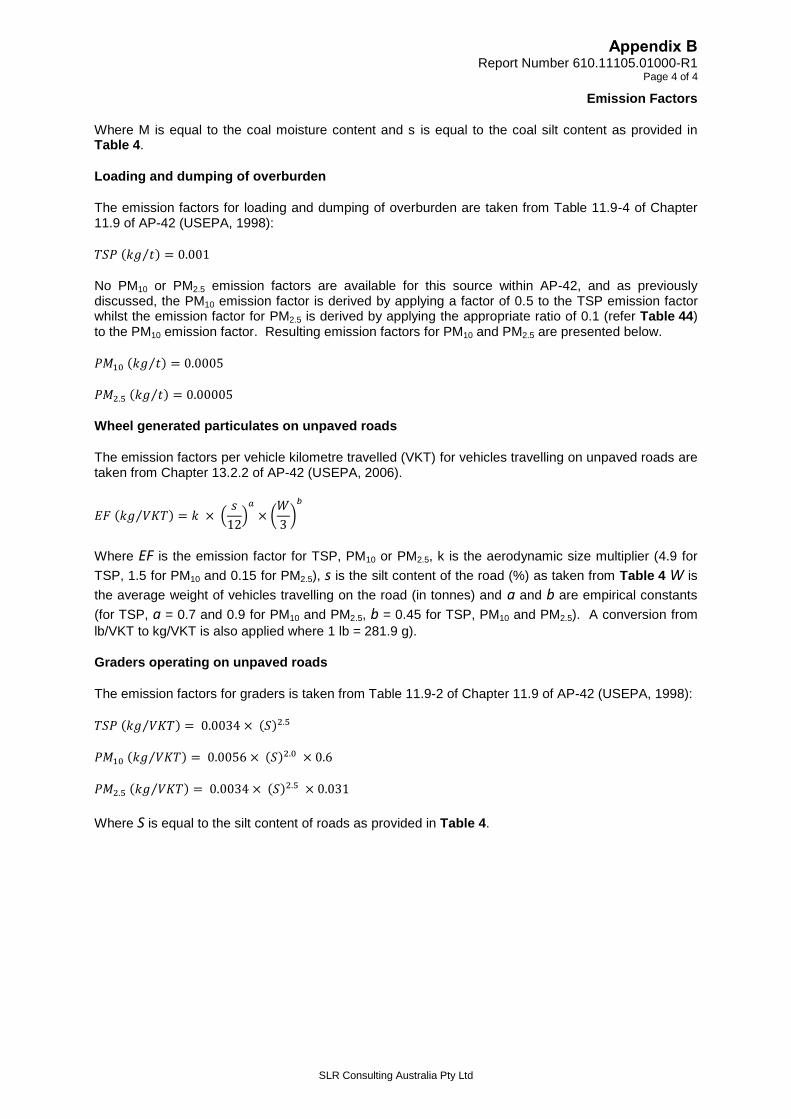
Appendix B Report Number 610.11105.01000-R1
Page 4 of 4
Emission Factors
SLR Consulting Australia Pty Ltd
Where M is equal to the coal moisture content and s is equal to the coal silt content as provided in Table 4.
Loading and dumping of overburden
The emission factors for loading and dumping of overburden are taken from Table 11.9-4 of Chapter 11.9 of AP-42 (USEPA, 1998):
( ⁄ )
No PM10 or PM2.5 emission factors are available for this source within AP-42, and as previously discussed, the PM10 emission factor is derived by applying a factor of 0.5 to the TSP emission factor whilst the emission factor for PM2.5 is derived by applying the appropriate ratio of 0.1 (refer Table 44) to the PM10 emission factor. Resulting emission factors for PM10 and PM2.5 are presented below.
( ⁄ )
( ⁄ )
Wheel generated particulates on unpaved roads
The emission factors per vehicle kilometre travelled (VKT) for vehicles travelling on unpaved roads are taken from Chapter 13.2.2 of AP-42 (USEPA, 2006).
( ⁄ ) (
)
(
)
Where EF is the emission factor for TSP, PM10 or PM2.5, k is the aerodynamic size multiplier (4.9 for
TSP, 1.5 for PM10 and 0.15 for PM2.5), s is the silt content of the road (%) as taken from Table 4 W is
the average weight of vehicles travelling on the road (in tonnes) and a and b are empirical constants
(for TSP, a = 0.7 and 0.9 for PM10 and PM2.5, b = 0.45 for TSP, PM10 and PM2.5). A conversion from
lb/VKT to kg/VKT is also applied where 1 lb = 281.9 g).
Graders operating on unpaved roads
The emission factors for graders is taken from Table 11.9-2 of Chapter 11.9 of AP-42 (USEPA, 1998):
( ⁄ ) ( )
( ⁄ ) ( )
( ⁄ ) ( )
Where S is equal to the silt content of roads as provided in Table 4.

Appendix C Report Number 610.11105.01000-R1
Page 1 of 1
ASSAY CERTIFICATES
SLR Consulting Australia Pty Ltd
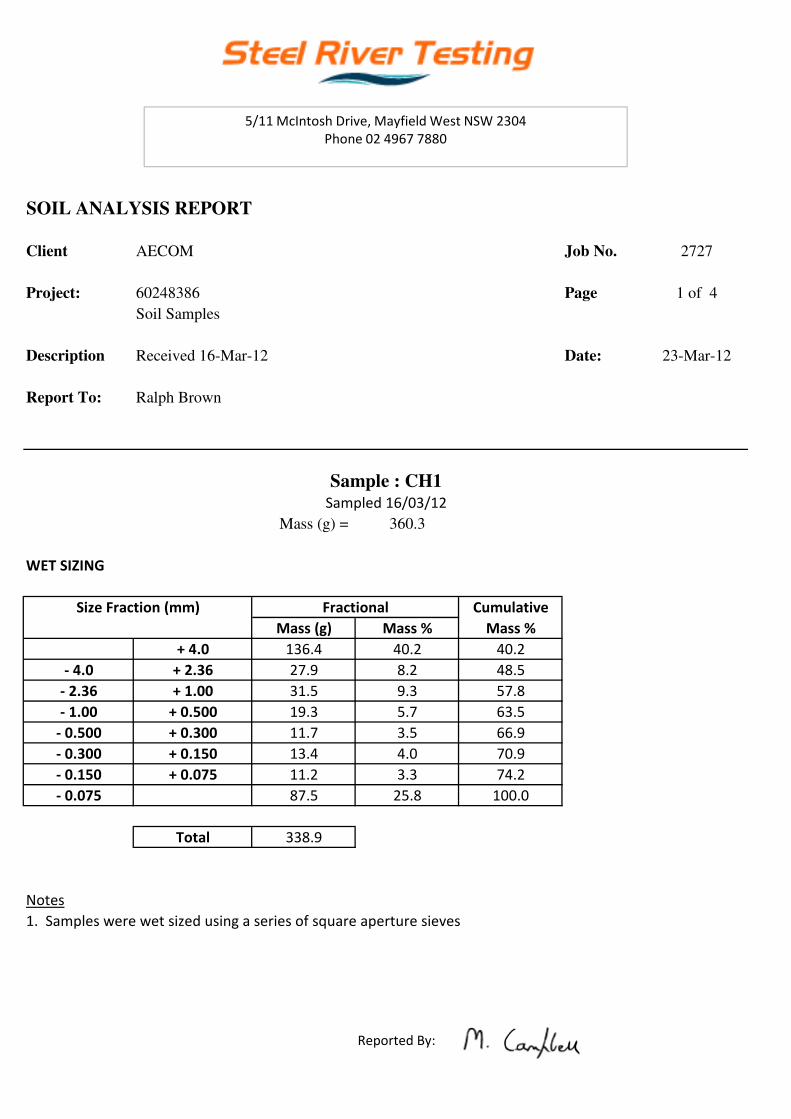
SOIL ANALYSIS REPORT
Client AECOM Job No. 2727
Project: 60248386 Page 1 of 4
Soil Samples
Description Received 16-Mar-12 Date: 23-Mar-12
Report To: Ralph Brown
Mass (g) = 360.3
WET SIZING
Cumulative
Mass (g) Mass % Mass %
+ 4.0 136.4 40.2 40.2
- 4.0 + 2.36 27.9 8.2 48.5
- 2.36 + 1.00 31.5 9.3 57.8
- 1.00 + 0.500 19.3 5.7 63.5
- 0.500 + 0.300 11.7 3.5 66.9
- 0.300 + 0.150 13.4 4.0 70.9
- 0.150 + 0.075 11.2 3.3 74.2
- 0.075 87.5 25.8 100.0
Total 338.9
Notes
1. Samples were wet sized using a series of square aperture sieves
Reported By:
Sample : CH1Sampled 16/03/12
FractionalSize Fraction (mm)
5/11 McIntosh Drive, Mayfield West NSW 2304
Phone 02 4967 7880

SOIL ANALYSIS REPORT
Client AECOM Job No. 2727
Project: 60248386 Page 2 of 4
Soil Samples
Description Received 16-Mar-12 Date: 23-Mar-12
Report To: Ralph Brown
Mass (g) = 356.0
WET SIZING
Cumulative
Mass (g) Mass % Mass %
+ 4.0 63.8 19.2 19.2
- 4.0 + 2.36 18.7 5.6 24.8
- 2.36 + 1.00 24.2 7.3 32.1
- 1.00 + 0.500 19.9 6.0 38.0
- 0.500 + 0.300 16.6 5.0 43.0
- 0.300 + 0.150 27.5 8.3 51.3
- 0.150 + 0.075 22.2 6.7 58.0
- 0.075 139.9 42.0 100.0
Total 332.8
Notes
1. Samples were wet sized using a series of square aperture sieves
Reported By:
Sample : CH2Sampled 16/03/12
Size Fraction (mm) Fractional
5/11 McIntosh Drive, Mayfield West NSW 2304
Phone 02 4967 7880

SOIL ANALYSIS REPORT
Client AECOM Job No. 2727
Project: 60248386 Page 3 of 4
Soil Samples
Description Received 16-Mar-12 Date: 23-Mar-12
Report To: Ralph Brown
Mass (g) = 258.5
WET SIZING
Cumulative
Mass (g) Mass % Mass %
+ 4.0 35.5 14.3 14.3
- 4.0 + 2.36 9.8 3.9 18.2
- 2.36 + 1.00 11.5 4.6 22.8
- 1.00 + 0.500 11.7 4.7 27.5
- 0.500 + 0.300 11.4 4.6 32.1
- 0.300 + 0.150 19.4 7.8 39.9
- 0.150 + 0.075 19.6 7.9 47.7
- 0.075 130.2 52.3 100.0
Total 249.1
Notes
1. Samples were wet sized using a series of square aperture sieves
Reported By:
Sample : CH3
Size Fraction (mm) Fractional
Sampled 16/03/12
5/11 McIntosh Drive, Mayfield West NSW 2304
Phone 02 4967 7880

SOIL ANALYSIS REPORT
Client AECOM Job No. 2727
Project: 60248386 Page 4 of 4
Soil Samples
Description Received 16-Mar-12 Date: 23-Mar-12
Report To: Ralph Brown
Mass (g) = 504.2
WET SIZING
Cumulative
Mass (g) Mass % Mass %
+ 4.0 32.9 6.8 6.8
- 4.0 + 2.36 4.3 0.9 7.7
- 2.36 + 1.00 6.7 1.4 9.1
- 1.00 + 0.500 14.2 2.9 12.0
- 0.500 + 0.300 17.5 3.6 15.7
- 0.300 + 0.150 77.9 16.2 31.8
- 0.150 + 0.075 76.6 15.9 47.7
- 0.075 252.1 52.3 100.0
Total 482.2
Notes
1. Samples were wet sized using a series of square aperture sieves
Reported By:
Sample : CH4
Size Fraction (mm) Fractional
Sampled 16/03/12
5/11 McIntosh Drive, Mayfield West NSW 2304
Phone 02 4967 7880

Appendix D Report Number 610.11105.01000-R1
Page 1 of 1
Standard Operating Procedures for Dust Management at WCPL
SLR Consulting Australia Pty Ltd

Standard Work Practice
Dust Management
4842-SE-SWP1021 10/01/2012 Page 1 of 4
“Unless marked “CONTROLLED” in RED on the front page when printed, the printed copy is an uncontrolled document”
Application
To provide a standard work practice for the management of dust and response to SMS High Dust Alerts.
Key hazards
The key hazards associated with undertaking this task are:
Not applicable
References
DM-SE-F103 Downer EDI Mining Wambo Environmental Management Plan
DM-SE-P15 Downer EDI Mining dust monitoring and control
Wambo Environmental Protection Licence No. 529
EMS 001 Wambo Coal Environmental Management Strategy
EMP 008 Wambo Air Quality Monitoring Program
4842-DM-TR-SWP33 Operation of a Bulk Water Truck
Requirements
Wambo Coal operates four dust monitoring stations that provide real time information to Downer EDI Mining operational personnel. This is achieved by an automatically produced SMS alert being sent from dust monitors to the Open Cut Examiner (OCE) (Production 7) mobile phone in the event that high dust levels are detected. Dust alarms are triggered when the 15 minute PM10 results are above 90µg/m3 for two consecutive 15 minute periods. If the 15 minute results come below 75µg/m3 and then go above 90µg/m3 again it is a new dust alarm. The alarms filter out wind conditions so alarms are only received when the wind is blowing from the direction of Wambo’s operations.
Table 1: AQ1, AQ2, AQ3 and AQ4 Dust Monitoring Locations
AQ04
AQ01
AQ02
AQ03

Standard Work Practice
Dust Management
4842-SE-SWP1021 10/01/2012 Page 2 of 4
“Unless marked “CONTROLLED” in RED on the front page when printed, the printed copy is an uncontrolled document”
1. General Dust Management (Daily Operations)
Ensure water carts are mobilised as first priority before trucks enter circuit
Call water carts to areas of priority
Ensure full utilisation of available water carts by scheduling re-fuelling, crib breaks and filling of carts so that they are not all parked up at the same time
Minimise travel time of empty water carts by directing water cart operators to ensure tanks are full before heading to areas that are a greater distance from the fill point.
2. Dust Reduction Methods (Low Level to High Level response)
Priority Dust Reduction Method
1 Assign water cart to high priority areas
2 Reduce speed of trucks
3 Utilise lower RL dumps
4 Stop operations in high exposure areas i.e. topsoil loading and dumping, rehab areas
5 Minimise areas of operation (shut down a circuit/s)
6 Stop all operations
3. SMS Received – First Response
In the event that an SMS Alert for high dust level is received by the OCE (Production 7) or excessive dust is noted on site but an SMS Dust Alert has not been received the following steps should be taken:
Identify the major sources of dust
Apply appropriate actions listed in ‘Dust Reduction Methods’
Record information in 4842-SE-F1027 Dust Management Response located in the OCE office.
Production 7 is responsible for responding to SMS High Dust alerts.
Competency required
None Applicable
Personal Protective Equipment (PPE) / Special equipment
As per site requirements.
Records
SMS Dust Alert responses and any exceptional actions taken to reduce dust emissions without the prompting of the SMS high dust alert must be recorded by the end of each shift. Completed records to be filed in Environment File 11 located in the HSE Office
4842-SE-F1027 Dust Management Response

Standard Work Practice
Dust Management
4842-SE-SWP1021 10/01/2012 Page 3 of 4
“Unless marked “CONTROLLED” in RED on the front page when printed, the printed copy is an uncontrolled document”
4842-SE-SWP1021 - Assessment Paper
Employee Name: Assessors Name:
Employee Signature: Assessors Signature:
Project: Date:
/ /
The trainee is required to answer all questions correctly in order to be deemed to have adequate understanding of the SWP. The trainer/assessor shall re-train/re-assess all incorrect answers.
Question and Response R-T C
1. List 3 actions that can help manage daily dust levels on site.
1/_____________________________________________________________
2/_____________________________________________________________
3/_____________________________________________________________
2. Dust alarms are triggered when the 15 minute PM10 results are above 90µg/m3 for two consecutive 15 minute periods.
True False
3. What must the OCE do when a SMS Dust Alert is received?
_______________________________________________________________
_______________________________________________________________
_______________________________________________________________
_______________________________________________________________
4. Who is responsible for responding to SMS High Dust alerts?
_______________________________________________________________
_______________________________________________________________

Standard Work Practice
Dust Management
4842-SE-SWP1021 10/01/2012 Page 4 of 4
“Unless marked “CONTROLLED” in RED on the front page when printed, the printed copy is an uncontrolled document”
5. List 2 ‘Dust Reduction Methods’.
1/_____________________________________________________________
2/_____________________________________________________________
6. What information relating to dust management should be recorded by the OCE at the end of each shift?
_____________________________________________________________
_____________________________________________________________
_____________________________________________________________
Assessor
Assessor Comments: (i.e. List any questions that were retrained / re-assessed)
Please sign and date when the “SWP Assessment” is completed.
The candidate is hereby deemed competent on the date of assessment.
Assessor Name (Print) Assessor Signature Date
/ /
Candidate Name (Print) Candidate Signature
I understand the requirements of this SWP.
Date
/ /
Document Revision History
Ver Date Author Reviewed Approved Reason RA Ref.
1 10/01/12 S.Steward K.McDermott e.g. Initial issue Insert RA No.

Dust Management Records
4842-SE-F1027 Dust Management Records 10/01/2012 Page 1 of 2
Name: Date: Time:
SMS alert prompt? YES / NO Monitoring Station (circle): AQ01 AQ02 AQ03 AQ04
What was your opinion of dust levels at the time?
What was the primary cause of dust?
What actions were undertaken to reduce dust levels?
Name: Date: Time:
SMS alert prompt? YES / NO Monitoring Station (circle): AQ01 AQ02 AQ03 AQ04
What was your opinion of dust levels at the time?
What was the primary cause of dust?
What actions were undertaken to reduce dust levels?
© D
ow
ner E
DI M
inin
g P
ty L
td. T
his
work
is c
opyrig
ht. O
ther th
an a
s p
erm
itted b
y la
w, n
o p
art o
f it may b
e re
pro
duced,
sto
red in
a re
trieval s
yste
m o
r transm
itted in
any fo
rm o
r by a
ny p
rocess w
ithout p
rior w
ritten p
erm
issio
n.

Dust Management Records
4842-SE-F1027 Dust Management Records 10/01/2012 Page 2 of 2
Name: Date: Time:
SMS alert prompt? YES / NO Monitoring Station (circle): AQ01 AQ02 AQ03 AQ04
What was your opinion of dust levels at the time?
What was the primary cause of dust?
What actions were undertaken to reduce dust levels?
Name: Date: Time:
SMS alert prompt? YES / NO Monitoring Station (circle): AQ01 AQ02 AQ03 AQ04
What was your opinion of dust levels at the time?
What was the primary cause of dust?
What actions were undertaken to reduce dust levels?

Appendix E Report Number 610.11105.01000-R1
Page 1 of 1
Cost Tables for Dust Suppression Measures -WCPL
SLR Consulting Australia Pty Ltd