itepsrv2.ucc.nau.eduitepsrv2.ucc.nau.edu/.../EIF-3-Notes_TEISSIntroduction.docx · Web viewThis...
42
EI-Fundamentals, Module 3 - Introduction to TEISS Discussion of Homework Learning Objectives: This module is an introduction to TEISS. I am going to open an existing project containing data from the NEI database that has already been imported into TEISS. Then I am going to demonstrate opening a new project. Learning objectives for this session: Know how to view point data in the TEISS input view . Know how to view point and nonpoint data using the TEISS reports . Know how start a new TEISS project . This module will demonstrate EI-Fundamentals-3A: Opening an Existing TEISS Project Opening an Existing TEISS Project: We are going to demonstrate this, and please watch this demonstration rather than trying to follow along. Find the TEISS View icon in the Start menu of your computer and click it to launch TEISS. If the TEISS View icon is not shown, you can select All Programs, then Lakes Environmental, and then select TEISS View. You can also generate a shortcut to TEISS on your desktop. 1
Transcript of itepsrv2.ucc.nau.eduitepsrv2.ucc.nau.edu/.../EIF-3-Notes_TEISSIntroduction.docx · Web viewThis...

EI-Fundamentals, Module 3 - Introduction to TEISS
Discussion of Homework
Learning Objectives: This module is an introduction to TEISS. I am going to open an existing project containing data from the NEI database that has already been imported into TEISS. Then I am going to demonstrate opening a new project. Learning objectives for this session:
Know how to view point data in the TEISS input view.
Know how to view point and nonpoint data using the TEISS reports.
Know how start a new TEISS project.
This module will demonstrate
EI-Fundamentals-3A: Opening an Existing TEISS Project
Opening an Existing TEISS Project: We are going to demonstrate this, and please watch this demonstration rather than trying to follow along. Find the TEISS View icon in the Start menu of your computer and click it to launch TEISS. If the TEISS View icon is not shown, you can select All Programs, then Lakes Environmental, and then select TEISS View. You can also generate a shortcut to TEISS on your desktop.
1

A splash screen will appear with an image of the Grand Canyon, and the current version. Click the OK button.
A blank screen will appear with the icons New and Open active in the TEISS toolbar at the top of the screen.
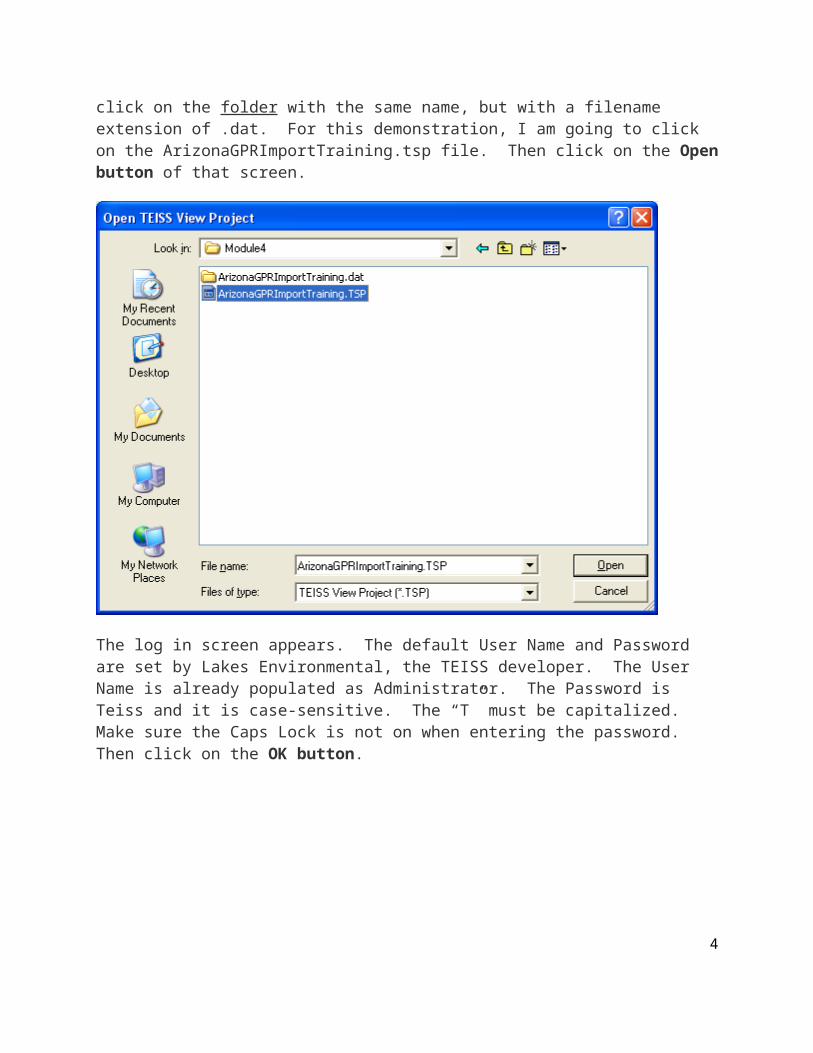
All TEISS projects are organized with a file ending in (filename extension) of .TSP, with an associated folder. You can only open TEISS projects from within TEISS, by opening the file with the filename extension .TSP, as shown below. (We have a video of how to set up your computer to show these filename extensions on our website, and doing this will help you in all your computer tasks.)
For this demonstration, I am going to open an existing project, so I am going to click on Open. This opens a box showing the location of the most recent TEISS project that you have opened. To open an existing TEISS project, click on the file with a filename extension of .tsp to select it. Make sure you do not click on the folder with the same name, but with a filename extension of .dat. For this demonstration, I am going to click on the ArizonaGPRImportTraining.tsp file. Then click on the Open button of that screen.
2

The log in screen appears. The default User Name and Password are set by Lakes Environmental, the TEISS developer. The User Name is already populated as Administrator. The Password is Teiss and it is case-sensitive. The “T” must be capitalized. Make sure the Caps Lock is not on when entering the password. Then click on the OK button.
The TEISS project opens. The map shows the state of Arizona. In this example, I did not import any reservation land coverage. On the lower right corner of the screen, you can see icons indicating that there are facility, release point, and nonpoint data in this
3
project. This is because I previously imported NEI data for counties in Arizona into the TEISS project.
At this point, we HIGHLY recommend that you make a sticky note with this login information and post it on your computer, on the inside cover of your EI notebook, or where you can find it every time you work on TEISS:
EI-Fundamentals-3B: TEISS Point Sources
4

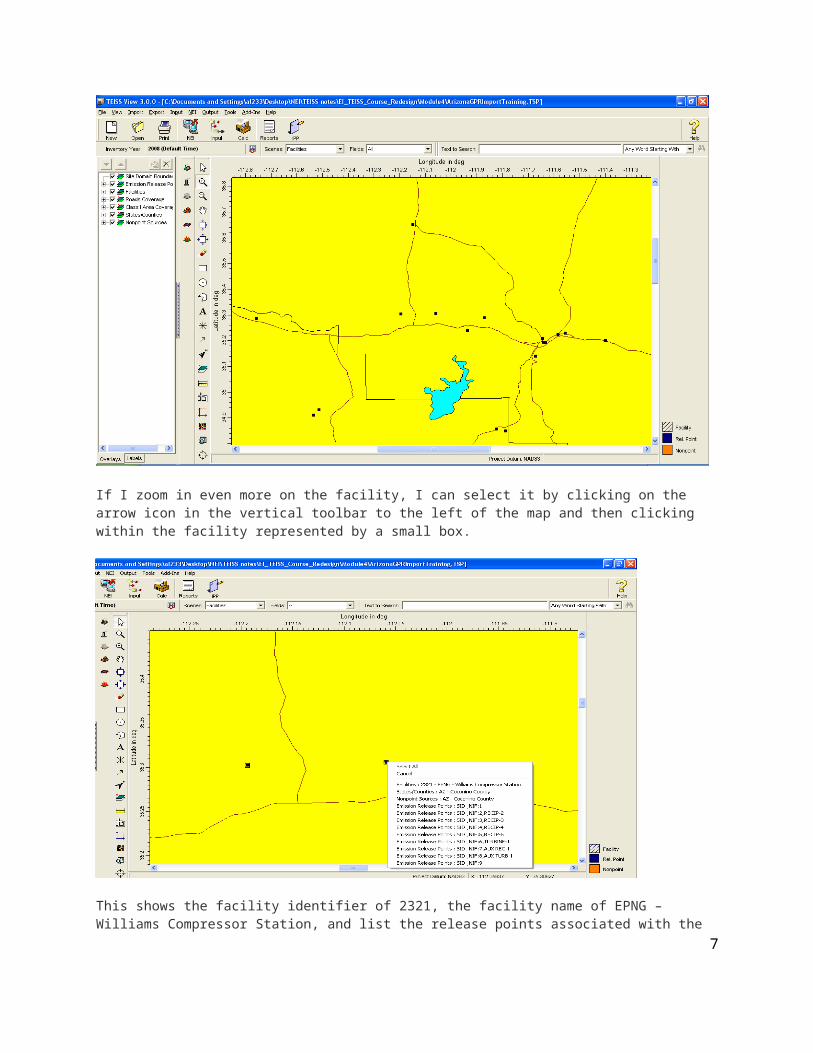
Finding Point Sources on the Map: Now I am going to zoom in on the map by clicking on the magnifying glass with a plus sign in it icon in the vertical toolbar to the left of the map. I want to get closer to the area I live in and see what point sources are nearby. The point sources are represented by the small blue boxes on the map. I am interested in seeing data on this facility in Coconino County.
If I zoom in even more on the facility, I can select it by clicking on the arrow icon in the vertical toolbar to the left of the map and then clicking within the facility represented by a small box.
5

This shows the facility identifier of 2321, the facility name of EPNG – Williams Compressor Station, and list the release points associated with the facility. If you are interested in identifying other facilities, you can then click on them. In the development of your Level 4 EI or the off reservation section of a Level 1, 2, or 3 EI, you can use this method of identification to start a list of facilities of interest that are within your buffer zone. After identifying the name of each facility by clicking on it, record it in your table of point sources. (If you accidentally select a source that you did not mean to you can right-click to unselect. Take a minute to read the first few paragraphs of the Point Sources section of the mock Level 4 EI. Look at Table 2: List of Facilities within Ten Mile Buffer Zone. This method of identification was used to populate the Facility Name column in this table.
EI-Fundamentals-3C: TEISS Data Input View
Viewing Point Data in Input View:, If I select the facility in the list by highlighting it and clicking on it, I can then right click on the facility and select Edit to view the point data in TEISS input view (even though I selected Edit, I can simply view the data without actually making any edits). Note that Input View, aka the Linear Data Entry screen, can be accessed either from the map directly, as shown in this example, or from the Input menu option or Input icon in the TEISS toolbar.
6
7

This opens in the Facility editing window of TEISS for this facility. In this window, I can see the facility information for this site. The green fields are required and the white fields are optional if you are submitting the data to the EPA NEI database. Scrolling through this window shows that this is a pipeline compressor station located in Williams, AZ. The North American Industrial Classification System (NAICS) description can be found in this screen.
8

This method of identification was used to populate the NAICS Description column in Table 2: List of Facilities within Ten Mile Buffer Zone of the mock Level 4 EI.
Clicking on the x button of this window closes it. When that window closes, a list of the other facilities in this location (in this case, Coconino County) is shown. You can select the other facilities you have listed in your buffer zone and then click on the Edit button to open the Facility editing window for each facility. Then you can record the NAICS description for each facility. Alternately, you can close the Input View and use the method of clicking on each facility in map view, then right-clicking to allow you to select Edit, as demonstrated for the EPNG – Williams Compressor Station facility. (Note that we are going to show you the method used to fill in the “Approximate Distance from Reservation Boundary” column of Table 2: List of Facilities within Ten Mile Buffer Zone in the mock EI in an upcoming module.)
9

(You know that you are in the location of Coconino County, because you see on the left there is Facilities, and the way this window works is that the white panel on the left has a hierarchy of characteristics, and first you specify the POINT, and then in each of those points are listed Facilities, and so on. So since Facilities is highlighted, we can click one up in the hierarchy to see the Point Location that this facility is in. Additionally, the location of Coconino County is shown in what I call the Breadcrumbs panel at the top of the Linear Data Entry screen.)
Close Input View by clicking on the x button on the top right corner of the screen.
EI-Fundamentals-3D: Point Sources in TEISS Reports
Viewing Point Data in TEISS Reports: To access the TEISS reports, click on the Reports button in the TEISS toolbar.
10
Breadcrumbs panel

This screen opens.
11

Under the Point Sources folder are all the reports that can be generated for point sources. The reports that have graphs associated with them have a small pie chart icon. I am looking for a report that shows the total facility emissions for the one facility, EPNG – Williams Compressor Station, I am currently interested in. Since I am only looking at data for one facility instead of comparing this facility to other facilities, the graphs are not going to show me much. I am going to select the Facility Emissions report, that does not have a graph, by clicking on it. This screen opens where I begin the process of specifying the criteria for the report.
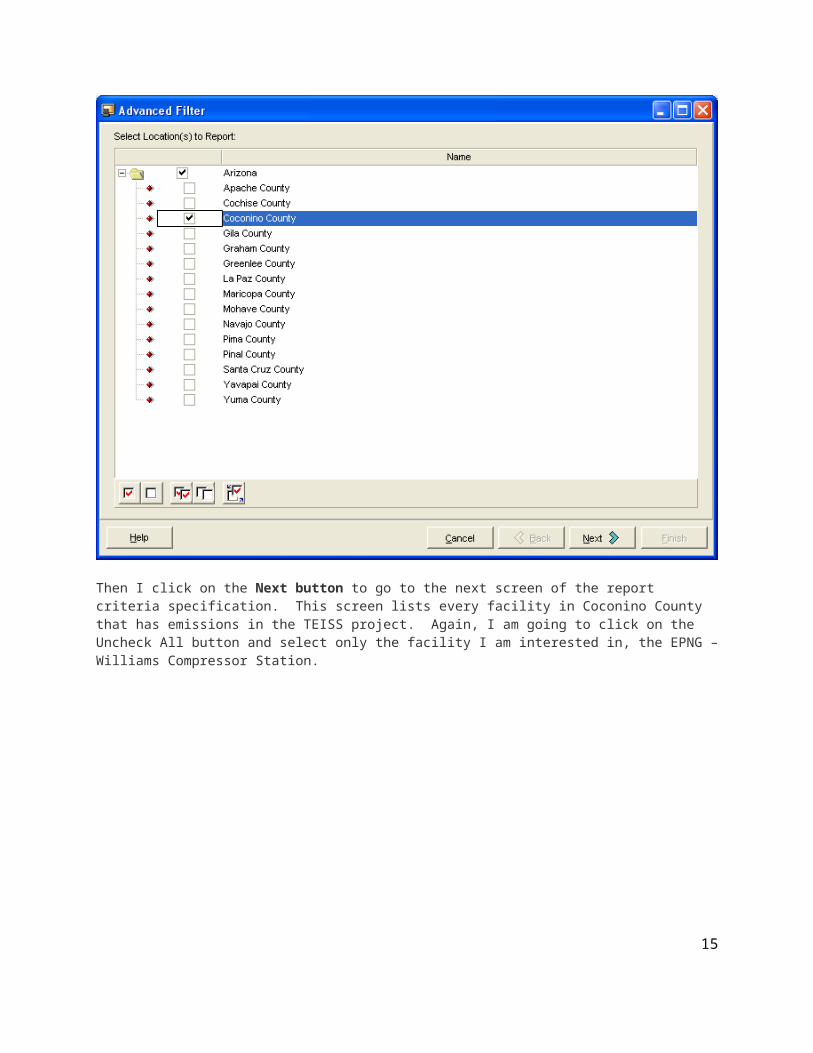
The facility I am interested in is in Coconino County. I am going to click on the Uncheck All button. This button has an icon that looks like two blank boxes on top of each other. Then I can select only Coconino County by clicking on the blank box next to it.
12

Then I click on the Next button to go to the next screen of the report criteria specification. This screen lists every facility in Coconino County that has emissions in the TEISS project. Again, I am going to click on the Uncheck All button and select only the facility I am interested in, the EPNG – Williams Compressor Station.
13

Then I click on the Next button again. I do not need to change anything in this screen because the Annual Reporting Period is already selected.
14
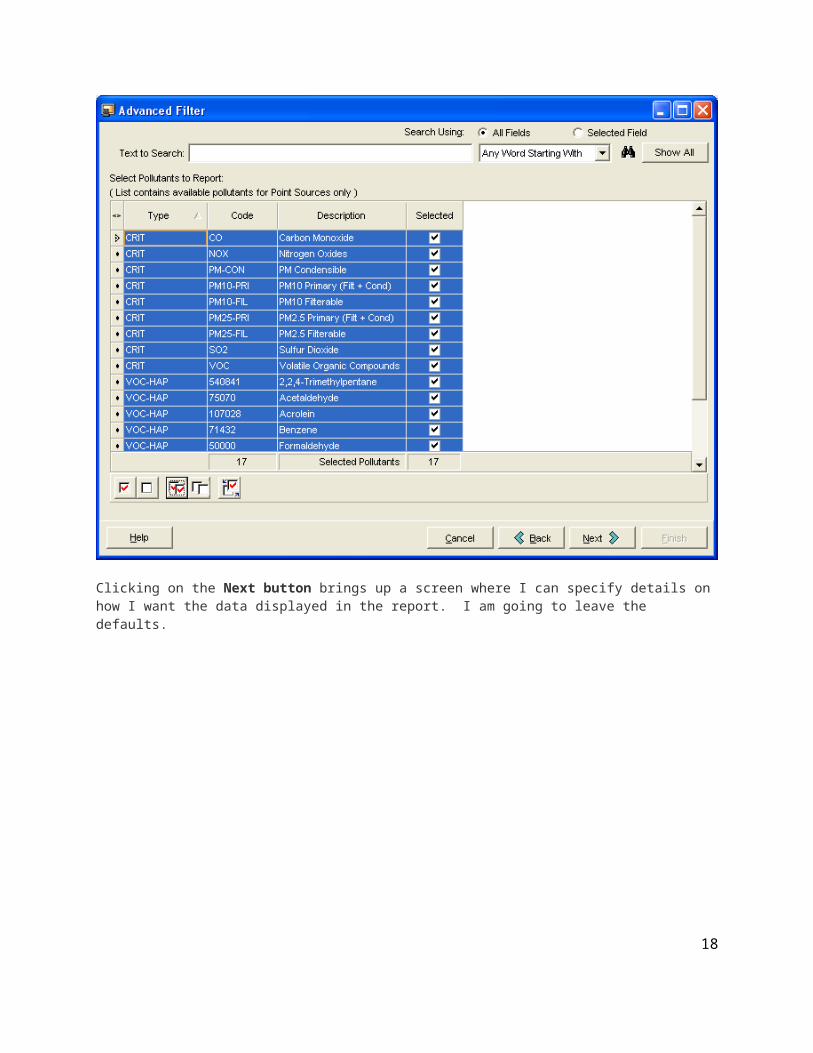
Clicking on the Next button again brings up a screen where I can select what pollutants I want to include in the report. I would like to see emissions for all pollutants, so I am going to click on the Check All button that looks like two boxes with check marks in them. This selects all pollutants that the facility has emissions for in the TEISS project.
15

Clicking on the Next button brings up a screen where I can specify details on how I want the data displayed in the report. I am going to leave the defaults.
16

Clicking on the Finish button brings up the report.
17
I can make the report bigger by using the dropdown box at the top of the screen.
This report tells me that this facility emits a significant amount of NOx.
EI-Fundamentals-3E: Non-Point Sources in TEISS Reports
Viewing Nonpoint Data in TEISS Reports: Under the Nonpoint Sources folder are all the reports that can be generated for nonpoint sources.
18

I would like to see what emissions are coming from residential heating because I know that is a source of concern in this area. I am looking for a report that compares emissions for the various residential heating sources. Since I am comparing multiple sources, a graph would be beneficial. I am going to click on the by SCC report, under the Nonpoint Sources folder. That brings up the first screen for specifying the report criteria.
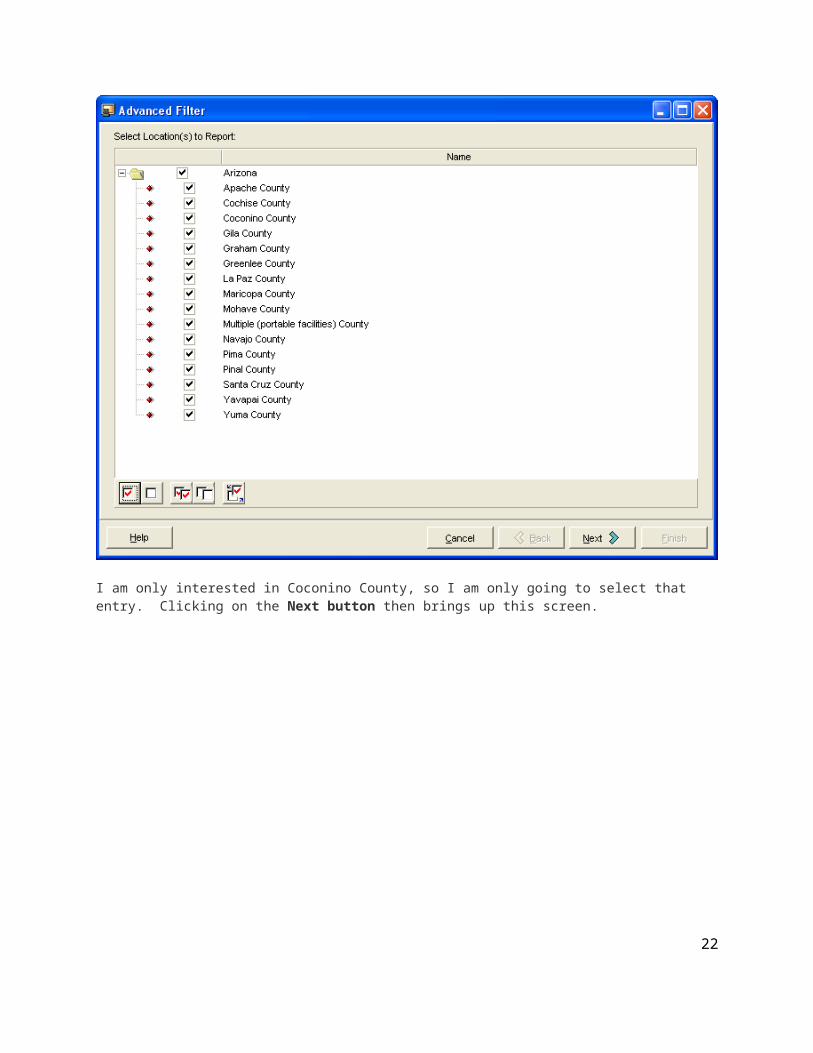
I am only interested in Coconino County, so I am only going to select that entry. Clicking on the Next button then brings up this screen.
19

This screen allows me to select the Source Classification Code (SCC) grouping I want to see data for. Residential heating falls into the Stationary Source Fuel Combustion category. I want to see data specifically for each type of residential heating, for example, wood, LPG, natural gas, etc., so this category is too general. To get more specific, I need to click in the Select SCC Level to Report dropdown box.
What do these SCCs mean? Searching in TEISS Help, under SCC Database gives you this info:
For point sources, there are four levels of source descriptions for each SCC, associated with the first 1, 3, 6, and 8 digits of the codes. A column is available for each description level. The first level (SCC 1 Description) provides only the most general information on the category of emissions. The second level (SCC 3 Description) subdivides the 5 major emission categories into major industry groups. The third level (SCC 6 Description) identifies a specific industry or emission source category. The fourth level (SCC 8 Description) specifies the particular emitting process.
For nonpoint sources there are four levels of source descriptions for each SCC, but associated with the first 2, 4, 7, and 10 digits of the codes. (So that is why in the “SCC Level to Report” dropdown box they give the choices of SCC 2, 4, 7, or 10—in this case, we want all the emissions for all of the SCC codes that have the same first 4 numbers.)
Nonpoint Source Example SCC: 2610030000 26-10-030-000 = 10-characters
20

For each SCC, there are four levels of descriptions: SCC 2 Description (26): Waste Disposal, Treatment, and Recovery SCC 4 Description (26-10): Open Burning SCC 7 Description (26-10-030): Residential SCC 10 Description (26-10-030-000): Household Waste
Selecting SCC 4 in this box gives me many more options.
I need to scroll up to get to the Stationary Source Fuel Combustion sources. Also, note that you can expand the columns by clicking on the header and dragging to the right to see the full column entry. And, you can click on the header to sort alphabetically or numerically.
21
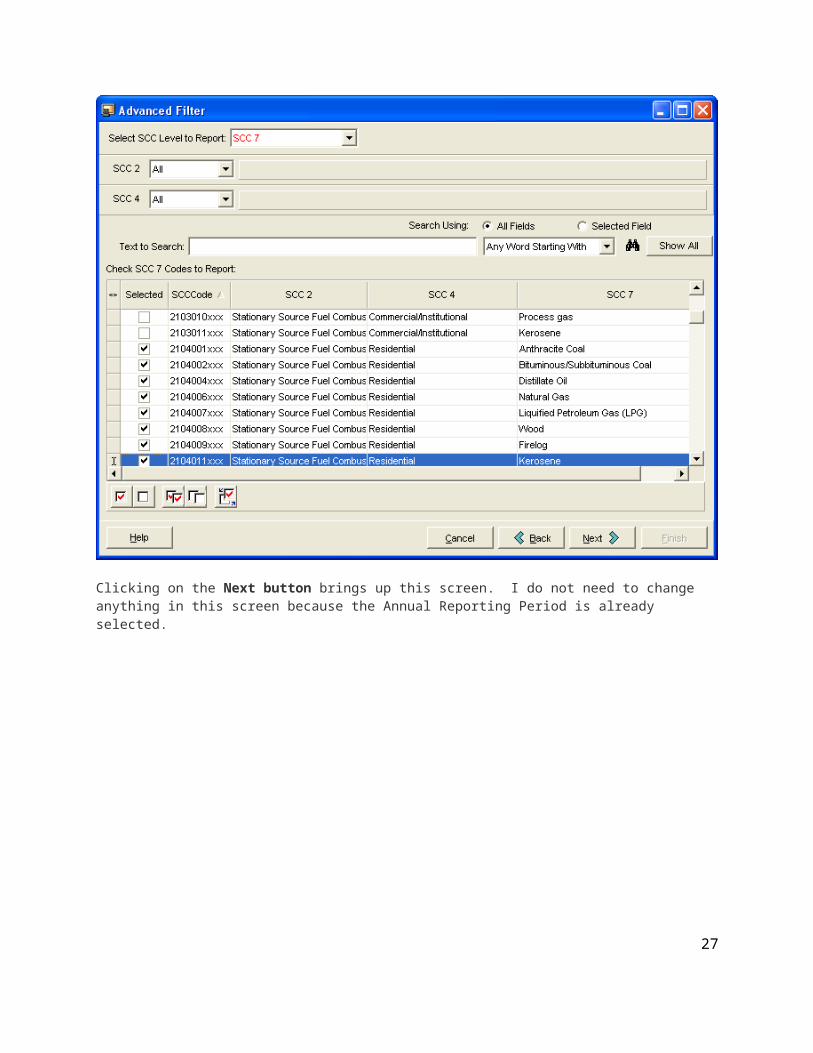
This shows the residential grouping, but it is not further divided by fuel type. I am going to select SCC 7 in the Select SCC Level to Report dropdown box. Again, I need to scroll up to the Stationary Source Fuel Combustion sources.
22

This shows the different residential heating fuel types and that is what I want for my report. I am going to click on the Uncheck All button and then select only the residential heating sources.
23

Clicking on the Next button brings up this screen. I do not need to change anything in this screen because the Annual Reporting Period is already selected.
24

Clicking on the Next button brings up the screen where I can specify what pollutants I want to include in the report. I am only interested in criteria pollutants from residential heating, so I am only going to select the criteria pollutants, shown with a black font.
25

Clicking on the Next button brings up a screen where I can specify details on how I want the data displayed in the report. I am going to leave the defaults.
26
Clicking on the Finish button brings up the report. I am going to make the report bigger by using the dropdown box at the top of the screen. This report has 20 pages, as shown by the navigation arrows at the top of the screen. The first page of the report shows the CO emissions for the various residential heating sources in tabular format.
27

I am going to click the right arrow button at the top of the screen to go to the next page of the report. This page shows a graph of the CO emissions for the various residential heating sources. From this graph, I can see that residential wood heating contributes the most CO emissions of the residential heating sources.
28

Scrolling through the pages of this report, I can see that residential wood heating and residential natural gas heating are the top two emitters of criteria pollutants of the residential heating sources. If I was going to develop an EI for my area and I did not have the resources to inventory every residential heating source, I would make sure to include at least these two residential heating sources in the EI (QAPP NOTE: You can write a description of how you plan to use the TEISS reports to prioritize what sources you are going to include in your EI and put it in your QAPP). Click on the x button to close the report screen. Then click on the x button in the top right corner of the main TEISS screen (with the map shown) to close TEISS. This message box comes up.
Click the Yes button to close TEISS.
EI-Fundamentals-3F: Starting a New TEISS Project
Starting a New TEISS Project: We are going to demonstrate starting a new TEISS project, which is your homework. We recommend that you watch this demonstration rather than trying to follow along; we have this video for you to follow along with if you want, after the webinar.
First, I recommend making a folder on your hard drive (C:\) for this training if you have not already done that. I suggest naming the folder something obvious, like EITraining. TEISS projects must be started on the hard drive of your computer instead of on a network drive or some other external location, like a memory stick. Also, several users have experienced difficulties starting a TEISS project from within a folder on a computer desktop. It is highly recommended that you make the new folder within the C:\ drive of your computer and not on the desktop. Second, I recommend starting a TEISS logbook. This is where you can log things such as the project name, project location, and updates you make to your project. It can be a simple notebook. If you do not have a blank notebook readily available at the moment, you can start your logbook with a blank piece of paper and then tape it into the notebook when you have it.
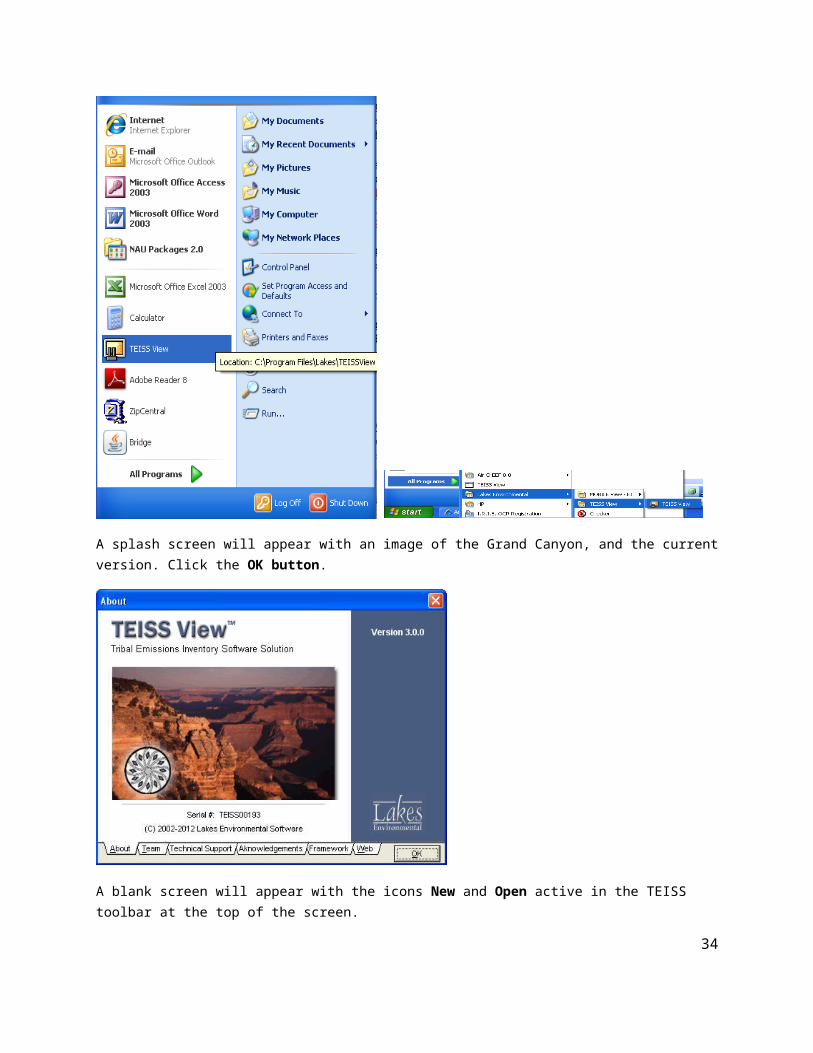
Find the TEISS View icon in the Start menu of your computer and click it to launch TEISS. If the TEISS View icon is not shown, you can select All Programs, then Lakes Environmental, and then select TEISS View. You can also generate a shortcut to TEISS on your desktop.
29

A splash screen will appear with an image of the Grand Canyon, and the current version. Click the OK button.
A blank screen will appear with the icons New and Open active in the TEISS toolbar at the top of the screen.
30

For this demonstration, I am going to start a new project, so I am going to click on New. In the next box, navigate to the folder that you generated for this training. If you have not yet generated this folder, you can do that by first navigating to your hard drive in the Save in field, and then clicking the New folder icon that looks like a folder with the star in the upper portion of the box. Type a name for your project in the File name field. I recommend you name this project something you can remember such as YourTribeEI, but do NOT use any special characters (such as #, $, %, etc.) or spaces in the name because this could cause issues when you try to make a back-up copy of your TEISS project. I am going to name my project EveryTribeAZ. Log the name and location of the TEISS project in your TEISS logbook. Then click the Save button.
NOTE: DO NOT store your project in the C:\TEISSVw folder, this folder is replaced when a new version of TEISS is installed.
31

The New Project Wizard screen opens up, and asks you to define the year of your EI. Type in 2011 and click the Next button.
NOTE: The reason I recommend specifying 2011 as the inventory year is because this is the year of the most current NEI data available. Since you are going to start your EI by importing county-level NEI data, it makes sense to start with 2011 as the inventory year. If you are planning on developing a Level 1, 2, or 3 EI and you plan on collecting activity data from a different inventory year, you can start a new inventory year in this TEISS project and enter your data there. Starting a new inventory year in an existing TEISS project is covered in Workshop 2-EI Advanced.
32

You are now asked to define the state and tribe for your EI. Scroll down to your state, if necessary, and check the box to its left.
Now check the Import Tribes box. You can now select your tribe by clicking on the Select Tribes (##) button to open a new screen that lists the tribes in the chosen state. Here you can see the FIPS codes. In your TEISS logbook, log the FIPS code for your tribe in case you need it for something. Uncheck all but the tribe you are interested in. Click the OK button to close this screen and take you back to the previous screen. Then click the Next button.
33
34

The last screen in Creating a New Project allows you import Class I air sheds in your state, major road system, and also start your Inventory Preparation Plan (IPP). Keep the Import Class I Area Coverage box and the Import Roads Coverage box checked, but do not check the Display IPP Wizard box for this demonstration. If you want to use the IPP Wizard at some other time, you still have that option. Click on the Finish button.
Before creating the project, TEISS View will prompt you for Database Login information. You will need to specify the Database Name and Password.
Database Parameters:
Server Name: This is the name of your computer. You cannot modify this. Database Name: This is the name of the project database. Enter the name you gave to the
project here. For my project, it is EveryTribeAZ. Log the database name in your TEISS logbook. User Name: This is the name of the account you are going to use to create the database. It is
set as sa. Do not change this. Password: This is the database password. Enter eiview.
After specifying these parameters, click the OK button.
NOTE: Microsoft SQL Server 2005 Express is automatically installed with the TEISS View installation. This allows you to create databases for your projects. Lakes Environmental has pre-set the User Name and Password for the Database Login.
35

TEISS works for for up to several minutes setting up the project data tables. Once it is done, the TEISS Project log in (aka Application Credentials) screen appears. This is the screen you see every time that you open your TEISS project. The default User Name and Password are set by Lakes Environmental. The User Name is already populated as Administrator. The Password is Teiss and it is case-sensitive. The “T” must be capitalized. (Remember the sticky note.) Make sure the Caps Lock is not on when entering the password. Then click on the OK button.
The TEISS project opens.
36

Homework: Start a new TEISS project in the course folder on your hard drive if you have not already done this. This is going to be the TEISS project you use to develop your EI. Name it something you can remember, like YourTribeEI, but do NOT use any special characters or spaces. Log the name and location of the project in your TEISS logbook. Email a screen capture of the opening screen of your TEISS project (the TEISS map showing your reservation) to the instructors.
37