
Vietnam PC brand share and purchase journey
18
Q&Me is an online market research service provided by Asia Plus Inc. Asia Plus Inc. PC usage and purchase journey in Vietnam
-
Upload
qme-vietnam-market-research -
Category
Marketing
-
view
1.301 -
download
0
Transcript of Vietnam PC brand share and purchase journey

Q&Me is an online market research service provided by Asia Plus Inc. Asia Plus Inc.
PC usage and purchase journey in Vietnam

Overview
Computer are a major part of our
lifestyle. This survey aims to
understand what types of computers
desktop and laptop users use in
Vietnam and their purchasing
location .
This survey was conducted to 538
age 18-39 male and females residing
in HCM and Hanoi
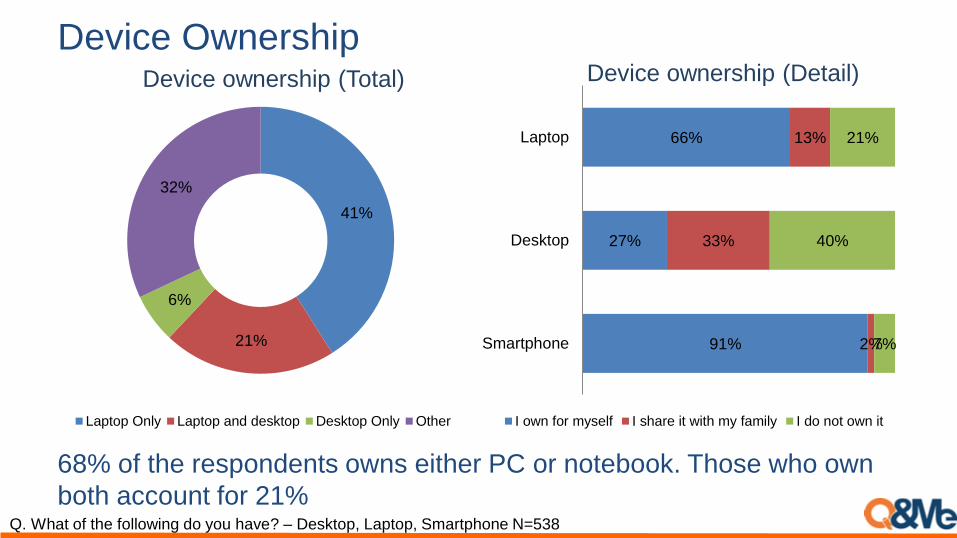
Device Ownership
91%
27%
66%
2%
33%
13%
7%
40%
21%
Smartphone
Desktop
Laptop
I own for myself I share it with my family I do not own it
68% of the respondents owns either PC or notebook. Those who own
both account for 21%Q. What of the following do you have? – Desktop, Laptop, Smartphone N=538
41%
21%
6%
32%
Laptop Only Laptop and desktop Desktop Only Other
Device ownership (Total) Device ownership (Detail)
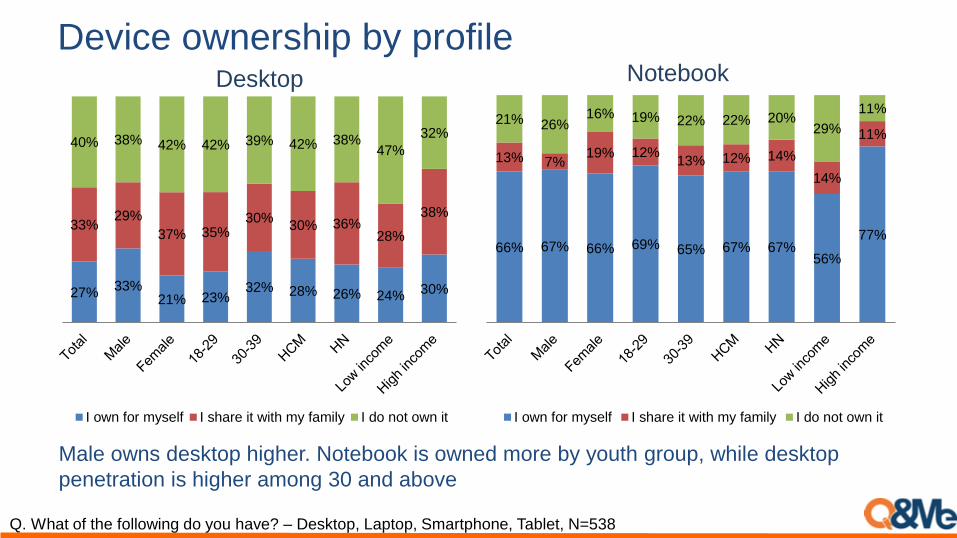
Device ownership by profile
27%33%
21% 23%32% 28% 26% 24% 30%
33%29%
37% 35%30%
30% 36%28%
38%
40% 38% 42% 42% 39% 42% 38%47%
32%
I own for myself I share it with my family I do not own it
Male owns desktop higher. Notebook is owned more by youth group, while desktop
penetration is higher among 30 and above
Q. What of the following do you have? – Desktop, Laptop, Smartphone, Tablet, N=538
Desktop Notebook
66% 67% 66% 69% 65% 67% 67%56%
77%
13% 7%19% 12%
13% 12% 14%
14%
11%21% 26%
16% 19% 22% 22% 20%29%
11%
I own for myself I share it with my family I do not own it
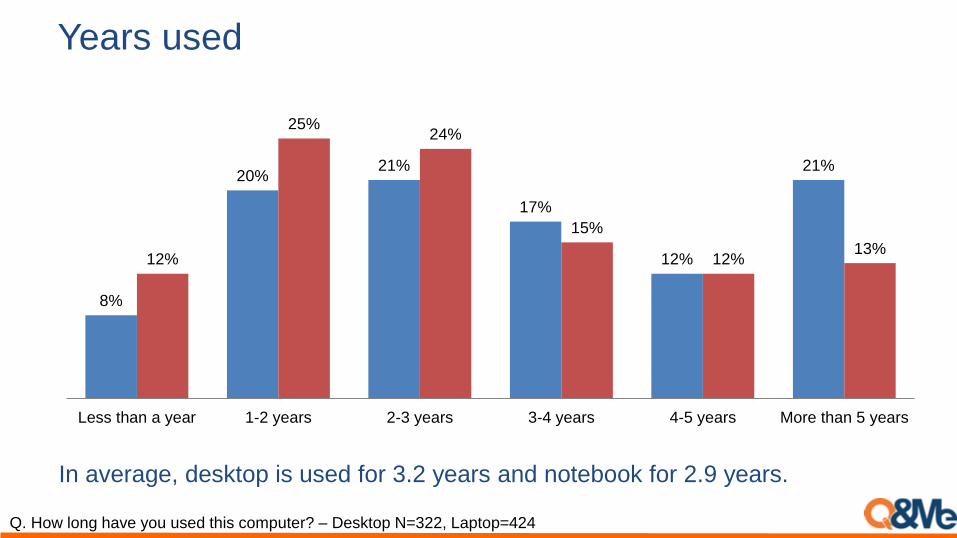
Years used
In average, desktop is used for 3.2 years and notebook for 2.9 years.
8%
20%21%
17%
12%
21%
12%
25%24%
15%
12%13%
Less than a year 1-2 years 2-3 years 3-4 years 4-5 years More than 5 years
Q. How long have you used this computer? – Desktop N=322, Laptop=424
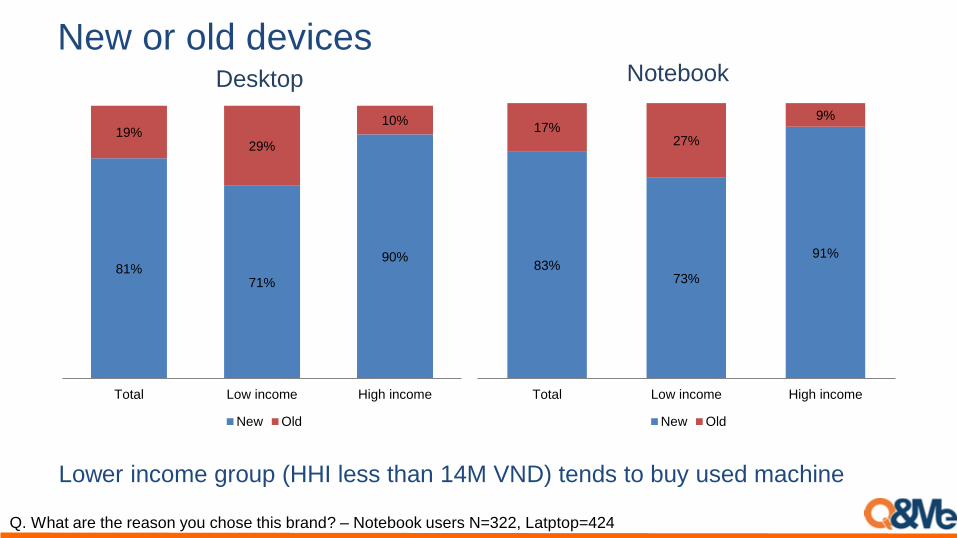
New or old devices
Lower income group (HHI less than 14M VND) tends to buy used machine
Q. What are the reason you chose this brand? – Notebook users N=322, Latptop=424
81%71%
90%
19%29%
10%
Total Low income High income
New Old
83%73%
91%
17%27%
9%
Total Low income High income
New Old
Desktop Notebook

Owned brand
Dell HPSamsung
AsusMicrosoft
AcerAppl
eSony
Lenovo
MSIOthe
r
Total 29% 14% 14% 9% 8% 7% 6% 2% 2% 2% 8%
HCM 32% 13% 14% 9% 7% 5% 7% 2% 1% 2% 8%
HN 26% 16% 13% 10% 9% 7% 5% 2% 4% 1% 8%
Dell dominates the market. HP is strong in north while Dell is strong in south
Q. What is the brand of the computer you use?
(For people who have more than one, the desktop they use the most) – Desktop users N=322, Notebook users=424
Desktop Notebook
Dell HP AsusSamsung
AcerAppl
eOthe
rSony
Lenovo
Microsoft
MSI
Total 25% 17% 15% 14% 10% 9% 8% 2% 2% 2% 2%
HCM 27% 14% 15% 14% 10% 11% 8% 2% 1% 1% 2%
HN 23% 19% 15% 13% 11% 6% 8% 2% 4% 3% 1%
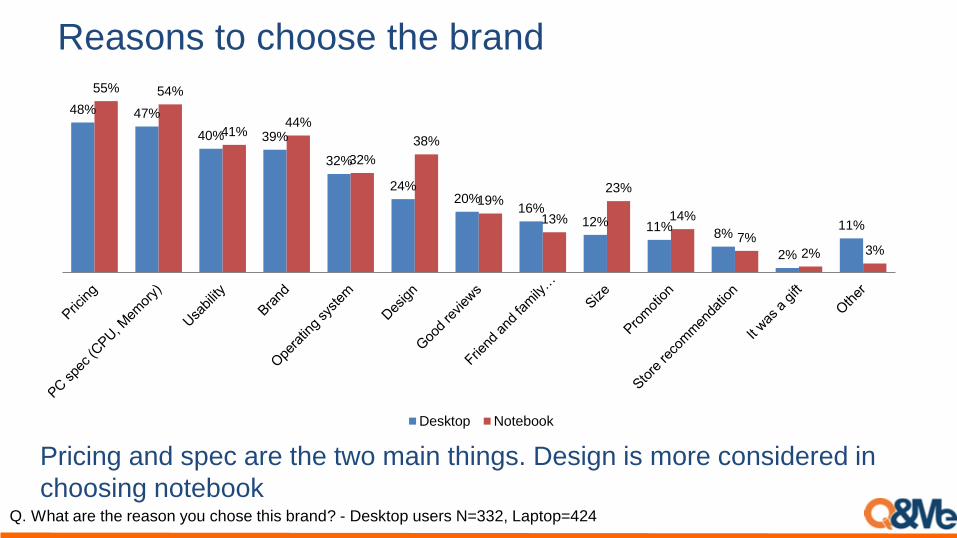
Reasons to choose the brand
Pricing and spec are the two main things. Design is more considered in
choosing notebookQ. What are the reason you chose this brand? - Desktop users N=332, Laptop=424
48% 47%
40% 39%
32%
24%20%
16%12% 11%
8%
2%
11%
55% 54%
41%44%
32%
38%
19%
13%
23%
14%
7%
2% 3%
Desktop Notebook

Reasons to choose the brand (by brand)
Apple users choose because of brand and design more, less concern
on pricingQ. What are the reason you chose this brand?
60%
47%43%
40%
33%30%
40%
31%
40%
24%
49%45%
Brand Operatingsystem
Usability Design Pricing PC spec(CPU,
Memory)
Apple All
Desktop Notebook
53%51%
42% 42%40%
38%
34%
44%
37%
51%
41%
54%
Operatingsystem
Brand Design PC spec(CPU,
Memory)
Usability Pricing
Apple All
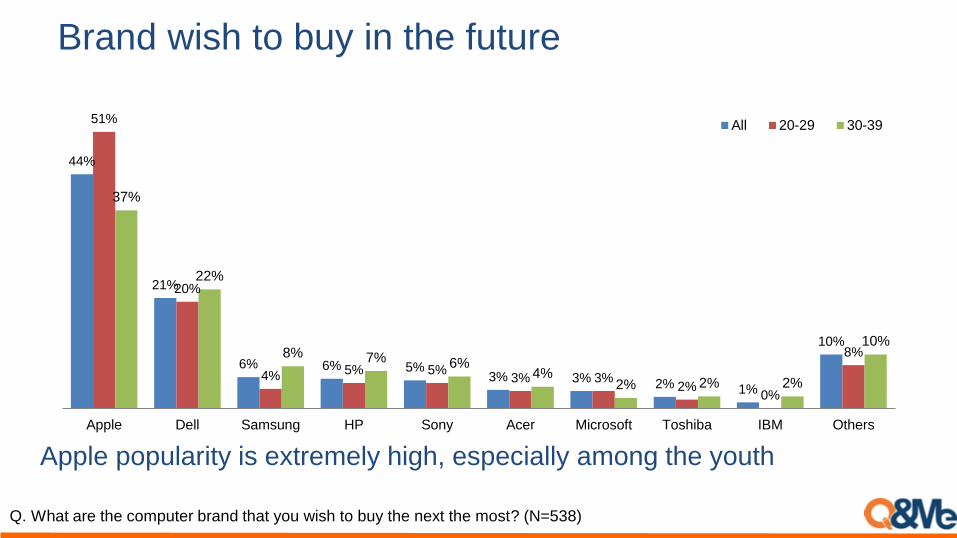
Brand wish to buy in the future
Apple popularity is extremely high, especially among the youth
Q. What are the computer brand that you wish to buy the next the most? (N=538)
44%
21%
6% 6% 5%3% 3% 2% 1%
10%
51%
20%
4% 5% 5%3% 3%
2%0%
8%
37%
22%
8% 7% 6%4%
2% 2% 2%
10%
Apple Dell Samsung HP Sony Acer Microsoft Toshiba IBM Others
All 20-29 30-39

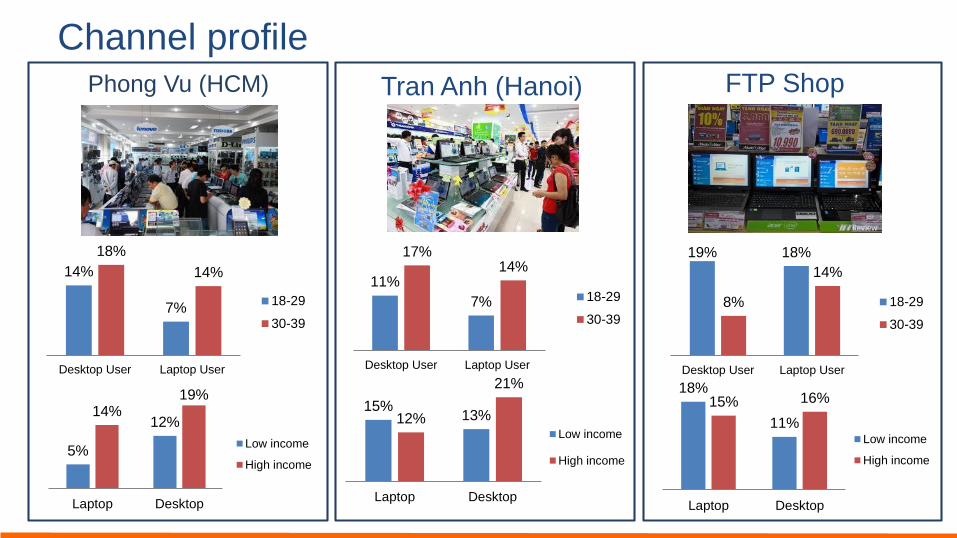
Purchasing channels
31%
10%
4%
10%8%
1%
5%
0%
4%1%
4%
22%
19%
13%11%
7% 6%
2% 2%1%
5%3% 3%
21%
Desktop Laptop
Phong Vu is strong in HCM, Tran Anh is strong in Hanoi. FTP has a
good share nationwide.Q. Where did you buy it (For people who have more than one, the computer they use the most)? –HCMC=226, Hanoi=194
HCM Hanoi
29%
17%
5% 4% 4%2% 2% 1% 1% 1% %
4%1%
4%
26%25%
21%
3%5% 6%
0%
6%
3%1%
3%1%
5%3% 3%
21%
Desktop Laptop
14%
7%
18%
14%
Desktop User Laptop User
18-29
30-39
5%
12%14%
19%
Laptop Desktop
Low income
High income
Phong Vu (HCM)
Channel profile
Tran Anh (Hanoi) FTP Shop
11%
7%
17%14%
Desktop User Laptop User
18-29
30-39
15%13%12%
21%
Laptop Desktop
Low income
High income
19% 18%
8%
14%
Desktop User Laptop User
18-29
30-39
18%
11%
15% 16%
Laptop Desktop
Low income
High income
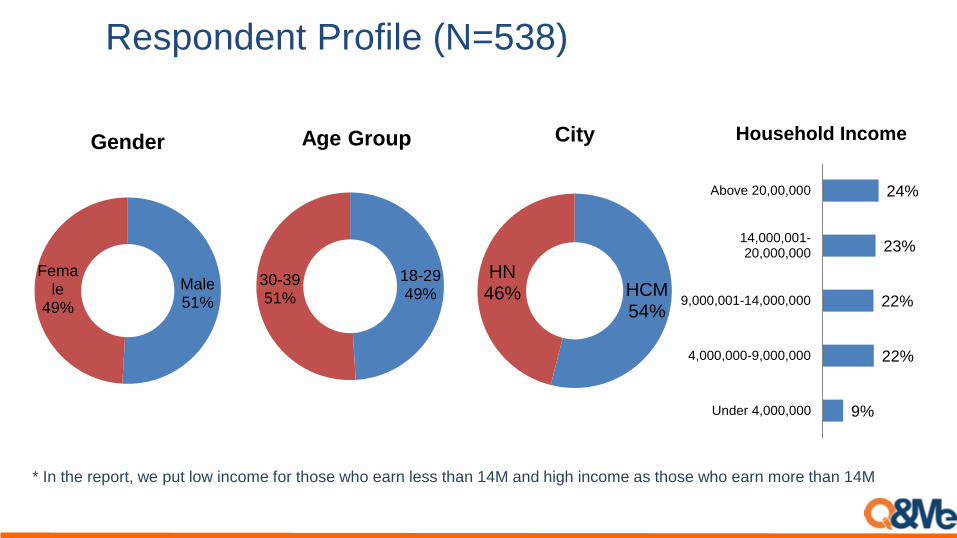
Respondent Profile (N=538)
Male51%
Female
49%
Gender
18-2949%
30-3951%
Age Group
9%
22%
22%
23%
24%
Under 4,000,000
4,000,000-9,000,000
9,000,001-14,000,000
14,000,001-20,000,000
Above 20,00,000
Household Income
HCM54%
HN46%
City
* In the report, we put low income for those who earn less than 14M and high income as those who earn more than 14M

Q&Me – About Online Market Research Services

Our SolutionSurvey is conducted via mobile phone and the data is processed real-time
Affordable Quick High qualityTakes 24 - 48 hours for
most surveys, proving
real-time analysis
Superb real-time
analysis for flexible and
accurate data collection
1/3 of the competitor
pricing
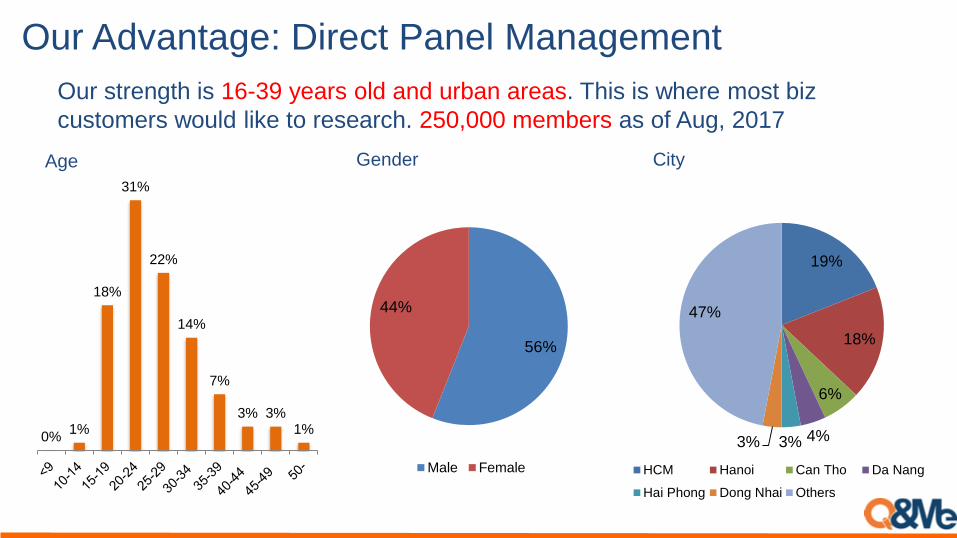
Our Advantage: Direct Panel Management
Our strength is 16-39 years old and urban areas. This is where most biz
customers would like to research. 250,000 members as of Aug, 2017
0%1%
18%
31%
22%
14%
7%
3% 3%1%
Age
19%
18%
6%
4%3%3%
47%
HCM Hanoi Can Tho Da Nang
Hai Phong Dong Nhai Others
56%
44%
Male Female
Gender City

Our Advantage: Direct Panel Management
Our strength is 16-39 years old and urban areas. This is where most biz
customers would like to research. 250,000 members as of Aug, 2017
Married Status Household income Smartphone ownership
Single, 72%
Married, 25%
Others, 3%
26%
24%
14%
15%
9%
5%
3%
4%
< 5M VND
5 - 7.5M VND
7.5 - 10M VND
10 - 15M VND
15 - 20M VND
20M-30M
30-40M
<40M
27%
25%
18%
8%
8%
6%
15%
18%
Apple
Samsung
Nokia
LG
Asus
Sony
Others
Do not own
Contact Us
URL: http://www.qandme.net
Contact: [email protected]
Q&Me is operated by Asia Plus Inc.
Asia Plus Inc.
Floor 1 25/7A Nguyen Binh Khiem str., Ben Nghe ward, District 1, HCMC,
Vietnam
Tel. +84 839 100 043


![[Vietstack meetup 1st] VietStack and journey promoting openstack in vietnam](https://static.fdocuments.us/doc/165x107/55a2cb5d1a28ab1a6c8b481f/vietstack-meetup-1st-vietstack-and-journey-promoting-openstack-in-vietnam.jpg)
