Valuing Government Guarantees in Toll Road Projects Luiz Brandão (PUC-Rio) Eduardo Saraiva (BNDES)...
40
Valuing Government Guarantees in Toll Road Projects Luiz Brandão (PUC-Rio) Eduardo Saraiva (BNDES) Jun 2007
-
Upload
harold-nichols -
Category
Documents
-
view
214 -
download
0
Transcript of Valuing Government Guarantees in Toll Road Projects Luiz Brandão (PUC-Rio) Eduardo Saraiva (BNDES)...

Valuing Government Guarantees in Toll Road
Projects
Luiz Brandão (PUC-Rio)
Eduardo Saraiva (BNDES)
Jun 2007

11th Real Option ConferenceBerkeley, June 2007
2
Private Infrastructure Projects Characteristics:
Large volume of Capital required Irreversible Investment Long time to maturity Essential services to society Usually offered monopolistically
Consequences Affected by political considerations Subject to government regulation Increased risk to the private partner Government and investor incentives diverge once the project is
completed Due to this, the private investor may require some form of guarantee
3
Risks Involved Construction Risk
Interest Rate Risk
Exchange Rate Risk
Political Risk
Environmental Risk
Traffic Risk

11th Real Option ConferenceBerkeley, June 2007
4
Stochastic Modeling of Traffic
Concession Period
Tra
ffic
De
man
d
Expected Traffic
11th Real Option ConferenceBerkeley, June 2007
5
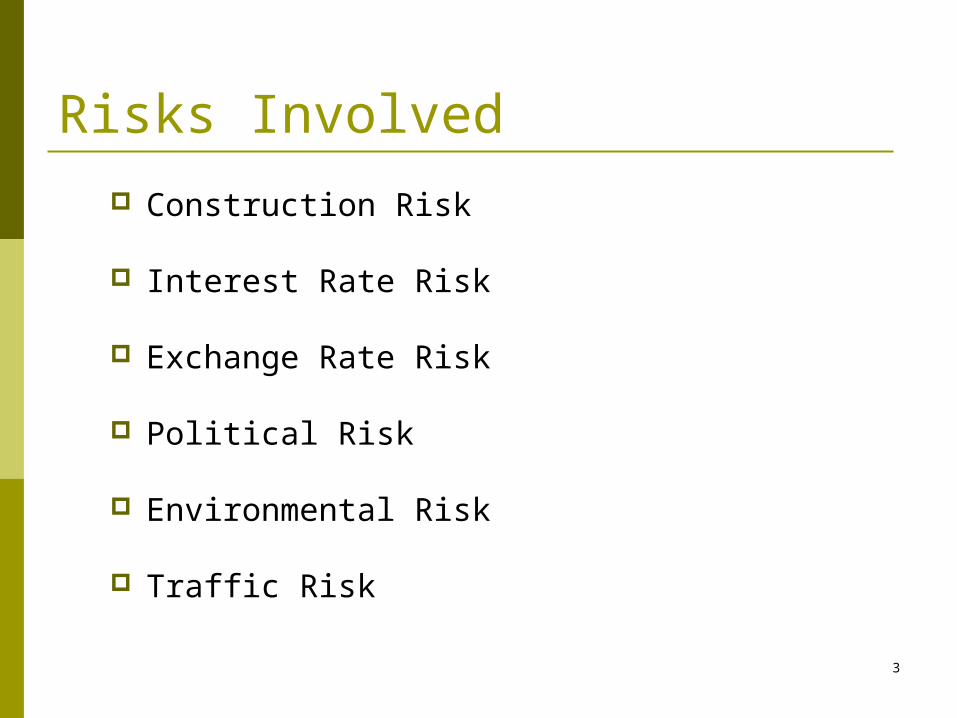
Types of Government Guarantees
Grant
Concession Extension
Revenue Enhancement
Minimum Traffic Guarantee
Shadow Toll
Subordinate Loan
Exchange Rate Guarantee
Equity Guarantee
Debt Guarantee
Cost to Government
Impa
ct
on C
once
ssio
narie
Low High
High

6
Government Participation (PPP) Chile – Santiago – San Antonio Highway (1995)
$140 million dollar investment with Minimum Traffic Guarantee (MTG)
Mexico - CM-Toluca Highway (1992) $313 million dollar investment with MTG
Colombia –El Cortijo-El Vino (1996) MTG of 90%
Chile - Costanera Norte, Santiago (2005) $400 million dollar investment $80 million provided by governemnt, MTG of 80%

11th Real Option ConferenceBerkeley, June 2007
7
Traffic Guarantees
Concession Period
Tra
ffic
De
man
d Expected
Floor
Government pays subsidy
CeilingGovernment receives excess revenues
11th Real Option ConferenceBerkeley, June 2007
8
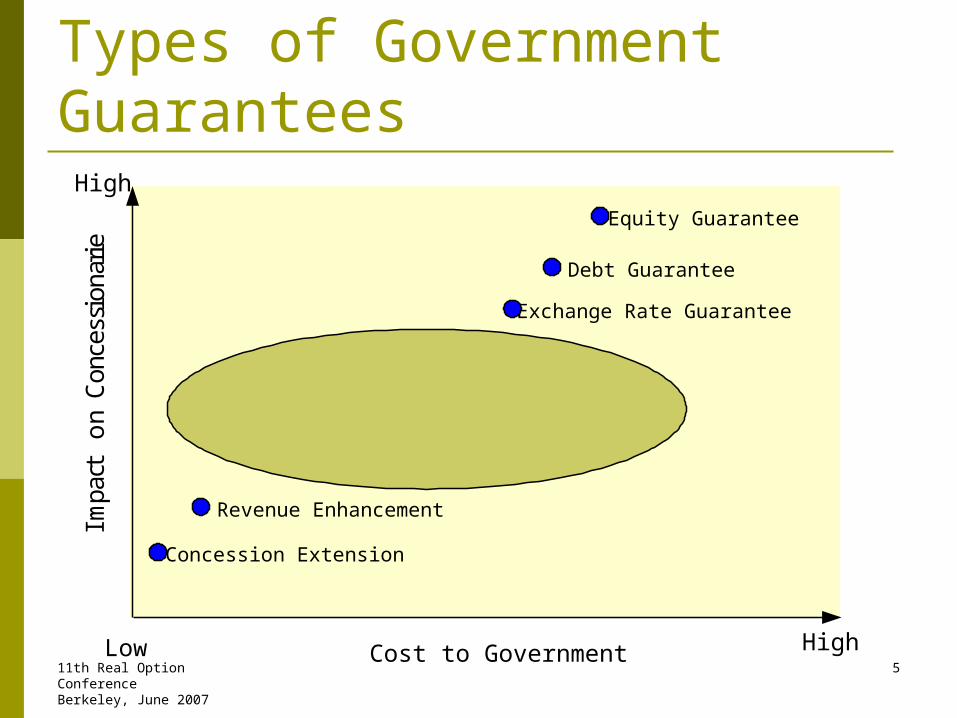
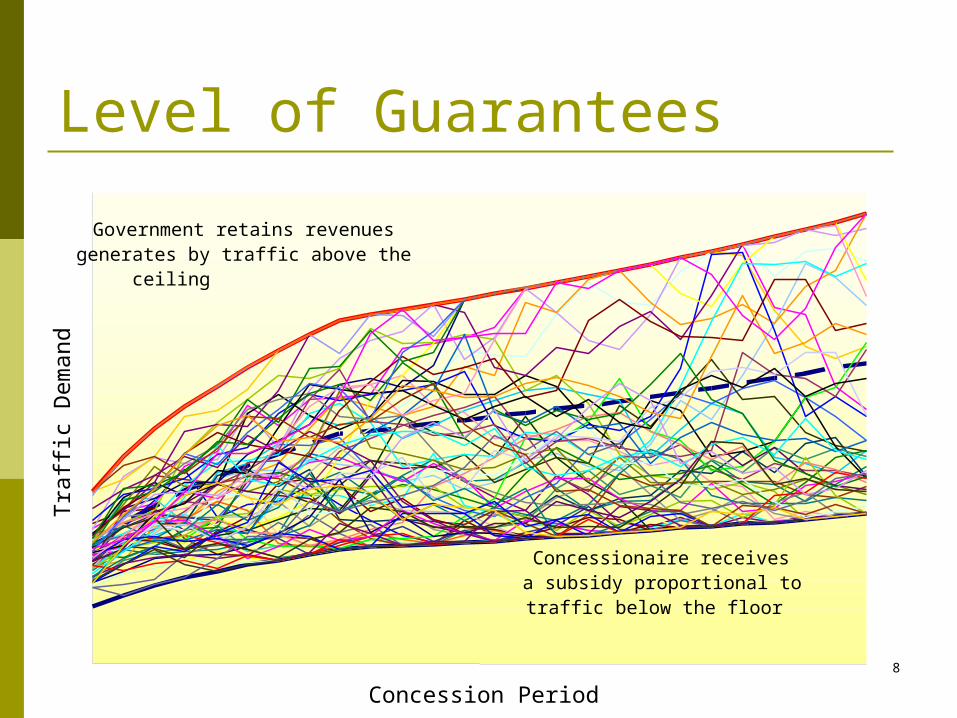
Level of Guarantees
Government retains revenuesgenerates by traffic above the
ceiling
Concessionaire receivesa subsidy proportional to traffic below the floor
Concession Period
Tra
ffic
De
man
d

11th Real Option ConferenceBerkeley, June 2007
9
Level of Guarantees
Concession Period
Tra
ffic
De
man
d
Concessionaire receivesa subsidy proportional to traffic below the floor
Government retains revenuesgenerates by traffic above the
ceiling

11th Real Option ConferenceBerkeley, June 2007
10
Level of GuaranteesT
raffi
c D
em
and
Government retains revenuesgenerates by traffic above the
ceiling
Concessionaire receivesa subsidy proportional to traffic below the floor
Concession Period

11th Real Option ConferenceBerkeley, June 2007
11
Level of Guarantees
Concession Period
Concessionaire receivesa subsidy proportional to traffic below the floor
Government retains revenuesgenerates by traffic above the
ceiling
Tra
ffic
De
man
d
The BR-163 Project


15

11th Real Option ConferenceBerkeley, June 2007
16


11th Real Option ConferenceBerkeley, June 2007
18

11th Real Option ConferenceBerkeley, June 2007
19
11th Real Option ConferenceBerkeley, June 2007
20
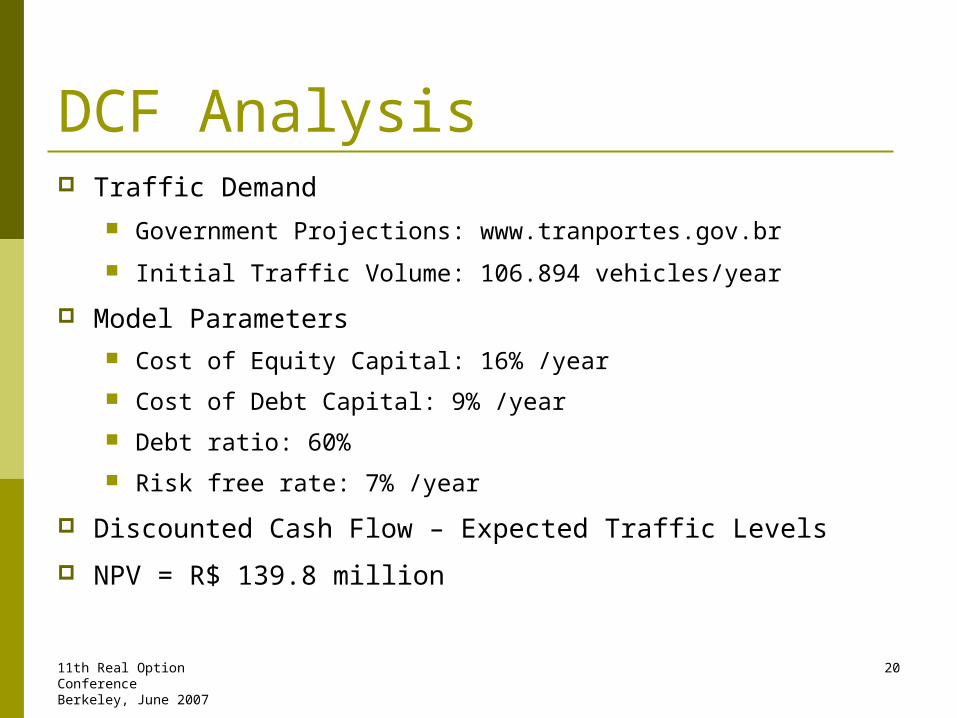
DCF Analysis Traffic Demand
Government Projections: www.tranportes.gov.br
Initial Traffic Volume: 106.894 vehicles/year
Model Parameters Cost of Equity Capital: 16% /year
Cost of Debt Capital: 9% /year
Debt ratio: 60%
Risk free rate: 7% /year
Discounted Cash Flow – Expected Traffic Levels
NPV = R$ 139.8 million

Projeção de Tráfego: (VHE)
Ano Ano PraçaCalendário Concessão 1 2 3 4 5 6 7 8 9 10 11
2004 -3 12.894 11.215 10.391 9.072 7.116 7.116 7.116 7.116 7.116 5.570 5.241 89.9642005 -2 13.255 11.529 10.682 9.326 7.316 7.316 7.316 7.316 7.316 5.726 5.388 92.4832006 -1 13.626 11.852 10.981 9.587 7.520 7.520 7.520 7.520 7.520 5.887 5.538 95.0732007 0 14.008 12.184 11.289 9.856 7.731 7.731 7.731 7.731 7.731 6.052 5.694 97.7352008 1 16.062 13.959 13.267 11.827 9.550 9.550 9.550 9.550 9.550 7.600 7.246 117.7102009 2 17.679 15.457 14.773 13.326 10.927 10.927 10.927 10.927 10.927 8.743 8.364 132.9732010 3 19.079 16.753 16.070 14.616 12.092 12.092 12.092 12.092 12.092 9.695 9.304 145.9762011 4 20.340 17.903 17.242 15.772 13.123 13.123 13.123 13.123 13.123 10.533 10.110 157.5112012 5 21.501 18.989 18.307 16.822 14.046 14.046 14.046 14.046 14.046 11.269 10.848 167.9642013 6 22.589 19.982 19.280 17.773 14.904 14.904 14.904 14.904 14.904 11.957 11.511 177.6082014 7 23.618 20.907 20.210 18.663 15.691 15.691 15.691 15.691 15.691 12.582 12.128 186.5622015 8 24.590 21.788 21.077 19.509 16.428 16.428 16.428 16.428 16.428 13.182 12.694 194.9752016 9 25.146 22.121 21.377 19.735 16.626 16.626 16.626 16.626 16.626 13.364 12.857 197.7282017 10 25.710 22.461 21.675 19.960 16.833 16.833 16.833 16.833 16.833 13.568 13.019 200.5542018 11 26.262 22.818 22.002 20.202 17.050 17.050 17.050 17.050 17.050 13.755 13.196 203.4822019 12 26.832 23.173 22.327 20.450 17.266 17.266 17.266 17.266 17.266 13.951 13.372 206.4342020 13 27.396 23.550 22.646 20.701 17.483 17.483 17.483 17.483 17.483 14.167 13.555 209.4272021 14 27.979 23.929 22.994 20.964 17.726 17.726 17.726 17.726 17.726 14.373 13.739 212.6052022 15 28.557 24.326 23.348 21.234 17.968 17.968 17.968 17.968 17.968 14.593 13.931 215.8272023 16 29.175 24.749 23.712 21.511 18.216 18.216 18.216 18.216 18.216 14.830 14.133 219.1892024 17 29.772 25.172 24.094 21.811 18.475 18.475 18.475 18.475 18.475 15.069 14.341 222.6302025 18 30.391 25.604 24.478 22.117 18.752 18.752 18.752 18.752 18.752 15.316 14.555 226.2172026 19 31.019 26.058 24.882 22.428 19.025 19.025 19.025 19.025 19.025 15.574 14.787 229.8702027 20 31.678 26.523 25.285 22.753 19.329 19.329 19.329 19.329 19.329 15.842 15.015 233.7402028 21 32.336 26.994 25.714 23.094 19.619 19.619 19.619 19.619 19.619 16.117 15.251 237.5992029 22 33.016 27.485 26.154 23.446 19.938 19.938 19.938 19.938 19.938 16.407 15.500 241.6972030 23 33.709 28.005 26.620 23.806 20.267 20.267 20.267 20.267 20.267 16.707 15.763 245.9452031 24 34.410 28.530 27.090 24.187 20.613 20.613 20.613 20.613 20.613 17.021 16.027 250.3272032 25 35.149 29.093 27.580 24.571 20.965 20.965 20.965 20.965 20.965 17.352 16.314 254.881
Total
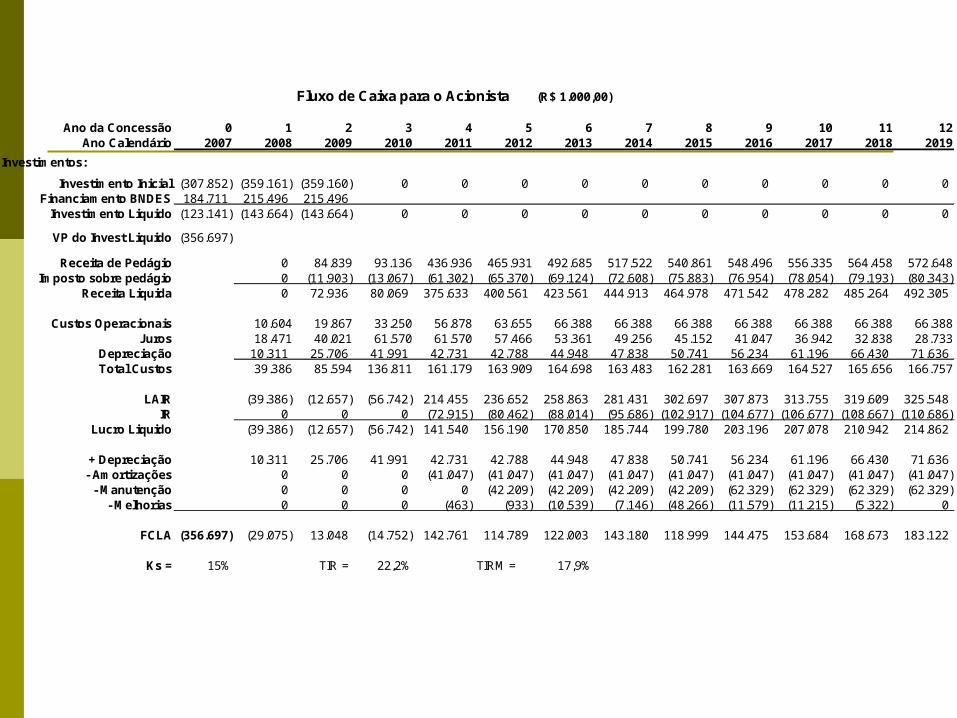
Fluxo de Caixa para o Acionista (R$ 1.000,00)
Ano da Concessão 0 1 2 3 4 5 6 7 8 9 10 11 12Ano Calendário 2007 2008 2009 2010 2011 2012 2013 2014 2015 2016 2017 2018 2019
Investimentos:
Investimento Inicial (307.852) (359.161) (359.160) 0 0 0 0 0 0 0 0 0 0Financiamento BNDES 184.711 215.496 215.496
Investimento Liquido (123.141) (143.664) (143.664) 0 0 0 0 0 0 0 0 0 0
VP do Invest Liquido (356.697)
Receita de Pedágio 0 84.839 93.136 436.936 465.931 492.685 517.522 540.861 548.496 556.335 564.458 572.648Imposto sobre pedágio 0 (11.903) (13.067) (61.302) (65.370) (69.124) (72.608) (75.883) (76.954) (78.054) (79.193) (80.343)
Receita Liquida 0 72.936 80.069 375.633 400.561 423.561 444.913 464.978 471.542 478.282 485.264 492.305
Custos Operacionais 10.604 19.867 33.250 56.878 63.655 66.388 66.388 66.388 66.388 66.388 66.388 66.388Juros 18.471 40.021 61.570 61.570 57.466 53.361 49.256 45.152 41.047 36.942 32.838 28.733
Depreciação 10.311 25.706 41.991 42.731 42.788 44.948 47.838 50.741 56.234 61.196 66.430 71.636Total Custos 39.386 85.594 136.811 161.179 163.909 164.698 163.483 162.281 163.669 164.527 165.656 166.757
LAIR (39.386) (12.657) (56.742) 214.455 236.652 258.863 281.431 302.697 307.873 313.755 319.609 325.548IR 0 0 0 (72.915) (80.462) (88.014) (95.686) (102.917) (104.677) (106.677) (108.667) (110.686)
Lucro Liquido (39.386) (12.657) (56.742) 141.540 156.190 170.850 185.744 199.780 203.196 207.078 210.942 214.862
+ Depreciação 10.311 25.706 41.991 42.731 42.788 44.948 47.838 50.741 56.234 61.196 66.430 71.636 - Amortizações 0 0 0 (41.047) (41.047) (41.047) (41.047) (41.047) (41.047) (41.047) (41.047) (41.047)
- Manutenção 0 0 0 0 (42.209) (42.209) (42.209) (42.209) (62.329) (62.329) (62.329) (62.329) - Melhorias 0 0 0 (463) (933) (10.539) (7.146) (48.266) (11.579) (11.215) (5.322) 0
FCLA (356.697) (29.075) 13.048 (14.752) 142.761 114.789 122.003 143.180 118.999 144.475 153.684 168.673 183.122
Ks = 15% TIR = 22,2% TIRM = 17,9%

11th Real Option ConferenceBerkeley, June 2007
23
NPV Distribution – no guarantees
-0,75-0,75
-0,75 -0,5 -0,25 0 0,25 0,5 0,75 1 1,25
5% 90% 5% > -,2844 ,6596
Mean=139003,5 Mean=139003,5
Project NPV
Val
ues
in 1
0^ -
6
Values in Millions
0,000
0,200
0,400
0,600
0,800
1,000
1,200
1,400
1,600
Mean=139003,5
-0,75 -0,5 -0,25 0 0,25 0,5 0,75 1 1,25

11th Real Option ConferenceBerkeley, June 2007
24
NPV Distribution with 30% Guarantee
1,251,25
-0,75 -0,5 -0,25 0 0,25 0,5 0,75 1 1,25
5% 90% 5% -,2809 ,6495
Mean=138883,3
Project NPV
Val
ues
in 1
0^ -
6
Values in Millions
0,000
0,200
0,400
0,600
0,800
1,000
1,200
1,400
1,600
Mean=138883,3
-0,75 -0,5 -0,25 0 0,25 0,5 0,75 1 1,25

11th Real Option ConferenceBerkeley, June 2007
25
NPV Distribution with 40% Guarantee
1,251,25
-0,75 -0,5 -0,25 0 0,25 0,5 0,75 1 1,25
5% 90% 5% -,2863 ,6541
Mean=139630,7
Project NPV
Val
ues
in 1
0^ -
6
Values in Millions
0,000
0,200
0,400
0,600
0,800
1,000
1,200
1,400
1,600
Mean=139630,7
-0,75 -0,5 -0,25 0 0,25 0,5 0,75 1 1,25

11th Real Option ConferenceBerkeley, June 2007
26
NPV Distribution with 50% Guarantee
1,251,25
-0,75 -0,5 -0,25 0 0,25 0,5 0,75 1 1,25
5% 90% 5% -,2855 ,6621
Mean=150563,9
Project NPV
Val
ues
in 1
0^ -
6
Values in Millions
0,000
0,178
0,356
0,533
0,711
0,889
1,067
1,244
1,422
1,600
Mean=150563,9
-0,75 -0,5 -0,25 0 0,25 0,5 0,75 1 1,25
11th Real Option ConferenceBerkeley, June 2007
27
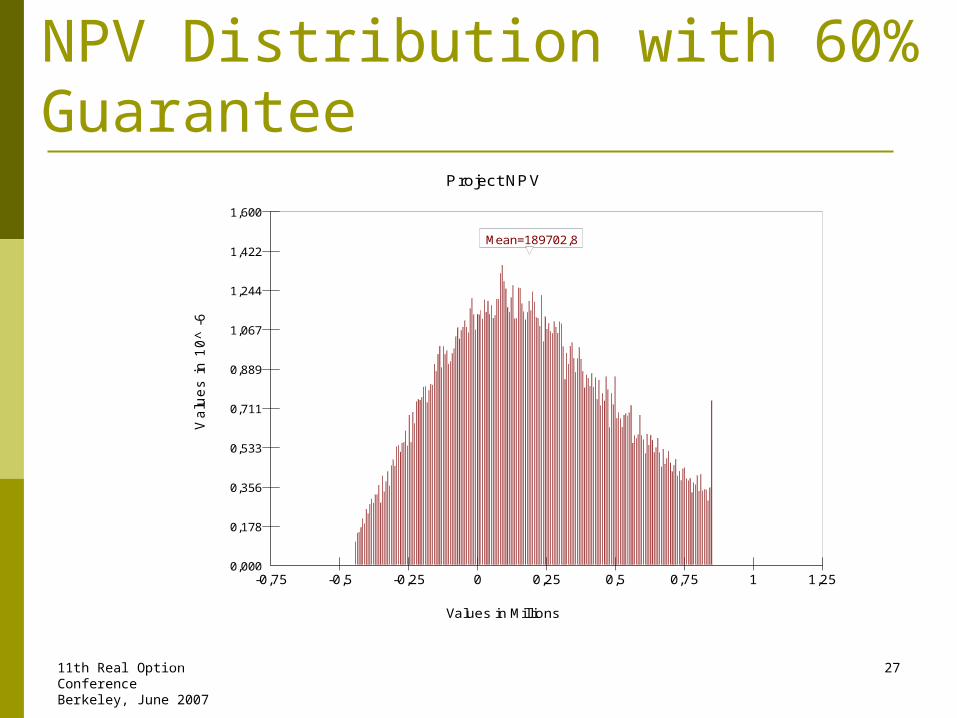
NPV Distribution with 60% Guarantee
1,251,25
-0,75 -0,5 -0,25 0 0,25 0,5 0,75 1 1,25
5% 90% 5% -,2851 ,728
Mean=189702,8
Project NPV
Val
ues
in 1
0^ -
6
Values in Millions
0,000
0,178
0,356
0,533
0,711
0,889
1,067
1,244
1,422
1,600
Mean=189702,8
-0,75 -0,5 -0,25 0 0,25 0,5 0,75 1 1,25

11th Real Option ConferenceBerkeley, June 2007
28
NPV Distribution with 65% Guarantee
1,251,25
-0,75 -0,5 -0,25 0 0,25 0,5 0,75 1 1,25
5% 90% 5% -,277 ,7838
Mean=226474,3
Project NPV
Val
ues
in 1
0^ -
6
Values in Millions
0,000
0,178
0,356
0,533
0,711
0,889
1,067
1,244
1,422
1,600
Mean=226474,3
-0,75 -0,5 -0,25 0 0,25 0,5 0,75 1 1,25
11th Real Option ConferenceBerkeley, June 2007
29
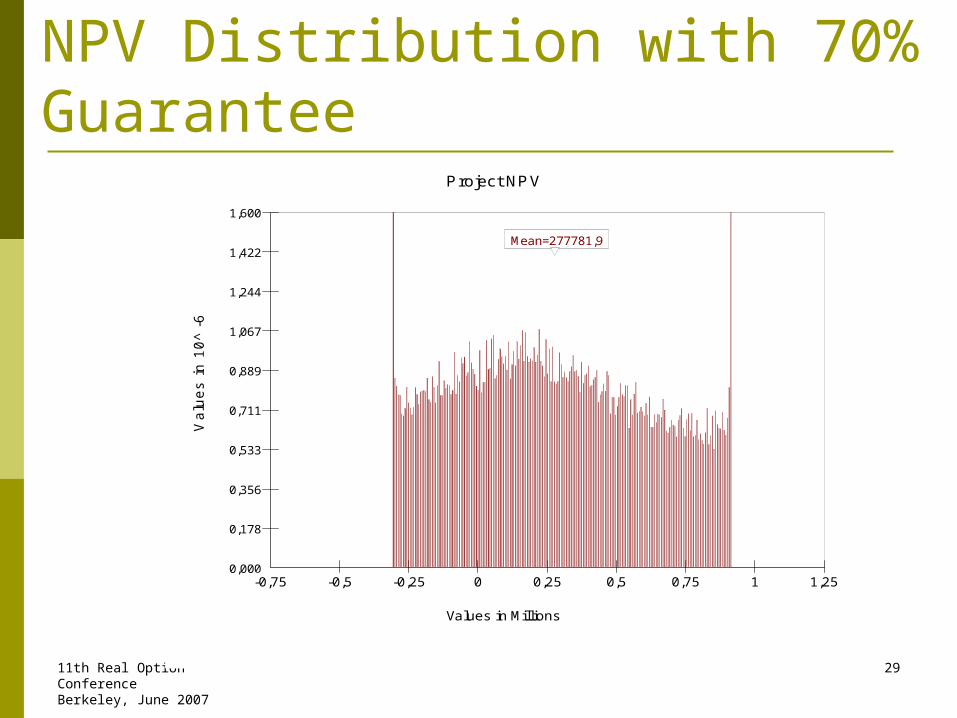
NPV Distribution with 70% Guarantee
1,251,25
-0,75 -0,5 -0,25 0 0,25 0,5 0,75 1 1,25
5% 90% 5% -,2511 ,8585
Mean=277781,9
Project NPV
Val
ues
in 1
0^ -
6
Values in Millions
0,000
0,178
0,356
0,533
0,711
0,889
1,067
1,244
1,422
1,600
Mean=277781,9
-0,75 -0,5 -0,25 0 0,25 0,5 0,75 1 1,25
11th Real Option ConferenceBerkeley, June 2007
30
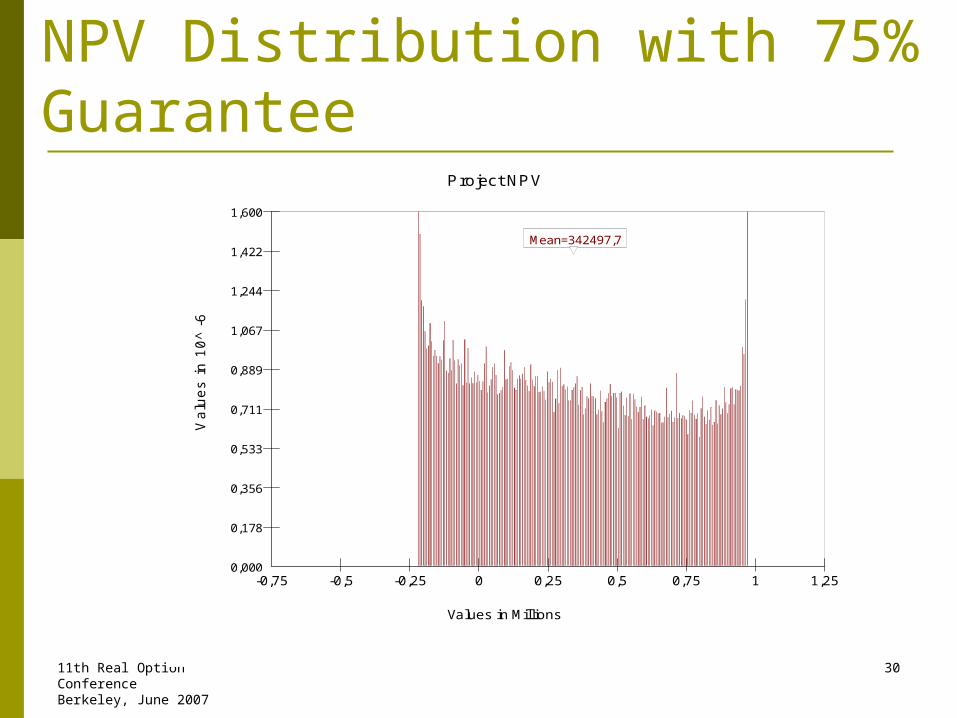
NPV Distribution with 75% Guarantee
1,251,25
-0,75 -0,5 -0,25 0 0,25 0,5 0,75 1 1,25
5% 90% 5% -,1958 ,9409
Mean=342497,7
Project NPV
Val
ues
in 1
0^ -
6
Values in Millions
0,000
0,178
0,356
0,533
0,711
0,889
1,067
1,244
1,422
1,600
Mean=342497,7
-0,75 -0,5 -0,25 0 0,25 0,5 0,75 1 1,25

11th Real Option ConferenceBerkeley, June 2007
31
NPV Distribution with 80% Guarantee
1,251,25
-0,75 -0,5 -0,25 0 0,25 0,5 0,75 1 1,25
5% 90% 5% -,107 1,0369
Mean=427200
Project NPV
Val
ues
in 1
0^ -
6
Values in Millions
0,000
0,178
0,356
0,533
0,711
0,889
1,067
1,244
1,422
1,600
Mean=427200
-0,75 -0,5 -0,25 0 0,25 0,5 0,75 1 1,25

11th Real Option ConferenceBerkeley, June 2007
32
NPV Distribution with 85% Guarantee
-0,75-0,75
-0,75 -0,5 -0,25 0 0,25 0,5 0,75 1 1,25
5% 90% 5% ,0286 1,1164
-0,75 -0,5 -0,25 0 0,25 0,5 0,75 1 1,25
Mean=526444,6 Mean=526444,6
Project NPV
Val
ues
in 1
0^ -
6
Values in Millions
0,000
0,178
0,356
0,533
0,711
0,889
1,067
1,244
1,422
1,600
Mean=526444,6
-0,75 -0,5 -0,25 0 0,25 0,5 0,75 1 1,25
11th Real Option ConferenceBerkeley, June 2007
33
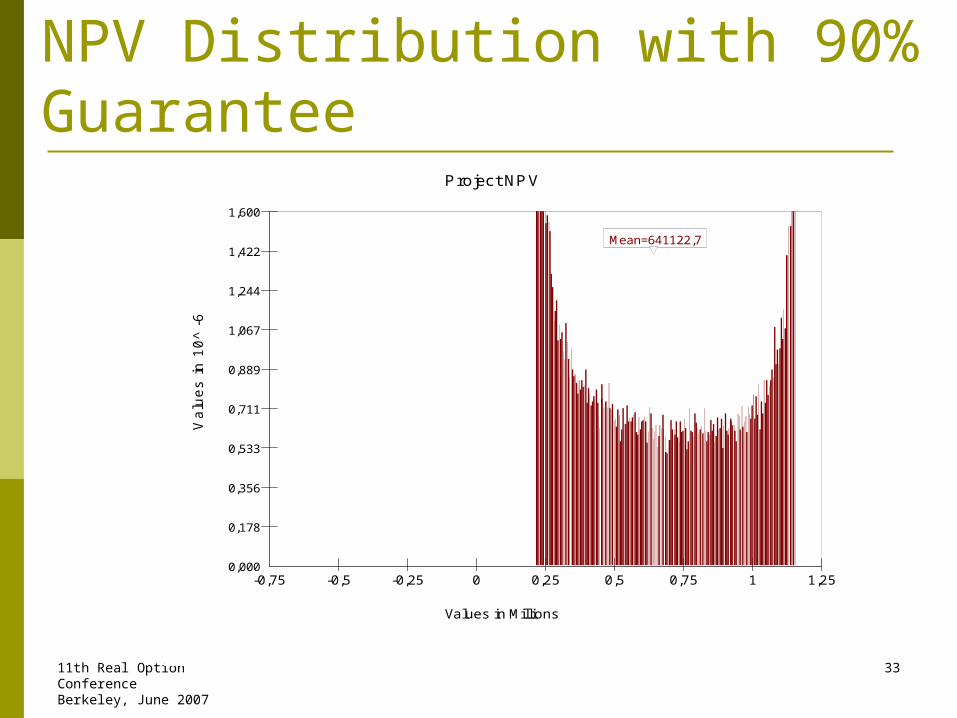
NPV Distribution with 90% Guarantee
-0,75 -0,5 -0,25 0 0,25 0,5 0,75 1 1,25
5% 90% 5% ,2153 1,1592
Mean=641122,7
Project NPV
Val
ues
in 1
0^ -
6
Values in Millions
0,000
0,178
0,356
0,533
0,711
0,889
1,067
1,244
1,422
1,600
Mean=641122,7
-0,75 -0,5 -0,25 0 0,25 0,5 0,75 1 1,25

11th Real Option ConferenceBerkeley, June 2007
34
Effect of Guarantee on Project
0
200
400
600
800
20% 30% 40% 50% 60% 70% 80% 90%
Traffic Guarantee (%)
R$
Mill
ion
s
NPV w/o Guarantee
NPV w/ Guarantee
11th Real Option ConferenceBerkeley, June 2007
35
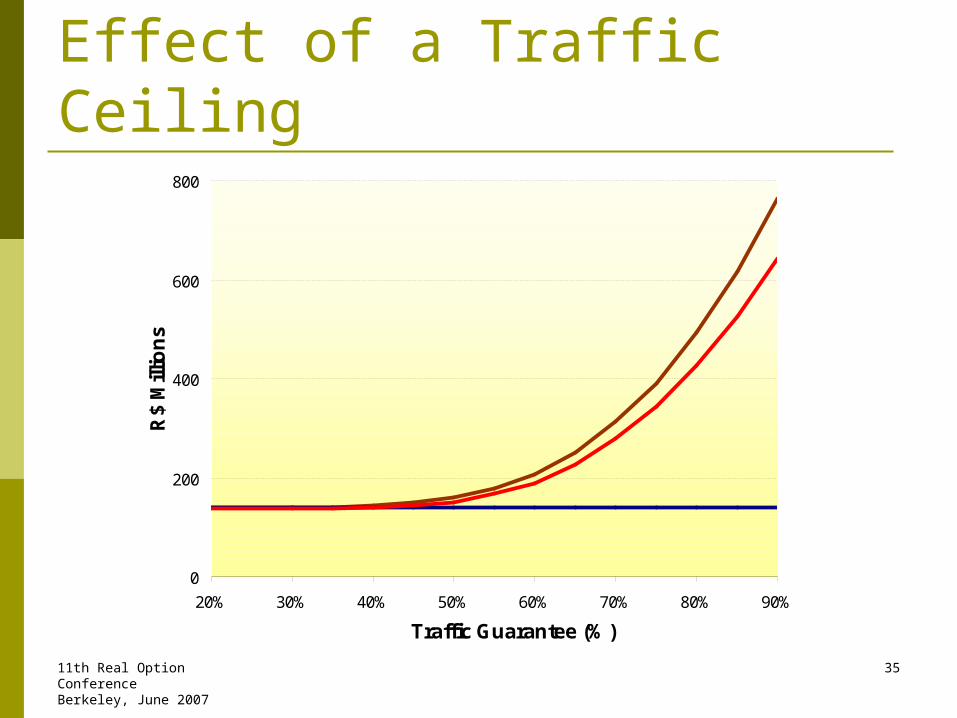
Effect of a Traffic Ceiling
0
200
400
600
800
20% 30% 40% 50% 60% 70% 80% 90%
Traffic Guarantee (%)
R$
Mill
ion
s
NPV w/o Guarantee
NPV w/ Guarantee
NPV w/ Ceiling
11th Real Option ConferenceBerkeley, June 2007
36
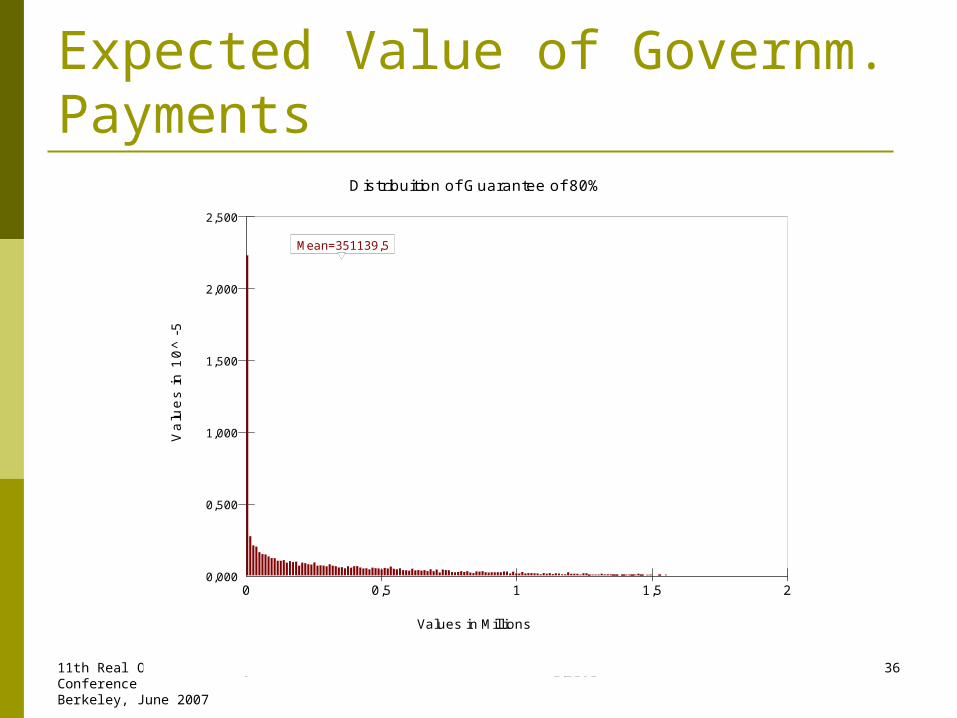
Expected Value of Governm. Payments
00
0 0,5 1 1,5 2
75,1% 5% > 0 1,2161
Mean=351139,5
Distribuition of Guarantee of 80%
Va
lue
s in
10
^ -5
Values in Millions
0,000
0,500
1,000
1,500
2,000
2,500
Mean=351139,5
0 0,5 1 1,5 2

11th Real Option ConferenceBerkeley, June 2007
37
NPV with Guarantee Caps
0
200
400
600
800
20% 30% 40% 50% 60% 70% 80% 90%
Traffic Guarantee (%)
R$
Mill
ion
s
NPV w/o Guarantee
No Cap
400M Cap
600M Cap

11th Real Option ConferenceBerkeley, June 2007
38
Expected Value of Payments w/ Caps
-100 0 100 200 300 400 500 600 700
5% 90% 5% 0 600
Mean=259243,5
80% Guarantee with 600M Cap
Va
lue
s in
10
^ -5
Values in Thousands
0,000
0,200
0,400
0,600
0,800
1,000
1,200
Mean=259243,5
-100 0 100 200 300 400 500 600 700-50 75 200 325 450
5% 90% 5% 0 400
Mean=201896
80% Guarantee with 400M Cap
Va
lue
s in
10
^ -5
Values in Thousands
0,000
0,200
0,400
0,600
0,800
1,000
1,200
1,400
1,600
1,800
2,000
Mean=201896
-50 75 200 325 450

11th Real Option ConferenceBerkeley, June 2007
39
Conclusions Valuation of government guarantees require the use of
option pricing methods.
The effect of different levels of support on the value and the risk of the project can be measured.
The expected cost and its probability distribution can also be estimated through real option analysis.
Setting caps to outlays from guarantees can be an effective way to limit government liability
Other forms of supports can also be modeled with this approach.
Valuing Government Guarantees in Toll Road
Projects
Luiz Brandão (PUC-Rio)
Eduardo Saraiva (BNDES)
Jun 2007