VALUE CHAIN ROADMAP FOR PULSES - · PDF fileThis value chain roadmap was developed on the...
89
KENYA VALUE CHAIN ROADMAP FOR PULSES 2016-2020
Transcript of VALUE CHAIN ROADMAP FOR PULSES - · PDF fileThis value chain roadmap was developed on the...

KENYAVALUE CHAIN ROADMAP FOR PULSES2016-2020


KENYA Value Chain Roadmap foR PulsEs

KENYA Value Chain Roadmap foR PulsEs
This value chain roadmap was developed on the basis of the process, methodology and technical assistance of the International Trade Centre ( ITC ) within the framework of its Trade Development Strategy programme.
ITC is the joint agency of the World Trade Organization and the United Nations. As part of the ITC mandate of fostering sustainable development through increased trade opportunities, the Trade Development Strategy programme offers a suite of trade-related strategy solutions to maximize the development payoffs from trade. ITC-facilitated trade development strategies and roadmaps are oriented to the trade objectives of a country or region and can be tailored to high-level economic goals, specific development targets or particular sectors, allowing policymakers to choose their preferred level of engagement.
The views expressed herein do not reflect the official opinion of ITC. Mention of firms, products and product brands does not imply the endorsement of ITC. This document has not been formally edited by ITC.
The International Trade Centre ( ITC )
Street address : ITC, 54-56, rue de Montbrillant, 1202 Geneva, SwitzerlandPostal address : ITC Palais des Nations 1211 Geneva, SwitzerlandTelephone : + 41- 22 730 0111Postal address : ITC, Palais des Nations, 1211 Geneva, SwitzerlandEmail : [email protected] : http :// www.intracen.org
Layout: Jesús Alés – www.sputnix.es

v
[ KENYA Value Chain Roadmap foR pulSeS ]
aCknowledgments
This value chain roadmap was elaborated as a component of the ITC Supporting Indian Trade and Investment in Africa ( SITA ) project, a south-south trade and in-vestment initiative that aims to improve the competitiveness of select value chains through the provision of partnerships by institutions and businesses from India. SITA is funded by the United Kingdom Department for International Development ( DFID ).
The formulation of the value chain roadmap was led by the Ministry of Industrialization and Enterprise Development and EAGC with the technical assistance of ITC. This document represents the ambitions of the private and public sector stakeholders for the development of the sector. Stakeholders’ commitment and comprehensive collaboration have helped build consensus around a common vision that reflects the realities and limitations of the private sector, as well as of policymakers and trade-related institutions.
The document benefited particularly from the inputs and guidance provided by the members of the sector team.
Name Organization Position
� Mr. Gerald MASILA EAGC Executive Director � Mr. Samwel RUTTO EAGC Regional Manager, Structured
Trading Systems � Mr. Peter GITHINJI EAGC Regional Programs Coordinator � Ms. Davine MINAYO EAGC Program Officer � Mr. Wainaina KUNG’U – Independent Consultant � Dr. Ganga RAO ICRISAT Senior Scientist � Mr. Oswald MIRITI CGA Project Officer
Technical support and guidance from ITC was rendered through Rahul Bhatnagar, Aman Goel, Bharat Kulkarni, Carlos Griffin. Nzuki Waita provided valuable support as National SITA coordinator.
vi
foRewoRds
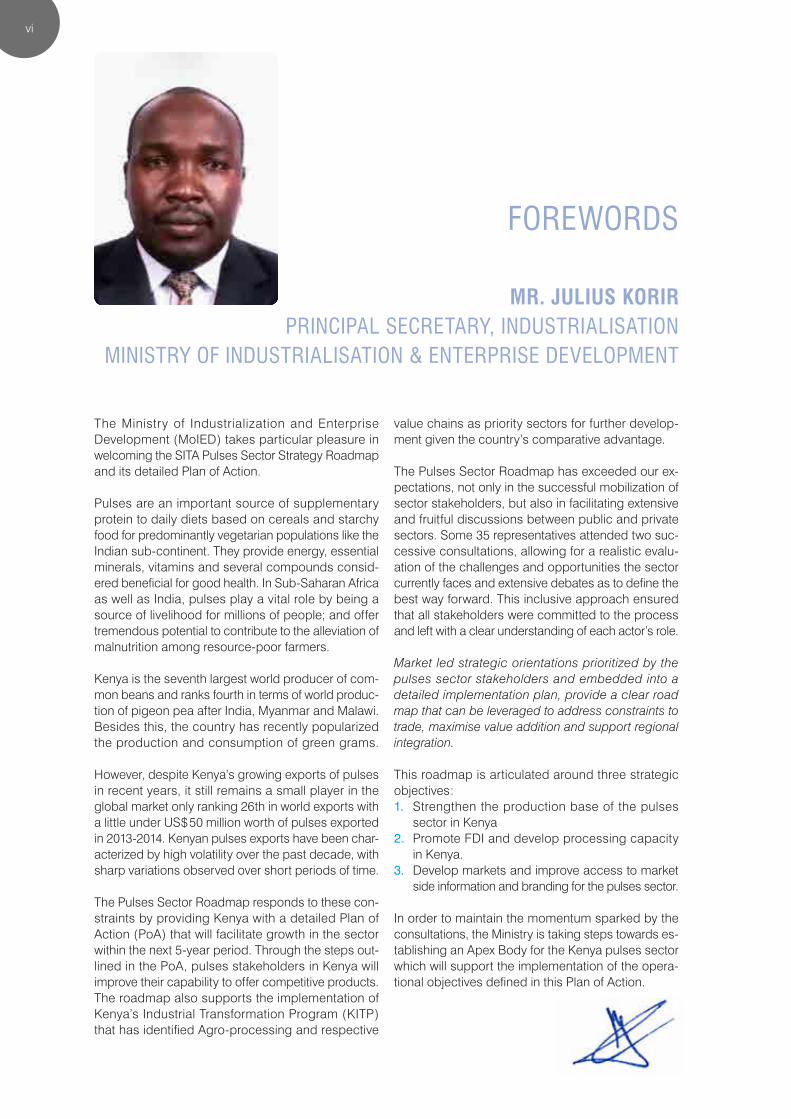
Mr. Julius Korir pRinCipal seCRetaRy, industRialisation
ministRy of industRialisation & enteRpRise deVelopment
The Ministry of Industrialization and Enterprise Development ( MoIED ) takes particular pleasure in welcoming the SITA Pulses Sector Strategy Roadmap and its detailed Plan of Action.
Pulses are an important source of supplementary protein to daily diets based on cereals and starchy food for predominantly vegetarian populations like the Indian sub-continent. They provide energy, essential minerals, vitamins and several compounds consid-ered beneficial for good health. In Sub-Saharan Africa as well as India, pulses play a vital role by being a source of livelihood for millions of people; and offer tremendous potential to contribute to the alleviation of malnutrition among resource-poor farmers.
Kenya is the seventh largest world producer of com-mon beans and ranks fourth in terms of world produc-tion of pigeon pea after India, Myanmar and Malawi. Besides this, the country has recently popularized the production and consumption of green grams.
However, despite Kenya’s growing exports of pulses in recent years, it still remains a small player in the global market only ranking 26 th in world exports with a little under US $ 50 million worth of pulses exported in 2013-2014. Kenyan pulses exports have been char-acterized by high volatility over the past decade, with sharp variations observed over short periods of time.
The Pulses Sector Roadmap responds to these con-straints by providing Kenya with a detailed Plan of Action ( PoA ) that will facilitate growth in the sector within the next 5-year period. Through the steps out-lined in the PoA, pulses stakeholders in Kenya will improve their capability to offer competitive products. The roadmap also supports the implementation of Kenya’s Industrial Transformation Program ( KITP ) that has identified Agro-processing and respective
value chains as priority sectors for further develop-ment given the country’s comparative advantage.
The Pulses Sector Roadmap has exceeded our ex-pectations, not only in the successful mobilization of sector stakeholders, but also in facilitating extensive and fruitful discussions between public and private sectors. Some 35 representatives attended two suc-cessive consultations, allowing for a realistic evalu-ation of the challenges and opportunities the sector currently faces and extensive debates as to define the best way forward. This inclusive approach ensured that all stakeholders were committed to the process and left with a clear understanding of each actor’s role.
Market led strategic orientations prioritized by the pulses sector stakeholders and embedded into a detailed implementation plan, provide a clear road map that can be leveraged to address constraints to trade, maximise value addition and support regional integration.
This roadmap is articulated around three strategic objectives :1. Strengthen the production base of the pulses
sector in Kenya2. Promote FDI and develop processing capacity
in Kenya.3. Develop markets and improve access to market
side information and branding for the pulses sector.
In order to maintain the momentum sparked by the consultations, the Ministry is taking steps towards es-tablishing an Apex Body for the Kenya pulses sector which will support the implementation of the opera-tional objectives defined in this Plan of Action.

vii
foRewoRds
Mr. GErAld MAKAu MAsilA exeCutiVe diReCtoR
easteRn afRiCa gRain CounCil
The Eastern Africa Grain Council ( EAGC ) is proud of its role as the Implementing Partner for the pulses value chain sector in the Supporting Indian Trade and Investment for Africa ( SITA ) project in Kenya and Tanzania.
EAGC is a regional, not-for-profit, membership-based organisation for the grain sector in Eastern and Southern Africa. The Council objective is to facili-tate efficient, structured and profitable trade in grain commodities and products for optimal benefits for all stakeholders – from producers to consumers.
In pursuit of our mandate, we provide a range of service and interventions aimed at developing and promoting structure grain trade including policy ad-vocacy to create and enabling environment for the grain sector to thrive, provision of market information through the regional agricultural trade intelligence network www.ratin.net, training and capacity build-ing of stakeholders on structured trading systems through our specialized training and capacity build-ing division the Eastern Africa Grain Institute ( EAGI ), grains post-harvest management, quality and safety assurance, warehousing, warehouse receipt systems and trade facilitation through the recently launched EAGC GSoko grain trading system.
As such, we are delighted by the SITA project which is bringing in the increased attention being afforded to the pulses sector in East Africa. Indeed, we see the pulses sector as a sleeping giant that once awoken, will play a significant role in socioeconomic develop-ment in Kenya, particularly in the context of Vision 2030. The facts truly speak for themselves ; global demand for pulses has been growing rapidly over the years and is forecasted to remain strong for the fore-seeable future, driven by growing populations, rising incomes and increased awareness of the nutritional value of pulses amongst consumers.
India which accounts for a quarter of all global im-ports of pulses, the European Union, the Middle East and North Africa region and China represent lucra-tive markets for pulses. Despite these opportunities in the global pulses market, Kenya accounts for just 0.5 % of global exports as recently as 2014, notwith-standing the increased domestic production. Limited awareness of the potential value of pulses in global markets, relatively weak domestic market linkages, low adoption of good agricultural practices and lim-ited value addition are just some of the stumbling blocks that will need to be addressed henceforth.
Given the need for clear strategic orientation for the pulses value chain in Kenya, the Kenya Value Chain Roadmap for Pulses has therefore been developed at an opportune moment. This Roadmap is the prod-uct of extensive consultations with public and private sector stakeholders, leading to unprecedented levels of cooperation among sector operators. Key private sector stakeholders and leading institutions facilitat-ed an exhaustive analysis of the sector. Market-led strategic interventions that have been prioritized by stakeholders are embedded into a detailed imple-mentation plan, ensuring that this Roadmap can be leveraged to address constraints to trade, maximize value addition and support regional integration, and eventually transform Kenya into a major player in the global pulses market.
EAGC has been privileged to participate in the devel-opment of this Roadmap and reaffirms its full com-mitment to spearhead its implementation in close collaboration with the Government of Kenya, ITC and other strategic partners. With the Roadmap in place, we urge all stakeholders to join forces and revamp the Pulses Sector in Kenya.

viii
Contents
acknowledgments v
ExEcutivE suMMArY xii
GlobAl PulsEs vAluE chAiN 17grown in many areas but dominated by a few large supply countries 17
larger number of exporters dominated by a small number of leading suppliers 19
dry peas, kidney beans and lentils dominate the trade of pulses 21
switch of import markets from the west to the east 22
strong indian demand keeps prices remunerative 25
AN EvolviNG vAluE chAiN iN NEEd of suPPort 27
CompetitiVe ConstRaints affeCting the Value Chain . . . . . . . . . . . . . . . . . . . . . . . . . . . . . . . . . . . . . . 43
supply-side issues 43
Business environment issues 46
market entry issues 47
development issues 47
thE wAY forwArd 49
stRategiC oBjeCtiVes . . . . . . . . . . . . . . . . . . . . . . . . . . . . . . . . . . . . . . . . . . . . . . . . . . . . . . . . . . . . . . . . . 49
leVeRaging pRoduCt diVeRsifiCation and maRket oppoRtunities . . . . . . . . . . . . . . . . . . . . . . . . . . . . 52
leVeRaging inVestment to sCale up opeRations and ClimB the Value addition laddeR . . . . . . . . 55
pulse trading and processing 56
agribusiness inputs and services 56
identified oppoRtunities foR inVestment . . . . . . . . . . . . . . . . . . . . . . . . . . . . . . . . . . . . . . . . . . . . . . . . 58
MoviNG to ActioN 61
pRioRity aCtions . . . . . . . . . . . . . . . . . . . . . . . . . . . . . . . . . . . . . . . . . . . . . . . . . . . . . . . . . . . . . . . . . . . . . . 61
roAdMAP PlAN of ActioN 65
appendix: kenya’s policies and trade agreements in a nutshell 74
References 81
annex 1: list of invited participants 83
ix
[ KENYA Value Chain Roadmap foR pulSeS ]
figuRes
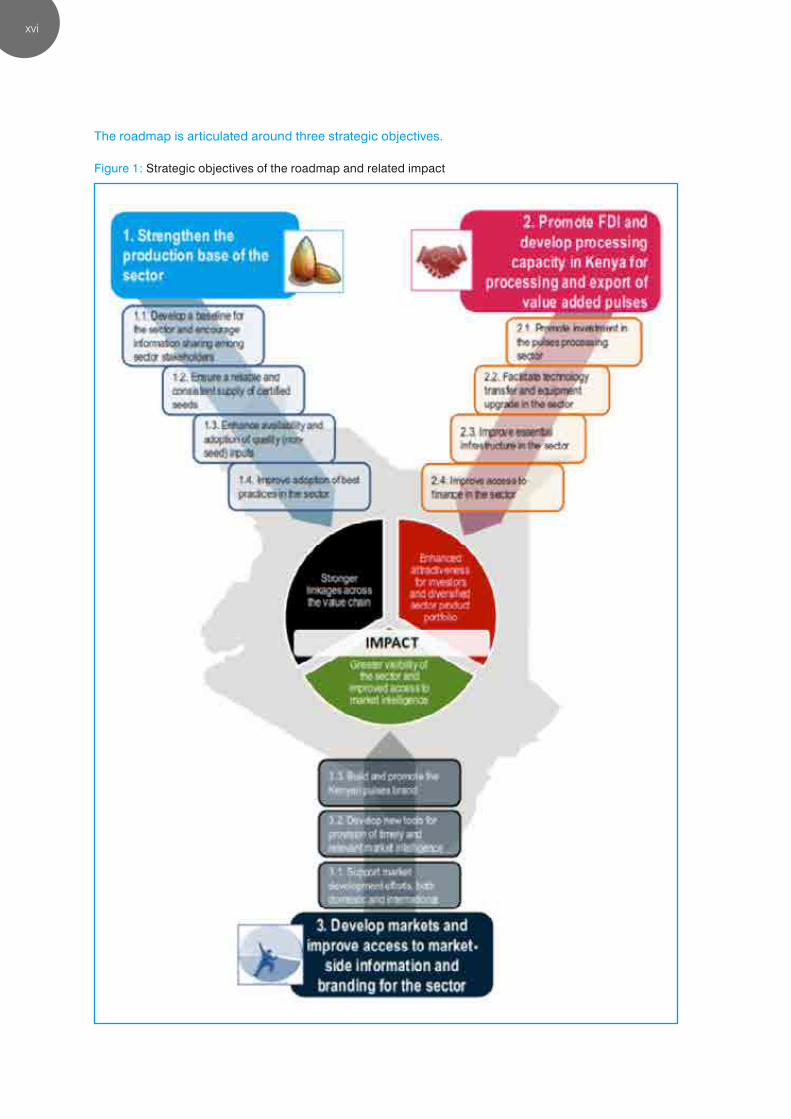
figure 1 : strategic objectives of the roadmap and related impact xvi
figure 2 : global pulses production and area harvested, 2003–2013 17
figure 3 : pulses production by region, average 2009–2013 18
figure 4 : share of pulse varieties in global production ( % ) – 2004 and present 18
figure 5 : exports of pulses, 2004–2014 ( us $ billions ) 19
figure 6 : exports of pulses by region or regional group, 2004–2014 ( us $ billions ) 20
figure 8 : kenyan production of pulses, 1961–2013 27
figure 9 : production of pulses in kenya, 2000–2013 29
figure 10 : production of pulses in kenya by subsector, 2000–2013 ( thousands of tons ) 29
figure 11 : kenyan production of dry beans, 2000–2013 30
figure 12 : kenyan production of cowpeas, 2000–2013 31
figure 13 : kenyan production of pigeon peas, 2000–2013 32
figure 14 : Current value chain 34
figure 15 : trade support network 35
figure 18 : kenyan exports of pulses to selected markets, 2004–2014 ( us $ millions ) 38
figure 19 : kenya’s export basket of pulses, 2004–2014 ( us $ thousands ) 39
figure 20 : pulse production, ethiopia, kenya and the united Republic of tanzania, 2005–2013 ( tons ) 40
figure 21 : pulses exports, ethiopia, kenya and the united Republic of tanzania, 2001–2013 ( tons ) 41
figure 22 : export to production, ethiopia, kenya and the united Republic of tanzania, 2003–2013 ( % ) 41
figure 23 : future value chain 60
x
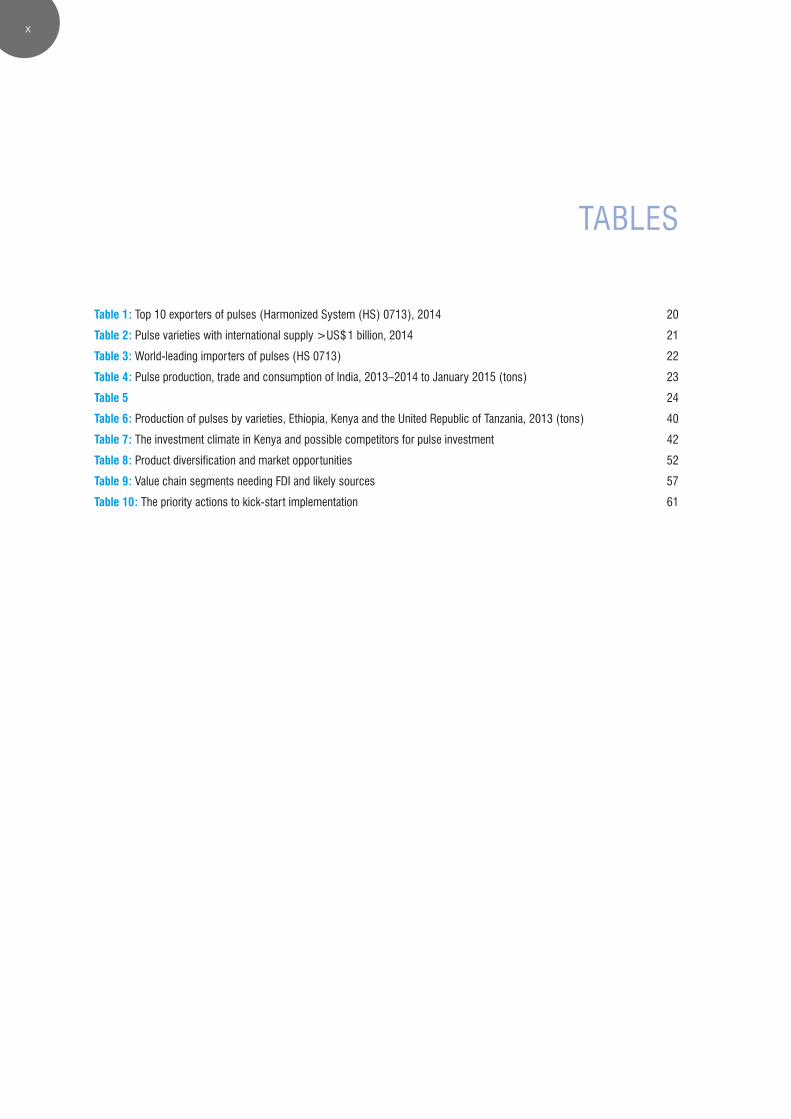
taBles
table 1 : top 10 exporters of pulses ( harmonized system ( hs ) 0713 ), 2014 20
table 2 : pulse varieties with international supply >us $ 1 billion, 2014 21
table 3 : world-leading importers of pulses ( hs 0713 ) 22
table 4 : pulse production, trade and consumption of india, 2013–2014 to january 2015 ( tons ) 23
table 5 24
table 6 : production of pulses by varieties, ethiopia, kenya and the united Republic of tanzania, 2013 ( tons ) 40
table 7 : the investment climate in kenya and possible competitors for pulse investment 42
table 8 : product diversification and market opportunities 52
table 9 : Value chain segments needing fdi and likely sources 57
table 10 : the priority actions to kick-start implementation 61
xi
[ KENYA Value Chain Roadmap foR pulSeS ]
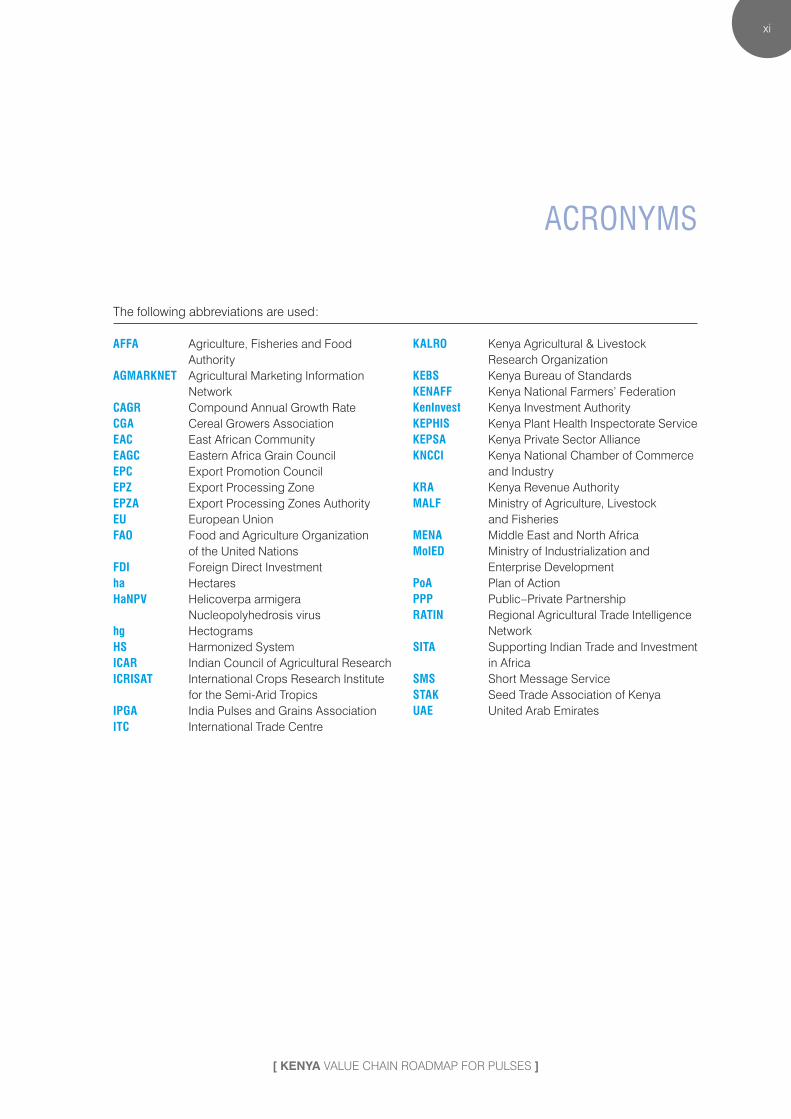
aCRonyms
The following abbreviations are used :
AffA Agriculture, Fisheries and Food Authority
AGMArKNEt Agricultural Marketing Information Network
cAGr Compound Annual Growth RatecGA Cereal Growers AssociationEAc East African CommunityEAGc Eastern Africa Grain CouncilEPc Export Promotion CouncilEPZ Export Processing ZoneEPZA Export Processing Zones AuthorityEu European UnionfAo Food and Agriculture Organization
of the United Nationsfdi Foreign Direct Investmentha HectareshaNPv Helicoverpa armigera
Nucleopolyhedrosis virushg Hectogramshs Harmonized SystemicAr Indian Council of Agricultural ResearchicrisAt International Crops Research Institute
for the Semi-Arid TropicsiPGA India Pulses and Grains Associationitc International Trade Centre
KAlro Kenya Agricultural & Livestock Research Organization
KEbs Kenya Bureau of StandardsKENAff Kenya National Farmers’ FederationKeninvest Kenya Investment AuthorityKEPhis Kenya Plant Health Inspectorate ServiceKEPsA Kenya Private Sector AllianceKNcci Kenya National Chamber of Commerce
and IndustryKrA Kenya Revenue AuthorityMAlf Ministry of Agriculture, Livestock
and FisheriesMENA Middle East and North AfricaMoiEd Ministry of Industrialization and
Enterprise DevelopmentPoA Plan of ActionPPP Public–Private PartnershiprAtiN Regional Agricultural Trade Intelligence
NetworksitA Supporting Indian Trade and Investment
in AfricasMs Short Message ServicestAK Seed Trade Association of KenyauAE United Arab Emirates

Photo: (CC BY-SA 2.0) CIAT (CC BY-SA 2.0), A climbing bean Aarmer.Ap
g
xii
exeCutiVe summaRy
the goal of Kenya’s Pulses value chain roadmap
the goal of Kenya’s Pulses value chain roadmap is to set the sector on the course of strategic develop-ment by addressing constraints in a comprehensive manner and defining concrete opportunities that can be realized through the specific steps detailed in its Plan of Action ( PoA ). Kenya’s pulses sector has recently shown signs of development, with booming exports in recent years as well as promising signs of diversification. While they were traditionally grown for sustenance, pulses have now become an important source of income for small Kenyan farmers. Nonetheless, the sector is still largely underdeveloped and exports are currently characterized by high volatility and a low level of survivability of trade relationships.
Efforts to address persistent constraints along the value chain must be made if the country is to compete on the international stage. The industry must build stronger linkages across the value chain, develop its knowledge base and attract investment in order to reach a higher – and sus-tainable – growth path and value addition. This will require addressing gaps in input supply, skills, market structure and institutional support. The PoA responds to these require-ments by setting three strategic objectives.
1. Strengthen the production base of the sector.a. Develop a baseline for the sector and encourage
information sharing among sector stakeholders.b. Ensure a reliable and consistent supply of certified
seeds.c. Enhance the availability and adoption of quality
( non-seed ) inputs.d. Improve adoption of best practices in the sector.
2. Promote foreign direct investment ( FDI ) and develop processing capacity in Kenya for processing and export of value added pulses.a. Promote investment in the pulses processing sector.b. Facilitate technology transfer and equipment upgrade
in the sector.c. Improve essential infrastructure in the sector.d. Improve access to finance in the sector.
3. Develop markets and improve access to market-side information and branding for the sector.a. Support market development efforts, both domestic
and international.b. Develop new tools for provision of timely and rel-
evant market intelligence.c. Build and promote the Kenyan pulses brand.
Usually intercropped with maize, sugar cane and coffee, and grown entirely by smallholder farmers, pulses have historically received little attention from support institutions in Kenya, which tended to focus more on cash crops such as maize.
Due to their hardiness and resistance to drought, which makes them ideal for Kenya’s often sporadic rainfall, and also being an important food source due to their high protein content and relatively low cost when compared with meat, pulses have gained in popularity among farmers. In 2013, Kenyan farmers were cultivating pulses on 1.47 million hectares ( ha ) of land, involving roughly 1.8 million households and producing 1 million tons of pulses. Domestic production is largely dominated by the production of dry beans ( 715,000 tons ), followed by pigeon peas ( 166,000 tons ), and cowpeas ( 134,000 tons ). Despite periods of fluctuation the volume produced, as

Photo: (CC BY-SA 2.0) CIAT (CC BY-SA 2.0), A climbing bean Aarmer.Ap
g
xiii
[ KENYA Value Chain Roadmap foR pulSeS ]
well as the area harvested and yields, has progressed over the past decade, making Kenya the fourth top producer of pulses in Africa
after Nigeria, the United Republic of Tanzania and Ethiopia, and number 17 in the world ( Food and Agriculture
Organization of the United Nations ( FAO ) ).
Despite these recent positive developments, the sector remains largely underdeveloped, in
particular compared with other African produc-ers such as the United Republic of Tanzania and Ethiopia, and vertical and horizontal business linkages tend to be undeveloped and informal because trade is based on temporary relationships with limited use of contracts. More generally, the indus-try appears to be relatively unstructured and poorly organized, partly resulting from low levels of cooperation among the different actors and a lack of trust among the different stakeholders op-erating in the sector. Farmers’ groups and cooperatives in the pulses sector also appear to be weak or non-existent, in turn contributing to the overall lack knowledge of the potential of pulses in
Kenya.
The most significant challenge at the mo-ment is achieving adequate dissemination
of improved seed varieties because most farms use their own beans for seed or buy from
local markets. Lack of such dissemination has severely limited productivity gains and has greatly
hindered the development of the supply chain, further complicated by farmers’ reluctance to pay the high cost of
certified seeds. Improved bean varieties could, for example, yield from 1,500 to 2,500 kg / ha, whereas the majority of farmers
use seeds that yield approximately 400 kg / ha. In addition to the low quality of seeds, other inputs such as fertilizers, insecticides and pesticides
appear to be used by only a small proportion of the sector’s farmers.
The low adoption of improved agricultural practices also significantly hinders the performance of the sector. In particular, postharvest practices suffer from a number of problems including inappropriate handling, inadequate storage methods and facilities, and common pest infestation, resulting in a higher than necessary inci-dence of spoilage. These factors are further complicated by slow transport caused by an inadequate road system. International buyers have also highlighted the uneven quality of Kenyan products – which is a major limiting factor for the export of pulses from Kenya – due to a lack of quality certification and standardization mechanisms as well as a lack of knowledge about specific markets’ requirements in terms of quality standards.
xiv
Another key issue affecting the capacity of the industry is the limited knowledge base of pulse producers and exporters. Market information appears to be a major constraint for Kenyan producers and exporters because very little information is available on issues such as pulse varieties and types, the calendar of different pulses globally, market requirements, and price fluctuation and movements, among others. This lack of knowledge impacts the development of pulse exports in Kenya. Building capacity on these issues will allow the industry to identify international business op-portunities while mitigating some of the costs and risks for new market development, ultimately resulting in greater competitiveness.
The current stage of maturity of the sector is hindering Kenya’s ability to fully capitalize on the industry’s strong global growth. Driven by rising incomes and population, and greater awareness of the health properties of pulses, the global pulses sector is projected to see stable demand and consumption trends in the long term. In line with the upward trend in global production, the growth path of pulse exports globally has been significant : pulse exports doubled in 2003 in comparison with the previous 20 years.1 The major importers of this commodity are concentrated in South Asia, China, Europe, and the Middle East and North Africa ( MENA ) region, India alone capturing nearly a quarter of the world imports.
In such favourable circumstances, and despite Kenyan’s booming exports of pulses in recent years, the country remains a small player in the global market, only ranking 26 in world exports, with US $ 49.8 million worth of pulses exported in 2013–2014. Kenyan exports have been characterized by high volatility over the past decade, with sharp variations observed within short periods of time, also reflecting the low level of survivability of export relationships. Besides, the sector is extremely vulnerable to imports from India and Pakistan, which together account for 82 % of the pulses exported by Kenya. This also highlights the fact that Kenyan firms are not taking advantage of the preferential market access Kenya benefits from in many countries2 as these markets remain largely untapped. Although South Asia, China, Europe and the MENA region offer the maximum potential for pulse exports, market characteristics and sensitivities vary from one region to another, forcing exporters to be fully aware of market requirements while exploring these opportunities.
Although signs of product diversification have recently been observed, it ap-pears to be difficult, at this stage of maturity of the sector, to add value to pulse products in Kenya. More than half of Kenya’s pulse exports are comprised of kidney beans and white pea beans, with most exports of pulses consisting of raw products with extremely limited value added by processors. Kenya’s product diversification is nevertheless promising, providing that concerted actions are taken to expand further and promote long survival rates. Extra efforts also need to be made to penetrate new markets and to unlock the production of more pulse varieties.
Kenya has to catch up with its competitors to become a major player in the global pulses market. In order to achieve a greater level of competitiveness, the sector must build stronger linkages across the value chain with the view to structuring the
1.– Food and Agriculture Organization of the United Nations ( 2005 ). Pulses : Past Trends and Future Prospects. Summary of paper con-tributed by FAO to the 4th International Food Legumes Research Conference, New Delhi, 18–22 October. Available from http : // www.fao.org / fileadmin / templates / est / COMM_MARKETS_MONITORING / Pulses / Documents / PulsesStudy.pdf.2.– Kenya is a signatory state of the Common Market for Eastern and Southern Africa Free Trade Area, a Member State of the East African Community ( EAC ), and has recently signed the EU–EAC Economic Partnership Agreement.

xv
[ KENYA Value Chain Roadmap foR pulSeS ]
sector and alleviating difficulties in production, promoting FDI in the pulse process-ing sector, and ensuring structured export development and promotion efforts.
The roadmap responds to these needs by providing Kenya with a detailed PoA that will facilitate growth in the sector within the next five-year period. Through the steps outlined in the PoA, stakeholders will improve their ability to offer competitive products. To this end, improved competitiveness must be tied to further penetration of current markets in the short term, expansion into new markets in the medium term, and the development of new products in the longer term. Particularly promising prospects for sectoral development may lie within the following market opportunities and products.
Target market Product Distribution channel
India and Pakistan
� Pigeon peas � Chickpeas ( yellow gram ) � Kidney beans � Green gram ( green mung ) � Processed dhal
� Wholesalers � Processors
China � Dry peas � Green gram ( green mung )
� Wholesalers � Processors
Europe ( including the United Kingdom of Great Britain and Northern Ireland )
� Dry beans, processed dhal, pigeon peas, chickpeas ( yellow gram ) kidney beans & green gram ( green mung )
� Processed dhal
� Wholesalers � Processors � Distributors
North Africa ( Algeria, Morocco, Egypt ) and MENA region ( United Arab Emirates ( UAE ), Qatar, Israel )
� Pigeon peas � Chickpeas ( yellow gram ) � Green gram ( green mung ) � Processed dhal
� Wholesalers � Distributors
United States of America and Canada � Processed dhal � Wholesalers � Distributors
Regional markets
� Mixed beans � Sugar beans � Processed dhal
� Wholesalers � Distributors
The roadmap was the result of extensive consultations with public and private sector stakeholders, leading to unprecedented levels of cooperation among sector operators. Key private sector stakeholders and leading institutions facilitated an exhaustive analysis of the sector. Market-led strategic orientations, prioritized by stakeholders and embedded into a detailed implementation plan, provide a clear roadmap that can be leveraged to address constraints to trade, maximize value addi-tion and support regional integration. In addition, the inclusive approach ensured that all stakeholders were committed to the process and left with a clear understanding of each actor’s role.
xvi
The roadmap is articulated around three strategic objectives.
Figure 1 : Strategic objectives of the roadmap and related impact
[ GLOBAL PULSES VALUE CHAIN ]
17
gloBal pulses Value Chain
Pulses play an important role in farming systems worldwide. They have proved to be ideal crops for achieving improve-ments in nutrition and health conditions, reducing poverty through higher food security and enhancing ecosystem re-silience, particularly in developing countries.
Trade trends for this crop are determined by importing countries’ local production and by production in exporting countries, both of which are affected by weather conditions, disease management, price increases of other crops ( as farmers can be compelled to move towards a higher rent crop ) and countries’ trade policies ( such as export incen-tives ). The following trends characterize the sector.
gRown in many aReas But dominated By a few laRge supply CountRies
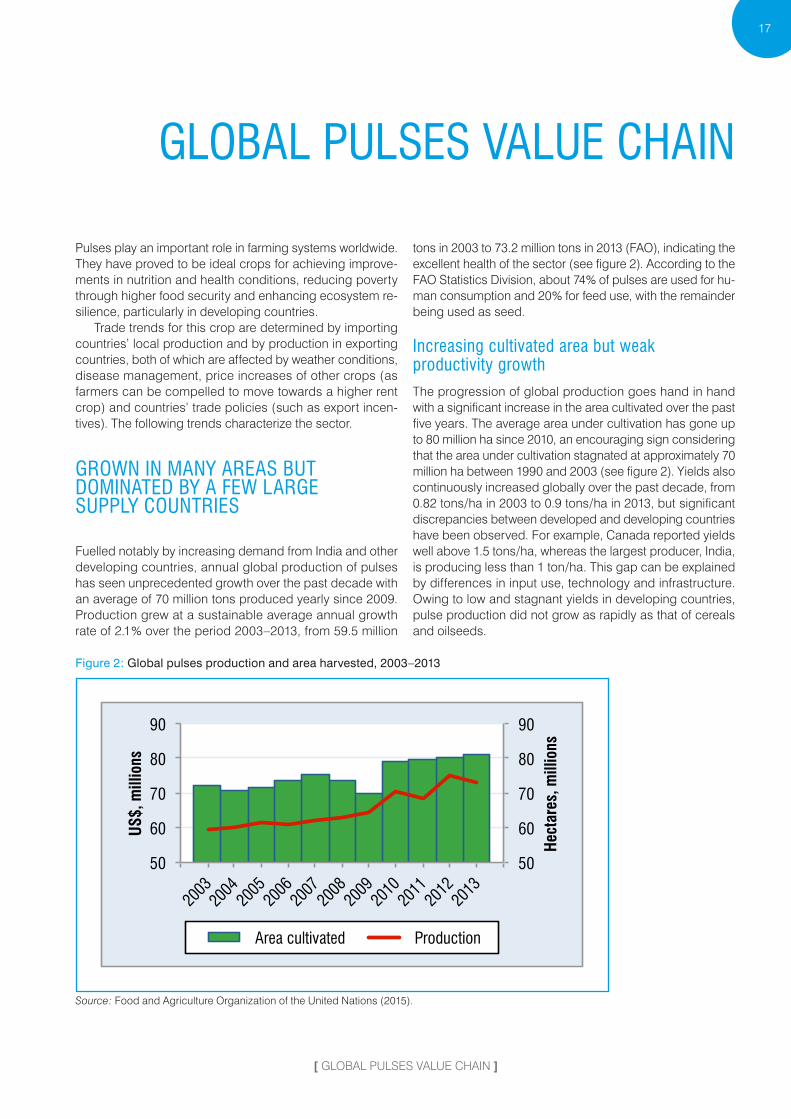
Fuelled notably by increasing demand from India and other developing countries, annual global production of pulses has seen unprecedented growth over the past decade with an average of 70 million tons produced yearly since 2009. Production grew at a sustainable average annual growth rate of 2.1 % over the period 2003–2013, from 59.5 million
tons in 2003 to 73.2 million tons in 2013 ( FAO ), indicating the excellent health of the sector ( see figure 2 ). According to the FAO Statistics Division, about 74 % of pulses are used for hu-man consumption and 20 % for feed use, with the remainder being used as seed.
increasing cultivated area but weak productivity growthThe progression of global production goes hand in hand with a significant increase in the area cultivated over the past five years. The average area under cultivation has gone up to 80 million ha since 2010, an encouraging sign considering that the area under cultivation stagnated at approximately 70 million ha between 1990 and 2003 ( see figure 2 ). Yields also continuously increased globally over the past decade, from 0.82 tons / ha in 2003 to 0.9 tons / ha in 2013, but significant discrepancies between developed and developing countries have been observed. For example, Canada reported yields well above 1.5 tons / ha, whereas the largest producer, India, is producing less than 1 ton / ha. This gap can be explained by differences in input use, technology and infrastructure. Owing to low and stagnant yields in developing countries, pulse production did not grow as rapidly as that of cereals and oilseeds.
Figure 2 : Global pulses production and area harvested, 2003–2013
50
60
70
80
90
50
60
70
80
90
2003
20
04 20
05 20
06 20
07 20
08 20
09 20
10 20
11 20
12 20
13
Hect
ares
, mill
ions
US$,
mill
ions
Area cultivated Production
Source : Food and Agriculture Organization of the United Nations ( 2015 ).

18
[ KENYA Value Chain Roadmap foR pulSeS ]
Figure 3 : Pulses production by region, average 2009–2013
Africa 22%
Americas 20%
Asia 45%
Europe 9%
Oceania 4%
Source : Food and Agriculture Organization of the United Nations ( 2015 ).
Figure 4 : Share of pulse varieties in global production ( % ) – 2004 and present
31
20
14
7 6 6 5
13
17
24
16
9 9 6 6
11
0
5
10
15
20
25
30
35
Dry beans Dry peas Chickpeas Dry broad beans
Cow peas Lentils Pigeon peas
Others
2004 Present
Source : FAOSTAT ( 2015 ).
In spite of their relatively low yields, developing countries are the largest producers of pulses, accounting for around 70 % of global production, with India leading the way. With its large vegetarian population that is largely dependent on pulses, wheat and milk as its major sources of protein, India remains by far the largest producing country, alone account-ing for 25 % ( or 18.3 million tons ) of world production in 2013 ( FAO ). It is followed by Canada ( 8.3 % ), Myanmar ( 7.1 % ),
China ( 6.1 % ) and Nigeria ( 4.1 % ), which together account for more than half of global output. Pulses of African origin have gained significant importance in recent years, from 12.2 million tons produced over the period 2004–2008, or 20 % of global production, to 15.4 million tons between 2009 and 2013, or 22 % of total production ( see figure 3 ).
[ GLOBAL PULSES VALUE CHAIN ]
19
the medium-to-long term outlook is promising
Supported by an anticipated growth in yields to reach an av-erage of 1.6 tons / ha by 2050 ( Alexandratos and Bruinsma, 2012, p. 121 ), pulse production is expected to grow in the long term and is forecast to reach 100 million tons by 2050. Driven by rising incomes and population, and greater aware-ness of the health properties of pulses, the sector is pro-jected to see stable demand and consumption trends in the long term. The FAO ( Alexandratos and Bruinsma, 2012, p. 47 ) further anticipates that ‘for the future, no major chang-es are foreseen in per capita consumption of pulses, with the average of the developing countries remaining at 7-8 kg’.
shift in consumption patterns
Significant changes have been observed in global con-sumption, and therefore production, of pulses over the past decade. Dry beans, which include Phaseolus species ( kid-ney beans, lima beans and tepary beans ) and Vigna spe-cies ( adzuki beans, mung beans and black gram ) used to be the largest category of pulses grown globally until 2004, contributing about 31 % of total pulse production. The share of dry beans has gone down significantly and now repre-sents 17 % of global pulse production. This variety has pro-gressively been replaced by dry peas as the leading variety over the past decade, going up from 20 % to 24 % of global production. One major reason that can be identified is the significant reduction of production of black beans in China. Chickpeas, representing 16 % of global production, stand as the third-largest grown variety, followed by cowpeas ( 9 % ) and broad beans ( 9 % ) ( see figure 4 ).
laRgeR numBeR of expoRteRs dominated By a small numBeR of leading supplieRs
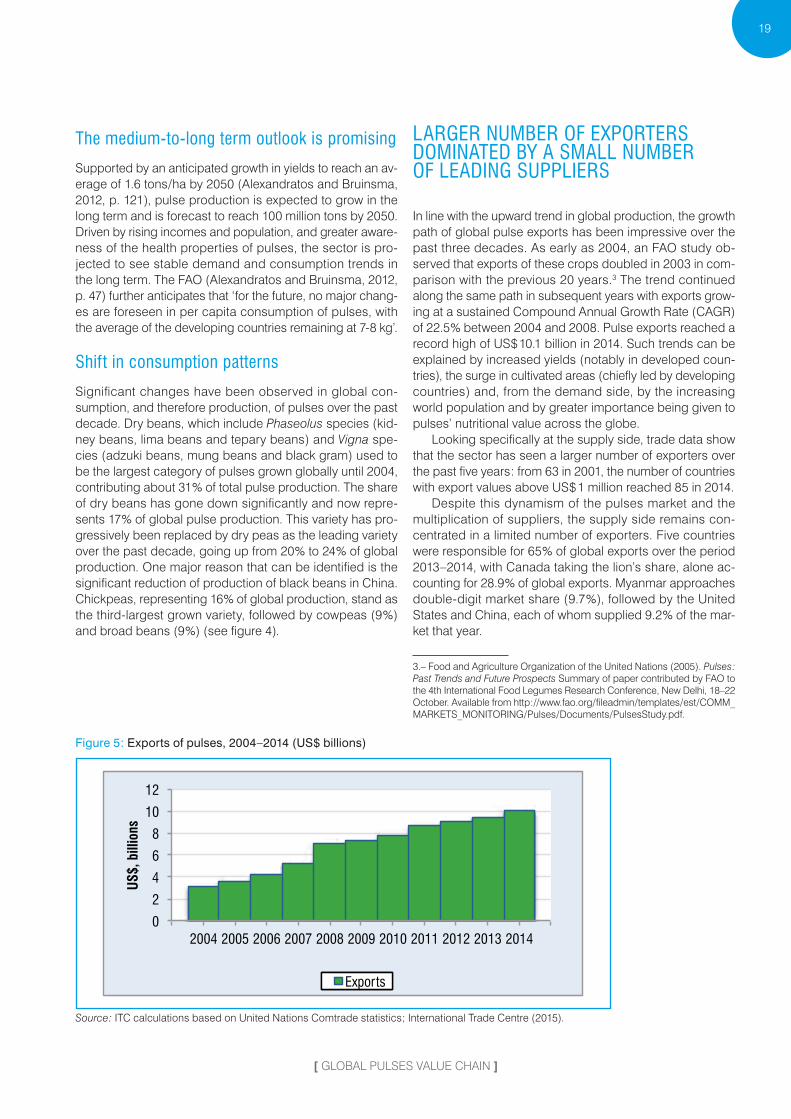
In line with the upward trend in global production, the growth path of global pulse exports has been impressive over the past three decades. As early as 2004, an FAO study ob-served that exports of these crops doubled in 2003 in com-parison with the previous 20 years.3 The trend continued along the same path in subsequent years with exports grow-ing at a sustained Compound Annual Growth Rate ( CAGR ) of 22.5 % between 2004 and 2008. Pulse exports reached a record high of US $ 10.1 billion in 2014. Such trends can be explained by increased yields ( notably in developed coun-tries ), the surge in cultivated areas ( chiefly led by developing countries ) and, from the demand side, by the increasing world population and by greater importance being given to pulses’ nutritional value across the globe.
Looking specifically at the supply side, trade data show that the sector has seen a larger number of exporters over the past five years : from 63 in 2001, the number of countries with export values above US $ 1 million reached 85 in 2014.
Despite this dynamism of the pulses market and the multiplication of suppliers, the supply side remains con-centrated in a limited number of exporters. Five countries were responsible for 65 % of global exports over the period 2013–2014, with Canada taking the lion’s share, alone ac-counting for 28.9 % of global exports. Myanmar approaches double-digit market share ( 9.7 % ), followed by the United States and China, each of whom supplied 9.2 % of the mar-ket that year.
3.– Food and Agriculture Organization of the United Nations ( 2005 ). Pulses : Past Trends and Future Prospects Summary of paper contributed by FAO to the 4th International Food Legumes Research Conference, New Delhi, 18–22 October. Available from http : // www.fao.org / fileadmin / templates / est / COMM_MARKETS_MONITORING / Pulses / Documents / PulsesStudy.pdf.
Figure 5 : Exports of pulses, 2004–2014 ( US $ billions )
0
2
4
6
8
10
12
2004 2005 2006 2007 2008 2009 2010 2011 2012 2013 2014
US$,
bill
ions
Exports
Source : ITC calculations based on United Nations Comtrade statistics ; International Trade Centre ( 2015 ).

20
[ KENYA Value Chain Roadmap foR pulSeS ]
Table 1 : Top 10 exporters of pulses ( Harmonized System ( HS ) 0713 ), 2014
HS 0713 – Dried vegetables, shelled
ExportersExports
2013–2014( US $ millions )
CAGR Share in world exports
CAGR2010–2014 ( % )
Average2011–2012 ( % )
Average2013–2014 ( % )
World 9 776 6.8 100 100
1 Canada 2 789 8.7 23.4 28.6
2 Myanmar 943 4.2 9.4 9.7
3 United States 894 5.8 8.4 9.2
4 China 892 -1.8 11.1 9.2
5 Australia 796 8.9 10.9 8.2
6 India 283 1.9 2.4 3.0
7 Argentina 274 4.0 5.2 2.8
8 Ethiopia 263 20.4 1.9 2.7
9 Turkey 227 -3.1 2.6 2.3
10 Egypt 220 33.0 1.2 2.2
15 United Republic of Tanzania 132 17.8 1.0 1.4
23 Kenya 50 6.8 0.2 0.5
Source : International Trade Centre ( ITC ) calculations based on United Nations Comtrade statistics ; International Trade Centre ( 2015 ).
Figure 6 : Exports of pulses by region or regional group, 2004–2014 ( US $ billions )
0
2
4
6
8
10
12
2004
20
05
2006
20
07
2008
20
09
2010
20
11
2012
20
13
2014
US$,
bill
ions
America Asia Europe Africa Oceania
Source : International Trade Centre ( 2015 ).
pulses of african origin are gaining market share
The African continent produces several varieties of puls-es that are in high demand in consuming countries, chief among which is India. Pulses like mung beans, chickpeas ( yellow gram variety ), pigeon peas and kidney beans are already being exported to India from Africa, with
major exporters including Ethiopia, the United Republic of Tanzania, Malawi, Kenya, Mozambique, Madagascar, Uganda and, more recently, Sudan. African origin pulses were first introduced by the State Trading Corporation of India. Subsequently, some private players have entered the market and are exporting to the South Asia region. Further, Indian buyers and processors are increasingly looking at

[ GLOBAL PULSES VALUE CHAIN ]
21
African origin due to logistical convenience, availability of raw materials for processing and low processing costs. Indian importers have also been trying to look for alterna-tive origins to diversify the import from Myanmar.
Pulses of African origin are gaining market share. Among the top 20 exporters of pulses, Ethiopia and the United Republic of Tanzania achieved significant growth rates in exports between 2010 and 2014, with a CAGR of exports in value of 20.4 % and 17.8 %, respectively. With US $ 50 mil-lion worth of pulses exported over the period 2013–2014, Kenya’s share in world exports is roughly 0.5 %, a significant progression compared with the 0.2 % share the country re-ported for the period 2011–2012.
The major African origin pulse category imported in South Asia is Tanzanian pigeon peas, imported to the level of 22 % of the total imports of pigeon peas in India. In addi-tion to pigeon peas, the United Republic of Tanzania also exports chickpeas to India. To a lesser extent, Mozambique, Malawi and Sudan are also supplying the Indian market with this variety of pulse. Mung beans of African origin are also being exported to India from the United Republic of
Tanzania, Kenya and Mozambique. Finally, Ethiopia appears to be a major supplier of kidney beans to the Indian market. These imports are expected to continue growing in the long term given shortfalls in domestic production.
dRy peas, kidney Beans and lentils dominate the tRade of pulsesWhile all varieties experienced strong growth over the past five years, the expansion of dry peas and kidney beans & white pea beans exports is especially notable, with a CAGR of 10 % over the period 2010–2014. Canada is by far the top exporter of dry peas and lentils, whereas Myanmar and Australia are the most important exporters of urd, mung, black / green gram beans and chickpeas, respectively. China still largely dominates exports of kidney beans & white pea beans but its market share is declining.
Table 2 provides information on pulse varieties whose international supply, on average for 2013–2014, was above US $ 1 billion.
Table 2 : Pulse varieties with international supply >US $ 1 billion, 2014
Dry peas ( HS 071310 ) Kidney beans & white pea beans ( HS 071333 ) Lentils ( HS 071340 )
Exporter
Average 2013-2014
( US $ millions )CAGR
2010–2014 Exporter
Average 2013-2014
( US $ millions )CAGR
2010–2014 Exporter
Average 2013-2014
( US $ millions )CAGR
2010–2014
World 2 134 10 % World 1 991 10 % World 1 907 3 %
Leading and growing Leading and growing Leading and growing
Canada 1 194 12 % Argentina 195 2 % Canada 1 220 7 %
United States 265 9 % United States 181 20 % Australia 197 16 %
Russian Federation 103 29 % Ethiopia 166 42 %
United States 147 1 %
Australia 73 3 % Egypt 164 51 % Sri Lanka 15 8 %
Ukraine 46 7 % Canada 146 4 % Egypt 12 16 %
Leading but declining Leading but declining
China 577 -5 % Turkey 181 -3 %
UAE 34 -17 %
Urd, mung, black / green gram beans ( HS 071331 ) Chickpeas ( HS 071320 )
ExporterAverage 2013-2014
( US $ millions )CAGR
2010–2014 ExporterAverage 2013-2014
( US $ millions )CAGR
2010–2014
World 1 006 0 % World 1 093 6 %
Leading and growing Leading and growing
China 196 6 % Australia 298 8 %
Indonesia 26 28 % Mexico 157 16 %
Egypt 20 27 % Russian Federation 88 103 %
United States 9 6 % United States 48 3 %
Malawi 8 134 % Argentina 38 20 %
Leading but declining Leading but declining
Myanmar 588 -3 % India 264 -1 %
Australia 48 -22 % Canada 44 -10 %
Ethiopia 34 -3 %
22
[ KENYA Value Chain Roadmap foR pulSeS ]
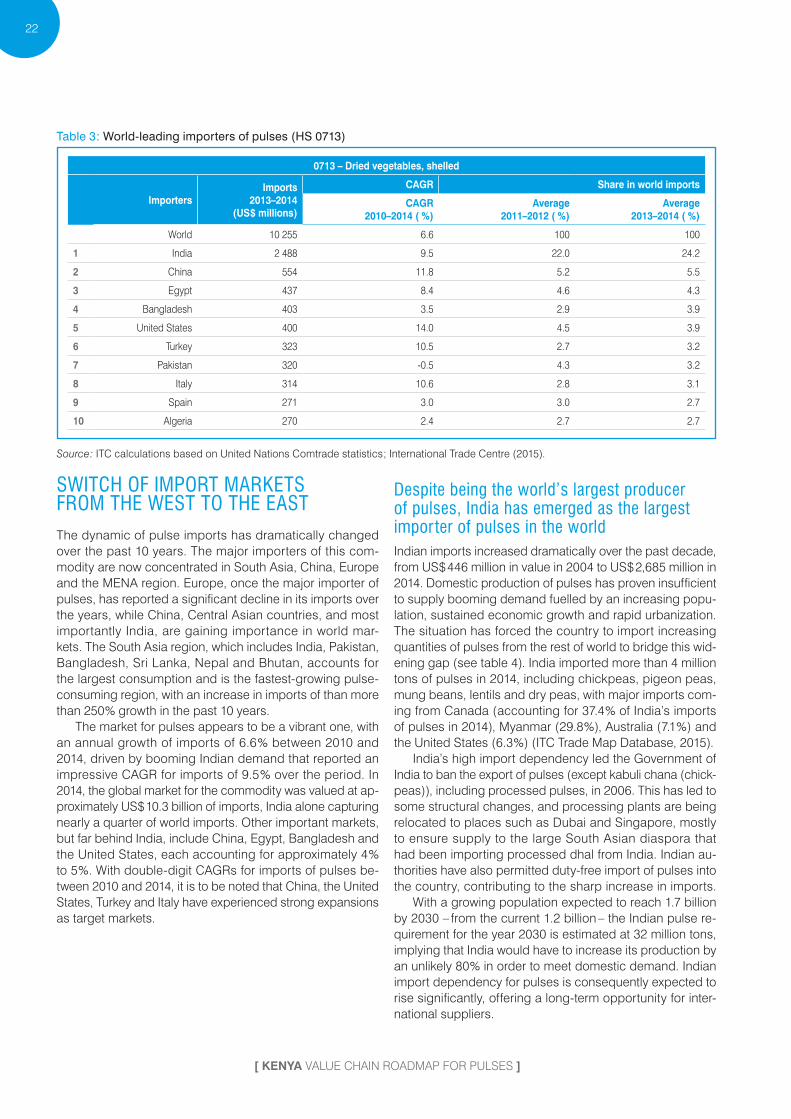
Table 3 : World-leading importers of pulses ( HS 0713 )
0713 – Dried vegetables, shelled
ImportersImports
2013–2014( US $ millions )
CAGR Share in world imports
CAGR2010–2014 ( % )
Average2011–2012 ( % )
Average2013–2014 ( % )
World 10 255 6.6 100 100
1 India 2 488 9.5 22.0 24.2
2 China 554 11.8 5.2 5.5
3 Egypt 437 8.4 4.6 4.3
4 Bangladesh 403 3.5 2.9 3.9
5 United States 400 14.0 4.5 3.9
6 Turkey 323 10.5 2.7 3.2
7 Pakistan 320 -0.5 4.3 3.2
8 Italy 314 10.6 2.8 3.1
9 Spain 271 3.0 3.0 2.7
10 Algeria 270 2.4 2.7 2.7
Source : ITC calculations based on United Nations Comtrade statistics ; International Trade Centre ( 2015 ).
switCh of impoRt maRkets fRom the west to the eastThe dynamic of pulse imports has dramatically changed over the past 10 years. The major importers of this com-modity are now concentrated in South Asia, China, Europe and the MENA region. Europe, once the major importer of pulses, has reported a significant decline in its imports over the years, while China, Central Asian countries, and most importantly India, are gaining importance in world mar-kets. The South Asia region, which includes India, Pakistan, Bangladesh, Sri Lanka, Nepal and Bhutan, accounts for the largest consumption and is the fastest-growing pulse-consuming region, with an increase in imports of than more than 250 % growth in the past 10 years.
The market for pulses appears to be a vibrant one, with an annual growth of imports of 6.6 % between 2010 and 2014, driven by booming Indian demand that reported an impressive CAGR for imports of 9.5 % over the period. In 2014, the global market for the commodity was valued at ap-proximately US $ 10.3 billion of imports, India alone capturing nearly a quarter of world imports. Other important markets, but far behind India, include China, Egypt, Bangladesh and the United States, each accounting for approximately 4 % to 5 %. With double-digit CAGRs for imports of pulses be-tween 2010 and 2014, it is to be noted that China, the United States, Turkey and Italy have experienced strong expansions as target markets.
despite being the world’s largest producer of pulses, india has emerged as the largest importer of pulses in the worldIndian imports increased dramatically over the past decade, from US $ 446 million in value in 2004 to US $ 2,685 million in 2014. Domestic production of pulses has proven insufficient to supply booming demand fuelled by an increasing popu-lation, sustained economic growth and rapid urbanization. The situation has forced the country to import increasing quantities of pulses from the rest of world to bridge this wid-ening gap ( see table 4 ). India imported more than 4 million tons of pulses in 2014, including chickpeas, pigeon peas, mung beans, lentils and dry peas, with major imports com-ing from Canada ( accounting for 37.4 % of India’s imports of pulses in 2014 ), Myanmar ( 29.8 % ), Australia ( 7.1 % ) and the United States ( 6.3 % ) ( ITC Trade Map Database, 2015 ).
India’s high import dependency led the Government of India to ban the export of pulses ( except kabuli chana ( chick-peas ) ), including processed pulses, in 2006. This has led to some structural changes, and processing plants are being relocated to places such as Dubai and Singapore, mostly to ensure supply to the large South Asian diaspora that had been importing processed dhal from India. Indian au-thorities have also permitted duty-free import of pulses into the country, contributing to the sharp increase in imports.
With a growing population expected to reach 1.7 billion by 2030 – from the current 1.2 billion – the Indian pulse re-quirement for the year 2030 is estimated at 32 million tons, implying that India would have to increase its production by an unlikely 80 % in order to meet domestic demand. Indian import dependency for pulses is consequently expected to rise significantly, offering a long-term opportunity for inter-national suppliers.

[ GLOBAL PULSES VALUE CHAIN ]
23
Table 4 : Pulse production, trade and consumption of India, 2013–2014 to January 2015 ( tons )
2013–2014 2014–2015 January 2015
Production 19.78 18.4 18.43
Import 3.04 3.41 4.1
Total availability 22.82 21.81 22.53
Export 0.34 0.23 0.19
Domestic availability 22.48 21.58 22.34
Source : Indian Directorate of Economics and Statistics.
significant contraction of european demand
Once the most important market for pulses with about 45 % of the world’s pulse imports handled in 2004, Europe has now slipped to second position, standing at approximately 22 % of total imports with an average import of about 2.2 million tons every year ( FAO ).
Several factors can explain this fall in imports, includ-ing an inadequate level of product innovation adapted to modern life, a small home supply of pulses and competition from cheaper low-quality imports. An important factor when it comes to the European market for pulses is that pulses are consumed in many different ways in the various European Union ( EU ) countries, due to different regional food habits and traditions, and to differences in the supplies of grain legumes. Although dry beans are the most consumed pulse in the EU, it is important to keep in mind that preferences between varieties vary from one country to another.
A significant amount of pulse imports were for animal feed because the production of meat and dairy products in most EU countries is to a large degree dependent on pro-tein feed imports. However, a shift from pulses to soybeans, mainly imported from Latin America, has been observed during the past several years.
Despite the recent loss of market share, pulse demand could rebound in Europe with recent increases in preferenc-es for vegan and gluten-free diets, offering exciting export opportunities. As discussed above, pulses have significant nutritional and health advantages for consumers and their cultivation has a positive impact on agriculture and the en-vironment. If Europe is a slow market, trends in consump-tion of pulses could change, especially if awareness-raising campaigns about the benefits of pulses are improved and if the food industry and professional organizations take up the challenge to incorporate grain legumes in novel, convenient and healthy food products.
pulses are seeing an increase in demand from the non-traditional processed food sector, namely with an increasing drive towards gluten-free diets
The pulses industry is estimated to be worth over US $ 100 billion at the retail level. With greater awareness of coeliac disease and gluten sensitivity, the demand for gluten-free products is on the rise, resulting in a significant change in dietary patterns in the past few years. Benefiting from these developments, pulses such as yellow peas, lentils and chickpeas are gaining recognition as the ‘new and im-proved’ heart of healthy foods and new processed products made from lentils and chickpeas – such as pasta, noodles and chips – have been developed.
Change in consumption patterns in China
With a growing population of 1.35 billion, China has recently shown an impressive rise in demand for pulses to become the second major importer in Asia and the third-largest mar-ket in the world.
China reported a CAGR of imports of 11.8 % between 2010 and 2014, its share in world imports rising from less than 1 % ( average for the years 2003–2004 ) to 5.5 % ( aver-age for 2013–2014 ) over the past decade. Once a net ex-porter of cheap, low quality pulses such as black beans, China, with its economic resurgence and growing middle class, is now importing some of those very same commodi-ties, the result of shifting demands and a rapidly changing society. Increasing production costs in local agriculture have led to a loss of competitiveness of the pulses sector, result-ing in a contraction of production and exports. The 2013 flooding that partially destroyed crops has also contributed to the drop in black bean exports from China.
The country is importing significant quantities of dry peas, consumed in various forms including starch, vermicelli and snack food. The increasing influence of Western culture and food habits in China has contributed to this change in consumption patterns with a new demand for processed pulses that were not traditionally consumed. Recent invest-ments in processing factories confirm this trend, resulting in
24
[ KENYA Value Chain Roadmap foR pulSeS ]
a sharp increase in imports of dry peas by China in recent years. Although the carry-over stock kept imports to a level of 700,000–800,000 tons in 2014, imports are expected to rebound to an average of 1 million tons every year.
the mena region is a traditional importer of pulses, which feature prominently in regional cuisine
The MENA region has high population growth rates and many countries are seeing sustainable growth in food ser-vice and retail sales. Consumers in the MENA region are increasingly using supermarkets for food purchases, which has in turn led to an increase in demand for processed puls-es such as canned pulses and pulse flours. The extraordi-nary growth in the hospitality industry in countries such as Morocco, Egypt and Israel, and the city of Dubai ( UAE ), cou-pled with the introduction of new cuisines, is also pushing
demand for pulses such as chickpeas, lentils, peas and beans to new levels. Demand for pulses is on the rise among both traditional consumers and new markets in this region.
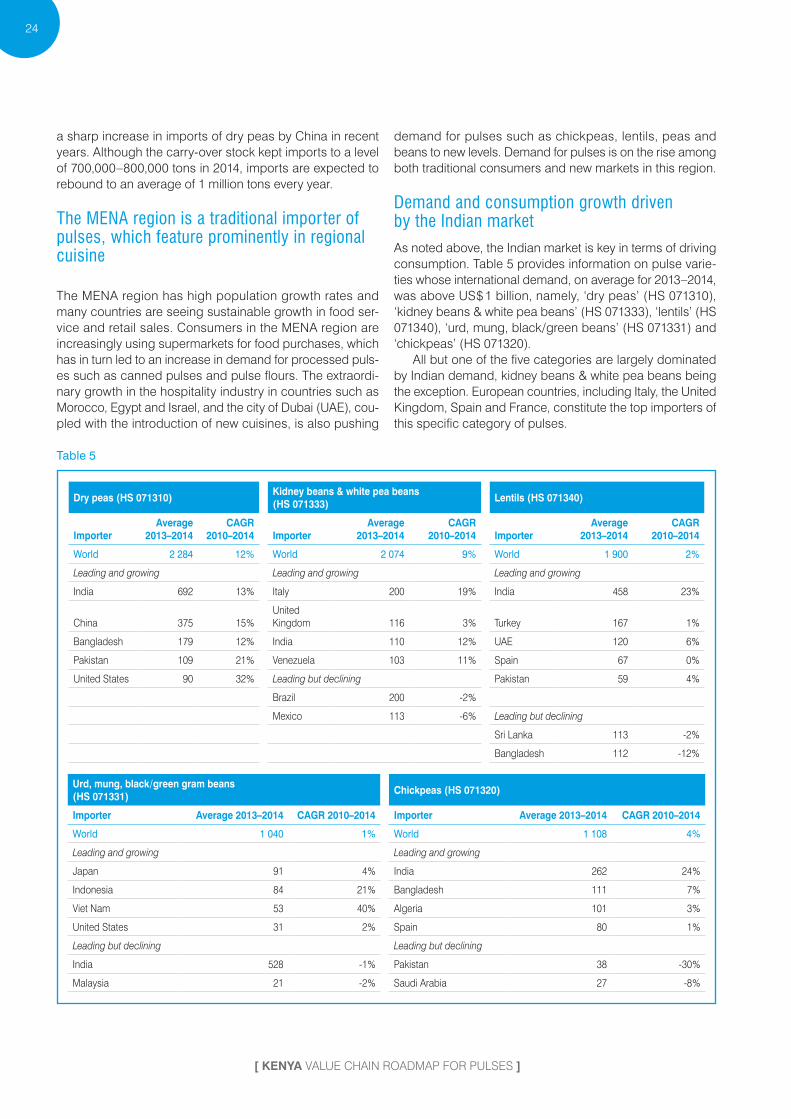
demand and consumption growth driven by the indian marketAs noted above, the Indian market is key in terms of driving consumption. Table 5 provides information on pulse varie-ties whose international demand, on average for 2013–2014, was above US $ 1 billion, namely, ‘dry peas’ ( HS 071310 ), ‘kidney beans & white pea beans’ ( HS 071333 ), ‘lentils’ ( HS 071340 ), ‘urd, mung, black / green beans’ ( HS 071331 ) and ‘chickpeas’ ( HS 071320 ).
All but one of the five categories are largely dominated by Indian demand, kidney beans & white pea beans being the exception. European countries, including Italy, the United Kingdom, Spain and France, constitute the top importers of this specific category of pulses.
Table 5
Dry peas ( HS 071310 )Kidney beans & white pea beans( HS 071333 )
Lentils ( HS 071340 )
ImporterAverage
2013–2014CAGR
2010–2014 ImporterAverage
2013–2014CAGR
2010–2014 ImporterAverage
2013–2014CAGR
2010–2014
World 2 284 12 % World 2 074 9 % World 1 900 2 %
Leading and growing Leading and growing Leading and growing
India 692 13 % Italy 200 19 % India 458 23 %
China 375 15 %United Kingdom 116 3 % Turkey 167 1 %
Bangladesh 179 12 % India 110 12 % UAE 120 6 %
Pakistan 109 21 % Venezuela 103 11 % Spain 67 0 %
United States 90 32 % Leading but declining Pakistan 59 4 %
Brazil 200 -2 %
Mexico 113 -6 % Leading but declining
Sri Lanka 113 -2 %
Bangladesh 112 -12 %
Urd, mung, black / green gram beans( HS 071331 )
Chickpeas ( HS 071320 )
Importer Average 2013–2014 CAGR 2010–2014 Importer Average 2013–2014 CAGR 2010–2014
World 1 040 1 % World 1 108 4 %
Leading and growing Leading and growing
Japan 91 4 % India 262 24 %
Indonesia 84 21 % Bangladesh 111 7 %
Viet Nam 53 40 % Algeria 101 3 %
United States 31 2 % Spain 80 1 %
Leading but declining Leading but declining
India 528 -1 % Pakistan 38 -30 %
Malaysia 21 -2 % Saudi Arabia 27 -8 %
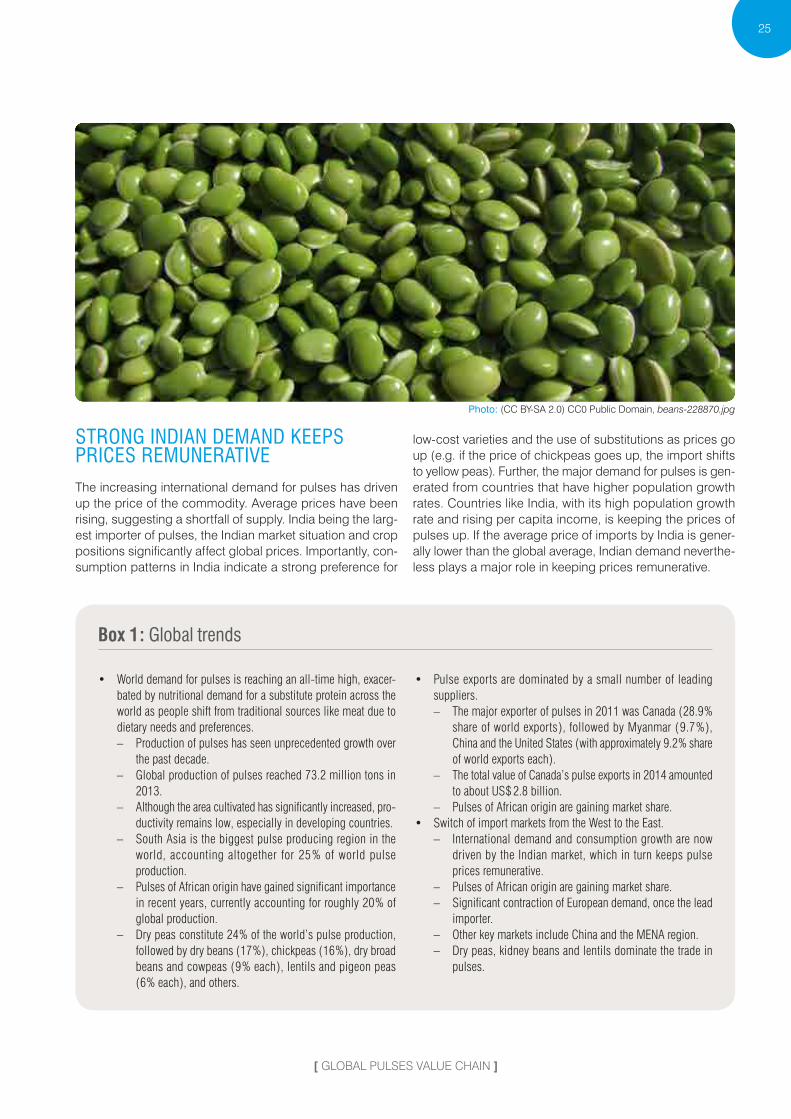
Photo: (CC BY-SA 2.0) CC0 Public Domain, beans-228870.Apg
[ GLOBAL PULSES VALUE CHAIN ]
25
stRong indian demand keeps pRiCes RemuneRatiVeThe increasing international demand for pulses has driven up the price of the commodity. Average prices have been rising, suggesting a shortfall of supply. India being the larg-est importer of pulses, the Indian market situation and crop positions significantly affect global prices. Importantly, con-sumption patterns in India indicate a strong preference for
low-cost varieties and the use of substitutions as prices go up ( e.g. if the price of chickpeas goes up, the import shifts to yellow peas ). Further, the major demand for pulses is gen-erated from countries that have higher population growth rates. Countries like India, with its high population growth rate and rising per capita income, is keeping the prices of pulses up. If the average price of imports by India is gener-ally lower than the global average, Indian demand neverthe-less plays a major role in keeping prices remunerative.
box 1 : global trends
• World demand for pulses is reaching an all-time high, exacer-bated by nutritional demand for a substitute protein across the world as people shift from traditional sources like meat due to dietary needs and preferences.
– Production of pulses has seen unprecedented growth over the past decade.
– Global production of pulses reached 73.2 million tons in 2013.
– Although the area cultivated has significantly increased, pro-ductivity remains low, especially in developing countries.
– South Asia is the biggest pulse producing region in the world, accounting altogether for 25 % of world pulse production.
– Pulses of African origin have gained significant importance in recent years, currently accounting for roughly 20 % of global production.
– Dry peas constitute 24 % of the world’s pulse production, followed by dry beans ( 17 % ), chickpeas ( 16 % ), dry broad beans and cowpeas ( 9 % each ), lentils and pigeon peas ( 6 % each ), and others.
• Pulse exports are dominated by a small number of leading suppliers.
– The major exporter of pulses in 2011 was Canada ( 28.9 % share of world exports ), followed by Myanmar ( 9.7 % ), China and the United States ( with approximately 9.2 % share of world exports each ).
– The total value of Canada’s pulse exports in 2014 amounted to about US $ 2.8 billion.
– Pulses of African origin are gaining market share.• Switch of import markets from the West to the East.
– International demand and consumption growth are now driven by the Indian market, which in turn keeps pulse prices remunerative.
– Pulses of African origin are gaining market share. – Significant contraction of European demand, once the lead
importer. – Other key markets include China and the MENA region. – Dry peas, kidney beans and lentils dominate the trade in
pulses.

Photo: Kiyo (CC BY-NC 2.0), Kidney Beans.Apg

an eVolVing Value Chain in need of suppoRt 4
box 2 : the sector’s socioeconomic importance to kenya
Endowed with over 569,000 square kilometres of land, Kenya boasts a wide range of ecological regions and plant life. The country straddles the equator, it enjoys areas of both temperate and tropical climate, and its 475 endemic plant species include a variety of pulses.*
Production of pulses began to increase following Kenya’s independ-ence. From 1960 to 1982, output more than doubled to 568,000 tons per year, due in large part to the growth of dry bean production.** Continuing to grow through 1993, production fell off in the mid-1990s. Nevertheless, growth has picked up again in recent years.
Today, pulses are an important food source for the Kenyan population due to their nutritional value, high protein content and relatively low cost when compared with meat.*** Pulses are gaining in popularity among farmers due to their hardiness and resistance to drought, which makes them ideal for Kenya, where rainfall is sporadic because it is governed by the erratic movement of the intertropical convergence zone.**** Further complicating the matter, weather has been particu-larly unpredictable in recent years due to climate change. This has led many farmers to abandon wheat production in favour of pulses, which mature quickly and can thrive with limited rainfall.*****
Figure 8 : Kenyan production of pulses, 1961–2013
275 370
450
700
482
758
0
200
400
600
800
1.000
1961 1971 1981 1991 2001 2013
Tons
, tho
usan
ds
Source : Food and Agriculture Organization of the United Nations ( 2015 ).
* Wambugu P.W. and Muthamia Z.K. (2009). Country Report on the State of Plant Genetic Resources for Food and Agriculture: Kenya, p. 19. Kenya Agricultural Research Institute; National Genebank of Kenya.
** Food and Agriculture Organization of the United Nations (2015). Statistics database. Available from http://faostat3.fao.org/download/T/*/E. Accessed 5 August 2015.
*** Katungi, E., Farrow. A., Chianu. J., Sperling. L., and Beebe. S. (2009). Common Bean in Eastern and Southern Africa: A Situation and Outlook Analysis. International Centre for Tropical Agriculture.
**** Pereira, Charles (1996). The role of agricultural research in the development of Kenya before independence. In Review of Kenyan Agricultural Research, Vol. 1, p. 9.
***** Njagi, Kagondu (2013). As wheat yields fall in Kenya, farmers turn to beans. Thomson Reuters Foundation, 25 April.
4.– Information source for the value chain – consultations and desk research, prominently using the following source : Dalipagic, Ian and Elepu, Dr. Gabriel ( 2014 ). Agricultural Value Chain Analysis in Northern Uganda : Maize, Rice, Groundnuts, Sunflower and Sesame. Action Against Hunger / ACF International.
28
[ KENYA Value Chain Roadmap foR pulSeS ]
A wide array of actors works together throughout the sector in order to produce and sell pulses on both domestic and international markets. Vertical business linkages tend to be undeveloped and informal.5 Trade is based on temporary relationships and most actors do not use contracts.
ReseaRCh and deVelopment
The pulses sector had historically received little attention from research and support institutions, which tended to focus more on crops such as maize. In recent years, in-stitutions including the Kenya Agricultural and Livestock Research Organization ( KALRO ), local universities, non-governmental organizations and other local research or-ganizations have begun to engage more with the sector, producing higher-yield crop varieties that cater to local conditions. Regional institutions such as the Association for Strengthening Agricultural Research in Eastern and Central Africa and its Eastern and Central Africa Bean Research Network have also played a role.
In the bean subsector, a number of disease- and pest-resistant varieties have been developed. KALRO, the International Crops Research Institute for the Semi-Arid Tropics ( ICRISAT ), the University of Nairobi and Winrock International meanwhile have developed a number of high-yielding varieties of pigeon pea that are adapted to local conditions and resistant to diseases. ICRISAT in particular has been actively promoting the use of enhanced pigeon pea varieties in Eastern province.
inputs
The value chain’s main inputs are labour and seeds, which are mainly domestic. Most farms use their own beans for seed or buy from local markets ; improved varieties are generally only used where there is Government or donor intervention. It is estimated that 75 % of cowpea seeds and 95 % of pigeon pea seeds come from farm retention or neighbouring households. Certified and improved seeds, where used, may come from local businesses supplied by the Kenya Seed Company Ltd ( cowpeas ) and ICRISAT ( pi-geon peas ), the latter of which contracts local farmers to generate the certified seeds.
Supplying certified pulse seeds is perceived as quite risky, as self-pollinated seeds can easily be retained and used to achieve similar yields.6 This limits greater devel-opment of the supply chain, which is further complicated by farmers’ reluctance to pay the high cost of certified seeds.7 Additionally, there is only a limited commercial mar-ket for minor crop seeds, making it difficult for suppliers
5.– Ibid. : p. 124.6.– Ibid, : p. 118.7.– Ibid, : p, 153.
to achieve economies of scale. Where there is a shortage of seed due to a poor harvest, supplies are either bought from neighbouring regions at markets or supplied by the Government or donors.8 Other inputs such as fertilizers, in-secticides and pesticides are only used by a small propor-tion of the sector’s farmers. Some farmers do use manure.
pRoduCtion
The next step in the value chain is production, which is undertaken on smallholder farms and characterized by ploughing, planting and weeding.9 Planting and harvesting are accomplished by manual labour, while oxen ploughs and hoes are often used in ploughing and weeding. Beans are grown during both the short and long rains periods ( September / December and February / June respectively ).10 Pigeon pea is planted at the beginning of the short rains.11 The short- and medium-duration varieties are harvested as fresh vegetable from February to April, while the long dura-tion variety is usually harvested as dry grain between August and September.
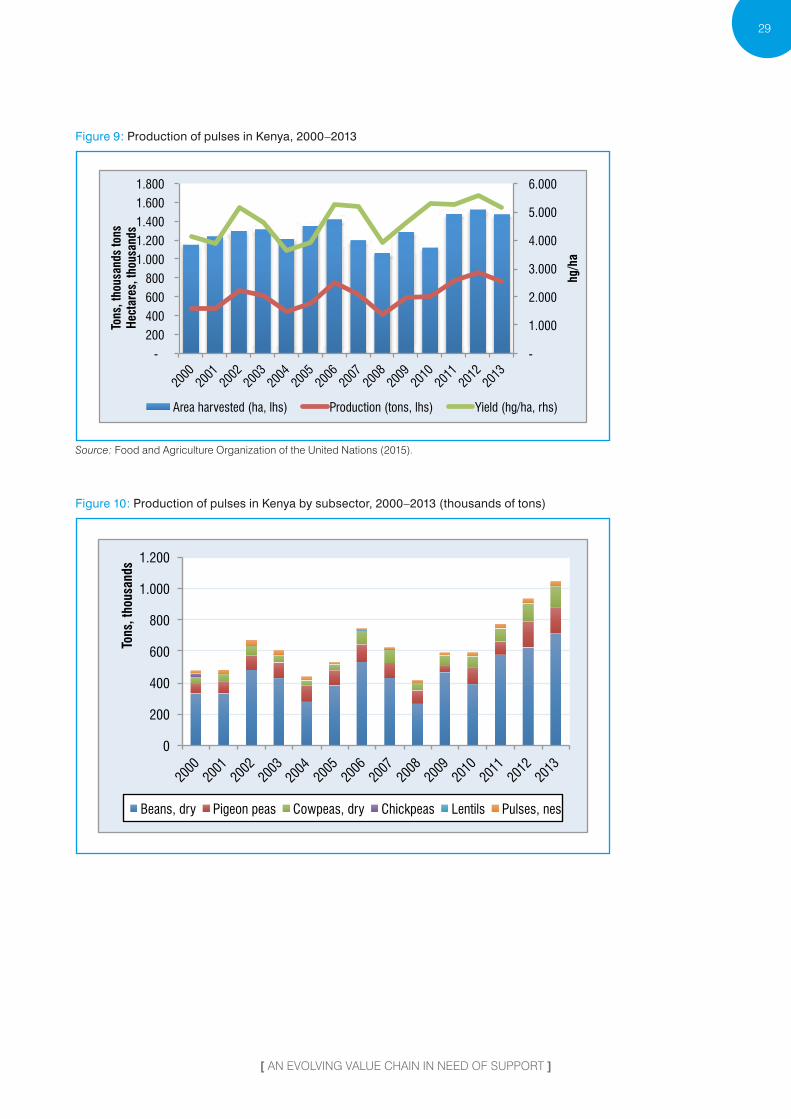
Kenyan farmers currently cultivate pulses on 1.47 million ha of land. All three metrics – area harvested, production volume, and yield – have grown between 2000 and 2013, despite periods of fluctuation.
According to the FAO, Kenya is the seventeenth top producer of pulses worldwide – and number four in Africa after Nigeria, the United Republic of Tanzania and Ethiopia – involving roughly 1.8 million households in the production of pulses in general. Kenyan farms produced more than 1 million tons of pulses in 2013, including dry beans ( 715,000 tons ), pigeon peas ( 166,000 tons ), and cowpeas ( 134,000 tons ). As illustrated in figure 10, production growth since the turn of the century ( 6.2 % CAGR from 2000 to 2013 ) has been driven largely by increased cultivation of dry beans, pigeon peas and cowpeas, which have grown by a CAGR of 6.1 %, 7.4 % and 10.1 % respectively over the past decade. The production of lentils, while small, has grown by 8.0 % per annum.
8.– Ibid. : p, 118.9.– Ibid. : p. 134.10.– Ibid. : p. 119.11.– Ibid. : p. 134.
[ AN EVOLVING VALUE CHAIN IN NEED OF SUPPORT ]
29
Figure 9 : Production of pulses in Kenya, 2000–2013
-
1.000
2.000
3.000
4.000
5.000
6.000
- 200 400 600 800
1.000 1.200 1.400 1.600 1.800
2000
20
01 20
02 20
03 20
04
2005
20
06 20
07 20
08 20
09 20
10 20
11 20
12 20
13
hg/h
a
Tons
, tho
usan
ds to
ns
Hect
ares
, tho
usan
ds
Area harvested (ha, lhs) Production (tons, lhs) Yield (hg/ha, rhs)
Source : Food and Agriculture Organization of the United Nations ( 2015 ).
Figure 10 : Production of pulses in Kenya by subsector, 2000–2013 ( thousands of tons )
0
200
400
600
800
1.000
1.200
2000
20
01
2002
20
03
2004
20
05
2006
20
07
2008
20
09
2010
20
11
2012
20
13
Tons
, tho
usan
ds
Beans, dry Pigeon peas Cowpeas, dry Chickpeas Lentils Pulses, nes
30
[ KENYA Value Chain Roadmap foR pulSeS ]
0
200
400
600
800
1.000
2000
20
01
2002
20
03
2004
20
05
2006
20
07
2008
20
09
2010
20
11
2012
20
13
Tons
, tho
usan
ds
Beans, dry Chick peas Cow peas, dry Pigeon peas Lentils Pulses, nes
Source : Food and Agriculture Organization of the United Nations ( 2015 ).
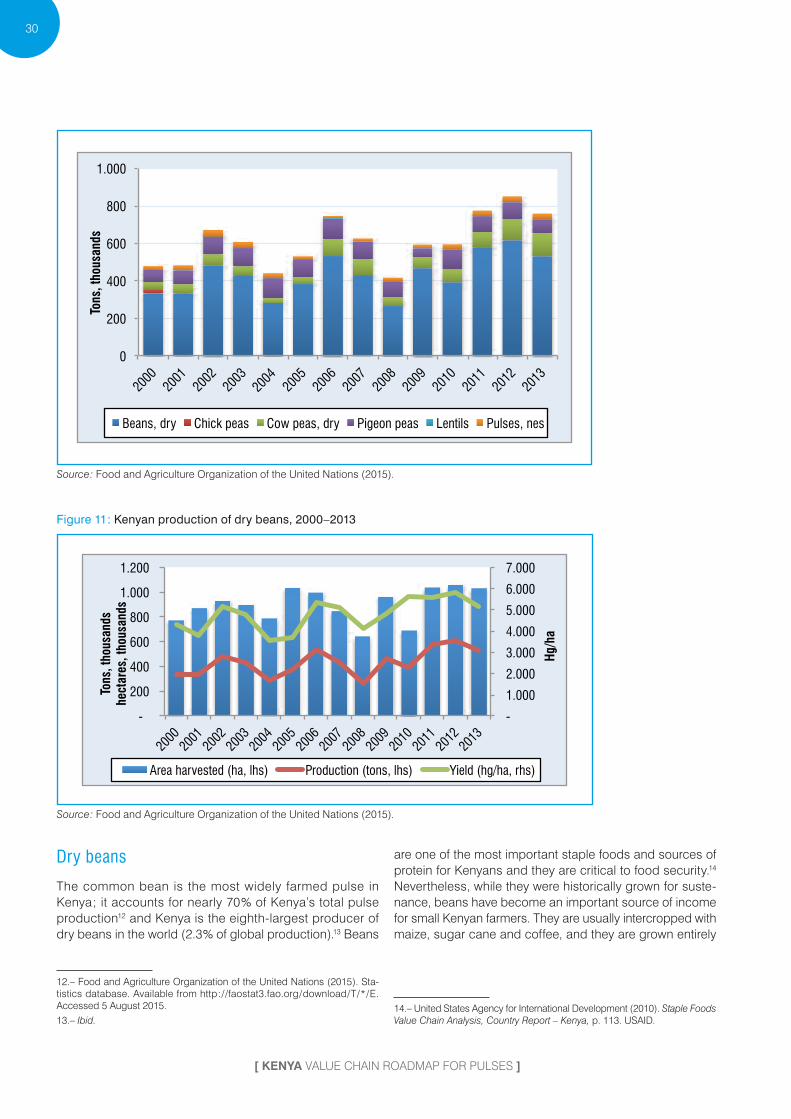
Figure 11 : Kenyan production of dry beans, 2000–2013
-
1.000
2.000
3.000
4.000
5.000
6.000
7.000
-
200
400
600
800
1.000
1.200
2000
20
01 20
02 20
03 20
04 20
05 20
06 20
07 20
08 20
09 20
10 20
11 20
12 20
13
Hg/h
a
Tons
, tho
usan
ds
hect
ares
, tho
usan
ds
Area harvested (ha, lhs) Production (tons, lhs) Yield (hg/ha, rhs)
Source : Food and Agriculture Organization of the United Nations ( 2015 ).
dry beans
The common bean is the most widely farmed pulse in Kenya ; it accounts for nearly 70 % of Kenya’s total pulse production12 and Kenya is the eighth-largest producer of dry beans in the world ( 2.3 % of global production ).13 Beans
12.– Food and Agriculture Organization of the United Nations ( 2015 ). Sta-tistics database. Available from http : / /faostat3.fao.org / download / T / * / E. Accessed 5 August 2015.13.– Ibid.
are one of the most important staple foods and sources of protein for Kenyans and they are critical to food security.14 Nevertheless, while they were historically grown for suste-nance, beans have become an important source of income for small Kenyan farmers. They are usually intercropped with maize, sugar cane and coffee, and they are grown entirely
14.– United States Agency for International Development ( 2010 ). Staple Foods Value Chain Analysis, Country Report – Kenya, p. 113. USAID.
[ AN EVOLVING VALUE CHAIN IN NEED OF SUPPORT ]
31
by smallholder farmers.15 Roughly 1.5 million households are engaged in bean cultivation.
Farmers cultivated dry beans on over 1 million ha in 2013, up from 770,000 in 2000.16 Dry beans are produced mainly in the Rift Valley ( 33 % ), Eastern province ( 24 % ), Nyanza ( 185 ), Western province ( 12 % ) and Central province ( 12 % ).17 While production has been unsteady due to reliance on the variable rainfall, consumption has been growing in double digits since the turn of the century. As such, Kenya often imports beans in order to fill the deficit and meet do-mestic demand. It should also be noted that while yields have improved by 20 % since 2000, they are still well below the levels achieved throughout the rest of the world ( 2013 : 7,850 hectograms ( hg ) / ha ).18
Cowpeas
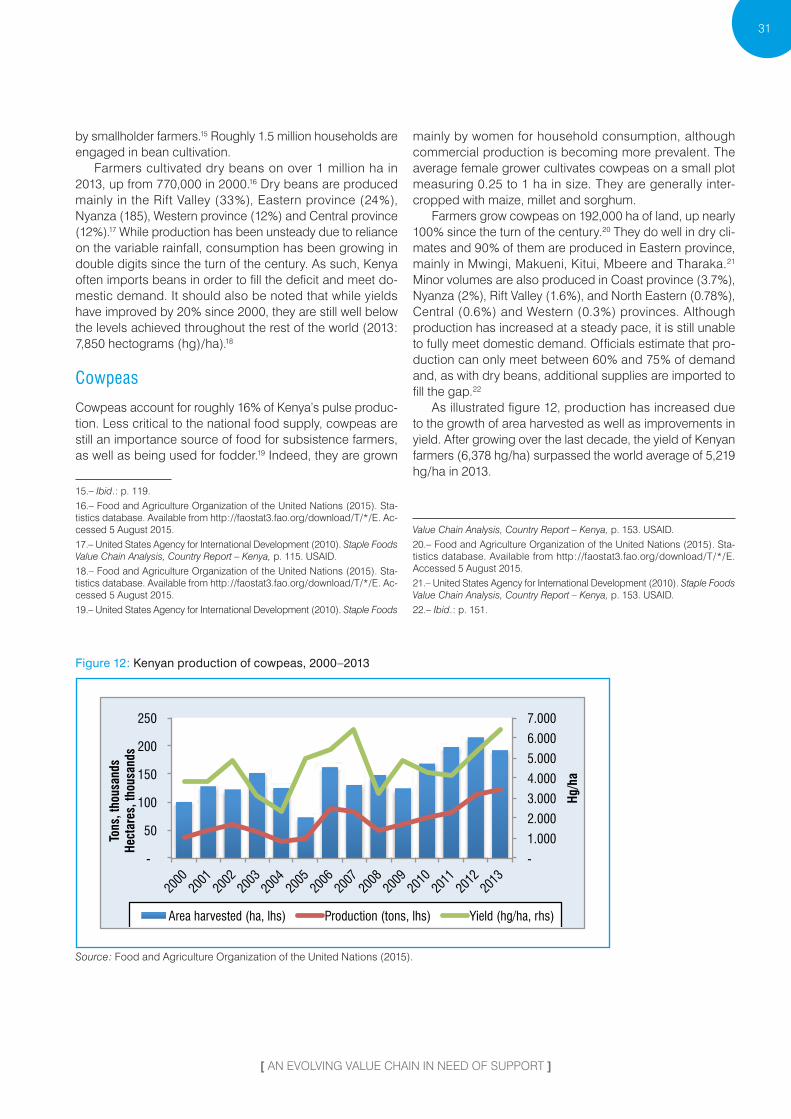
Cowpeas account for roughly 16 % of Kenya’s pulse produc-tion. Less critical to the national food supply, cowpeas are still an importance source of food for subsistence farmers, as well as being used for fodder.19 Indeed, they are grown
15.– Ibid. : p. 119.16.– Food and Agriculture Organization of the United Nations ( 2015 ). Sta-tistics database. Available from http : / /faostat3.fao.org / download / T / * / E. Ac-cessed 5 August 2015.17.– United States Agency for International Development ( 2010 ). Staple Foods Value Chain Analysis, Country Report – Kenya, p. 115. USAID.18.– Food and Agriculture Organization of the United Nations ( 2015 ). Sta-tistics database. Available from http : / /faostat3.fao.org / download / T / * / E. Ac-cessed 5 August 2015.19.– United States Agency for International Development ( 2010 ). Staple Foods
mainly by women for household consumption, although commercial production is becoming more prevalent. The average female grower cultivates cowpeas on a small plot measuring 0.25 to 1 ha in size. They are generally inter-cropped with maize, millet and sorghum.
Farmers grow cowpeas on 192,000 ha of land, up nearly 100 % since the turn of the century.20 They do well in dry cli-mates and 90 % of them are produced in Eastern province, mainly in Mwingi, Makueni, Kitui, Mbeere and Tharaka.21 Minor volumes are also produced in Coast province ( 3.7 % ), Nyanza ( 2 % ), Rift Valley ( 1.6 % ), and North Eastern ( 0.78 % ), Central ( 0.6 % ) and Western ( 0.3 % ) provinces. Although production has increased at a steady pace, it is still unable to fully meet domestic demand. Officials estimate that pro-duction can only meet between 60 % and 75 % of demand and, as with dry beans, additional supplies are imported to fill the gap.22
As illustrated figure 12, production has increased due to the growth of area harvested as well as improvements in yield. After growing over the last decade, the yield of Kenyan farmers ( 6,378 hg / ha ) surpassed the world average of 5,219 hg / ha in 2013.
Value Chain Analysis, Country Report – Kenya, p. 153. USAID.20.– Food and Agriculture Organization of the United Nations ( 2015 ). Sta-tistics database. Available from http : / /faostat3.fao.org / download / T / * / E. Accessed 5 August 2015.21.– United States Agency for International Development ( 2010 ). Staple Foods Value Chain Analysis, Country Report – Kenya, p. 153. USAID.22.– Ibid. : p. 151.
Figure 12 : Kenyan production of cowpeas, 2000–2013
-
1.000
2.000
3.000
4.000
5.000
6.000
7.000
-
50
100
150
200
250
2000
20
01 20
02 20
03 20
04
2005
20
06 20
07 20
08 20
09 20
10 20
11 20
12 20
13
Hg/h
a
Tons
, tho
usan
ds
Hect
ares
, tho
usan
ds
Area harvested (ha, lhs) Production (tons, lhs) Yield (hg/ha, rhs)
Source : Food and Agriculture Organization of the United Nations ( 2015 ).

32
[ KENYA Value Chain Roadmap foR pulSeS ]
Figure 13 : Kenyan production of pigeon peas, 2000–2013
- 1.000 2.000 3.000 4.000 5.000 6.000 7.000
-
50
100
150
200
250
2000
20
01 20
02 20
03 20
04 20
05 20
06 20
07 20
08 20
09 20
10 20
11 20
12 20
13
Hg/h
a
Tons
, tho
usan
ds
Hect
ares
, tho
usan
ds
Area harvested (ha, lhs) Production (tons, lhs) Yield (hg/ha, rhs)
Source : Food and Agriculture Organization of the United Nations ( 2015 ).
pigeon peas
Pigeon peas accounted for 9.7 % of total pulse production in 2013.23 The peas are rich in protein and can be eaten fresh or dry ; the leaves and hulls can be used to feed livestock ; and the stems can be used for firewood.24 In addition, pi-geon peas are able to fix atmospheric nitrogen into the soil, especially pertinent given that soils in semi-arid regions tend to be deficient in nitrogen.
Pigeon peas are grown by smallholder farms ranging in size from 0.2 to 1.4 ha for both sustenance and income.25 It has been estimated that they are cultivated by up to 100 % of farming families in certain areas, and roughly two-thirds of these sell a portion of their produce. They are intercropped with both grains and other legumes such as beans, green gram and cowpeas. All varieties of pigeon pea are grown in Kenya, including those of short ( 100–120 days to mature with determinate growth habit ), medium ( 150–200 days with indeterminate growth habit ) and long duration ( more than 200 days with indeterminate growth habit ) maturities.
Pigeon peas are cultivated on 144,000 ha of land.26 This is a decline of 16 % from the area under cultivation in 2000. They are grown in arid and semi-arid climates, and 99 % of Kenyan cultivation occurs in Eastern province,27 with 80 %
23.– Food and Agriculture Organization of the United Nations ( 2015 ). Sta-tistics database. Available from http : / /faostat3.fao.org / download / T / * / E. Ac-cessed 5 August 2015.24.– United States Agency for International Development ( 2010 ). Staple Foods Value Chain Analysis, Country Report – Kenya, p. 126. USAID.25.– Ibid. : p. 127.26.– Food and Agriculture Organization of the United Nations ( 2015 ). Sta-tistics database. Available from http : / /faostat3.fao.org / download / T / * / E. Ac-cessed 5 August 2015.27.– United States Agency for International Development ( 2010 ). Staple Foods Value Chain Analysis, Country Report – Kenya, p. 128. USAID.
concentrated in Machakos ( 33 % of national production ), Makueni ( 25 % ) and Kitui ( 22 % ).
Despite a decline in area under cultivation between 2000 and 2013, production has increased by 12 % over the same period due to a 33 % increase in yield.28 Even so, and despite these improvements, yields remain well below the world av-erage of 7,509 hg / ha in 2013.
Chickpeas
At 25 %, chickpeas have the highest protein content of any pulse.29 Nevertheless, they are a relatively less important crop in Kenya, accounting for only 0.01 % of total pulse pro-duction. They are grown in the same areas as cowpeas and pigeon peas ( Eastern province ).30
ColleCtion and distRiBution
Once harvested, the majority of pulse crops are retained for consumption at home or sold to other households or locally at markets. The remainder is sold to both local and regional wholesalers, assemblers, brokers, agents and traders. While similar, each of the three main subsectors is characterized by slightly different distribution mechanisms in which the goods are assembled and sold throughout wholesale and retail channels.
28.– Food and Agriculture Organization of the United Nations ( 2015 ). Sta-tistics database. Available from http : / /faostat3.fao.org / download / T / * / E. Ac-cessed 5 August 2015.29.– United States Agency for International Development ( 2010 ). Staple Foods Value Chain Analysis, Country Report – Kenya, p. 157. USAID.30.– Ibid. : p. 158.

Photo: (CC BY-SA 2.0) CIAT (CC BY-SA 2.0), bean market5.Apg
[ AN EVOLVING VALUE CHAIN IN NEED OF SUPPORT ]
33
dry beans
It is estimated that 60 % of the beans produced are con-sumed by the household and the remaining 40 % are sold.31 While some are sold directly by the producers to wholesal-ers, retailers and households, beans are also consolidated by farm gate agents ( either farmers or local traders ) and regional traders who transport the goods to traders and wholesalers in urban centres. Wholesalers include both in-dividuals and institutions such as the National Cereals and Produce Board, and they tend to be present at multiple lev-els of the value chain. Most wholesalers do not operate full-time, instead engaging in parallel activities or moving away from beans during off-seasons. Wholesalers sell the goods to domestic retailers while also engaging in export. Retailing meanwhile is conducted by local traders in markets and shops. Mixed wholesaling and retailing is quite common.
pigeon peas
Pigeon peas can be sold as fresh vegetables, dry grain or dhal. Roughly 60 % of the crop is used for dry grain while 40 % is used as a vegetable.32 While 62 % of dry grain
31.– Ibid. : p. 12032.– Ibid. : p. 135.
harvests are sold, that percentage falls to only 10 % for vege-table peas. The high level of household consumption is due to pigeon peas’ relative sweetness and cheapness when compared to alternatives, as well as the fact that they are harvested during times of staple food shortage.
Most farmers sell dry grain at farm gates, distributing pigeon peas to rural wholesalers, rural assemblers, rural open-air retailers, rural retail shopkeepers, and directly to rural consumers and farmers.33 The rural assemblers, in turn, sell the peas to rural retailers and wholesalers. Rural wholesalers sell to rural open-air markets, urban wholesalers and urban exporters / processors. Urban wholesalers and processors sell to urban supermarkets, open-air retailers and retail shopkeepers, who in turn sell the goods to urban consumers. Lastly, exporters add value through processing such as the production of dhal before selling their goods on foreign markets, namely to India and Europe.34
Vegetable pigeon peas meanwhile are typically pur-chased by rural assemblers / brokers who buy and bulk peas in the pod before selling them to rural open-air retailers, ru-ral wholesalers, urban wholesalers and urban exporters.35 It should be noted that farmers do sell the peas directly to rural open-air retailers, rural consumers, rural wholesalers and urban exporters. Urban exporters are considered to be a very important outlet for farmers because they often purchase vegetable pigeon peas directly from the produc-ers. Exporters generally collect peas at designated points throughout the week according to flight schedules. Physical attributes are tested and pesticide residue tests may be performed if required. Fresh vegetable exports depend on close collaboration and planning between farmers and ex-port agents.
Cowpeas
Cowpeas are grown as both grain and vegetable.36 The majority of green vegetable is consumed at home, while up to 70 % of dried grain is sold to rural assemblers / bro-kers / wholesalers at local markets and farm gates, and to rural consumers, open-air retailers and shopkeepers. Regional brokers and wholesalers may sell the goods to posho mill processors in urban areas, to urban wholesal-ers, or directly to urban retail shopkeepers. Local traders meanwhile sell to either rural posho mill processors or urban wholesalers. Urban posho mill processors sell to both urban supermarkets and regional markets, while rural processors sell to rural retail shops and local household consumers. Urban wholesalers sell to urban retail shopkeepers and ur-ban supermarkets, who in turn sell to the final consumers.
33.– Ibid. : p. 137.34.– Shiferaw B. and others ( 2008 ). Unlocking the Potential oA High-Value Legumes in the Semi-Arid Regions : Analyses oA the Pigeonpea Value Chains in Kenya, p. 17. Nairobi, Kenya : International Crops Research Institute for the Semi-Arid Tropics.35.– Ibid. : p. 140.36.– Ibid. : p. 154.

34
[ KENYA Value Chain Roadmap foR pulSeS ]
Figure 14 : Current value chain
Nat
iona
l com
pone
nt o
f the
val
ue c
hain
Nat
iona
l mar
ket
Food
Saf
ety
and
qual
ity r
egul
atio
ns :
Ken
ya B
urea
u of
Sta
ndar
ds, K
AR
I., W
eigh
ts a
nd M
easu
res
Dep
t., G
over
nmen
t Che
mis
t’s D
ept.,
Dep
t. of
Vet
erin
ary
Ser
vice
s, K
enya
Dai
ry B
oard
, Hor
ticul
tura
l Cro
ps D
evel
opm
ent A
utho
riy
/ K
RA
Cou
nty
Gov
ernm
ent /
Min
istr
y of
Agr
icul
ture
, Liv
esto
ck a
nd F
ishe
ries
/ M
inis
try
of In
dust
rial
izat
ion
and
Ente
rpri
se D
evel
opm
ent
SP
S S
ervi
ces,
See
d C
ertif
icat
ion,
Ana
lytic
al C
hem
ical
Lab
orat
ory:
Ken
ya P
lant
Hea
lth In
spec
tora
te S
ervi
ce (
KEP
HIS
)
Sup
port
ser
vice
s
Res
earc
h an
d de
velo
pmen
t
Min
istr
y of
Hea
lth –
Dep
artm
ent o
f Pub
lic H
ealth
Inpu
ts
See
ds
Che
mic
al fe
rtili
zers
(i
n sm
all p
ropo
rtio
n)
Farm
equ
ipm
ent
Labo
ur
(qua
lifie
d/te
chni
cal)
Land
Wat
er
Pest
icid
e an
d in
sect
icid
e (i
n sm
all p
ropo
rtio
n)
Ass
embl
y/bu
lkin
g
Loca
l who
lesa
lers
Reg
iona
l w
hole
sale
rs
Ass
embl
ers
Inte
rmed
iate
tr
ader
s
Bul
king
age
nts
Trad
ers
Pro
cess
ing
Pige
on p
ea (
Nai
robi
, M
omba
sa)
De-
hulli
ng
Spl
ittin
g
Cle
anin
g S
ortin
g
Inte
rnat
iona
l tr
ansp
orte
r
Man
ure
(les
s th
an
25%
of f
arm
ers)
Dry
gra
in c
owpe
as
Rur
al p
osho
mill
pr
oces
sors
Urb
an p
osho
mill
P
roce
ssor
s
Bea
ns
Loca
l mar
kets
60%
hou
seho
ld r
eten
tion
Pige
on p
ea
ICR
ISA
T/K
ALR
O
Uni
vers
ities
Indi
a
Uni
ted
Ara
b Em
irat
es
Sou
th A
fric
a
Cow
peas
Non
-gov
ernm
enta
l org
aniz
atio
ns
East
ern
and
Cen
tral
Afr
ica
Bea
n R
esea
rch
Net
wor
k
Mar
ket p
rice
info
rmat
ion
: EP
C/K
ENin
vest
Fina
ncia
l ser
vice
s in
clud
ing
form
al (
bank
s) a
nd in
form
al le
ndin
g so
urce
s
Exte
nsio
n se
rvic
es
Inst
itutio
ns
Who
lesa
ling
Pri
vate
w
hole
sale
rs
Nat
iona
l C
erea
ls a
nd
Pro
duce
B
oard
30%
hou
seho
ld r
eten
tion
Loca
l mar
kets
(s
choo
ls/h
ospi
tals
)
Urb
an s
uper
mar
kets
Rur
al/u
rban
ret
ail
shop
keep
ers
Sm
all l
ocal
/reg
iona
l tr
ader
s
hous
ehol
d re
tent
ion
Urb
an s
uper
mar
kets
(dr
y, d
hal)
Urb
an
cons
umer
sU
rban
ope
n ai
r re
taile
rs
(veg
etab
le a
nd d
ry)
Urb
an r
etai
ler
shop
keep
ers
(dry
, dha
l)
Lege
nd
Nat
iona
l com
pone
ntIn
tern
atio
nal c
ompo
nent
East
ern
Afr
ica
Gra
in C
ounc
il
Rur
al o
pen-
air
Rur
al r
etai
l sho
p
Chi
ckpe
as &
Nav
y be
an s
ub-s
ecto
rs a
re u
nder
deve
lope
d bu
t with
hig
h po
tent
ial
Exte
rnal
com
petit
ion
Uni
ted
Sta
tes
Uga
nda
Uni
ted
Rep
ublic
of
Tan
zani
a
Can
ada
Paki
stan
EAC
Indo
nesi
a
US
D 5
8 m
illio
nM
ainl
y ki
dney
be
an a
nd
whi
te p
ea
bean
Polis
hing
Pack
agin
g
Impo
rt: 7
8,60
0 to
ns
- ki
dney
bea
ns,
- w
hite
pea
bea
ns-
dry
peas
Uga
nda
(46.
8 %
)U
nite
d S
tate
s
(30.
6 %
)U
nite
d R
epub
lic
of T
anza
nia
(14.
5%)
Ethi
opia
Pro
duct
ion:
smal
lhol
der
farm
s D
ry b
eans
529
kt
cow
peas
122
kt
Pige
on p
eas
73 k
t
17t
h gl
obal
ly
1.8
mill
ion
hous
ehol
ds
1.4
mill
ion
Ha
Plo
ughi
ng
Pla
ntin
g
Wee
ding
Spr
ayin
g
Har
vest
ing
Dry
ing
Bag
ging
Rec
ord
keep
ing
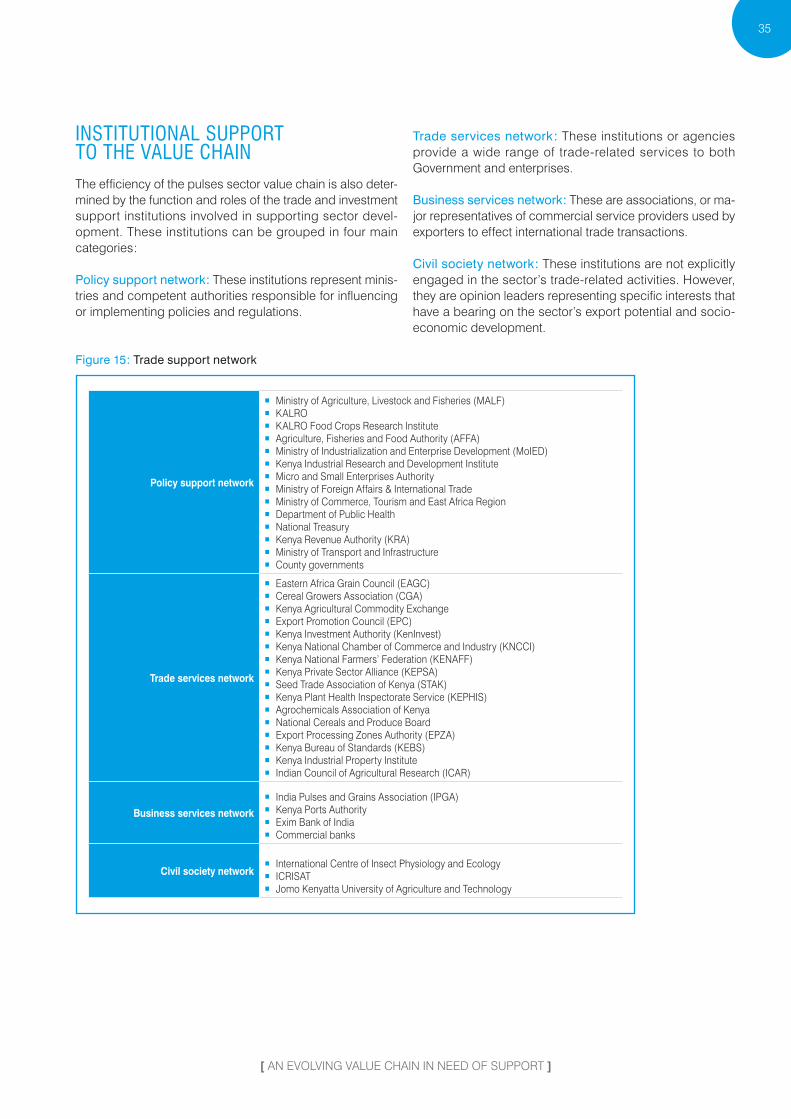
[ AN EVOLVING VALUE CHAIN IN NEED OF SUPPORT ]
35
institutional suppoRt to the Value ChainThe efficiency of the pulses sector value chain is also deter-mined by the function and roles of the trade and investment support institutions involved in supporting sector devel-opment. These institutions can be grouped in four main categories :
Policy support network : These institutions represent minis-tries and competent authorities responsible for influencing or implementing policies and regulations.
Trade services network : These institutions or agencies provide a wide range of trade-related services to both Government and enterprises.
Business services network : These are associations, or ma-jor representatives of commercial service providers used by exporters to effect international trade transactions.
Civil society network : These institutions are not explicitly engaged in the sector’s trade-related activities. However, they are opinion leaders representing specific interests that have a bearing on the sector’s export potential and socio-economic development.
Figure 15 : Trade support network
Policy support network
� Ministry of Agriculture, Livestock and Fisheries ( MALF ) � KALRO � KALRO Food Crops Research Institute � Agriculture, Fisheries and Food Authority ( AFFA ) � Ministry of Industrialization and Enterprise Development ( MoIED ) � Kenya Industrial Research and Development Institute � Micro and Small Enterprises Authority � Ministry of Foreign Affairs & International Trade � Ministry of Commerce, Tourism and East Africa Region � Department of Public Health � National Treasury � Kenya Revenue Authority ( KRA ) � Ministry of Transport and Infrastructure � County governments
Trade services network
� Eastern Africa Grain Council ( EAGC ) � Cereal Growers Association ( CGA ) � Kenya Agricultural Commodity Exchange � Export Promotion Council ( EPC ) � Kenya Investment Authority ( KenInvest ) � Kenya National Chamber of Commerce and Industry ( KNCCI ) � Kenya National Farmers’ Federation ( KENAFF ) � Kenya Private Sector Alliance ( KEPSA ) � Seed Trade Association of Kenya ( STAK ) � Kenya Plant Health Inspectorate Service ( KEPHIS ) � Agrochemicals Association of Kenya � National Cereals and Produce Board � Export Processing Zones Authority ( EPZA ) � Kenya Bureau of Standards ( KEBS ) � Kenya Industrial Property Institute � Indian Council of Agricultural Research ( ICAR )
Business services network
� India Pulses and Grains Association ( IPGA ) � Kenya Ports Authority � Exim Bank of India � Commercial banks
Civil society network � International Centre of Insect Physiology and Ecology � ICRISAT � Jomo Kenyatta University of Agriculture and Technology
36
[ KENYA Value Chain Roadmap foR pulSeS ]
poliCy suppoRt netwoRk
MALF is responsible for formulating, implementing and monitoring agricultural legislation, regulations and policies. It is the institution responsible for regulation and quality con-trol of inputs, produce and products from the agricultural sector, and is in charge of managing and controlling pests and diseases. The Ministry is also tasked with supporting agricultural research and promoting technology delivery as well as collecting, maintaining and managing information on the agricultural sector.
� KALRO, a corporate body under the aegis of MALF, was created to establish a suitable legal and institutional framework for coordination of agricultural research.
� AFFA, a state corporation, is the successor of former regulatory institutions in the sector that were merged into Directorates under the Authority, including a Food Crops Directorate.
MoIED is responsible for the promotion of industrialization and enterprise development in Kenya. This Ministry is tasked with the formulation and implementation of industrializa-tion and cooperative policy, implementation of the indus-trial property rights regime, and elaboration of private sector development policy and strategy. Quality control, includ-ing industrial standards development, also falls under the competence of this Ministry.
� Under the aegis of MoIED, the Kenya Industrial Research and Development Institute was established as a multi-disciplinary institution to undertake industrial research, technology and innovation, and disseminate findings that will have a positive impact on national development.
� The Micro and Small Enterprises Authority is a state corporation established for the promotion, development and regulation of the micro and small enterprise sector in Kenya. Its mandate is to formulate and review policies and programmes for the sector.
In addition to managing Kenya’s foreign policy and inter-national trade affairs, the Ministry of Foreign Affairs and International Trade manages Kenya’s missions and embas-sies abroad as well as joint commissions and joint trade committees with other countries. The Ministry also has a trade representative function.
The Department of Public Health under the Ministry of Health is tasked with overall responsibility for food safety in Kenya.
In addition to its main function of formulating financial and economic policies, the National Treasury is also re-sponsible for developing and maintaining sound fiscal and monetary policies that facilitate socioeconomic develop-ment. The Treasury therefore plays a key role in creating an enabling environment in which economic sectors can oper-ate effectively and efficiently. The Treasury also regulates the financial sector on which all other sectors depend for investment resources.
The core mandate of the KRA is to assess, collect and en-force laws relating to revenue. The Authority also promotes compliance with Kenya’s tax, trade and border legislation and regulations.
The Ministry of Transport and Infrastructure is respon-sible for roads development policy management, and mari-time and rail transport management. The Ministry has two departments, namely the State Department of Transport and the State Department of Infrastructure.
County governments will be instrumental in supporting the Supporting Indian Trade and Investment in Africa ( SITA ) Initiative as they oversee at county level agricultural matters, including crops, and plant and animal disease control, as well as trade development and regulation, including market regulations, trade licences and cooperative societies. There are 47 counties in Kenya, which are geographical units en-visioned by the 2010 Constitution of Kenya as the units of devolved government.
tRade seRViCes netwoRk
EAGC is a membership-based organization offering de-tailed market information services to its members. The Council is charged with developing and promoting a struc-tured grain trading system in East Africa. It also strives to improve the policy and trading environment in the region with respect to the grain trade, strengthening market con-nections and reducing constraints along the value chain. The Eastern Africa Grain Institute was launched in 2012 as a specialized division of EAGC to institutionalize capacity-building interventions. The Institute operates as a strategic business unit offering practical grain post-production and marketing courses for a fee.
CGA is a national member-based farmers’ organization whose mission is to bring small and large commercial cereal farmers together in addressing industry challenges in Kenya. CGA works with industry stakeholders such as agricultural input suppliers, financial institutions, insurance companies, output buyers, development partners, non-governmental organizations and others to provide services to its members.
The EPC is tasked with coordinating and harmonizing export development and promotion activities in the country, providing leadership to all national export programmes. EPC is the focal point for export development and promotion ac-tivities in the country.
KenInvest is a statutory body established with the main objective of promoting investments in Kenya. It is respon-sible for facilitating the implementation of new investment projects, providing aftercare services for new and existing investments, and organizing investment promotion activi-ties both locally and internationally. The core functions of KenInvest include policy advocacy, investment promotion and investment facilitation.
KNCCI is a non-profit, autonomous, private sector in-stitution and membership-based organization. KNCCI

[ AN EVOLVING VALUE CHAIN IN NEED OF SUPPORT ]
37
promotes, protects and develops the commercial, indus-trial and investment interests of its members. The Chamber also aims at influencing development policies, strategies and support measures so as to achieve the best economic climate for the business community’s varied interests.
KENAFF is a non-political, non-profit, member-based umbrella organization of all farmers in Kenya. It represents their interests with the objective of articulating issues affect-ing them through focused lobbying and advocacy, targeted capacity-building, and promotion of sector stakeholders’ cohesiveness in dispensing and progressive uptake of agri-cultural innovations for enhancing the socioeconomic status of farmers.
KEPSA, a limited liability membership organization, is the private sector apex and umbrella body set up to bring to-gether the business community in a single voice to engage and influence public policy for an enabling business environ-ment. KEPSA is a key player in championing the interests of the Kenyan business community in trade, investment and industrial relations.
STAK was formed to represent the interests of the seed sector and to promote the development of formal seed trade. STAK is an organization of seed companies which are registered by KEPHIS to produce, process and / or mar-ket seeds in Kenya, including service providers in the seed industry.
KEPHIS is the Government parastatal whose respon-sibility is to assure the quality of agricultural inputs and produce to prevent adverse impacts on the economy, the environment and human health. Its mission is ‘to provide a science-based regulatory service by assuring the quality of agricultural inputs and produce to promote food security and sustainable development.’
The Agrochemicals Association of Kenya is the na-tional representative of the international agrochemical in-dustry represented worldwide by CropLife International ( formerly International Group of National Associations of Manufacturers of Agrochemical Products ). This member-ship-based association is the umbrella organization in Kenya for manufacturers, formulators, repackers, import-ers, distributors, farmers and users of pest control prod-ucts ( pesticides ). Its objectives include promoting public education on the safe use of pesticides and working with the Government towards the regulation and importation of pesticides into the country and exports out of the country.
The National Cereals and Produce Board procures, manages and distributes the country’s strategic grain re-serves and famine relief stocks. It undertakes market sta-bilization of grain through various interventions and trades commercially in grains and related products. Additionally, it distributes farm inputs ( fertilizers ) at subsidized prices to enhance agricultural productivity.
EPZA is a state corporation under MoIED. The Authority is responsible for the development of Export Processing Zones ( EPZs ), including the provision of advice on the removal of impediments to, and creation of incentives for,
export-oriented production in EPZs. EPZA is also responsi-ble for the regulation and administration of approved activi-ties within EPZs.
KEBS is the Government agency responsible for govern-ing and maintaining the standards and practices of metrol-ogy in Kenya. The KEBS Board of Directors is known as the National Standards Council and is the policymaking body for supervising and controlling the administration and finan-cial management of the Bureau.
The Kenya Industrial Property Institute is a parastatal under MoIED. Its functions encompass the administration of industrial property rights, the provision of technological information to the public, and the provision of training on industrial property.
ICAR is an autonomous organization under the Depart-ment of Agricultural Research and Education, Ministry of Agriculture and Farmers Welfare, Government of India. The Council is the apex body for coordinating, guiding and managing research and education in agriculture in the entire country.
Business seRViCes netwoRk
The Kenya Ports Authority is a state corporation under the Ministry of Transport and Infrastructure, with the responsibil-ity to facilitate and promote global maritime trade through provision of competitive port services.
IPGA is the apex organization of import and export trad-ers of pulses and grains in India. It acts as a facilitator for the pulses trade in India on behalf of its 400 members and pivotal associations who represent a cross-section of over 10,000 stakeholders in the supply chain.
The Exim Bank of India provides financial assistance for Indian exports, Indian imports, pre-shipment credit, and promoting India’s foreign trade.
CiVil soCiety netwoRk
ICRISAT is a non-profit, non-political organization that con-ducts agricultural research for development in Asia and sub-Saharan Africa with a wide array of partners throughout the world. The Institute works towards increasing dryland farmers’ crop productivity and incomes, while improving the resilience of their lands and livelihoods, by applying scien-tific innovations backed up with adequate policy, marketing and other support services. ICRISAT mandate crops include chickpeas and pigeon peas.
The Jomo Kenyatta University of Agriculture and Technology offers training, research and innovation in the fields of agriculture, engineering, technology, enterprise de-velopment, built environment, health sciences, social sci-ences and other applied sciences.
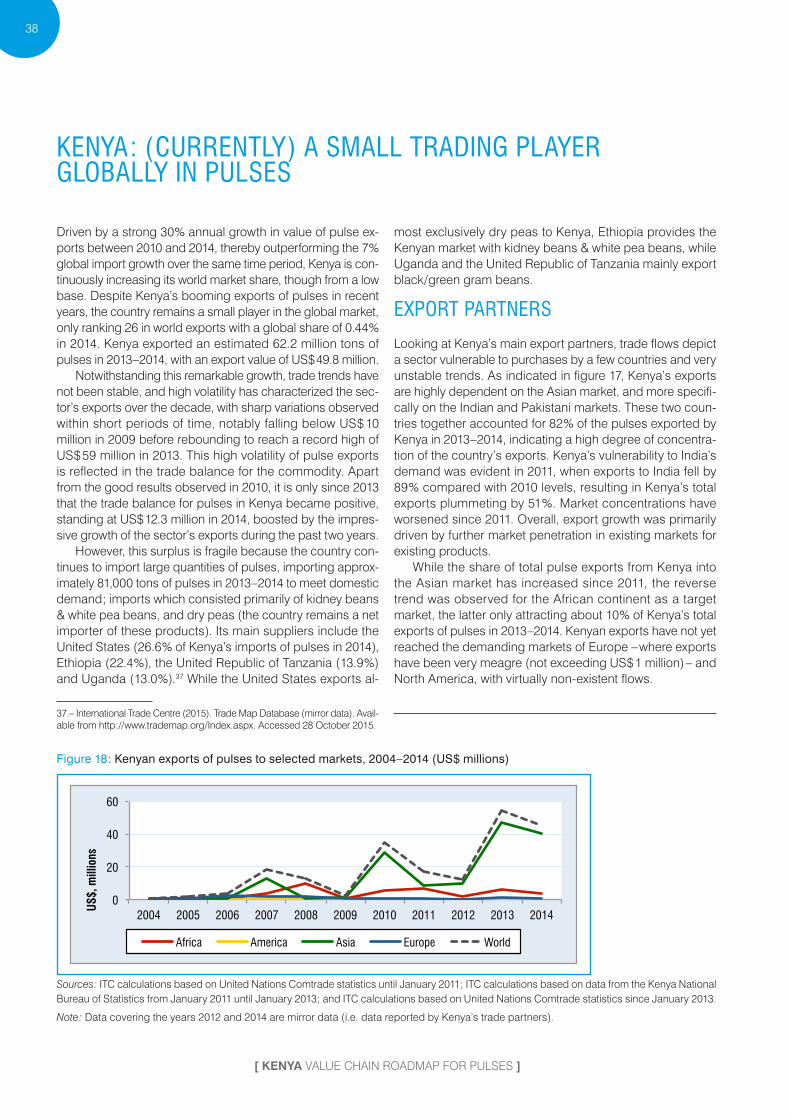
38
[ KENYA Value Chain Roadmap foR pulSeS ]
kenya : ( CuRRently ) a small tRading playeR gloBally in pulses
Driven by a strong 30 % annual growth in value of pulse ex-ports between 2010 and 2014, thereby outperforming the 7 % global import growth over the same time period, Kenya is con-tinuously increasing its world market share, though from a low base. Despite Kenya’s booming exports of pulses in recent years, the country remains a small player in the global market, only ranking 26 in world exports with a global share of 0.44 % in 2014. Kenya exported an estimated 62.2 million tons of pulses in 2013–2014, with an export value of US $ 49.8 million.
Notwithstanding this remarkable growth, trade trends have not been stable, and high volatility has characterized the sec-tor’s exports over the decade, with sharp variations observed within short periods of time, notably falling below US $ 10 million in 2009 before rebounding to reach a record high of US $ 59 million in 2013. This high volatility of pulse exports is reflected in the trade balance for the commodity. Apart from the good results observed in 2010, it is only since 2013 that the trade balance for pulses in Kenya became positive, standing at US $ 12.3 million in 2014, boosted by the impres-sive growth of the sector’s exports during the past two years.
However, this surplus is fragile because the country con-tinues to import large quantities of pulses, importing approx-imately 81,000 tons of pulses in 2013–2014 to meet domestic demand ; imports which consisted primarily of kidney beans & white pea beans, and dry peas ( the country remains a net importer of these products ). Its main suppliers include the United States ( 26.6 % of Kenya’s imports of pulses in 2014 ), Ethiopia ( 22.4 % ), the United Republic of Tanzania ( 13.9 % ) and Uganda ( 13.0 % ).37 While the United States exports al-
37.– International Trade Centre ( 2015 ). Trade Map Database ( mirror data ). Avail-able from http : // www.trademap.org / Index.aspx. Accessed 28 October 2015.
most exclusively dry peas to Kenya, Ethiopia provides the Kenyan market with kidney beans & white pea beans, while Uganda and the United Republic of Tanzania mainly export black / green gram beans.
expoRt paRtneRs
Looking at Kenya’s main export partners, trade flows depict a sector vulnerable to purchases by a few countries and very unstable trends. As indicated in figure 17, Kenya’s exports are highly dependent on the Asian market, and more specifi-cally on the Indian and Pakistani markets. These two coun-tries together accounted for 82 % of the pulses exported by Kenya in 2013–2014, indicating a high degree of concentra-tion of the country’s exports. Kenya’s vulnerability to India’s demand was evident in 2011, when exports to India fell by 89 % compared with 2010 levels, resulting in Kenya’s total exports plummeting by 51 %. Market concentrations have worsened since 2011. Overall, export growth was primarily driven by further market penetration in existing markets for existing products.
While the share of total pulse exports from Kenya into the Asian market has increased since 2011, the reverse trend was observed for the African continent as a target market, the latter only attracting about 10 % of Kenya’s total exports of pulses in 2013–2014. Kenyan exports have not yet reached the demanding markets of Europe – where exports have been very meagre ( not exceeding US $ 1 million ) – and North America, with virtually non-existent flows.
Figure 18 : Kenyan exports of pulses to selected markets, 2004–2014 ( US $ millions )
0
20
40
60
2004 2005 2006 2007 2008 2009 2010 2011 2012 2013 2014
US$,
mill
ions
Africa America Asia Europe World
Sources : ITC calculations based on United Nations Comtrade statistics until January 2011 ; ITC calculations based on data from the Kenya National Bureau of Statistics from January 2011 until January 2013 ; and ITC calculations based on United Nations Comtrade statistics since January 2013.
Note : Data covering the years 2012 and 2014 are mirror data ( i.e. data reported by Kenya’s trade partners ).

[ AN EVOLVING VALUE CHAIN IN NEED OF SUPPORT ]
39
expoRt pRoduCt Basket
The majority of Kenya’s pulse exports are comprised of ‘kidney beans & white pea beans’ ( 51 % of exports in 2013–2014 ), and ‘leguminous vegetables, dried’ ( 18 % ), which were, in 2013, primarily dominated by exports of ‘pigeon peas’, the later accounting for 96 % of total exports within this category.38 The next most exported category ‘urd, mung, black / green gram beans’ accounted for 15 % of Kenya’s pulse exports. Product concentration represents a serious issue in the sector, as the top three products listed above comprise 84 % of the country’s pulse exports.
Some signs of product diversification were observed over the past decade, driven by the progression of pulse exports. From only three varieties of pulses valued above US $ 0.1 million and only five registered export flows in 2004, Kenya reported exports for 8 to 10 varieties in 2013–2014, including four varieties valued above US $ 1 million.
Overall, trade statistics show that Kenyan pulse exports are very volatile, with no evidence of clear trends. Exports
38.– The 2012 version of the harmonized system nomenclature modified the category ‘Leguminous vegetables dried…’, it excluded ‘Pigeon peas..’ and created a single HS 6 code for this product. Hence trade data specific to this product are only available since 2012. Note that ‘Beans dried,…’ was also amended and since 2012 ‘cowpeas’ have their own HS code.
of ‘kidney beans & white pea beans’ and ‘urd, mung, black / green gram beans’ grew significantly over the past five years, albeit from a very low base ( CAGR of 236 % and 259 % between 2010 and 2014, respectively ), while the trends for other varieties are less certain, reflecting the low level of survivability of Kenyan pulse exports.
Of particular concern, however, is the decline in exports of ‘peas, dried’ While this used to be an important product whose exports were valued at more than US $ 13 million in 2010, exports of this product plummeted to US $ 0.6 million in 2014.
From an international perspective, paradoxically, ‘urd, mung, black / green gram…’, one of Kenya’s most vibrant ex-port products, is the variety of pulses for which world imports have grown the least, i.e. 1 %, over the period 2010–2014. However, prospects are bright for the ‘kidney beans & white pea beans…’ segment, Kenya’s leading export product, with international demand for this category of pulses growing at an average of 8 % between 2010 and 2014.
Kenya’s product diversification is nevertheless promis-ing, providing that concerted actions are taken to expand further and promote long survival rates. Extra efforts also need to be made to penetrate new markets and to unlock the production of more pulse varieties.
Figure 19 : Kenya’s export basket of pulses, 2004–2014 ( US $ thousands )
0
20
40
60
2004 2005 2006 2007 2008 2009 2010 2011 2012 2013 2014
US$,
mill
ions
Other Lentils (071340) Leguminous vegetables, dried (071390) Peas, dried (071310) Beans, dried (071339) Pigeon peas (071360) Urd, mung, black/green gram beans (071331) Kidney beans & white pea beans (071333) Total
Sources : ITC calculations based on United Nations Comtrade statistics until January 2011 ; ITC calculations based on data from the Kenya National Bureau of Statistics from January 2011 until January 2013 ; and ITC calculations based on United Nations Comtrade statistics since January 2013.
Note : Data covering the years 2012 and 2014 are mirror data ( i.e. data reported by Kenya’s trade partners ).
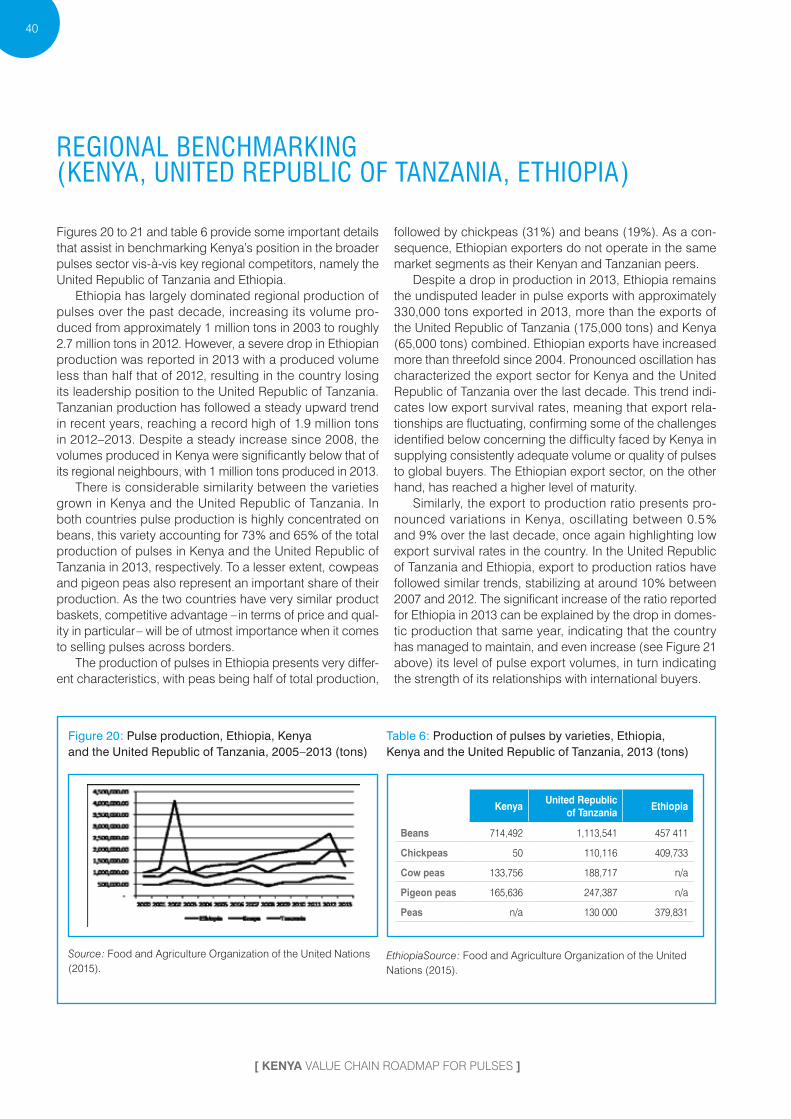
40
[ KENYA Value Chain Roadmap foR pulSeS ]
Regional BenChmaRking ( kenya, united RepuBliC of tanzania, ethiopia )
Figures 20 to 21 and table 6 provide some important details that assist in benchmarking Kenya’s position in the broader pulses sector vis-à-vis key regional competitors, namely the United Republic of Tanzania and Ethiopia.
Ethiopia has largely dominated regional production of pulses over the past decade, increasing its volume pro-duced from approximately 1 million tons in 2003 to roughly 2.7 million tons in 2012. However, a severe drop in Ethiopian production was reported in 2013 with a produced volume less than half that of 2012, resulting in the country losing its leadership position to the United Republic of Tanzania. Tanzanian production has followed a steady upward trend in recent years, reaching a record high of 1.9 million tons in 2012–2013. Despite a steady increase since 2008, the volumes produced in Kenya were significantly below that of its regional neighbours, with 1 million tons produced in 2013.
There is considerable similarity between the varieties grown in Kenya and the United Republic of Tanzania. In both countries pulse production is highly concentrated on beans, this variety accounting for 73 % and 65 % of the total production of pulses in Kenya and the United Republic of Tanzania in 2013, respectively. To a lesser extent, cowpeas and pigeon peas also represent an important share of their production. As the two countries have very similar product baskets, competitive advantage – in terms of price and qual-ity in particular – will be of utmost importance when it comes to selling pulses across borders.
The production of pulses in Ethiopia presents very differ-ent characteristics, with peas being half of total production,
followed by chickpeas ( 31 % ) and beans ( 19 % ). As a con-sequence, Ethiopian exporters do not operate in the same market segments as their Kenyan and Tanzanian peers.
Despite a drop in production in 2013, Ethiopia remains the undisputed leader in pulse exports with approximately 330,000 tons exported in 2013, more than the exports of the United Republic of Tanzania ( 175,000 tons ) and Kenya ( 65,000 tons ) combined. Ethiopian exports have increased more than threefold since 2004. Pronounced oscillation has characterized the export sector for Kenya and the United Republic of Tanzania over the last decade. This trend indi-cates low export survival rates, meaning that export rela-tionships are fluctuating, confirming some of the challenges identified below concerning the difficulty faced by Kenya in supplying consistently adequate volume or quality of pulses to global buyers. The Ethiopian export sector, on the other hand, has reached a higher level of maturity.
Similarly, the export to production ratio presents pro-nounced variations in Kenya, oscillating between 0.5 % and 9 % over the last decade, once again highlighting low export survival rates in the country. In the United Republic of Tanzania and Ethiopia, export to production ratios have followed similar trends, stabilizing at around 10 % between 2007 and 2012. The significant increase of the ratio reported for Ethiopia in 2013 can be explained by the drop in domes-tic production that same year, indicating that the country has managed to maintain, and even increase ( see Figure 21 above ) its level of pulse export volumes, in turn indicating the strength of its relationships with international buyers.
Figure 20 : Pulse production, Ethiopia, Kenya and the United Republic of Tanzania, 2005–2013 ( tons )
Source : Food and Agriculture Organization of the United Nations ( 2015 ).
Table 6 : Production of pulses by varieties, Ethiopia, Kenya and the United Republic of Tanzania, 2013 ( tons )
KenyaUnited Republic
of TanzaniaEthiopia
Beans 714,492 1,113,541 457 411
Chickpeas 50 110,116 409,733
Cow peas 133,756 188,717 n/a
Pigeon peas 165,636 247,387 n/a
Peas n/a 130 000 379,831
EthiopiaSource : Food and Agriculture Organization of the United Nations ( 2015 ).
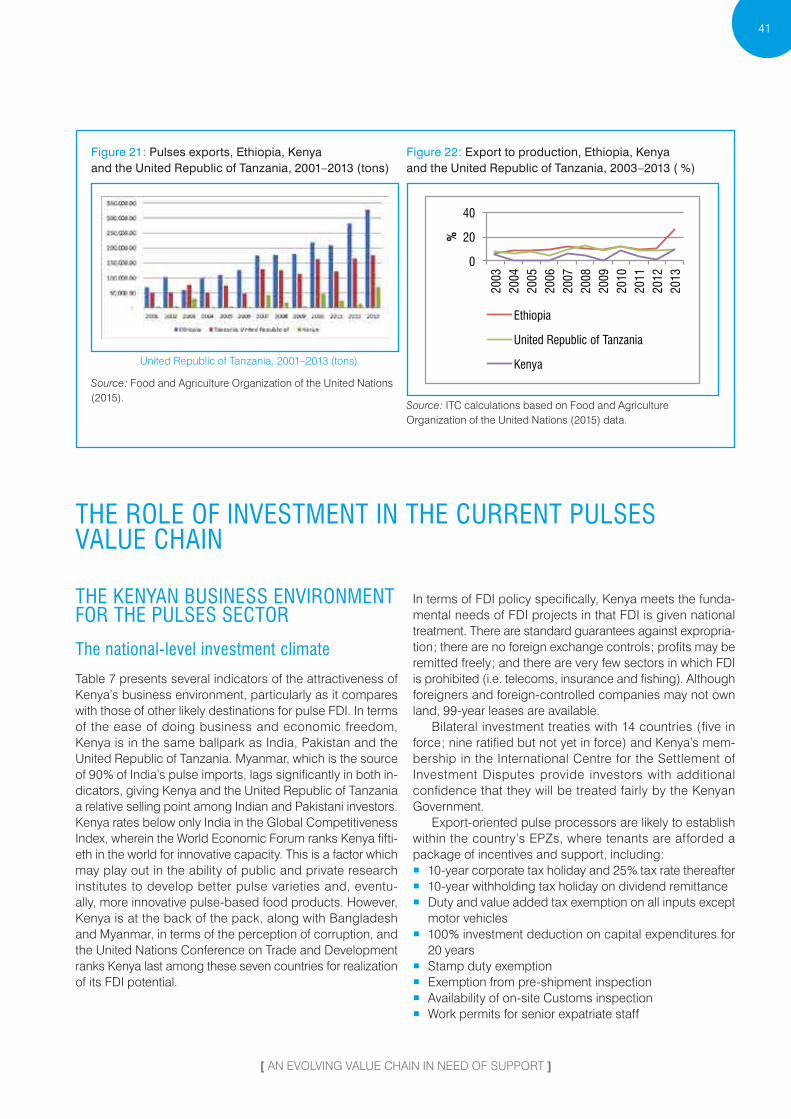
[ AN EVOLVING VALUE CHAIN IN NEED OF SUPPORT ]
41
Figure 21 : Pulses exports, Ethiopia, Kenya and the United Republic of Tanzania, 2001–2013 ( tons )
United Republic of Tanzania, 2001–2013 (tons)
Source : Food and Agriculture Organization of the United Nations ( 2015 ).
Figure 22 : Export to production, Ethiopia, Kenya and the United Republic of Tanzania, 2003–2013 ( % )
0
20
40
2003
20
04
2005
20
06
2007
20
08
2009
20
10
2011
20
12
2013
%
Ethiopia
United Republic of Tanzania
Kenya
Source : ITC calculations based on Food and Agriculture Organization of the United Nations ( 2015 ) data.
the Role of inVestment in the CuRRent pulses Value Chain
the kenyan Business enViRonment foR the pulses seCtoR
the national-level investment climate
Table 7 presents several indicators of the attractiveness of Kenya’s business environment, particularly as it compares with those of other likely destinations for pulse FDI. In terms of the ease of doing business and economic freedom, Kenya is in the same ballpark as India, Pakistan and the United Republic of Tanzania. Myanmar, which is the source of 90 % of India’s pulse imports, lags significantly in both in-dicators, giving Kenya and the United Republic of Tanzania a relative selling point among Indian and Pakistani investors. Kenya rates below only India in the Global Competitiveness Index, wherein the World Economic Forum ranks Kenya fifti-eth in the world for innovative capacity. This is a factor which may play out in the ability of public and private research institutes to develop better pulse varieties and, eventu-ally, more innovative pulse-based food products. However, Kenya is at the back of the pack, along with Bangladesh and Myanmar, in terms of the perception of corruption, and the United Nations Conference on Trade and Development ranks Kenya last among these seven countries for realization of its FDI potential.
In terms of FDI policy specifically, Kenya meets the funda-mental needs of FDI projects in that FDI is given national treatment. There are standard guarantees against expropria-tion ; there are no foreign exchange controls ; profits may be remitted freely ; and there are very few sectors in which FDI is prohibited ( i.e. telecoms, insurance and fishing ). Although foreigners and foreign-controlled companies may not own land, 99-year leases are available.
Bilateral investment treaties with 14 countries ( five in force ; nine ratified but not yet in force ) and Kenya’s mem-bership in the International Centre for the Settlement of Investment Disputes provide investors with additional confidence that they will be treated fairly by the Kenyan Government.
Export-oriented pulse processors are likely to establish within the country’s EPZs, where tenants are afforded a package of incentives and support, including :
� 10-year corporate tax holiday and 25 % tax rate thereafter � 10-year withholding tax holiday on dividend remittance � Duty and value added tax exemption on all inputs except
motor vehicles � 100 % investment deduction on capital expenditures for
20 years � Stamp duty exemption � Exemption from pre-shipment inspection � Availability of on-site Customs inspection � Work permits for senior expatriate staff

42
[ KENYA Value Chain Roadmap foR pulSeS ]
Table 7 : The investment climate in Kenya and possible competitors for pulse investment
International benchmark IndiaUnited Republic
of TanzaniaPakistan Kenya Bangladesh Ethiopia Myanmar
Average of six major rankings 94 108 115 121 125 127 136
Ease of Doing Business ranking ( World Bank Group, 2015 ) 142 131 128 136 173 132 177
Competitive Industrial Performance ranking ( United Nations Industrial Development
Organization, 2010 ) 43 106 74 102 78 130 Not ranked
Global Competitiveness Index ( World Economic Forum, 2014 ) 71 121 129 90 109 118 134
Inward FDI Performance Index ( United Nations Conference on Trade and
Development, 2010 ) 97 59 110 129 114 120 52
Corruption Perception Index ( Transparency International, 2014 ) 85 119 126 145 ( tie ) 145 ( tie ) 110 156
Economic Freedom Index ( Heritage Foundation, 2015 ) 128 109 121 122 131 149 161
Source: World Bank
sector specifics
Agro-industry is one of six national priorities for develop-ment under Kenya’s main development programme, Vision 2030. Concrete implementation of the Government’s prior-itization of agribusiness is evident in a new law, regulatory streamlining and financial support. The Crops Act of 2013 aims to increase competitiveness, crop and market diversity, and private investment through a reduction of regulation, bureaucracy, taxes and institutional overlap. For example, AFFA consolidates and streamlines eight public bodies for the regulation and promotion of agriculture. In addition, a new Commodities Fund provides financial support to grow-ers for farm inputs and operations. However, the Seed and Plant Varieties Act remains an obstacle to the upgrading of quality and volume.
Primary producers are now supported by a one-stop land registration process and a 100 % industrial building al-lowance on agricultural land, which plans to increase sev-enfold the total land area under irrigation. Processors, who depend on low electricity rates to be competitive, can look forward to new generation projects underway that are ex-pected to lower electricity tariffs by between half and two-thirds, making Kenyan electricity cheaper than the United Republic of Tanzania’s.
One of the sector characteristics which may be most problematic for investors is the dominance of smallholder farmers in Kenyan pulse production. Scattered and small-scale production impedes consistency of product quality and quantity, tailoring of product characteristics to buyers, and efficient marketing. However, as this is a characteristic of regional agriculture generally, Kenya is not at a relative disadvantage and it could in fact achieve a significant com-petitive advantage by making progress in the organization of pulse markets.
The success of Kenya in attracting investment to pulses and agribusiness depends on exploitation of Kenya’s position as the most important hub for global business in East Africa, with relatively good logistics and better international distribu-tion channels. Several additional initiatives for logistics bode well for this goal, including the following.
4. Major developments in transportation infrastructure, allowing commodities to get to market more quickly and vastly more cheaply. The Mombasa–Nairobi leg of a broad-gauge railway that will eventually extend to Kigali is due to be completed within about a year, cutting transportation costs by an astounding 80 % and giving pulse processors in Kenya better access to Rwanda, the tenth-largest producer of dry beans in 2012. The broad-gauge railway will also cut time to port from as many as 12 hours by truck to only six hours. This development is important for the tandem objective of doubling the ton-nage handled by Mombasa’s port to 2 million containers in the next two years.
5. Drastic reduction of electricity costs, enabling more competitive agroprocessing. The geothermal electricity generation project at Naivasha, about 100 km from the major pulse producing regions of clusters of Nairobi, has the potential to reduce electricity costs from US $ 0.14 or US $ 0.15 per kilowatt-hour down to US $ 0.05.
6. Creation of a Government industrialization fund that would provide loans for start-ups and machinery up-grades in light manufacturing industries where unreli-able, technologically outdated machines are in wide use. By providing internationally competitive interest rates of 5 % to 6 % instead of the 14 % to 18 % available now and imposing less onerous equity requirements, the Government would add to the competitiveness of pulse processors.

[ AN EVOLVING VALUE CHAIN IN NEED OF SUPPORT ]
43
CompetitiVe ConstRaints affeCting the Value Chain
Traditionally, the scope of export strategies and roadmaps has been defined in terms of market entry, such as market access, trade promotion and export development. This ig-nores several important factors in a country’s competitive-ness. For an export strategy to be effective it must address a wider set of constraints, including any factor that limits the ability of firms to supply export goods and services, the quality of the business environment, and the development impact of the country’s trade, which is important to its sus-tainability. This integrated approach is illustrated by the four gears framework schematic on the right.
Supply-side issues affect production capacity and include challenges in areas such as availability of appropriate skills and competencies, diversification capacity, technology and low value addition in the sector’s products.
Business environment constraints are those that influence transaction costs, such as regulatory environment, admin-istrative procedures and documentation, infrastructure bot-tlenecks, certification costs, Internet access and cost of support services.
Market entry constraints are essentially external to the coun-try ( but may also be manifested internally ), such as market access, market development, market diversification and export promotion.
Social and economic concerns include poverty reduction, gender equity, youth development, environmental sustain-ability and regional integration.
Border IssuesBorder-In Issues
Border-Out IssuesDevelopment Issues
CapacityDevelopment
Cost ofDoing Business
Developinig skills
and Entrepreneurship
Capac
ity
Diversi
ficati
on
Infrastructure and
Regulatory Reform
Trad
eFa
cilita
tion
Market Accessand Policy Reform
National Promotion
and Branding Trad
e Su
ppor
t
Serv
ices
Poverty Alleviationand Gender Issues
Regional Development
and Integration
Envir
onm
enta
l
Sust
aina
bilit
y and
Clim
ate
Chan
ge
supply-side issues
Unreliable and inconsistent supply of certified seeds neg-atively impacts yields and quality – and quantity – consist-ency. The availability of certified seeds of certain varieties for farmers is not guaranteed, due notably to a deficient seed multiplication system and, more generally, to poor regulation of the seed propagation sector, as well as a lack of knowl-edge transfer between seed producers and farmers. In addi-tion, controls to fight against the use of non-certified, or fake, seeds appear to be insufficient. In particular, companies engaged in dry bean production are reluctant to engage in bean seeds because of the high risks associated with the genetic nature of the crop.
Value chain segment Inputs
Severity ● ● ● ● ●
HighlightSeed producers have not identified pulses as a
priority crop for the development of seeds.
PoA reference 1.2.1 to 1.2.5
Low use of improved pulse varieties prevents the sector from achieving high yields and consistent supply quantities. The introduction of adapted hybrid / higher-yielding varieties, which have different specificities such as high adaptability in different climatic conditions and rapid maturity dates, has been limited in Kenya. Important reasons include the low availability of seeds caused by the lack of a large-scale seed multiplication and distribution scheme for hybrid varieties, and limited interaction between seed companies, export-ers, farmers, research institutes such as ICRISAT and public actors. Pigeon pea producers are notably constrained by limited access to high-quality seeds.
Value chain segment Inputs
Severity ● ● ● ● ●
HighlightProducers tend to retain seeds from their production for
replanting the following season.
PoA reference 1.1.4, 1.2.1 to 1.2.5 and 1.4.3
There is lack of knowledge about international market re-quirements for pulses. If it is agreed that the industry would benefit from higher-yielding varieties ( see above ), seed se-lection should also be made according to international mar-ket demand. It will therefore be important to identify varieties and characteristics of pulses – within the broad types such as pigeon peas, chickpeas ( yellow gram ) and green grams ( mung beans ) – that are suitable for the identified cultivation areas and for which there is significant demand, notably tar-geting the Indian market. Seed production and multiplication should also be oriented towards those varieties.

Photo: (CC BY-SA 2.0) CIAT (CC BY-SA 2.0), Bean plant assessments.Apg
44
[ KENYA Value Chain Roadmap foR pulSeS ]
Value chain segment Inputs
Severity ● ● ● ● ●
HighlightPulse producers have limited access to information on market requirements that would help them identify the
varieties to be grown.
PoA reference 1.1.2, 1.1.4, and 1.4.1
The use of appropriate pesticides and fertilizers is insuf-ficient, preventing the sector from achieving higher yields. This is mainly due to the limited knowledge of producers on soil characteristics and important diseases, and the type and quantity of fertilizers and pesticides needed for their crops.
Value chain segment Inputs
Severity ● ● ● ● ●
HighlightThere is a lack of awareness on the importance of
fertilizers and pesticides.
PoA reference 1.3.1, 1.3.2 and 1.4.1
The supply of fertilizers is not adapted to needs of the pulses industry. Like most sub-Saharan African countries, Kenya depends on international markets for its fertilizers because local production is non-existent or limited. The Kenyan Government imports fertilizers and ensures distri-bution to farmers at subsidized costs. However, the quality and suitability of the fertilizers used is questionable, and voices are being raised to involve the private sector in sup-plying fertilizers in order to improve accessibility and pro-ductivity while simultaneously reducing prices by avoiding international price fluctuations. Preliminary discussion with the private sector would be needed to create awareness about the opportunity that the pulses industry represents.
Value chain segment Inputs
Severity ● ● ● ● ●
HighlightThe supply of fertilizers should be reconsidered and the
participation of the private sector encouraged.
PoA reference 1.3.1 and 1.3.2
Low level of pest and disease control in the production of pulses and limited surveillance of common pests such as Helicoverpa armigera and pod fly that can severely affect the production of pulses. In particular, there is a high incidence of pest attacks ( e.g. nematodes ) and diseases encountered in dry pea and cowpea production. Without proper storage, a pest called the cowpea weevil can consume nearly all the cowpeas stored on farms. In general, the use of chemicals against pest infestation is insufficient.
Value chain segment Inputs
Severity ● ● ● ● ●
HighlightA plan for integrated pest management process for
pulses would be needed.
PoA reference 1.4.1 to 1.4.4
Another major constraint currently hindering the per-formance of the sector in Kenya is the low adoption of improved agricultural practices. The relatively low produc-tivity of the domestic pulses sector can be partly explained by the low adoption of improved farming ( including existing production technologies ), harvesting and postharvest tech-niques ( see below ). Two reasons can be given to explain this situation : the limited training of the majority of smallholders and farmers’ organizations and the low level of research and development in the sector. The sector would also benefit from better technological transfer.
[ AN EVOLVING VALUE CHAIN IN NEED OF SUPPORT ]
45
Value chain segment All segments
Severity ● ● ● ● ●
Highlight The industry has limited knowledge of best practices.
PoA reference 1.4.1 to 1.4.4
Poor postharvest capacities and technologies result in significant losses in the sector. A recent study conducted by the Alliance for a Green Revolution in Africa estimates that the percentage loss of crops of grain legumes during postharvest handling in Kenya reaches 25 %.39 Postharvest losses stem from the limited use of existing warehouses and certified storage facilities, or lack of them, as well as other physical postharvest facilities such as cleaning, sorting, grading, drying, polishing and bagging. The study further indicates that ‘at smallholder levels, suitable technologies for harvesting, transportation, drying, storing and primary processing of grain legumes are still underdeveloped.’40
This situation leads to farmers / collectors selling at open markets or roadsides with little hygiene, which in turn affects the quality of the product at the processor level. In particular, because of the lack of storage facilities and due the fact that this crop is very sensitive to pest attacks, producers of cow-peas are often forced to sell their cowpeas at harvest, when prices are at their lowest levels. As indicated above, poor handling and postharvest techniques and limited knowledge of best practices also contribute to the situation.
Value chain segment Postharvest / collection
Severity ● ● ● ● ●
Highlight
Fostering the use of existing aggregation centres and warehouses and making other services like cleaning,
sorting, grading and packaging available at warehouses would contribute to reducing postharvest losses. Further, EAGC indicated that these aggregation centres could be instrumental for the development of the pulses sector as
they could also be used as trading hubs for pulses.
PoA reference 1.4.1, 2.2.1, 2.2.2, 2.4.3, and 3.1.5
Limited knowledge of the potential of pulses in the country, as the sector receives little attention from support institutions, which tend to focus more on crops such as maize. Areas with high potential for pulse production are yet to be defined.
Value chain segment Production
Severity ● ● ● ● ●
HighlightPulse production has triggered little interest from farmers
and is usually intercropped with maize, sugar cane and coffee.
PoA reference 1.1.1, 1.1.2, 1.4.1, and 3.1.2
39.– Alliance for a Green Revolution in Africa ( 2013 ). Establishing the Status oA Post-Harvest Losses and Storage Aor MaAor Staple Crops in Eleven AArican Countries ( Phase I ), p. xviii. Nairobi, Kenya : AGRA.40.– Ibid. : p.51.
Limited product quality is the major limiting factor for the export of pulses from Kenya, and sub-Saharan Africa in general. Quality, a major concern for the Asian market, ap-pears to be uneven in the Kenyan pulse industry, especially at the grass-roots level. Because quality certification and standardization mechanisms are not very widespread in the sector, buyers find it difficult to trust suppliers as there is a risk that the required quality will not be provided.
In addition, suppliers need to be knowledgeable about the specific quality requirements of each destination coun-try and have a structure that should be adapted to meet the specific needs of buyers, conditions that are not and currently cannot be met. As this has proven to be difficult in Kenya and in other sub-Saharan African countries, buy-ers in international markets prefer to buy from transnational companies because they offer a better assurance of quality.
Value chain segment All segments
Severity ● ● ● ● ●
HighlightQuality issues need to be addressed along the entire
pulses value chain from production to processing and exporting.
PoA reference 1.2.1 to 1.2.5, and 1.4.1 to 1.4.3
Most pulses are exported in raw non-value added / limited value added form by processors. It is difficult, at this stage of maturity of the sector, to add value to pulse products in Kenya due to a lack of adequate processing equipment ; lim-ited knowledge of client needs and of value addition oppor-tunities ; absence of support mechanisms ; uncertain supply of inputs ; limited access to technology for smallholders ; and challenging production infrastructures. Looking specifically at cowpeas, there is limited availability of diversified product value addition.
Value chain segment Production / processing
Severity ● ● ● ● ●
Highlight
One of the key objectives of this roadmap is to develop processing capacity in Kenya for processing and
export of value added pulses, notably through fostering technology transfer.
PoA reference 1.4.2 and 2.2.1 to 2.2.3
Weak extension services stem from a shortage of extension service workers, limited investment in extension services, and limited field presence of public extension service em-ployees. In addition, extension services are often generic and not crop-specific. A study published by the International Food Policy Research Institute in 2011 further indicates that out of the 5,470 staff members the Kenya public extension comprised that year, only 103 had a Master of Science de-gree, and four were trained at the PhD level, indicating the
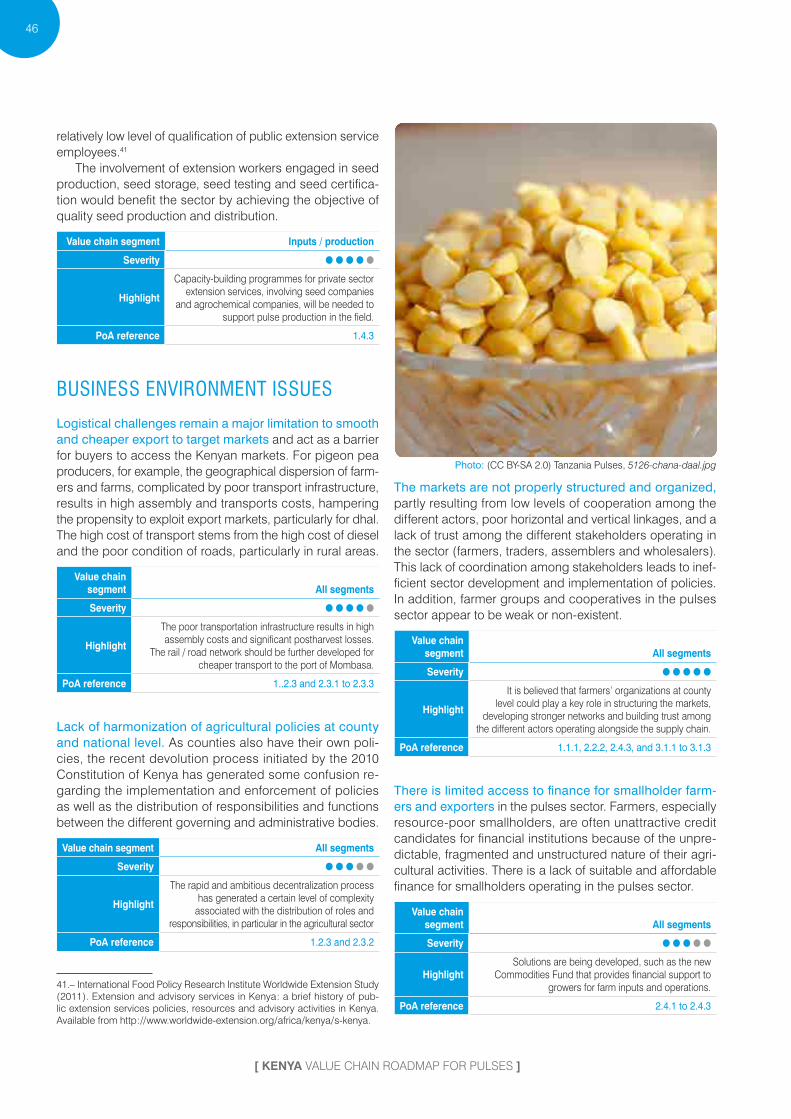
Photo: (CC BY-SA 2.0) Tanzania Pulses, 5126-chana-daal.Apg
46
[ KENYA Value Chain Roadmap foR pulSeS ]
relatively low level of qualification of public extension service employees.41
The involvement of extension workers engaged in seed production, seed storage, seed testing and seed certifica-tion would benefit the sector by achieving the objective of quality seed production and distribution.
Value chain segment Inputs / production
Severity ● ● ● ● ●
Highlight
Capacity-building programmes for private sector extension services, involving seed companies
and agrochemical companies, will be needed to support pulse production in the field.
PoA reference 1.4.3
Business enViRonment issues
Logistical challenges remain a major limitation to smooth and cheaper export to target markets and act as a barrier for buyers to access the Kenyan markets. For pigeon pea producers, for example, the geographical dispersion of farm-ers and farms, complicated by poor transport infrastructure, results in high assembly and transports costs, hampering the propensity to exploit export markets, particularly for dhal. The high cost of transport stems from the high cost of diesel and the poor condition of roads, particularly in rural areas.
Value chain segment All segments
Severity ● ● ● ● ●
Highlight
The poor transportation infrastructure results in high assembly costs and significant postharvest losses.
The rail / road network should be further developed for cheaper transport to the port of Mombasa.
PoA reference 1..2.3 and 2.3.1 to 2.3.3
Lack of harmonization of agricultural policies at county and national level. As counties also have their own poli-cies, the recent devolution process initiated by the 2010 Constitution of Kenya has generated some confusion re-garding the implementation and enforcement of policies as well as the distribution of responsibilities and functions between the different governing and administrative bodies.
Value chain segment All segments
Severity ● ● ● ● ●
Highlight
The rapid and ambitious decentralization process has generated a certain level of complexity
associated with the distribution of roles and responsibilities, in particular in the agricultural sector
PoA reference 1.2.3 and 2.3.2
41.– International Food Policy Research Institute Worldwide Extension Study ( 2011 ). Extension and advisory services in Kenya : a brief history of pub-lic extension services policies, resources and advisory activities in Kenya. Available from http : // www.worldwide-extension.org / africa / kenya / s-kenya.
The markets are not properly structured and organized, partly resulting from low levels of cooperation among the different actors, poor horizontal and vertical linkages, and a lack of trust among the different stakeholders operating in the sector ( farmers, traders, assemblers and wholesalers ). This lack of coordination among stakeholders leads to inef-ficient sector development and implementation of policies. In addition, farmer groups and cooperatives in the pulses sector appear to be weak or non-existent.
Value chain segment All segments
Severity ● ● ● ● ●
Highlight
It is believed that farmers’ organizations at county level could play a key role in structuring the markets,
developing stronger networks and building trust among the different actors operating alongside the supply chain.
PoA reference 1.1.1, 2.2.2, 2.4.3, and 3.1.1 to 3.1.3
There is limited access to finance for smallholder farm-ers and exporters in the pulses sector. Farmers, especially resource-poor smallholders, are often unattractive credit candidates for financial institutions because of the unpre-dictable, fragmented and unstructured nature of their agri-cultural activities. There is a lack of suitable and affordable finance for smallholders operating in the pulses sector.
Value chain segment All segments
Severity ● ● ● ● ●
HighlightSolutions are being developed, such as the new
Commodities Fund that provides financial support to growers for farm inputs and operations.
PoA reference 2.4.1 to 2.4.3

Pho
to: C
C0
Pub
lic D
omai
n
[ AN EVOLVING VALUE CHAIN IN NEED OF SUPPORT ]
47
maRket entRy issues
Limited use of contract farming to secure long-term busi-ness agreements with international buyers. One of the reasons why international buyers find it easier to buy from transnationals in Kenya and other African countries relates to the issue of contract management. In order to better man-age contract defaults and buyers’ risk, international buyers and processors tend to acquire commodities from reputed companies in the ports, as the risk default is more manage-able. Another way of minimizing this risk is to send a repre-sentative from the buying company to the seller’s location to ensure that the terms of the contract are well understood and delivered. However, this practice pushes the cost of procurement to a higher level.
Value chain segment All segments
Severity ● ● ● ● ●
HighlightThe market structure is not mature enough to manage
contract defaults and buyers’ risk management systems do not allow them to participate in such markets directly.
PoA reference 2.1.1 and 2.1.4
Lack of information exchange among value chain actors leads to inefficiencies along the value chain, with farmers having little understanding of market and buyer require-ments and often engaging in suboptimal contract arrange-ments. Weak capacities of farmers’ organizations, weak extension services and lack of specific market information services are partly responsible for this lack of information.
Value chain segment All segments
Severity ● ● ● ● ●
HighlightThere is little or no knowledge of international
markets and export buyer requirements.
PoA reference 1.1.2, 1.1.3 ; and 3.2.1 to 3.2.4
Absence of export promotion and branding efforts. To build export competitiveness, the pulse products sec-tor must have an established brand outside the country. Ensuring that the sector’s products are of a minimum qual-ity and supplied with consistency is a given prerequisite in this regard. Another important dimension is developing an effective brand promotion campaign, which is made difficult by the low level of organization in the sector and the small per capita size of smallholders.
Value chain segment Marketing and distribution
Severity ● ● ● ● ●
Highlight
The sector would greatly benefit from outreach programmes that seek to promote interaction between
Kenya’s value chain actors and their foreign buyers and peers.
PoA reference 2.2.1, 3.1.1 to 3.1.5, and 3.3.1
Limited investment promotion in the pulse processing sector. Investment promotion activities such as setting up an EPZ for pulse processing for export purposes, offering an incentive package for investors or offering financial support would be required to better promote investment in pulses and pulse processing in Kenya.
Value chain segment All segments
Severity ● ● ● ● ●
Highlight
Developing integrated pulse processing parks like the Special Economic Zones or EPZs for export purposes
could also envisaged in the long term to promote FDI in pulse processing.
PoA reference 2.1.1 to 2.1.5
deVelopment issues
Requirement to enhance productive engagement of women in the sectorWith roughly 1.8 million households involved in the produc-tion of pulses in Kenya, the development of the sector could have a high socioeconomic impact. The development of the industry could significantly boost job creation and generate indirect employment.
Despite the lack of statistics on workers, it seems that women play a significant role in Kenya’s pulses sector, no-tably as the majority of cowpea growers are women who grow the crop primarily for household food.42 However, in-complete gender statistics provide an incomplete overview of the gender situation and quality gender disaggregated data would be needed to benchmark the country in terms of gender and women’s empowerment.
Value chain segment All segments
Severity ● ● ● ● ●
PoA referenceAll POA activities will have a gender component
where applicable
42.– United States Agency for International Development ( 2010 ). Staple Foods Value Chain Analysis, Country Report – Kenya, p. 153. USAID.
Photo: CIAT (CC BY-SA 2.0), climbing beans.Apg
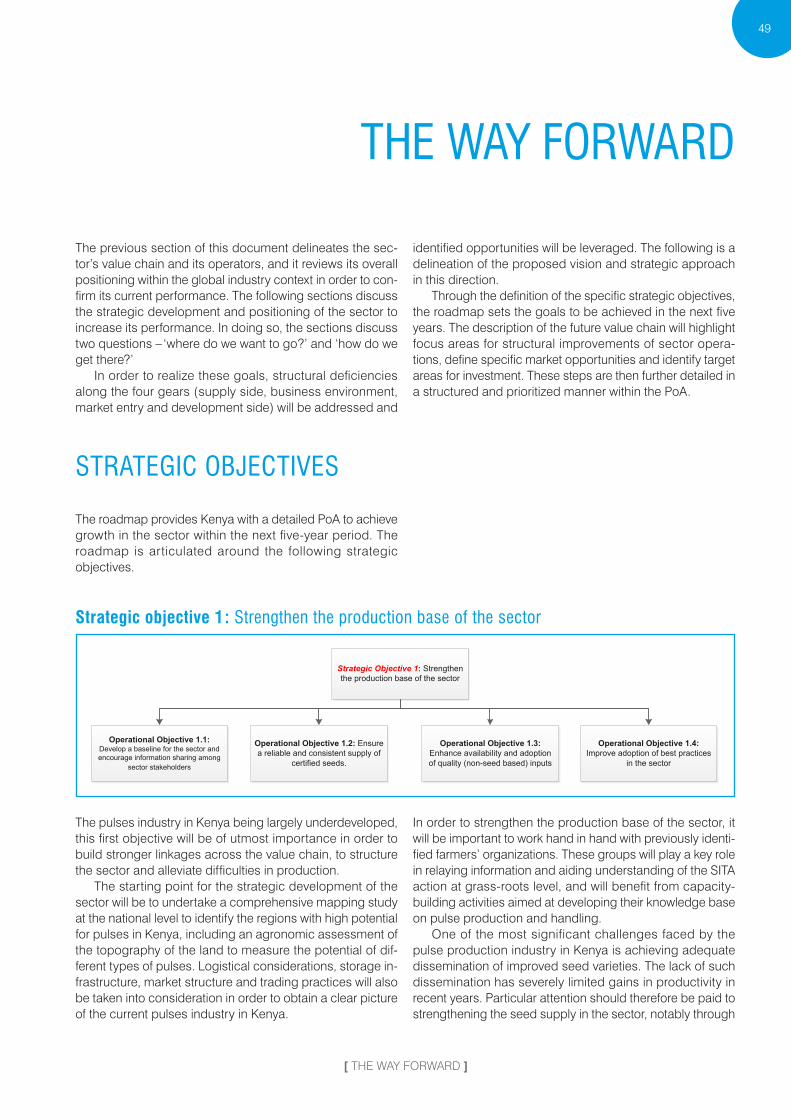
[ THE WAY FORWARD ]
49
the way foRwaRd
The previous section of this document delineates the sec-tor’s value chain and its operators, and it reviews its overall positioning within the global industry context in order to con-firm its current performance. The following sections discuss the strategic development and positioning of the sector to increase its performance. In doing so, the sections discuss two questions – ‘where do we want to go ?’ and ‘how do we get there?’
In order to realize these goals, structural deficiencies along the four gears ( supply side, business environment, market entry and development side ) will be addressed and
identified opportunities will be leveraged. The following is a delineation of the proposed vision and strategic approach in this direction.
Through the definition of the specific strategic objectives, the roadmap sets the goals to be achieved in the next five years. The description of the future value chain will highlight focus areas for structural improvements of sector opera-tions, define specific market opportunities and identify target areas for investment. These steps are then further detailed in a structured and prioritized manner within the PoA.
stRategiC oBjeCtiVes
The roadmap provides Kenya with a detailed PoA to achieve growth in the sector within the next five-year period. The roadmap is articulated around the following strategic objectives.
strategic objective 1 : strengthen the production base of the sector
Strategic Objective 1: Strengthen the production base of the sector
Operational Objective 1.1: Develop a baseline for the sector and encourage information sharing among
sector stakeholders
Operational Objective 1.2: Ensure a reliable and consistent supply of
certified seeds.
Operational Objective 1.3: Enhance availability and adoption of quality (non-seed based) inputs
Operational Objective 1.4: Improve adoption of best practices
in the sector
The pulses industry in Kenya being largely underdeveloped, this first objective will be of utmost importance in order to build stronger linkages across the value chain, to structure the sector and alleviate difficulties in production.
The starting point for the strategic development of the sector will be to undertake a comprehensive mapping study at the national level to identify the regions with high potential for pulses in Kenya, including an agronomic assessment of the topography of the land to measure the potential of dif-ferent types of pulses. Logistical considerations, storage in-frastructure, market structure and trading practices will also be taken into consideration in order to obtain a clear picture of the current pulses industry in Kenya.
In order to strengthen the production base of the sector, it will be important to work hand in hand with previously identi-fied farmers’ organizations. These groups will play a key role in relaying information and aiding understanding of the SITA action at grass-roots level, and will benefit from capacity-building activities aimed at developing their knowledge base on pulse production and handling.
One of the most significant challenges faced by the pulse production industry in Kenya is achieving adequate dissemination of improved seed varieties. The lack of such dissemination has severely limited gains in productivity in recent years. Particular attention should therefore be paid to strengthening the seed supply in the sector, notably through

50
[ KENYA Value Chain Roadmap foR pulSeS ]
the identification and development of varieties of pulses that are suitable for the identified regions and that are in line with international market requirements. Improved seeds will then be distributed through farmers’ associations. A stronger in-volvement of the private sector will also be encouraged to ensure regular supply of the quality seeds necessary for the good development of the industry.
Also related to enhancing the use of quality inputs, and in addition to seed supply, an important element under this strategic objective will be to ensure that the sector has ac-cess to a strong base of inputs, in particular pesticides and fertilizers that are suitable for specific soil characteristics and
pulse varieties. A plan to improve availability of these prod-ucts for pulse farmers will be developed.
Pilot farm initiatives for production and harvesting of the identified pulses will also be established, providing a platform for the exchange of best practices with farmers’ organizations. Following this initiative, a vast programme to scale up production ( sowing and harvesting ) of the identi-fied pulses will be undertaken in the previously identified regions.
Finally, strengthening the sector will be achieved by improving postharvest management and ensuring that the crop is handled and stored properly.
strategic objective 2 : promote fdi and develop processing capacity in kenya for processing and expor t of value added pulses
Strategic Objective 2: Promote FDI and Developing Processing Capacity in
Kenya for processing and export of value added pulses.
Operational Objective 2.1: Promote Investment in pulses
processing sector
Operational Objective 2.2: Facilitate technology transfer and equipment upgrade in the sector
Operational Objective 2.3: Improve essential Infrastructure in the
sector
Operational Objective 2.4: Improve access to finance in the sector
Promoting FDI in the pulse processing sector will be instru-mental in achieving this objective. The ban on exports of processed pulses imposed in India since 2006 ( with minor exceptions ) has led Indian investors to establish process-ing plants abroad to supply the large South Asian diaspora across the world. Although Indian FDI has targeted coun-tries like Nepal, Myanmar and the UAE, African countries – and Kenya in particular – could also take advantage of this market opportunity and become a preferred destination for pulse processors from India. However, although Kenya has a ready market for processed pulses, coupled with logistics infrastructure and the availability of cheap resources like la-bour, electricity and raw material ( pulse crops ), important efforts will have to be made for the country to become more attractive for foreign investors.
It will be of utmost importance to incorporate specific policies for FDI in pulse production and processing in Kenya, something that can be achieved by advocating and making policy proposals and recommendations to provide incentives ( tax holidays, simplified licensing processes, etc. ) to foreign enterprises with the view to stimulating investment in the processed pulses sector. Developing integrated pulse processing parks like the Special Economic Zones or EPZs for export purposes could also be envisaged in the long term to promote FDI in pulse processing.
Structured investment promotion efforts for sector devel-opment ( processing ) will also be organized as part of this strategic objective. An important step will be to promote technology transfers to allow Kenyan investors interested in pulse processing to develop their activities, namely through the setting up and supply of processing machinery such as dhal plants from India ( including cleaning, drying, splitting, polishing, etc. ). Developing the processing capacity for ex-port of value added pulses in Kenya will also be encouraged by providing buyers with credit for the supply of technology from India.
Finally, investment will be promoted by inviting investors, explaining the investment opportunities, providing sector information and matchmaking with local producers. The project will also support the organization of visits to foreign countries for investment promotion to explore new markets, new products and new business partners. Study visits will also be an opportunity for local market players to learn inter-national practices in investment, to disseminate information about investment opportunities in Kenya, and to learn about modernization of the sector along the supply chain.
Improvements in essential infrastructure are also a prior-ity. Facilitating increased trade of pulses from Kenya will also be achieved by, first of all, raising awareness of the neces-sity of cold chains for specific pulse varieties such as green
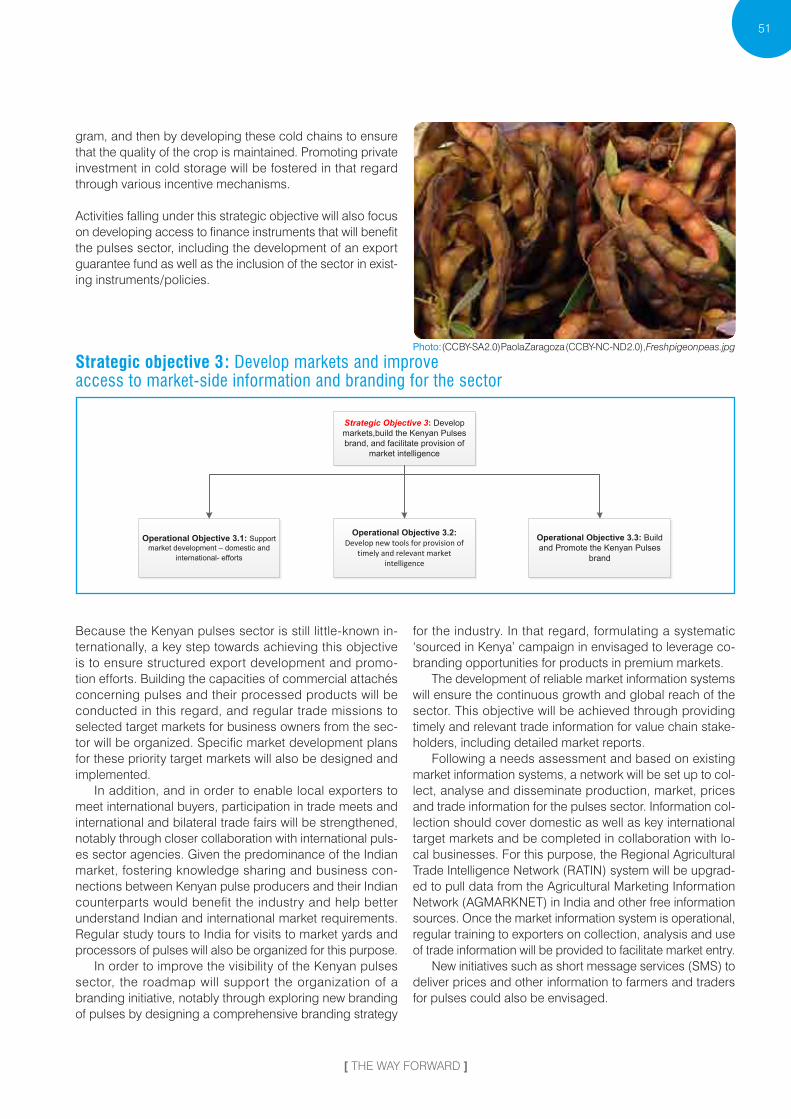
Photo: (CC BY-SA 2.0) Paola Zaragoza (CC BY-NC-ND 2.0), Fresh pigeon peas.Apg
[ THE WAY FORWARD ]
51
gram, and then by developing these cold chains to ensure that the quality of the crop is maintained. Promoting private investment in cold storage will be fostered in that regard through various incentive mechanisms.
Activities falling under this strategic objective will also focus on developing access to finance instruments that will benefit the pulses sector, including the development of an export guarantee fund as well as the inclusion of the sector in exist-ing instruments / policies.
strategic objective 3 : develop markets and improve access to market-side information and branding for the sector
Strategic Objective 3: Develop markets,build the Kenyan Pulses brand, and facilitate provision of
market intelligence
Operational Objective 3.1: Support market development – domestic and
international- efforts
Operational Objective 3.2: Develop new tools for provision of
timely and relevant market intelligence
Operational Objective 3.3: Build and Promote the Kenyan Pulses
brand
Because the Kenyan pulses sector is still little-known in-ternationally, a key step towards achieving this objective is to ensure structured export development and promo-tion efforts. Building the capacities of commercial attachés concerning pulses and their processed products will be conducted in this regard, and regular trade missions to selected target markets for business owners from the sec-tor will be organized. Specific market development plans for these priority target markets will also be designed and implemented.
In addition, and in order to enable local exporters to meet international buyers, participation in trade meets and international and bilateral trade fairs will be strengthened, notably through closer collaboration with international puls-es sector agencies. Given the predominance of the Indian market, fostering knowledge sharing and business con-nections between Kenyan pulse producers and their Indian counterparts would benefit the industry and help better understand Indian and international market requirements. Regular study tours to India for visits to market yards and processors of pulses will also be organized for this purpose.
In order to improve the visibility of the Kenyan pulses sector, the roadmap will support the organization of a branding initiative, notably through exploring new branding of pulses by designing a comprehensive branding strategy
for the industry. In that regard, formulating a systematic ‘sourced in Kenya’ campaign in envisaged to leverage co-branding opportunities for products in premium markets.
The development of reliable market information systems will ensure the continuous growth and global reach of the sector. This objective will be achieved through providing timely and relevant trade information for value chain stake-holders, including detailed market reports.
Following a needs assessment and based on existing market information systems, a network will be set up to col-lect, analyse and disseminate production, market, prices and trade information for the pulses sector. Information col-lection should cover domestic as well as key international target markets and be completed in collaboration with lo-cal businesses. For this purpose, the Regional Agricultural Trade Intelligence Network ( RATIN ) system will be upgrad-ed to pull data from the Agricultural Marketing Information Network ( AGMARKNET ) in India and other free information sources. Once the market information system is operational, regular training to exporters on collection, analysis and use of trade information will be provided to facilitate market entry.
New initiatives such as short message services ( SMS ) to deliver prices and other information to farmers and traders for pulses could also be envisaged.
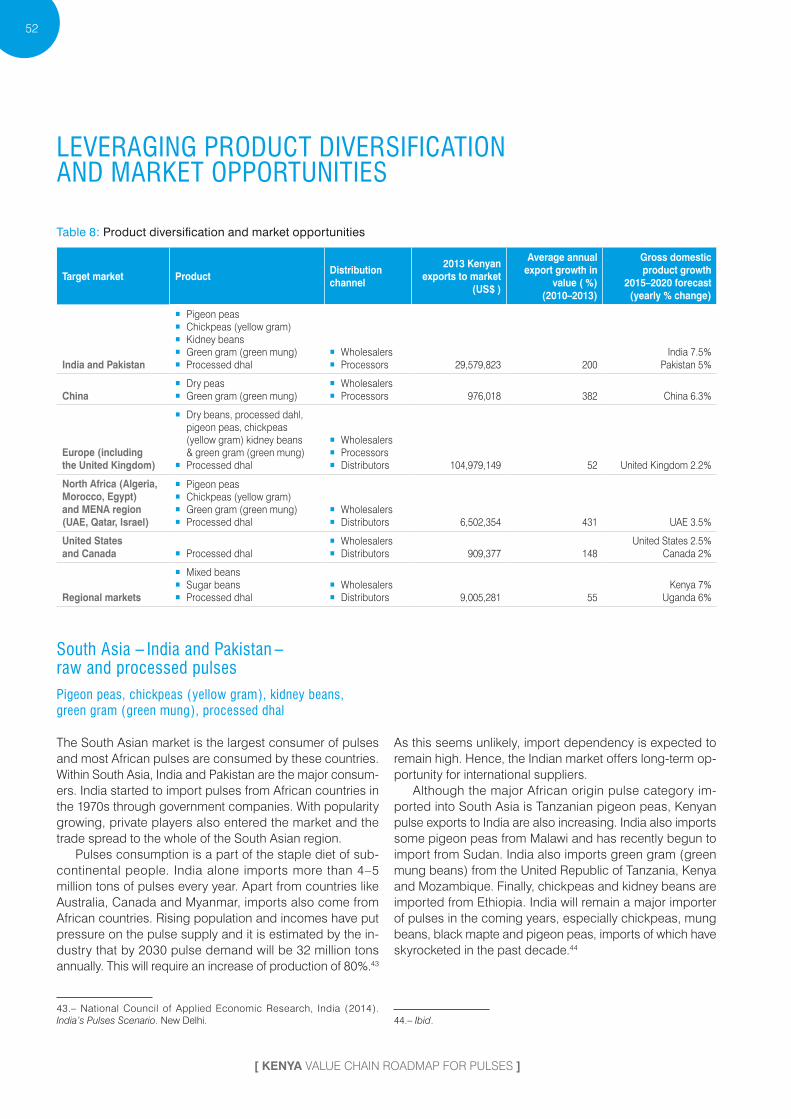
52
[ KENYA Value Chain Roadmap foR pulSeS ]
leVeRaging pRoduCt diVeRsifiCation and maRket oppoRtunities
Table 8 : Product diversification and market opportunities
Target market ProductDistribution channel
2013 Kenyan exports to market
( US $ )
Average annual export growth in
value ( % ) ( 2010–2013 )
Gross domestic product growth
2015–2020 forecast( yearly % change )
India and Pakistan
� Pigeon peas � Chickpeas ( yellow gram ) � Kidney beans � Green gram ( green mung ) � Processed dhal
� Wholesalers � Processors 29,579,823 200
India 7.5 %Pakistan 5 %
China � Dry peas � Green gram ( green mung )
� Wholesalers � Processors 976,018 382 China 6.3 %
Europe ( including the United Kingdom )
� Dry beans, processed dahl, pigeon peas, chickpeas ( yellow gram ) kidney beans & green gram ( green mung )
� Processed dhal
� Wholesalers � Processors � Distributors 104,979,149 52 United Kingdom 2.2 %
North Africa ( Algeria, Morocco, Egypt ) and MENA region ( UAE, Qatar, Israel )
� Pigeon peas � Chickpeas ( yellow gram ) � Green gram ( green mung ) � Processed dhal
� Wholesalers � Distributors 6,502,354 431 UAE 3.5 %
United States and Canada � Processed dhal
� Wholesalers � Distributors 909,377 148
United States 2.5 %Canada 2 %
Regional markets
� Mixed beans � Sugar beans � Processed dhal
� Wholesalers � Distributors 9,005,281 55
Kenya 7 %Uganda 6 %
south asia – india and pakistan – raw and processed pulsespigeon peas, chickpeas ( yellow gram ), kidney beans, green gram ( green mung ), processed dhal
The South Asian market is the largest consumer of pulses and most African pulses are consumed by these countries. Within South Asia, India and Pakistan are the major consum-ers. India started to import pulses from African countries in the 1970s through government companies. With popularity growing, private players also entered the market and the trade spread to the whole of the South Asian region.
Pulses consumption is a part of the staple diet of sub-continental people. India alone imports more than 4–5 million tons of pulses every year. Apart from countries like Australia, Canada and Myanmar, imports also come from African countries. Rising population and incomes have put pressure on the pulse supply and it is estimated by the in-dustry that by 2030 pulse demand will be 32 million tons annually. This will require an increase of production of 80 %.43
43.– National Council of Applied Economic Research, India ( 2014 ). India’s Pulses Scenario. New Delhi.
As this seems unlikely, import dependency is expected to remain high. Hence, the Indian market offers long-term op-portunity for international suppliers.
Although the major African origin pulse category im-ported into South Asia is Tanzanian pigeon peas, Kenyan pulse exports to India are also increasing. India also imports some pigeon peas from Malawi and has recently begun to import from Sudan. India also imports green gram ( green mung beans ) from the United Republic of Tanzania, Kenya and Mozambique. Finally, chickpeas and kidney beans are imported from Ethiopia. India will remain a major importer of pulses in the coming years, especially chickpeas, mung beans, black mapte and pigeon peas, imports of which have skyrocketed in the past decade.44
44.– Ibid.

[ THE WAY FORWARD ]
53
In April 2014 the Government of India extended the ban on exports of pulses until further orders, but allowed outbound shipments of kabuli chana, organic pulses and lentils with some riders from the Directorate General of Foreign Trade:
Prohibition on export of pulses has been extended till further orders. But, there are two exceptions to this. One is export of Kabuli Chana. Second is export of organic pulses and lentils, but with a ceiling of 10 million tons per annum and subject to certain conditions.
Export of pulses was initially prohibited for a period of six months in 2006, which was extended from time to time.
Pakistan imports various types of pulses from Australia, Canada, Ethiopia and a few other countries. For chickpeas, the major exporter from Africa is Ethiopia. Although domes-tic supply increased in 2012 / 13 and reduced imports, the trend has reversed and imports soared again in 2013 / 14. As per the Pakistan Bureau of Statistics, the import volume of pulses surged by 71 % to 61,738 tons in February 2015 from 36,175 tons in February 2014.45 2015 has been another bad year for pulses in Pakistan, as production has gone down by nearly 40 %. Against its total requirement of around 1 million tons, the production has been 600,000 tons.46
Kenya has an opportunity to increase its exports to India as it has already been exporting green gram ( mung beans ) and pigeon peas to India. Many Indian processors know Kenyan origin pulses. India imports roughly 3.5 % of its total imports of mung beans and 1.5 % of its pigeon peas from Kenya. This may be small but can be increased.
However, for the medium term, opportunities for exports of processed pulses ( dhal ) to India are exciting. The Indian Government does not discourage processed imports and as the processing cost is lower in Kenya, the opportunity is high. Pulse processing should be a key component of the future value chain and its market development capacities to South Asia and beyond.
Kenya is a new entrant in the pulses industry and has to compete with the United Republic of Tanzania and Malawi for the market. However, green gram ( mung beans ) is a type where Kenya has an edge. It is also ready to launch
45.– Online Indus News ( 2015 ). Pulses import rises by 37 %, 24 March. Available from http : // www.onlineindus.com / pulses-import-rises-by-37 / .46.– The Dawn ( 2015 ). Another dal crisis : Pakistan is jailing shopkeepers to combat pulse shortage, 20 October. Available from http : / /scroll.in / arti-cle / 763514 / another-daal-crisis-pakistan-is-jailing-shopkeepers-as-it-com-bats-pulse-shortage.
improved varieties of pigeon peas. Since the volume of business is smaller, medium-sized pulse processors and distributors ( 20–50 tons per day ) in India and Pakistan who had been importing pulses from East Africa have begun exploring the possibility of setting up trading offices in the region. The competition for them is lower in Kenya than in the United Republic of Tanzania and Malawi.
The rising prices of pulses in India and the somewhat monopolistic approach of the large-scale traders from Africa has led Indian buyers and investors to look for alternatives and to cut out middlemen and directly source their inputs. Existing trade relations are helping them in this. These in-vestors are looking for an investment opportunity in pulse processing and should be targeted for investment promo-tion. Investors look for cost advantage that can be obtained by exporting only dhal as opposed to raw pulses, which includes the parts of the pulses that will eventually become a waste by-product of processing. Therefore, most of the Indian and Pakistani traders planning to invest in Kenya can be expected to pursue processing at a later stage, once supply has been established, if they find the investment cli-mate conducive. With the attractiveness of Kenya being su-perior to other competing countries in the region, attracting FDI to critical agribusiness sectors and services will need a focused approach to lay the groundwork for higher value added food processing in the longer term.
The expansion of the market in India and Pakistan and the increased activities of traders in procurement and pro-cessing of pulses will expand the future value chain and introduce more traders, leading to marginally better prices for producers, better understanding of quality grades, and competitive pressure on other traders to secure supply through contracts. The broadening of the pulse process-ing base in Kenya is an important step towards making the processing of higher value added food products feasible in the country.
In the future value chain, to further penetrate the Indian market with the export of raw pulses, it is essential to : im-prove seed quality and availability ; strengthen the input dis-tribution network, including finance ; develop agribusiness services and enhance storage, warehouses and logistics ; and strengthen technical capacities of agencies like KEBS and EPC in investor targeting for the pulses sector.
China : raw and processed pulses
types of pulses – dry peas, green gram ( green mung )
China continues to play a unique and essential role in just about any global market imaginable, and pulses are no ex-ception. After India, China is the second major player in the Asian market. China was a net exporter of pulses for years but recently, with its growing middle class, increasing in-come levels, changing dietary habits and expanding taste for pulses, it is expected that demand will outstrip supply in the future. China has now started to import pulses such as

54
[ KENYA Value Chain Roadmap foR pulSeS ]
dry peas. China was a major exporter of black beans in the world until the rising costs of production in Chinese agricul-ture posed a challenge. Also, the black bean producing area in southwest China was faced with some challenges in 2013 as a result of massive floods which significantly reduced production. Since then China has lost some market share and this loss looks irreversible.
The new dynamics have led to increased imports of dry peas by China. Recently, China commissioned upgrading of new factories for the production of starch and vermicelli. This has resulted in huge imports of dry peas by China. The carry-over stock in 2014 kept imports low, to a level of 780,000 tons,47 but in the long term this is expected to rise. Also, Chinese dietary habits are changing and dry peas are being increasingly consumed as snacks and other food. This will also keep increasing and as a result China is ex-pected to emerge as a major importer. In addition to dry peas, imports of green gram are also increasing in China.
As it is an expanding market, China is a viable export market for Kenyan pulses. Kenya has been exporting dry peas but has not exported to China. In addition, the mar-ket for green gram ( green mung beans ) is also expanding. This is an opportunity for Kenya. However, Kenyan exporters need support to establish this market as an export destina-tion. Exporters may face challenges in dealing with admin-istrative procedures on the Chinese side, as well as facing distribution challenges. A proper understanding of proce-dures will allow exporters to export greater quantities.
In similarity with India, China is increasingly demanding pulses and becoming a source of investment as domestic Chinese producers face rising production costs and seek to offshore pulse purchasing, production and processing. The expansion of the market has created opportunities for collaboration with China’s importers and processors. To ex-pand this market, Kenyan producers will need to understand the details of the varieties and types of pulses demanded and the procedural aspects of the trade.
europe ( including the united kingdom )
Beans, processed dhal, pigeon peas, chickpeas ( yellow gram ), kidney beans and green gram ( green mung )
Europe was a major importer of pulses, accounting for around 45 % of the world’s imports of pulses until 2004.48 However, since then Europe’s share has declined and now stands at about 22 % of world imports. Spain, France and the United Kingdom account for the majority of the con-sumption of pulses in Europe. The ways in which pulses are consumed are very different across Europe due to differ-ent regional food habits and traditions, and to differences
47.– As per industry estimates by experts at various conferences.48.– Food and Agriculture Organization of the United Nations ( 2015 ). Statistics database. Available from http : / /faostat3.fao.org / download / T / * / E. Accessed 5 August 2015.
in the supplies of grain legumes. Canned products domi-nate pulse sales as opposed to pulses sold in packets. Dry beans are the most consumed but the preference between varieties varies according to country.
Europe is showing a reversal of this trend and a recent increase in preferences for vegan and gluten-free diets can help restore growth in the demand for pulses in Europe. A major challenge for exports to Europe concerns the quality standards that must be reached, both at a technical regula-tion level and private standards set by supermarkets and distributors.
While Kenya has been exporting pulses like dry peas and others to several European countries such as France, Spain, the Netherlands and the United Kingdom, quantities remain low. The increasing preference for gluten-free diets and the movement from animal protein to vegetable protein in recent years has opened up new opportunities for Kenyan exports with the gradual increase in demand for processed pulses.
Further, the ban on export of processed dhal from India has also created opportunity for Kenya in the dhal indus-try. The Asian diaspora in the United Kingdom has a high demand for processed dhal, which can be exported from Kenya. However, challenges exist pertaining to standards compliance and quality requirements, particularly for pro-cessed dhal.
mena region
types of pulses – green gram ( green mung ) pigeon peas, chickpeas ( yellow gram ) ( including processed dhal )
The MENA markets are a high potential market for pulses. Algeria is one of the largest importers of lentils. Pulses such as chickpeas, lentils, peas and beans feature prominently in the cuisine of MENA countries. In addition to traditional uses for pulses like soups, tagines, curries and hummus, pulses can also be added to processed meats, frozen pre-pared meals and salads for a nutritional boost. They can also be used to enhance baked goods, snacks, beverages and dairy products. This region has high population growth rates and many countries are seeing extraordinary growth in food services and retail sales. Its massive potential as a trading region is just beginning to be realized. Consumers in the MENA region are increasingly using supermarkets for food purchases, which has in turn led to an increase in demand for processed pulses such as canned pulses and pulse flours.
There is also a boom in the hospitality industry, and as a result new cuisines are being introduced. Countries like Morocco, Egypt and Israel, and the city of Dubai ( UAE ) are showing extraordinary growth in the hotel industry. This is pushing the demand for pulses, as well as other food crops, to new levels. Algeria is already one of the largest consum-ers of lentils in the world. Hence, the demand for pulses is on the rise among both traditional consumers and new
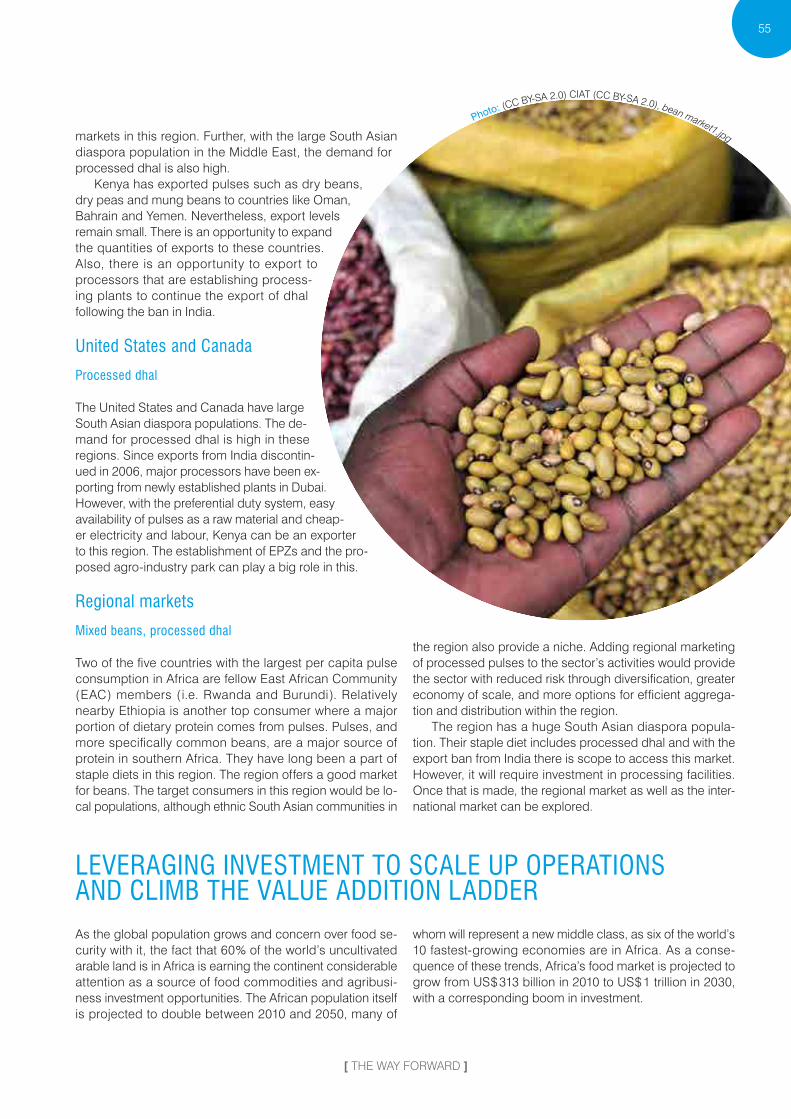
Photo: (CC BY-SA 2.0) CIAT (CC BY-SA 2.0), bean market1.Apg
[ THE WAY FORWARD ]
55
markets in this region. Further, with the large South Asian diaspora population in the Middle East, the demand for processed dhal is also high.
Kenya has exported pulses such as dry beans, dry peas and mung beans to countries like Oman, Bahrain and Yemen. Nevertheless, export levels remain small. There is an opportunity to expand the quantities of exports to these countries. Also, there is an opportunity to export to processors that are establishing process-ing plants to continue the export of dhal following the ban in India.
united states and Canada
processed dhal
The United States and Canada have large South Asian diaspora populations. The de-mand for processed dhal is high in these regions. Since exports from India discontin-ued in 2006, major processors have been ex-porting from newly established plants in Dubai. However, with the preferential duty system, easy availability of pulses as a raw material and cheap-er electricity and labour, Kenya can be an exporter to this region. The establishment of EPZs and the pro-posed agro-industry park can play a big role in this.
Regional markets
mixed beans, processed dhal
Two of the five countries with the largest per capita pulse consumption in Africa are fellow East African Community ( EAC ) members ( i.e. Rwanda and Burundi ). Relatively nearby Ethiopia is another top consumer where a major portion of dietary protein comes from pulses. Pulses, and more specifically common beans, are a major source of protein in southern Africa. They have long been a part of staple diets in this region. The region offers a good market for beans. The target consumers in this region would be lo-cal populations, although ethnic South Asian communities in
the region also provide a niche. Adding regional marketing of processed pulses to the sector’s activities would provide the sector with reduced risk through diversification, greater economy of scale, and more options for efficient aggrega-tion and distribution within the region.
The region has a huge South Asian diaspora popula-tion. Their staple diet includes processed dhal and with the export ban from India there is scope to access this market. However, it will require investment in processing facilities. Once that is made, the regional market as well as the inter-national market can be explored.
leVeRaging inVestment to sCale up opeRations and ClimB the Value addition laddeRAs the global population grows and concern over food se-curity with it, the fact that 60 % of the world’s uncultivated arable land is in Africa is earning the continent considerable attention as a source of food commodities and agribusi-ness investment opportunities. The African population itself is projected to double between 2010 and 2050, many of
whom will represent a new middle class, as six of the world’s 10 fastest-growing economies are in Africa. As a conse-quence of these trends, Africa’s food market is projected to grow from US $ 313 billion in 2010 to US $ 1 trillion in 2030, with a corresponding boom in investment.

56
[ KENYA Value Chain Roadmap foR pulSeS ]
A US $ 500 million investment announced by Syngenta across multiple African countries is an example of the sort of large-scale investment which is becoming possible and which Kenya could be targeting. Syngenta plans to make the investment over 10 years in local production, logistics, distribution channel development, recruitment, and training for seed and crop-protection products.
Kenya’s strengths in terms of attracting investment are its higher levels of industrialization, worker skills, connectiv-ity with international commodity markets, a domestic trade deficit in pulses, and duty-free EPZs which allow 20 % of production to be sold domestically.
Certain investments will become feasible only after the efficient organization of regional pulse markets and exten-sion of financing to vastly more smallholder farmers. For international investors, Kenya may become attractive in the medium term as an export-oriented processing centre or as a regional trading hub for pulses produced throughout East Africa.
However, full realization of this role as a market hub de-pends on the ability of Kenyan market actors and public stakeholders to organize the East African pulse market, which is characterized today by weak market information and inefficient marketing channels, simultaneously lower-ing farmer incomes and raising the price of pulses. Kenya’s relative position in the region as a producer and consumer of white maize is similar, yet Nairobi has established itself as a price-setting exchange centre for East African white maize on the relative strength and organization of a few large trad-ers and public agricultural institutions.
pulse tRading and pRoCessing
In the short term, trading in pulses is the main opportunity likely to attract foreign investors. Medium-sized pulse pro-cessors and distributors ( 20–50 tons per day ) in India and Pakistan who had been sourcing pulses from East Africa have begun exploring the possibility of setting up trading offices in the region. This appears to be stimulated by the competitive threat of Export Trading Group expanding from Africa-based trading alone into processing and distribution in its South Asian markets. As such, these investors present very immediate opportunities for investment generation in the pulses sector and should be targeted for investment promotion as quickly as possible, before they choose to establish in the United Republic of Tanzania or elsewhere.
Primary production of pulses on a large scale has not historically been an activity to attract FDI ; however, there is significant investment opportunity for existing domestic farmers to expand pulse production. Kenya is a global lead-er in pigeon pea production ( fifth in 2012 ) and dry beans ( eighth in 2012 ), with significant room for expanded produc-tion, especially considering the suitability of red and green gram as an intercrop with several of Kenya’s major cash crops : maize, sugar and sorghum. At the same time, global
demand is growing for pulses as a heart-healthy food and may be boosted further by the United Nations designation of 2016 as the International Year of Pulses.
Traders and processors with experience in contract farm-ing arrangements could have an important effect on total production and the organization of the Kenyan market, but such companies depend on tight control over inputs. High-quality imported seeds are a key input, and high-quality seed pulses are themselves a likely output for sale in pre-mium markets.
At the same time, the seed law in its current form may represent a sort of opportunity for investment promoters. Specifically, a seed company wanting to do business in Kenya would find more favourable treatment by incorporat-ing an affiliate in the country than by trying to export seeds to it. Monsanto, for example, already has a vegetable seed division in Nairobi, which might be enticed to develop high-quality seed pulses for Kenya if it saw a substantial market for them forming.
agRiBusiness inputs and seRViCes
Perhaps the most attractive investments in the pulses sector are those that go beyond pulses specifically and have much larger markets in agribusiness generally, such as seeds, farm machinery and agrochemicals. Almost 75 % of Kenyans depend on agriculture in one way or another for their liveli-hoods, yet agriculture is largely conducted by smallholder farmers who make little use of the most modern inputs.
Table 9 presents the group of companies which collec-tively control large majorities of the global markets in their given fields. These are not the only potential investors and smaller regional companies may be better poised to move quickly into Kenya given their proximity and knowledge of the country. However, world-leading companies wanting to retain that leadership are likely to consider expansion into Africa more and more as the continent is given increasing importance in global food strategies. Conversely, realizing full potential for agribusiness is more likely if the world’s lead-ing players are involved in the scaling up of its production.
Furthermore, most of the companies in table 9 already have presences in the region. Future investment projects in Kenya might originate with headquarters or with these regional affiliates. For the companies with no presence cur-rently in Kenya, a first venture would likely take the form of a sales office. Although this does not create the jobs, technol-ogy spillovers or skill spillovers of a manufacturing project, for example, the possibility of a sales office should not be dismissed by investment promoters as being of low value. A first sales office is an opportunity for a foreign company to make tentative entry into a new market, learning the busi-ness landscape and achieving a level of comfort. Of more immediate importance, it can provide Kenya’s pulses sector with valuable access to more affordable, high-quality inputs that are essential to the strengthening of the sector.

[ THE WAY FORWARD ]
57
Table 9 : Value chain segments needing FDI and likely sources
Value chain segments where FDI is needed and viable
Leading companies with foreign affiliates in Eastern
and Southern AfricaSource country
Eastern and Southern African countries with an existing affiliate
Seeds, fertilizers, and pesticides – sales, distribution, manufacturing, and research and development
BASF Germany South Africa
Bayer Crop Science Germany Mozambique, South Africa, Sudan, Zambia, Zimbabwe
Dow AgroSciences United States South Africa
DuPont ( Pioneer ) United StatesEthiopia, Kenya, South Africa, United Republic of Tanzania,
Zambia, Zimbabwe
KWS ( seeds ) Germany Kenya, South Africa, Sudan
Monsanto United States Kenya, Malawi, South Africa, Zimbabwe
Syngenta SwitzerlandEthiopia, Kenya, Mozambique, South Africa, Sudan, United
Republic of Tanzania, Zambia, Zimbabwe
Farm machinery and equipment – sales, distribution, manufacturing, operation, maintenance and repair
AGCO United States None
CLAAS Germany None
CNH Netherlands South Africa
John Deere United States South Africa
Kubota JapanKenya, Madagascar, Mozambique, South Africa, United
Republic of Tanzania, Uganda
SAME Deutz-Fahr Italy None
Animal feed – manufacturing, and research and development
Brasil Foods Brazil None
Cargill United States Kenya, Mozambique, South Africa, Zambia, Zimbabwe
Charoen Pokphand Thailand None
New Hope Group China None
Tyson Foods United States None
Vertically integrated trading, including warehousing, transportation and risk management ( as well as agricultural consulting and manufacturing of biofuels and animal feed in some cases )
Archer Daniels Midland United States None
Bunge United States Kenya, South Africa
Cargill United States Kenya, Mozambique, South Africa, Zambia, Zimbabwe
Louis Dreyfus Commodities Netherlands Kenya, South Africa
Quality testing and certification Cotecna Switzerland South Africa
Intertek United KingdomDjibouti, Kenya, Mozambique, South Africa, United Republic of
Tanzania, Uganda
NSF United States South Africa
SCS United States None ( only Ghana in Africa )
SGS Switzerland
Burundi, Djibouti, Ethiopia, Kenya, Madagascar, Malawi, Mauritius, Mozambique, South Africa, United Republic of
Tanzania, Uganda, Zambia, Zimbabwe
Sources : Shand, Hope ( 2012 ) ; Noealt Corporate Services ( 2013 ) ; Peter Best and Ken Jennison ( 2012 ) ; Murphy, S., Burch, D. and Clapp, J. ( 2012 ) ; and company websites.
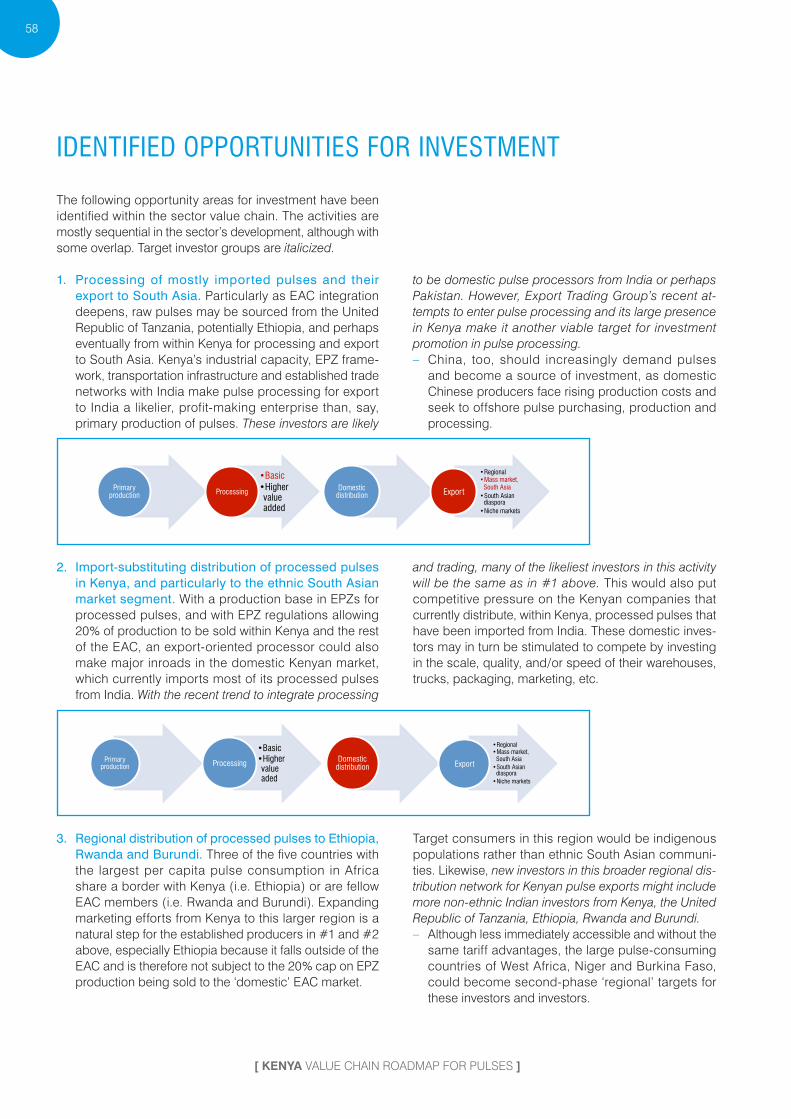
58
[ KENYA Value Chain Roadmap foR pulSeS ]
identified oppoRtunities foR inVestment
The following opportunity areas for investment have been identified within the sector value chain. The activities are mostly sequential in the sector’s development, although with some overlap. Target investor groups are italicized.
1. Processing of mostly imported pulses and their export to South Asia. Particularly as EAC integration deepens, raw pulses may be sourced from the United Republic of Tanzania, potentially Ethiopia, and perhaps eventually from within Kenya for processing and export to South Asia. Kenya’s industrial capacity, EPZ frame-work, transportation infrastructure and established trade networks with India make pulse processing for export to India a likelier, profit-making enterprise than, say, primary production of pulses. These investors are likely
to be domestic pulse processors Arom India or perhaps Pakistan. However, Export Trading Group’s recent at-tempts to enter pulse processing and its large presence in Kenya make it another viable target Aor investment promotion in pulse processing. – China, too, should increasingly demand pulses
and become a source of investment, as domestic Chinese producers face rising production costs and seek to offshore pulse purchasing, production and processing.
Primary production
• Basic • Higher value added
Processing Domestic
distribution
• Regional • Mass market,
South Asia • South Asian
diaspora • Niche markets
Export
2. Import-substituting distribution of processed pulses in Kenya, and particularly to the ethnic South Asian market segment. With a production base in EPZs for processed pulses, and with EPZ regulations allowing 20 % of production to be sold within Kenya and the rest of the EAC, an export-oriented processor could also make major inroads in the domestic Kenyan market, which currently imports most of its processed pulses from India. With the recent trend to integrate processing
and trading, many oA the likeliest investors in this activity will be the same as in #1 above. This would also put competitive pressure on the Kenyan companies that currently distribute, within Kenya, processed pulses that have been imported from India. These domestic inves-tors may in turn be stimulated to compete by investing in the scale, quality, and / or speed of their warehouses, trucks, packaging, marketing, etc.
Primary production
• Basic • Higher value aded
Processing Domestic
distribution
• Regional • Mass market,
South Asia • South Asian
diaspora • Niche markets
Export
3. Regional distribution of processed pulses to Ethiopia, Rwanda and Burundi. Three of the five countries with the largest per capita pulse consumption in Africa share a border with Kenya ( i.e. Ethiopia ) or are fellow EAC members ( i.e. Rwanda and Burundi ). Expanding marketing efforts from Kenya to this larger region is a natural step for the established producers in #1 and #2 above, especially Ethiopia because it falls outside of the EAC and is therefore not subject to the 20 % cap on EPZ production being sold to the ‘domestic’ EAC market.
Target consumers in this region would be indigenous populations rather than ethnic South Asian communi-ties. Likewise, new investors in this broader regional dis-tribution network Aor Kenyan pulse exports might include more non-ethnic Indian investors Arom Kenya, the United Republic oA Tanzania, Ethiopia, Rwanda and Burundi. – Although less immediately accessible and without the
same tariff advantages, the large pulse-consuming countries of West Africa, Niger and Burkina Faso, could become second-phase ‘regional’ targets for these investors and investors.
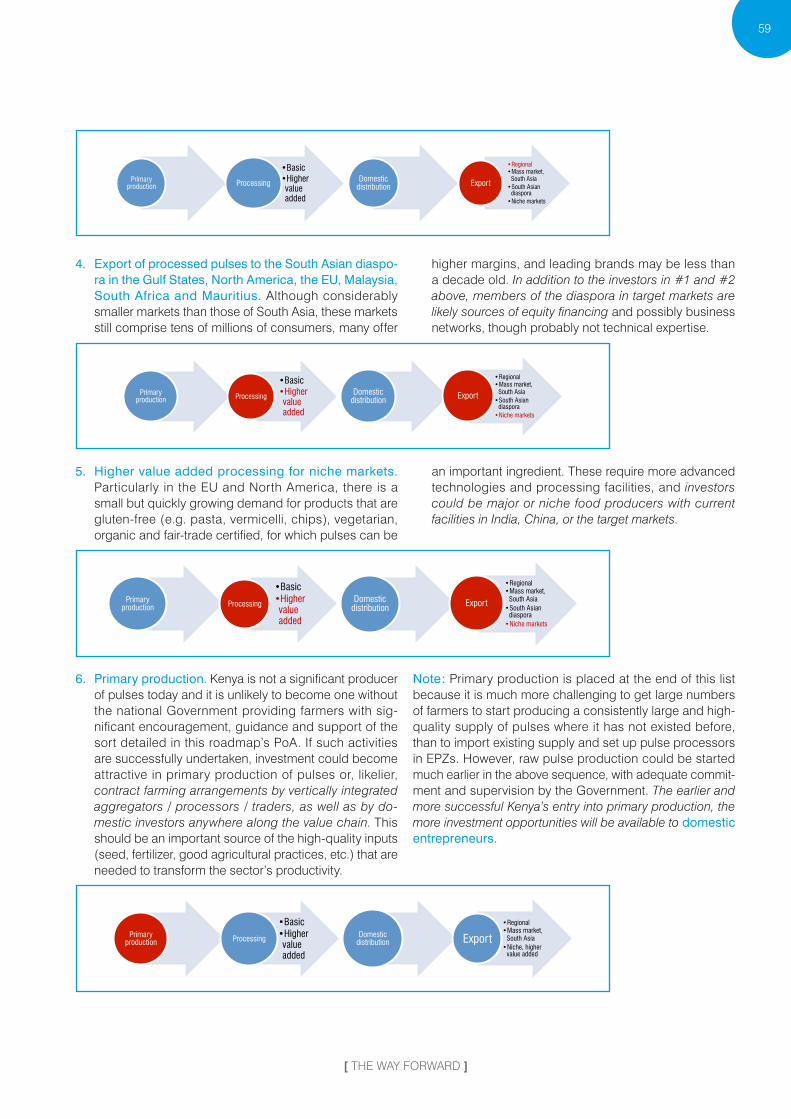
[ THE WAY FORWARD ]
59
Primary production
• Basic • Higher value added
Processing Domestic
distribution
• Regional • Mass market,
South Asia • South Asian
diaspora • Niche markets
Export
4. Export of processed pulses to the South Asian diaspo-ra in the Gulf States, North America, the EU, Malaysia, South Africa and Mauritius. Although considerably smaller markets than those of South Asia, these markets still comprise tens of millions of consumers, many offer
higher margins, and leading brands may be less than a decade old. In addition to the investors in #1 and #2 above, members oA the diaspora in target markets are likely sources of equity financing and possibly business networks, though probably not technical expertise.
Primary production
• Basic • Higher value added
Processing Domestic
distribution
• Regional • Mass market,
South Asia • South Asian
diaspora • Niche markets
Export
5. Higher value added processing for niche markets. Particularly in the EU and North America, there is a small but quickly growing demand for products that are gluten-free ( e.g. pasta, vermicelli, chips ), vegetarian, organic and fair-trade certified, for which pulses can be
an important ingredient. These require more advanced technologies and processing facilities, and investors could be maAor or niche Aood producers with current Aacilities in India, China, or the target markets.
Primary production
• Basic • Higher value added
Processing Domestic
distribution
• Regional • Mass market,
South Asia • South Asian
diaspora • Niche markets
Export
6. Primary production. Kenya is not a significant producer of pulses today and it is unlikely to become one without the national Government providing farmers with sig-nificant encouragement, guidance and support of the sort detailed in this roadmap’s PoA. If such activities are successfully undertaken, investment could become attractive in primary production of pulses or, likelier, contract Aarming arrangements by vertically integrated aggregators / processors / traders, as well as by do-mestic investors anywhere along the value chain. This should be an important source of the high-quality inputs ( seed, fertilizer, good agricultural practices, etc. ) that are needed to transform the sector’s productivity.
Note : Primary production is placed at the end of this list because it is much more challenging to get large numbers of farmers to start producing a consistently large and high-quality supply of pulses where it has not existed before, than to import existing supply and set up pulse processors in EPZs. However, raw pulse production could be started much earlier in the above sequence, with adequate commit-ment and supervision by the Government. The earlier and more successAul Kenya’s entry into primary production, the more investment opportunities will be available to domestic entrepreneurs.
Primary production
• Basic • Higher value added
Processing Domestic
distribution
• Regional • Mass market,
South Asia • Niche, higher
value added
Export
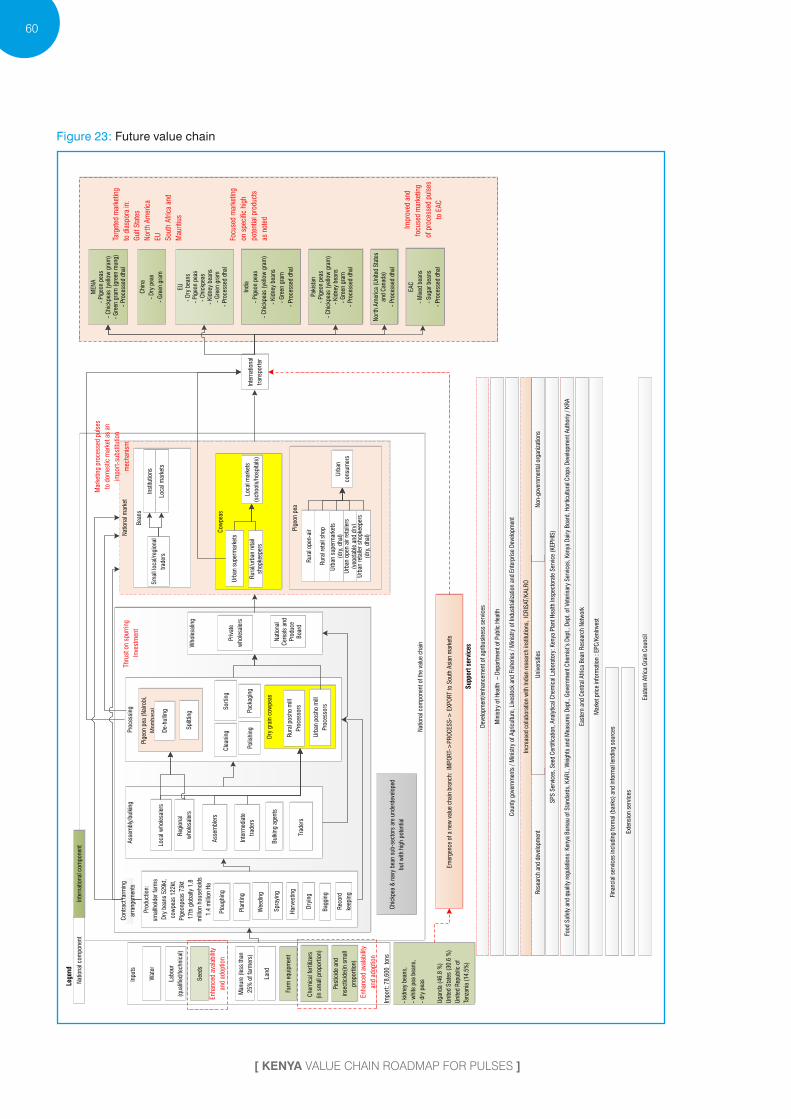
60
[ KENYA Value Chain Roadmap foR pulSeS ]
Figure 23 : Future value chain
Nat
iona
l com
pone
nt o
f th
e va
lue
chai
n
Nat
iona
l mar
ket
Food
Saf
ety
and
qual
ity r
egul
atio
ns: K
enya
Bur
eau
of S
tand
ards
, KA
RI.,
Wei
ghts
and
Mea
sure
s D
ept.,
Gov
ernm
ent C
hem
ist’s
Dep
t., D
ept.
of V
eter
inar
y S
ervi
ces,
Ken
ya D
airy
Boa
rd, H
ortic
ultu
ral C
rops
Dev
elop
men
t Aut
horiy
/ K
RA
Cou
nty
gove
rnm
ents
/ M
inis
try
of A
gric
ultu
re, L
ives
tock
and
Fis
herie
s /
Min
istr
y of
Indu
stria
lizat
ion
and
Ente
rpris
e D
evel
opm
ent
SP
S S
ervi
ces,
See
d C
ertif
icat
ion,
Ana
lytic
al C
hem
ical
Lab
orat
ory:
Ken
ya P
lant
Hea
lth In
spec
tora
te S
ervi
ce (
KEP
HIS
)
Suppor
t se
rvic
es
Res
earc
h an
d de
velo
pmen
t
Min
istr
y of
Hea
lth –
Dep
artm
ent o
f P
ublic
Hea
lth
Inpu
ts
See
ds
Che
mic
al f
ertil
izer
s
(in
smal
l pro
port
ion)
Farm
equ
ipm
ent
Labo
ur
(qua
lifie
d/te
chni
cal)
Land
Wat
er
Pes
ticid
e an
d
inse
ctic
ide(
in s
mal
l
prop
ortio
n)
Pro
duct
ion:
smal
lhol
der
farm
s
Dry
bea
ns 5
29
kt,
cow
peas
12
2kt
,
Pig
eonp
eas
73
kt
17
th g
loba
lly 1
.8
mill
ion
hous
ehol
ds
1.4
mill
ion
Ha
Plo
ughi
ng
Pla
ntin
g
Wee
ding
Ass
embl
y/bu
lkin
g
Loca
l who
lesa
lers
Reg
iona
l
who
lesa
lers
Ass
embl
ers
Inte
rmed
iate
trad
ers
Bul
king
age
nts
Trad
ers
Pro
cess
ing
Pig
eon
pea
(Nai
robi
,
Mom
basa
)
De-
hulli
ng
Spl
ittin
g
Cle
anin
g S
ortin
g
Inte
rnat
iona
l
tran
spor
ter
Man
ure
(les
s th
an
25
% o
f fa
rmer
s)
Dry
gra
in c
owpe
as
Rur
al p
osho
mill
Pro
cess
ors
Urb
an p
osho
mill
Pro
cess
ors
Bea
ns
Loca
l mar
kets
Pig
eon
pea
Incr
ease
d co
llabo
ratio
n w
ith In
dian
res
earc
h in
stitu
tions
, IC
RIS
AT/K
ALR
O
Uni
vers
ities
Indi
a
- P
igeo
n pe
as
- C
hick
peas
(ye
llow
gra
m)
- K
idne
y be
ans
- G
reen
gra
m
- P
roce
ssed
dha
l
MEN
A-
Pig
eon
peas
- C
hick
peas
(ye
llow
gra
m)
- G
reen
gra
m (
gree
n m
ung)
- P
roce
ssed
dha
l
Cow
peas
Non
-gov
ernm
enta
l org
aniz
atio
ns
East
ern
and
Cen
tral
Afr
ica
Bea
n R
esea
rch
Net
wor
k
Mar
ket p
rice
info
rmat
ion
: EP
C/K
enIn
vest
Fina
ncia
l ser
vice
s in
clud
ing
form
al (
bank
s) a
nd in
form
al le
ndin
g so
urce
s
Exte
nsio
n se
rvic
es
Inst
itutio
ns
Who
lesa
ling
Priv
ate
who
lesa
lers
Nat
iona
l C
erea
ls a
nd
Pro
duce
B
oard
Loca
l mar
kets
(sch
ools
/hos
pita
ls)
Urb
an s
uper
mar
kets
Rur
al/u
rban
ret
ail
shop
keep
ers
Sm
all l
ocal
/reg
iona
l
trad
ers
Urb
an s
uper
mar
kets
(d
ry, d
hal)
Urb
an
cons
umer
sU
rban
ope
n ai
r re
taile
rs
(veg
etab
le a
nd d
ry)
Urb
an r
etai
ler
shop
keep
ers
(dry
, dha
l)
Legen
d
Nat
iona
l com
pone
ntIn
tern
atio
nal c
ompo
nent
East
ern
Afr
ica
Gra
in C
ounc
il
Rur
al o
pen-
air
Rur
al r
etai
l sho
p
Chi
ckpe
a &
nav
y be
an s
ub-s
ecto
rs a
re u
nder
deve
lope
d
but w
ith h
igh
pote
ntia
l
Pak
ista
n-
Pig
eon
peas
- C
hick
peas
(ye
llow
gra
m)
- K
idne
y be
ans
- G
reen
gra
m
- P
roce
ssed
dha
l
EAC
- M
ixed
bea
ns
- S
ugar
bea
ns
- P
roce
ssed
dha
l
Nor
th A
mer
ica
(Uni
ted
Sta
tes
and
Can
ada)
- P
roce
ssed
dha
l
Spr
ayin
g
Har
vest
ing
Dry
ing
Bag
ging
Pol
ishi
ngP
acka
ging
Rec
ord
keep
ing
Impo
rt: 7
8,6
00
ton
s
- ki
dney
bea
ns,
- w
hite
pea
bea
ns,
- dr
y pe
as
Uga
nda
(46
.8 %
)
Uni
ted
Sta
tes
(30
.6 %
)
Uni
ted
Rep
ublic
of
Tanz
ania
(1
4.5
%)
Enha
nced
ava
labi
lity
and
adop
tion
Enha
nced
ava
labi
lity
and
adop
tion
Dev
elop
men
t/en
hanc
emen
t of
agrib
usin
ess
serv
ices
Thru
st o
n sp
urrin
g
Inve
stm
ent
Emer
genc
e of
a n
ew v
alue
cha
in b
ranc
h: I
MP
OR
T->
PR
OC
ESS
-> E
XPO
RT
to S
outh
Asi
an m
arke
ts
Mar
ketin
g pr
oces
sed
puls
es
to d
omes
tic m
arke
t as
an
impo
rt-s
ubst
itutio
n
mec
hani
sm
Impr
oved
and
focu
sed
mar
ketin
g
of p
roce
ssed
pul
ses
to E
AC
Targ
eted
mar
ketin
g
to d
iasp
ora
in:
Gul
f S
tate
s
Nor
th A
mer
ica
EU Sou
th A
fric
a an
d
Mau
ritiu
s
Con
trac
t far
min
g
arra
ngem
ents
EU-
Dry
bea
ns
- P
igeo
n pe
as-
Chi
ckpe
as
- K
idne
y be
ans
- G
reen
gra
m-
Pro
cess
ed d
hal
Chi
na
- D
ry p
eas
- G
reen
gra
m
Focu
sed
mar
ketin
g
on s
peci
fic h
igh
pote
ntia
l pro
duct
s
as n
oted
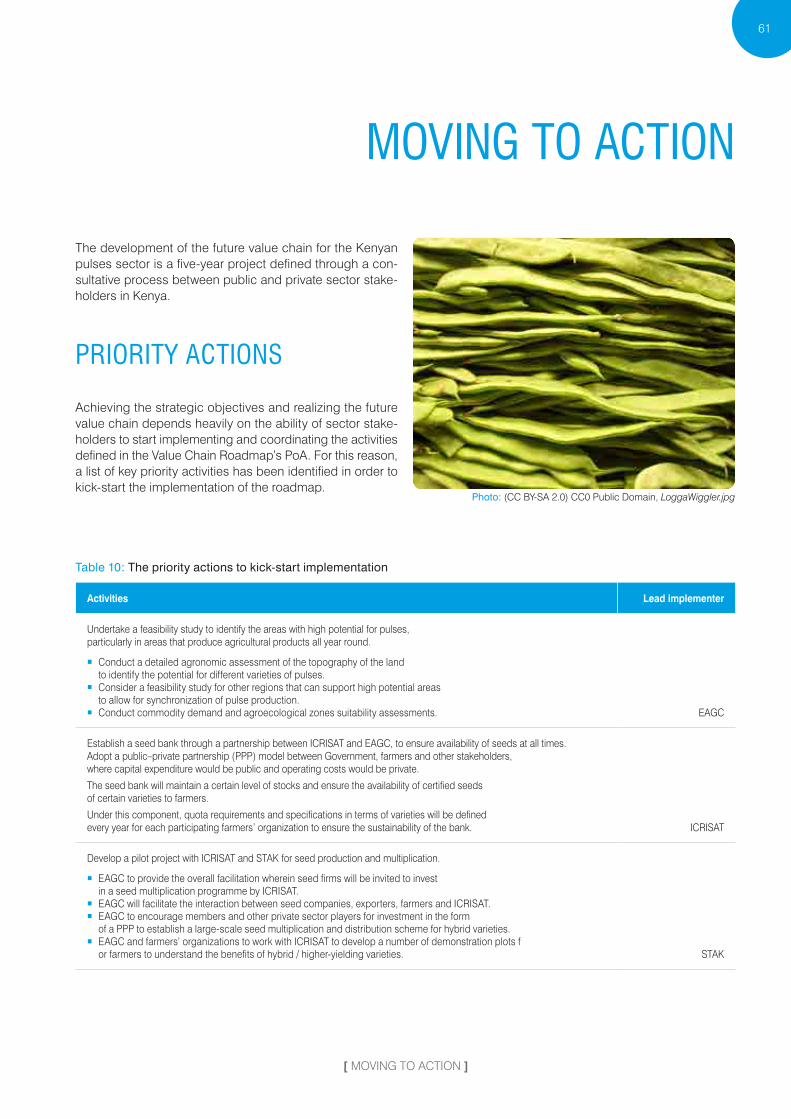
Photo: (CC BY-SA 2.0) CC0 Public Domain, LoggaWiggler.Apg
[ MOVING TO ACTION ]
61
moVing to aCtion
The development of the future value chain for the Kenyan pulses sector is a five-year project defined through a con-sultative process between public and private sector stake-holders in Kenya.
pRioRity aCtions
Achieving the strategic objectives and realizing the future value chain depends heavily on the ability of sector stake-holders to start implementing and coordinating the activities defined in the Value Chain Roadmap’s PoA. For this reason, a list of key priority activities has been identified in order to kick-start the implementation of the roadmap.
Table 10 : The priority actions to kick-start implementation
Activities Lead implementer
Undertake a feasibility study to identify the areas with high potential for pulses, particularly in areas that produce agricultural products all year round.
� Conduct a detailed agronomic assessment of the topography of the land to identify the potential for different varieties of pulses.
� Consider a feasibility study for other regions that can support high potential areas to allow for synchronization of pulse production.
� Conduct commodity demand and agroecological zones suitability assessments. EAGC
Establish a seed bank through a partnership between ICRISAT and EAGC, to ensure availability of seeds at all times. Adopt a public–private partnership ( PPP ) model between Government, farmers and other stakeholders, where capital expenditure would be public and operating costs would be private.
The seed bank will maintain a certain level of stocks and ensure the availability of certified seeds of certain varieties to farmers.
Under this component, quota requirements and specifications in terms of varieties will be defined every year for each participating farmers’ organization to ensure the sustainability of the bank. ICRISAT
Develop a pilot project with ICRISAT and STAK for seed production and multiplication.
� EAGC to provide the overall facilitation wherein seed firms will be invited to invest in a seed multiplication programme by ICRISAT.
� EAGC will facilitate the interaction between seed companies, exporters, farmers and ICRISAT. � EAGC to encourage members and other private sector players for investment in the form
of a PPP to establish a large-scale seed multiplication and distribution scheme for hybrid varieties. � EAGC and farmers’ organizations to work with ICRISAT to develop a number of demonstration plots f
or farmers to understand the benefits of hybrid / higher-yielding varieties. STAK
62
[ KENYA Value Chain Roadmap foR pulSeS ]
Activities Lead implementer
Identify, through detailed profiling, key farmers’ organizations ( identify an initial list of 10–15 farmers’ organizations in high potential areas ) operating in the selected counties ( including organizations that are not yet involved in pulses ) to serve as a nucleus for select pilot initiatives.
� Evaluate the reach of the farmers’ organizations. � Evaluate the past work done by the organizations in the pulses value chain
( or other commodities ). � Evaluate the implementation capacity of the different organizations. � Create a profile for each sector organization. CGA
Implement a pilot farms initiative – as a demonstrator initiative – for the production of the identified pulses in the selected areas. The pilot farm will be a focused farm that will be used to cultivate pulses with the view to providing a showcase for best practices and the potential of pulses. Assistance will be provided in terms of :
� Access to quality inputs ( including seeds ), including pesticides and fertilizers ( including training on safe application ) ; � Building capacities and knowledge on pulse production, including soil analysis and water management, sowing,
and protection from diseases and pest attacks ; � Developing the farmers’ organizations’ knowledge of the pulses market, including prices,
market requirements and global outlook ( including national, local, market ) ; � Training on farming and postharvest techniques ( cleaning, sorting, grading, drying, polishing, bagging, storage, etc. ) ; � Showcasing different pulse varieties and existing production technologies through pilot farms
with the support of scientists from KALRO and ICRISAT ; � Increasing the participation of farmers’ organizations in awareness-raising campaigns
on crop diversification and sustainability aspects ; � Assistance with identifying markets and buyers for the harvest. CGA
Develop and conduct a Training of Trainers programme ( four sessions of one week each ; two to four week courses ) with batches of 10–20 trainers per county coming from previously identified farmers’ organizations.
Training program curricula will be developed in collaboration with entities such as ICAR ( Indian Institute of Pulses Research ), KALRO, ICRISAT and other stakeholders, and will cover the following areas :
� Suitable pulse varieties and their diagnostic characteristics ; � Exploring the possibilities of underutilized pulse varieties with the view to enhancing
their production in different cropping systems ; � Improved agro-techniques for enhancing production, including planting techniques and fertilizer application ; � Identification and management of pests, disease control, fertilizers, and pesticides and their application. � With the support of the trained trainers, disseminate information through on-site trainings with farmers at county level. EAGC
Conduct an equipment study to assess the type of equipment needed in the future by pulse growers ( also looking at equipment that can be used for both pulses and other crops ). Assessment study should include the following information and criteria.
� Mapping of manufacturers of processing equipment in India and Kenya ( types, processing capacity, technical support and spares ).
� Type of equipment, including dhal plants from India ( including cleaning, drying, splitting, polishing, etc. ). � Training requirements for local technicians to maintain the equipment. � Cost of the equipment – actual and associated costs – including financing mechanisms. � Capacity and diversity ( multipurpose during low seasons where other crops can be processed ) use of processing. � Packaging range of equipment – smaller / bigger packets etc. � Specifications including machine productive life. � Spare parts availability and support services. � Compatibility to alternative sources of energy. � Alternative sources of the same equipment outside India and Kenya
( e.g. Brazil, Italy, Japan, China, Viet Nam ) to feed into a comparative cost-benefit analysis ).
Based on the equipment study, bring equipment manufacturers in India and distributors in the region to Kenya to meet face to face with farmers’ organizations, etc. so they see whether there is a business case for setting up shop in Kenya.
Provide buyers with credit for the supply of technology from India and deploy affordable leasing options for equipment that farmers’ organizations can access through Exim Bank of India. EAGC
Organize a study tour to India – in collaboration with IPGA – that will include visits to market yards and processors of pulses in India ( Indore / Delhi ). This study tour will be organized once a year for a group of 15–30 market players ( including farmers, assemblers, traders, processors, financial institutions, research institutes and government officials ) identified jointly by EAGC and ITC.
The visit will allow the participants to see the operations of the Indian industry and develop business linkages. IPGA

Photo: (CC BY-SA 2.0) CIAT (CC BY-SA 2.0), bean market4.Apg
[ MOVING TO ACTION ]
63
Activities Lead implementer
Undertake a pilot initiative to build capacity of, and to find a market for, the collective of 18,000 farmers ( Eastern and Coast regions ) that are brought together by the Kenya Red Cross.
� Build capacity for sorting, grading and packaging. � Establish collection points and certified storage facilities with the required facilities ( cleaning, sorting, grading, etc. ). � Assist in improving marketing of the crop. � Link to buyers before the harvest so that proper quality and inputs are made available. EAGC
Link existing market information platforms such as RATIN, National Farmers Information Service, M-Farm and CerealMart, to provide information on pulses. The existing RATIN system will be upgraded to pull data from AGMARKNET in India and other free information sources. The system will also subscribe to data vendors’ commercial services such as Reuters and Gro Ventures ( a Kenya-based information vendor ) to have access to additional sources of information to be distributed to the sector. In order to achieve this, the following steps will be will be carried out :
� Conduct a comprehensive study on existing market information systems, including a gap analysis ; � Strengthen the database for the pulses value chain for farmers, traders, aggregators and technical experts ; � Configure the system to receive and distribute information related to the pulses market ( including prices )
through external sources such as AGMARKNET ( India ) and Bloomberg.
Configure the system to receive and disseminate information from the EAGC Structured Trading Platform. EAGC
Photo: (CC BY-SA 2.0) NH53 (CC BY 2.0) , Bags oA beans.Apg
Roadmap plan of aCtion
The PoA contains a detailed list of activities organized by operational objectives and strategic objectives. The PoA serves as an exhaustive framework for the implementation of the roadmap.
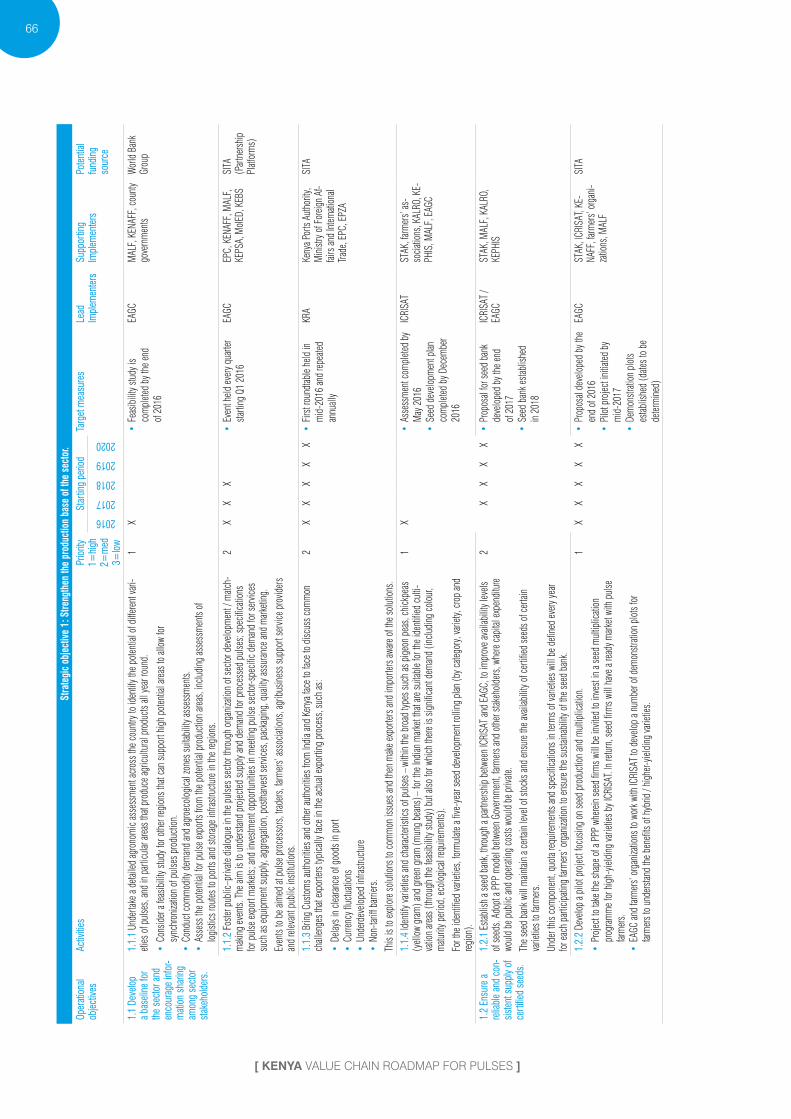
66
[ KENYA Value Chain Roadmap foR pulSeS ]
stra
tegi
c ob
ject
ive
1 : s
treng
then
the
prod
uctio
n ba
se o
f the
sec
tor.
oper
atio
nal
objec
tives
activ
ities
prio
rity
1=hi
gh2=
med
3=lo
w
star
ting
perio
dta
rget
mea
sure
sle
ad
impl
emen
ters
supp
ortin
g im
plem
ente
rspo
tent
ial
fund
ing
sour
ce
2016
2017
2018
2019
2020
1 .1
deve
lop
a ba
selin
e fo
r th
e se
ctor
and
en
cour
age
info
r-m
atio
n sh
arin
g am
ong
sect
or
stak
ehol
ders
.
1 .1 .
1 Un
der ta
ke a
detai
led ag
rono
mic
asse
ssm
ent a
cros
s the
coun
try to
iden
tify t
he p
oten
tial o
f diff
erent
vari-
eties
of p
ulse
s, an
d in
parti
cular
area
s tha
t pro
duce
agric
ultu
ral p
rodu
cts al
l yea
r rou
nd.
• Co
nsid
er a
feasib
ility
study
for o
ther
regi
ons t
hat c
an su
ppor
t hig
h po
tentia
l area
s to
allow
for
sync
hron
izatio
n of
pul
ses p
rodu
ction
.•
Cond
uct c
omm
odity
dem
and
and
agro
ecol
ogica
l zon
es su
itabi
lity a
sses
smen
ts.•
Asse
ss th
e pot
entia
l for
pul
se ex
ports
from
the p
oten
tial p
rodu
ction
area
s, inc
ludi
ng as
sess
men
ts of
lo
gisti
cs ro
utes
to p
orts
and
storag
e inf
rastru
cture
in th
e reg
ions
.
1X
• Fe
asib
ility
study
is
com
plete
d by
the e
nd
of 2
016
EAGC
MAL
F, K
ENAF
F, co
unty
gove
rnm
ents
Wor
ld B
ank
Grou
p
1 .1 .
2 Fo
ster p
ublic
–priv
ate d
ialog
ue in
the p
ulse
s sec
tor t
hrou
gh o
rgan
izatio
n of
secto
r dev
elopm
ent /
matc
h-m
aking
even
ts. Th
e aim
is to
und
ersta
nd p
rojec
ted su
pply
and
dem
and
for p
roce
ssed
pul
ses ;
spec
ifica
tions
fo
r pul
se ex
port
mark
ets ; a
nd in
vestm
ent o
ppor
tunit
ies in
mee
ting
pulse
secto
r-spe
cific
dem
and
for s
ervic
es
such
as eq
uipm
ent s
uppl
y, ag
greg
ation
, pos
tharv
est s
ervic
es, p
acka
ging
, qua
lity a
ssur
ance
and
mark
eting
.Ev
ents
to b
e aim
ed at
pul
se p
roce
ssor
s, tra
ders,
farm
ers’
asso
ciatio
ns, a
grib
usine
ss su
ppor
t ser
vice p
rovid
ers
and
relev
ant p
ublic
insti
tutio
ns.
2X
XX
• Ev
ent h
eld ev
ery q
uarte
r sta
rting
Q1
2016
EAGC
EPC,
KEN
AFF,
MAL
F,
KEPS
A, M
oIED,
KEB
SSI
TA
( Par
tner
ship
Pl
atfor
ms )
1 .1 .
3 Br
ing C
usto
ms a
utho
rities
and
othe
r aut
horit
ies fr
om In
dia a
nd K
enya
face
to fa
ce to
disc
uss c
omm
on
chall
enge
s tha
t exp
orter
s typ
ically
face
in th
e actu
al ex
porti
ng p
roce
ss, s
uch
as :
• De
lays i
n cle
aranc
e of g
oods
in p
ort
• Cu
rrenc
y flu
ctuati
ons
• Un
derd
evelo
ped
infras
tructu
re•
Non-
tariff
barr
iers.
This
is to
expl
ore s
olut
ions
to co
mm
on is
sues
and
then
mak
e exp
orter
s and
impo
rters
aware
of t
he so
lutio
ns.
2X
XX
XX
• Fir
st ro
undt
able
held
in
mid
-201
6 an
d rep
eated
an
nuall
y
KRA
Keny
a Por
ts Au
thor
ity,
Mini
stry o
f For
eign
Af-
fairs
and
Inter
natio
nal
Trade
, EPC
, EPZ
A
SITA
1 .1 .
4 Ide
ntify
varie
ties a
nd ch
aracte
ristic
s of p
ulse
s – w
ithin
the b
road
type
s suc
h as
pig
eon
peas
, chic
kpea
s ( y
ellow
gram
) and
gree
n gr
am ( m
ung
bean
s ) –
for t
he In
dian
mark
et th
at are
suita
ble f
or th
e ide
ntifi
ed cu
lti-
vatio
n are
as ( t
hrou
gh th
e fea
sibili
ty stu
dy ) b
ut al
so fo
r whic
h th
ere is
sign
ifica
nt d
eman
d ( in
cludi
ng co
lour
, m
aturit
y per
iod,
ecol
ogica
l req
uirem
ents )
.Fo
r the
iden
tified
varie
ties,
form
ulate
a fiv
e-ye
ar se
ed d
evelo
pmen
t rol
ling
plan
( by c
atego
ry, va
riety,
crop
and
regio
n ).
1X
• As
sess
men
t com
plete
d by
M
ay 2
016
• Se
ed d
evelo
pmen
t plan
co
mpl
eted
by D
ecem
ber
2016
ICRI
SAT
STAK
, farm
ers’
as-
socia
tions
, KAL
RO, K
E-PH
IS, M
ALF,
EAG
C
1 .2
ensu
re a
re
liabl
e an
d co
n-sis
tent
sup
ply
of
certi
fied
seed
s .
1 .2 .
1 Es
tablis
h a s
eed
bank
, thr
ough
a pa
rtner
ship
betw
een
ICRI
SAT a
nd E
AGC,
to im
prov
e ava
ilabi
lity l
evels
of
seed
s. Ad
opt a
PPP
mod
el be
twee
n Go
vern
men
t, far
mer
s and
oth
er st
akeh
olde
rs, w
here
capi
tal ex
pend
iture
woul
d be
pub
lic an
d op
erati
ng co
sts w
ould
be p
rivate
.Th
e see
d ba
nk w
ill m
aintai
n a c
ertai
n lev
el of
stoc
ks an
d en
sure
the a
vaila
bilit
y of c
ertif
ied se
eds o
f cer
tain
varie
ties t
o far
mer
s.Un
der t
his co
mpo
nent
, quo
ta req
uirem
ents
and
spec
ifica
tions
in te
rms o
f vari
eties
will
be d
efine
d ev
ery y
ear
for e
ach
parti
cipati
ng fa
rmer
s’ or
ganiz
ation
to en
sure
the s
ustai
nabi
lity o
f the
seed
ban
k.
2X
XX
X•
Prop
osal
for s
eed
bank
de
velo
ped
by th
e end
of
201
7•
Seed
ban
k esta
blish
ed
in 20
18
ICRI
SAT /
EA
GCST
AK, M
ALF,
KAL
RO,
KEPH
IS
1 .2 .
2 De
velo
p a p
ilot p
rojec
t foc
using
on
seed
pro
ducti
on an
d m
ultip
licati
on.
• Pr
ojec
t to
take t
he sh
ape o
f a P
PP w
herei
n se
ed fi
rms w
ill b
e inv
ited
to in
vest
in a s
eed
mul
tiplic
ation
pr
ogram
me f
or h
igh-
yield
ing va
rietie
s by I
CRIS
AT. I
n ret
urn,
seed
firm
s will
hav
e a re
ady m
arket
with
pul
se
farm
ers.
• EA
GC an
d far
mer
s’ or
ganiz
ation
s to
work
with
ICRI
SAT t
o de
velo
p a n
umbe
r of d
emon
strati
on p
lots
for
farm
ers t
o un
derst
and
the b
enefi
ts of
hyb
rid /
highe
r-yiel
ding
varie
ties.
1X
XX
XX
• Pr
opos
al de
velo
ped
by th
e en
d of
201
6•
Pilot
pro
ject i
nitiat
ed b
y m
id-2
017
• De
mon
strati
on p
lots
estab
lishe
d ( d
ates t
o be
de
term
ined )
EAGC
STAK
, ICR
ISAT
, KE -
NAFF
, farm
ers’
orga
ni-za
tions
, MAL
F
SITA

[ ROADMAP PLAN OF ACTION ]
67
stra
tegi
c ob
ject
ive
1 : s
treng
then
the
prod
uctio
n ba
se o
f the
sec
tor.
oper
atio
nal
objec
tives
activ
ities
prio
rity
1=hi
gh2=
med
3=lo
w
star
ting
perio
dta
rget
mea
sure
sle
ad
impl
emen
ters
supp
ortin
g im
plem
ente
rspo
tent
ial
fund
ing
sour
ce
2016
2017
2018
2019
2020
1 .2
ensu
re a
re
liabl
e an
d co
n-sis
tent
sup
ply
of
certi
fied
seed
s .
1 .2 .
3 Re
infor
ce th
e im
plem
entat
ion
and
enfo
rcem
ent o
f the
See
d an
d Pl
ant V
ariety
Act
( 197
5, am
ende
d in
2012
), aim
ing at
ensu
ring
prop
er av
ailab
ility
of ce
rtifie
d se
eds.
Step
s inc
lude
the f
ollo
wing
.
• Co
nduc
t a q
uick a
sses
smen
t on
the l
evel
of im
plem
entat
ion
and
cove
rage o
f this
Act,
and
the e
xpec
ted
impa
ct of
dev
olut
ion
on th
e im
plem
entat
ion
of th
e Act.
• Ha
rmon
ize p
olici
es at
nati
onal
level
and
coun
ty lev
el an
d su
gges
t step
s to
impr
ove c
oord
inatio
n wi
th
coun
ties f
or en
forc
ing th
e pol
icies
.•
Advo
cate
for t
he im
plem
entat
ion
of a
polic
y for
syste
mati
c see
d co
ntro
ls to
figh
t aga
inst t
he u
se o
f non
-ce
rtifie
d se
eds.
• Co
nsid
er re
vising
the p
olicy
supp
ortin
g se
ed d
evelo
pmen
t by r
esea
rch
instit
utes
to au
thor
ize p
artn
ersh
ips
with
seed
bree
ders
on a
cont
ractu
al ba
sis.
• Cr
eate
aware
ness
of t
he A
ct, d
issem
inate
infor
mati
on.
3X
• As
sess
men
t and
rec
omm
enda
tions
pr
ovid
ed to
MAL
F by
the
end
of 2
016
MAL
FCo
unty
gove
rnm
ents,
KE
NAFF
1 .2 .
4 Es
tablis
h a f
inanc
e mec
hanis
m ( s
chem
e ) to
pro
mot
e priv
ate se
ctor i
nves
tmen
t in
seed
dev
elopm
ent.
• Th
e sch
eme w
ill in
volve
, thr
ough
don
or as
sistan
ce /
budg
etary
alloc
ation
from
the G
over
nmen
t, th
e sett
ing
up o
f a fu
nd b
y STA
K th
at wi
ll su
ppor
t inv
estm
ent i
n de
velo
ping
infra
struc
ture
for s
eed
deve
lopm
ent,
i.e. c
reatio
n of
infra
struc
ture
facili
ties r
elatin
g to
seed
clea
ning,
grad
ing an
d pr
oces
sing ;
seed
trea
ting,
pa
ckag
ing an
d sto
rage u
nits ;
as w
ell as
for s
eed
testin
g fac
ilitie
s.•
Priva
te co
mpa
nies,
indivi
dual
entre
pren
eurs,
seed
coop
erati
ves a
nd p
artn
ersh
ip fa
rms w
ill b
e elig
ible
for
soft
loan
subs
idies
.•
This
finan
ce m
echa
nism
will
be i
mpl
emen
ted th
roug
h pr
e-id
entif
ied b
anks
and
will
invol
ve a
cred
it-lin
ked
back
-end
ed ca
pital
subs
idy t
o be
pro
vided
at th
e rate
of 5
0 % fo
r new
com
ers,
and
25 %
for e
stabl
ished
co
mpa
nies,
of th
e pro
ject c
ost s
ubjec
t to
a max
imum
lim
it of
US $
50,0
00 p
er u
nit o
n se
ed in
frastr
uctu
re de
velo
pmen
t.
2X
XX
X•
Prop
osal
for f
und
deve
lope
d by
mid
-201
7•
Sche
me d
eplo
yed
at th
e en
d of
201
7 as
a pi
lot
STAK
EAGC
, MAL
F,Na
tiona
l Trea
sury,
M
oIED,
Savin
gs an
d Cr
edit
Co-
oper
ative
Soc
ieties
1 .2 .
5 Inc
rease
coor
dina
tion
betw
een
ICAR
( Ind
ian In
stitu
te of
Pul
ses R
esea
rch )
and
KALR
O an
d KE
PHIS
( in
charg
e of c
learin
g se
ed im
ports
) to
deve
lop
an ac
tion
plan
to fo
ster k
nowl
edge
tran
sfer t
o se
ed p
rodu
cers
and
farm
ers (
inclu
ding
intro
ducti
on an
d tra
ining
on
impr
oved
varie
ties o
f the
seed
s ), a
nd im
prov
e ins
titut
iona
l co
llabo
ratio
n.
2X
XX
XX
• Ini
tial r
ound
table
mee
ting
to d
iscus
s app
roac
h he
ld
in 20
16, r
esul
ting
in a
med
ium-to
-long
term
co
ordi
natio
n ap
proa
ch
KALR
OIC
AR, K
EPHI
S, IC
RI-
SAT,
STAK
, KEN
AFF,
co
unty
gove
rnm
ents
1 .3
enha
nce
the
avail
abilit
y an
d ad
optio
n of
qua
lity ( n
on-
seed
) inp
uts .
1 .3 .
1 De
velo
p a m
odel
for p
rivate
secto
r eng
agem
ent i
n th
e sale
of p
estic
ides
and
fertil
izers.
• Di
scus
s the
valu
e pro
posit
ion
of th
e pul
ses m
arket
with
key s
uppl
iers.
• In
a mul
ti-sta
keho
lder
setti
ng, d
evelo
p a p
lan fo
r sale
of e
nviro
nmen
tally
frien
dly,
affor
dabl
e fer
tilize
r and
pe
sticid
es to
pro
duce
rs ( in
cludi
ng d
istrib
utio
n m
odel
).
2X
XX
• Di
strib
utio
n m
odel
deve
lope
d by
early
201
8Ag
roch
emica
l As
socia
tion
of
Keny
a
MAL
F, E
AGC,
KEN
AFF,
co
unty
gove
rnm
ents
1 .3 .
2 Ide
ntify
, thr
ough
deta
iled
prof
iling
, key
farm
ers’
orga
nizati
ons o
perat
ing in
the s
electe
d co
untie
s, in-
cludi
ng o
rgan
izatio
ns th
at are
not
yet i
nvol
ved
in pu
lses,
to se
rve as
a nu
cleus
for s
elect
pilo
t init
iative
s.
• Ev
aluate
the r
each
of t
he fa
rmer
s’ or
ganiz
ation
s and
the p
ast w
ork d
one b
y eac
h or
ganiz
ation
in th
e pul
ses
valu
e cha
in ( o
r oth
er co
mm
oditi
es ).
• Ev
aluate
the i
mpl
emen
tatio
n ca
pacit
y of t
he d
iffere
nt o
rgan
izatio
ns an
d cr
eate
a pro
file f
or ea
ch
orga
nizati
on.
1X
• Te
n to
fifte
en fa
rmer
s’ or
ganiz
ation
s in
high
poten
tial a
reas i
dent
ified
an
d ap
proa
ched
for
invol
vem
ent i
n pi
lot
initia
tives
by m
id-2
015
KENA
FFEA
GC, C
GA, K
EPSA
, co
unty
gove
rnm
ents
SITA
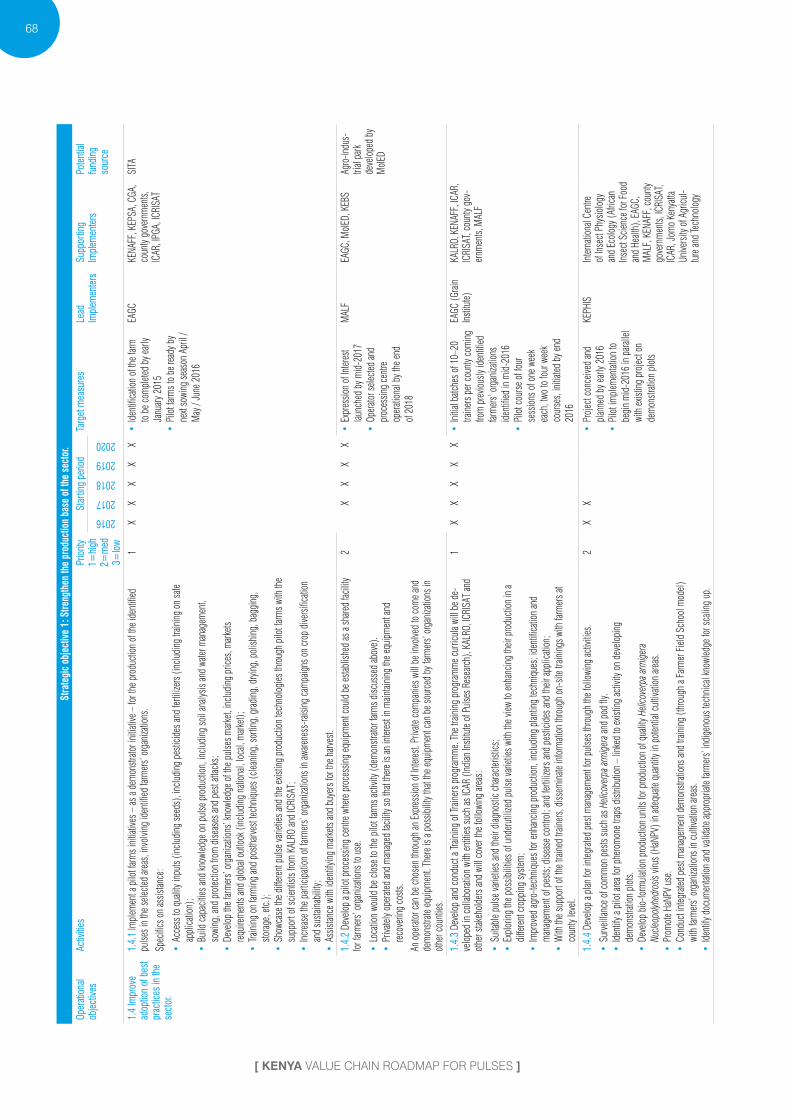
68
[ KENYA Value Chain Roadmap foR pulSeS ]
stra
tegi
c ob
ject
ive
1 : s
treng
then
the
prod
uctio
n ba
se o
f the
sec
tor.
oper
atio
nal
objec
tives
activ
ities
prio
rity
1=hi
gh2=
med
3=lo
w
star
ting
perio
dta
rget
mea
sure
sle
ad
impl
emen
ters
supp
ortin
g im
plem
ente
rspo
tent
ial
fund
ing
sour
ce
2016
2017
2018
2019
2020
1 .4
impr
ove
adop
tion
of b
est
prac
tices
in th
e se
ctor
.
1 .4 .
1 Im
plem
ent a
pilo
t farm
s init
iative
s – as
a de
mon
strato
r init
iative
– fo
r the
pro
ducti
on o
f the
iden
tified
pu
lses i
n th
e sele
cted
areas
, inv
olvin
g id
entif
ied fa
rmer
s’ or
ganiz
ation
s.Sp
ecifi
cs o
n as
sistan
ce :
• Ac
cess
to q
ualit
y inp
uts (
inclu
ding
seed
s ), i
nclu
ding
pes
ticid
es an
d fer
tilize
rs ( in
cludi
ng tr
aining
on
safe
appl
icatio
n ) ;
• Bu
ild ca
pacit
ies an
d kn
owled
ge o
n pu
lse p
rodu
ction
, inc
ludi
ng so
il an
alysis
and
water
man
agem
ent,
sowi
ng, a
nd p
rotec
tion
from
dise
ases
and
pest
attac
ks ;
• De
velo
p th
e farm
ers’
orga
nizati
ons’
know
ledge
of t
he p
ulse
s mark
et, in
cludi
ng p
rices
, mark
ets
requir
emen
ts an
d gl
obal
outlo
ok ( i
nclu
ding
nati
onal,
loca
l, m
arket
) ;•
Traini
ng o
n far
ming
and
posth
arves
t tec
hniq
ues (
clea
ning,
sorti
ng, g
rading
, dryi
ng, p
olish
ing, b
aggi
ng,
storag
e, etc
. ) ;•
Show
case
the d
iffere
nt p
ulse
varie
ties a
nd th
e exis
ting
prod
uctio
n tec
hnol
ogies
thro
ugh
pilo
t farm
s with
the
supp
ort o
f scie
ntist
s fro
m K
ALRO
and
ICRI
SAT ;
• Inc
rease
the p
artic
ipati
on o
f farm
ers’
orga
nizati
ons i
n aw
arene
ss-ra
ising
cam
paig
ns o
n cr
op d
iversi
ficati
on
and
susta
inabi
lity ;
• As
sistan
ce w
ith id
entif
ying
mark
ets an
d bu
yers
for t
he h
arves
t.
1X
XX
XX
• Ide
ntifi
catio
n of
the f
arm
to b
e com
plete
d by
early
Ja
nuary
201
5•
Pilot
farm
s to
be re
ady b
y ne
xt so
wing
seas
on A
pril
/ M
ay /
June
201
6
EAGC
KENA
FF, K
EPSA
, CGA
, co
unty
gove
rnm
ents,
IC
AR, I
PGA,
ICRI
SAT
SITA
1 .4 .
2 De
velo
p a p
ilot p
roce
ssing
cent
re wh
ere p
roce
ssing
equip
men
t cou
ld b
e esta
blish
ed as
a sh
ared
facili
ty fo
r farm
ers’
orga
nizati
ons t
o us
e.
• Lo
catio
n wo
uld
be cl
ose t
o th
e pilo
t farm
s acti
vity (
dem
onstr
ator f
arms d
iscus
sed
abov
e ).
• Pr
ivatel
y ope
rated
and
man
aged
facil
ity so
that
there
is an
inter
est i
n m
aintai
ning
the e
quip
men
t and
rec
over
ing co
sts.
An o
perat
or ca
n be
chos
en th
roug
h an
Exp
ressio
n of
Inter
est.
Priva
te co
mpa
nies w
ill b
e inv
olve
d to
com
e and
de
mon
strate
equip
men
t. Th
ere is
a po
ssib
ility
that
the e
quip
men
t can
be s
ourc
ed b
y farm
ers’
orga
nizati
ons i
n ot
her c
ount
ies.
2X
XX
X•
Expr
essio
n of
Inter
est
launc
hed
by m
id-2
017
• Op
erato
r sele
cted
and
proc
essin
g ce
ntre
oper
ation
al by
the e
nd
of 2
018
MAL
FEA
GC, M
oIED,
KEB
SAg
ro-in
dus -
trial
park
deve
lope
d by
M
oIED
1 .4 .
3 De
velo
p an
d co
nduc
t a T r
aining
of T
raine
rs pr
ogram
me.
The t
rainin
g pr
ogram
me c
urric
ula w
ill b
e de-
velo
ped
in co
llabo
ratio
n wi
th en
tities
such
as IC
AR ( I
ndian
Insti
tute
of P
ulse
s Res
earc
h ), K
ALRO
, ICR
ISAT
and
othe
r stak
ehol
ders
and
will
cove
r the
follo
wing
area
s :
• Su
itabl
e pul
se va
rietie
s and
their
diag
nosti
c cha
racter
istics
;•
Expl
oring
the p
ossib
ilitie
s of u
nder
utili
zed
pulse
varie
ties w
ith th
e view
to en
hanc
ing th
eir p
rodu
ction
in a
diffe
rent c
ropp
ing sy
stem
;•
Impr
oved
agro
-tech
nique
s for
enha
ncing
pro
ducti
on, i
nclu
ding
plan
ting
techn
ique
s ; id
entif
icatio
n an
d m
anag
emen
t of p
ests ;
dise
ase c
ontro
l ; an
d fer
tilize
rs an
d pe
sticid
es an
d th
eir ap
plica
tion ;
• W
ith th
e sup
port
of th
e trai
ned
traine
rs, d
issem
inate
infor
mati
on th
roug
h on
-site
train
ings w
ith fa
rmer
s at
coun
ty lev
el.
1X
XX
XX
• Ini
tial b
atche
s of 1
0–20
tra
iners
per c
ount
y com
ing
from
prev
ious
ly id
entif
ied
farm
ers’
orga
nizati
ons
iden
tified
in m
id-2
016
• Pil
ot co
urse
of f
our
sess
ions
of o
ne w
eek
each
, two
to fo
ur w
eek
cour
ses,
initia
ted b
y end
20
16
EAGC
( Grai
n Ins
titut
e )KA
LRO,
KEN
AFF,
ICAR
, IC
RISA
T, co
unty
gov-
ernm
ents,
MAL
F
1 .4 .
4 De
velo
p a p
lan fo
r int
egrat
ed p
est m
anag
emen
t for
pul
ses t
hrou
gh th
e fol
lowi
ng ac
tiviti
es.
• Su
rveill
ance
of c
omm
on p
ests
such
as H
elico
verp
a arm
igera
and
pod
fly.
• Ide
ntify
a pi
lot a
rea fo
r phe
r om
one t
raps d
istrib
utio
n –
linke
d to
exist
ing ac
tivity
on
deve
lopi
ng
dem
onstr
ation
plo
ts.•
Deve
lop
bio-
form
ulati
on p
rodu
ction
unit
s for
pro
ducti
on o
f qua
lity H
elico
verp
a arm
igera
Nu
cleop
olyhe
dros
is vir
us ( H
aNPV
) in
adeq
uate
quan
tity i
n po
tentia
l cul
tivati
on ar
eas.
• Pr
omot
e HaN
PV u
se.
• Co
nduc
t int
egrat
ed p
est m
anag
emen
t dem
onstr
ation
s and
train
ing ( t
hrou
gh a
Farm
er F
ield
Scho
ol m
odel
) wi
th fa
rmer
s’ or
ganiz
ation
s in
culti
vatio
n are
as.
• Ide
ntify
doc
umen
tatio
n an
d va
lidate
appr
opria
te far
mer
s’ ind
igen
ous t
echn
ical k
nowl
edge
for s
calin
g up
.
2X
X•
Proj
ect c
once
ived
and
plan
ned
by ea
rly 2
016
• Pil
ot im
plem
entat
ion
to
begi
n m
id-2
016
in pa
rallel
wi
th ex
isting
pro
ject o
n de
mon
strati
on p
lots
KEPH
ISInt
erna
tiona
l Cen
tre
of In
sect
Phys
iolo
gy
and
Ecol
ogy (
Afric
an
Insec
t Scie
nce f
or F
ood
and
Healt
h ), E
AGC,
M
ALF,
KEN
AFF,
coun
ty go
vern
men
ts, IC
RISA
T, IC
AR, J
omo
Keny
atta
Unive
rsity
of A
gricu
l-tu
re an
d Te
chno
logy
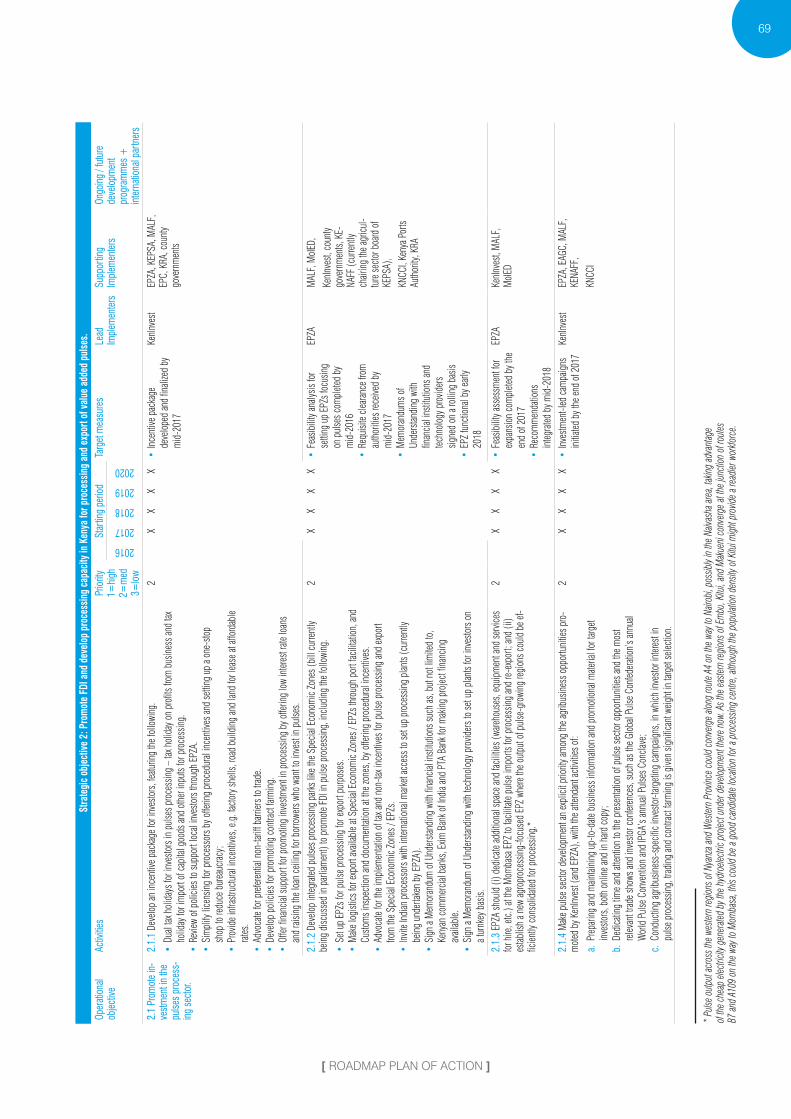
[ ROADMAP PLAN OF ACTION ]
69
stra
tegi
c ob
ject
ive
2 : P
rom
ote
fdi a
nd d
evel
op p
roce
ssin
g ca
paci
ty in
Ken
ya fo
r pro
cess
ing
and
expo
rt of
val
ue a
dded
pul
ses.
oper
atio
nal
objec
tive
activ
ities
prio
rity
1=hi
gh2=
med
3=lo
w
star
ting
perio
dta
rget
mea
sure
sle
ad
impl
emen
ters
supp
ortin
g im
plem
ente
rson
goin
g / f
utur
e de
velo
pmen
t pr
ogra
mm
es +
in
tern
atio
nal p
artn
ers
2016
2017
2018
2019
2020
2 .1
prom
ote
in-
vest
men
t in
the
pulse
s pr
oces
s-in
g se
ctor
.
2 .1 .
1 De
velo
p an
ince
ntive
pac
kage
for i
nves
tors,
featu
ring
the f
ollo
wing
.
• Du
al tax
hol
iday
s for
inve
stors
in pu
lses p
roce
ssing
– ta
x hol
iday
on
prof
its fr
om b
usine
ss an
d tax
ho
liday
for i
mpo
rt of
capi
tal g
oods
and
othe
r inp
uts f
or p
roce
ssing
.•
Revie
w of
pol
icies
to su
ppor
t loc
al inv
esto
rs th
roug
h EP
ZA.
• Si
mpl
ify li
cens
ing fo
r pro
cess
ors b
y offe
ring
proc
edur
al inc
entiv
es an
d se
tting
up
a one
-sto
p sh
op to
redu
ce b
urea
ucrac
y ;•
Prov
ide i
nfras
tructu
ral in
cent
ives,
e.g. f
acto
ry sh
ells,
road
buil
ding
and
land
for l
ease
at af
ford
able
rates
.•
Advo
cate
for p
refere
ntial
non
-tarif
f barr
iers t
o tra
de.
• De
velo
p po
licies
for p
rom
oting
cont
ract f
arming
.•
Offer
fina
ncial
supp
ort f
or p
rom
oting
inve
stmen
t in
proc
essin
g by
offe
ring
low
intere
st rat
e loa
ns
and
raisin
g th
e loa
n ce
iling
for b
orro
wers
who
want
to in
vest
in pu
lses.
2X
XX
X•
Incen
tive p
acka
ge
deve
lope
d an
d fin
alize
d by
m
id-2
017
KenIn
vest
EPZA
, KEP
SA, M
ALF,
EP
C, K
RA, c
ount
y go
vern
men
ts
2 .1 .
2 De
velo
p int
egrat
ed p
ulse
s pro
cess
ing p
arks l
ike th
e Spe
cial E
cono
mic
Zone
s ( bi
ll cu
rrent
ly be
ing d
iscus
sed
in pa
rliam
ent )
to p
rom
ote F
DI in
pul
se p
roce
ssing
, inc
ludi
ng th
e fol
lowi
ng.
• Se
t up
EPZs
for p
ulse
pro
cess
ing fo
r exp
ort p
urpo
ses.
• M
ake l
ogist
ics fo
r exp
ort a
vaila
ble a
t Spe
cial E
cono
mic
Zone
s / E
PZs t
hrou
gh p
ort f
acili
tatio
n, an
d Cu
stom
s ins
pecti
on an
d do
cum
entat
ion
at th
e zon
es, b
y offe
ring
proc
edur
al inc
entiv
es.
• Ad
voca
te fo
r the
impl
emen
tatio
n of
tax a
nd n
on-ta
x inc
entiv
es fo
r pul
se p
roce
ssing
and
expo
rt fro
m th
e Spe
cial E
cono
mic
Zone
s / E
PZs.
• Inv
ite In
dian
pro
cess
ors w
ith in
terna
tiona
l mark
et ac
cess
to se
t up
proc
essin
g pl
ants
( cur
rently
be
ing u
nder
taken
by E
PZA )
.•
Sign
a M
emor
andu
m o
f Und
ersta
nding
with
fina
ncial
insti
tutio
ns su
ch as
, but
not
lim
ited
to,
Keny
an co
mm
ercial
ban
ks, E
xim B
ank o
f Ind
ia an
d PT
A Ba
nk fo
r mak
ing p
rojec
t fina
ncing
av
ailab
le.•
Sign
a M
emor
andu
m o
f Und
ersta
nding
with
tech
nolo
gy p
rovid
ers t
o se
t up
plan
ts fo
r inv
esto
rs on
a t
urnk
ey b
asis.
2X
XX
X•
Feas
ibili
ty an
alysis
for
setti
ng u
p EP
Zs fo
cusin
g on
pul
ses c
ompl
eted
by
mid
-201
6•
Requ
isite
cleara
nce f
rom
au
thor
ities
rece
ived
by
mid
-201
7•
Mem
oran
dum
s of
Unde
rstan
ding
with
fin
ancia
l ins
titut
ions
and
techn
olog
y pro
vider
s sig
ned
on a
rolli
ng b
asis
• EP
Z fun
ction
al by
early
20
18
EPZA
MAL
F, M
oIED,
KenIn
vest,
coun
ty go
vern
men
ts, K
E-NA
FF ( c
urren
tly
chair
ing th
e agr
icul-
ture
secto
r boa
rd o
f KE
PSA )
,KN
CCI,
Keny
a Por
ts Au
thor
ity, K
RA
2 .1 .
3 EP
ZA sh
ould
( i ) d
edica
te ad
ditio
nal s
pace
and
facili
ties (
wareh
ouse
s, eq
uipm
ent a
nd se
rvice
s fo
r hire
, etc.
) at t
he M
omba
sa E
PZ to
facil
itate
pulse
impo
rts fo
r pro
cess
ing an
d re-
expo
rt ; an
d ( ii
) es
tablis
h a n
ew ag
ropr
oces
sing-
focu
sed
EPZ w
here
the o
utpu
t of p
ulse
-gro
wing
regi
ons c
ould
be e
f-fic
iently
cons
olid
ated
for p
roce
ssing
.*
2X
XX
X•
Feas
ibili
ty as
sess
men
t for
ex
pans
ion
com
plete
d by
the
end
of 2
017
• Re
com
men
datio
ns
integ
rated
by m
id-2
018
EPZA
KenIn
vest,
MAL
F,
MoIE
D
2 .1 .
4 M
ake p
ulse
secto
r dev
elopm
ent a
n ex
plici
t prio
rity a
mon
g th
e agr
ibus
iness
opp
ortu
nities
pro
-m
oted
by K
enInv
est (
and
EPZA
), wi
th th
e atte
ndan
t acti
vities
of :
a . P
repari
ng an
d m
aintai
ning
up-to
-date
bus
iness
info
rmati
on an
d pr
omot
iona
l mate
rial f
or ta
rget
inves
tors,
bot
h on
line a
nd in
hard
copy
;b .
Ded
icatin
g tim
e and
atten
tion
to th
e pres
entat
ion
of p
ulse
secto
r opp
ortu
nities
and
the m
ost
relev
ant t
rade s
hows
and
inves
tor c
onfer
ence
s, su
ch as
the G
loba
l Pul
se C
onfed
erati
on’s
annu
al W
orld
Pul
se C
onve
ntio
n an
d IP
GA’s
annu
al Pu
lses C
oncla
ve ;
c . C
ondu
cting
agrib
usine
ss-s
pecif
ic inv
esto
r-targ
eting
cam
paig
ns, i
n wh
ich in
vesto
r int
erest
in pu
lse p
roce
ssing
, trad
ing an
d co
ntrac
t farm
ing is
give
n sig
nifica
nt w
eight
in ta
rget
selec
tion.
2X
XX
X•
Inves
tmen
t-led
cam
paig
ns
initia
ted b
y the
end
of 2
017
KenIn
vest
EPZA
, EAG
C, M
ALF,
KE
NAFF
,KN
CCI
* Pu
lse o
utput
acro
ss th
e wes
tern
regio
ns o
f Nya
nza a
nd W
ester
n Pr
ovinc
e cou
ld co
nver
ge al
ong
route
A4
on th
e way
to N
airob
i, pos
sibly
in the
Naiv
asha
area
, tak
ing ad
vanta
ge
of th
e che
ap el
ectri
city g
ener
ated
by th
e hyd
roele
ctric
proje
ct un
der d
evelo
pmen
t the
re n
ow. A
s the
easte
rn re
gions
of E
mbu
, Kitu
i, and
Mak
ueni
conv
erge
at th
e jun
ction
of r
outes
B7
and
A109
on
the w
ay to
Mom
basa
, this
could
be a
goo
d ca
ndida
te loc
ation
for a
pro
cess
ing ce
ntre,
altho
ugh
the p
opula
tion
dens
ity o
f Kitu
i migh
t pro
vide a
read
ier w
orkfo
rce.

70
[ KENYA Value Chain Roadmap foR pulSeS ]
stra
tegi
c ob
ject
ive
2 : P
rom
ote
fdi a
nd d
evel
op p
roce
ssin
g ca
paci
ty in
Ken
ya fo
r pro
cess
ing
and
expo
rt of
val
ue a
dded
pul
ses.
oper
atio
nal
objec
tive
activ
ities
prio
rity
1=hi
gh2=
med
3=lo
w
star
ting
perio
dta
rget
mea
sure
sle
ad
impl
emen
ters
supp
ortin
g im
plem
ente
rson
goin
g / f
utur
e de
velo
pmen
t pr
ogra
mm
es +
in
tern
atio
nal p
artn
ers
2016
2017
2018
2019
2020
2 .1
prom
ote
in-
vest
men
t in
the
pulse
s pr
oces
s-in
g se
ctor
.
2 .1 .
5 Ad
d op
erati
on, m
ainten
ance
and
r epair
of c
omm
on ag
ribus
iness
pro
cess
ing m
achin
ery (
mill
s, po
lishe
rs, h
uller
s, sp
litter
s, m
ixers,
etc.
) to
the t
rainin
g pr
ogram
mes
of t
he E
PZA
Voca
tiona
l Trai
n-ing
Insti
tute.
Link
Insti
tute
adm
inistr
ators
with
new
and
exist
ing in
vesto
rs to
und
ersta
nd th
eir sk
ill
requir
emen
ts, w
hich
can
be fe
d ba
ck in
to th
e Ins
titut
e’s cu
rricu
lum
.
2X
XX
X•
Curri
culu
m u
pdate
d an
d int
egrat
ed b
y mid
-201
7EP
ZAKE
BS, u
niver
sities
2 .2
facil
itate
te
chno
logy
tra
nsfe
r and
eq
uipm
ent
upgr
ade
in th
e se
ctor
.
2 .2 .
1 Co
nduc
t an
equip
men
t stu
dy to
asse
ss th
e typ
e of e
quip
men
t nee
ded
in th
e fut
ure b
y pul
se
grow
ers (
also
look
ing at
equip
men
t tha
t can
be u
sed
for b
oth
pulse
s and
oth
er cr
ops )
. Ass
essm
ent
study
shou
ld in
clude
the f
ollo
wing
info
rmati
on an
d cr
iteria
.
• M
appi
ng o
f man
ufac
turer
s of p
roce
ssing
equip
men
t in
India
and
Keny
a ( typ
es, p
roce
ssing
ca
pacit
y, tec
hnica
l sup
port
and
spare
s ).
• Ty
pe o
f equ
ipm
ent,
inclu
ding
dha
l plan
ts fro
m In
dia (
inclu
ding
clea
ning,
dryi
ng, s
plitt
ing,
polis
hing,
etc.
).•
Traini
ng re
quire
men
ts fo
r loc
al tec
hnici
ans t
o m
aintai
n th
e equ
ipm
ent.
• Co
st of
the e
quip
men
t – ac
tual
and
asso
ciated
costs
– in
cludi
ng fi
nanc
ing m
echa
nism
s.•
Capa
city a
nd d
iversi
ty ( m
ultip
urpo
se d
uring
low
seas
ons w
here
othe
r cro
ps ca
n be
pr o
cess
ed ),
and
use o
f pro
cess
ing.
• Pa
ckag
ing ra
nge o
f equ
ipm
ent –
small
er /
bigg
er p
acke
ts etc
.•
Spec
ifica
tions
inclu
ding
mac
hine p
rodu
ctive
life.
• Sp
are p
arts
avail
abili
ty an
d su
ppor
t ser
vices
.•
Com
patib
ility
to al
terna
tive s
ourc
es o
f ene
rgy.
• Al
terna
tive s
ourc
es o
f the
sam
e equ
ipm
ent o
utsid
e Ind
ia an
d Ke
nya (
e.g.
Braz
il, It
aly, J
apan
, Ch
ina, V
iet N
am ) t
o fee
d int
o a c
ompa
rative
cost-
bene
fit an
alysis
.Ba
sed
on th
e equ
ipm
ent s
tudy
, brin
g eq
uipm
ent m
anuf
actu
rers i
n Ind
ia an
d di
strib
utor
s in
the r
egio
n to
Ken
ya fo
r fac
e-to
-face
mee
tings
with
farm
ers’
orga
nizati
ons e
tc. so
they
see w
heth
er th
ere is
a bu
sines
s cas
e for
setti
ng u
p sh
op in
Ken
ya.
Prov
ide b
uyer
s with
cred
it fo
r the
supp
ly of
tech
nolo
gy fr
om In
dia a
nd d
eplo
y affo
rdab
le lea
sing
op-
tions
for e
quip
men
t tha
t farm
ers’
orga
nizati
ons c
an ac
cess
thro
ugh
the E
xim B
ank o
f Ind
ia.
2X
XX
X•
Map
ping
of e
quip
men
t m
anuf
actu
rers c
ompl
eted
by m
id-2
017
• Bu
sines
s-to
-bus
iness
ev
ent o
rgan
ized
in Ke
nya i
n lat
e-20
17•
Finan
cing
instru
men
ts de
velo
ped
EAGC
Ex
im B
ank o
f Ind
ia,
Mini
stry o
f For
eign
Affai
rs &
Inter
natio
nal
Trade
, MAL
F, K
enya
Ind
ustri
al Re
searc
h an
d De
velo
pmen
t Ins
titut
e,Na
tiona
l Trea
sury,
St
ate D
epar
tmen
t of
Trade
, EAG
C, K
ENAF
F
2 .2 .
2 Co
llabo
rate w
ith co
unty
gove
rnm
ents
or o
ther
insti
tutio
ns su
ch as
coop
erati
ves t
o fo
ster t
he
use o
f exis
ting
wareh
ouse
s as s
hared
facil
ities
for p
ulse
farm
ers.
• Us
e cer
tified
stor
age b
y EAG
C ( a
nd ex
pand
certi
ficati
on if
nec
essa
ry ).
• Ide
ntify
ware
hous
es su
itabl
e for
stor
age.
Disc
uss w
ith co
unty
gove
rnm
ents
/ oth
er in
stitu
tions
the
assig
nmen
t of w
areho
uses
.•
Crea
te aw
arene
ss am
ong
farm
ers o
f ava
ilabi
lity o
f sto
rage a
nd o
ther
servi
ces (
sorti
ng, g
rading
, etc
. ).
2X
XX
X•
Ware
hous
es id
entif
ied b
y m
id-2
017
EAGC
Coun
ty go
vern
men
ts,
Natio
nal C
ereals
and
Prod
uce B
oard
, KE-
NAFF
, EAG
C
2 .2 .
3 Co
nnec
t the
food
scien
ce d
epar
tmen
ts of
univ
ersit
ies w
ith th
e Mini
stry o
f Agr
icultu
re an
d va
lue a
dded
pul
se p
roce
ssor
s ( pa
sta, v
erm
icelli
, chip
s, etc
. ) to
und
ersta
nd h
ow K
enya
n pu
lses
coul
d be
adap
ted fo
r suc
h us
e.
3X
XX
XX
• M
emor
andu
ms o
f Un
derst
andi
ng si
gned
by
mid
-201
6
MAL
FJo
mo K
enya
tta U
niver-
sity o
f Agr
icultu
re an
d Te
chno
logy,
other
uni-
versi
ties t
o be i
nclud
ed
as pe
r defi
ned s
cope
2 .3
impr
ove
esse
ntial
infra
-st
ruct
ure
in th
e se
ctor
.
2 .3 .
1 Ad
dres
s log
istica
l cha
lleng
es fo
r sm
ooth
and
chea
per e
xpor
t to
targe
t mark
ets b
y :
• De
velo
ping
the r
ail /
road
netw
ork f
or ch
eape
r tran
spor
t to
the p
ort.
The e
xistin
g pr
ojec
t of
North
ern
corri
dor w
ill b
e lev
erag
ed as
the r
ail n
etwor
k ess
entia
lly co
mpr
ises a
sing
le lin
e, ov
erlan
d rai
l trac
k fro
m M
omba
sa th
roug
h Na
irobi
, Nak
uru
and
Kisu
mu
/ Eld
oret,
whic
h are
with
in th
e pul
se-p
rodu
cing
areas
of T
aita T
aveta
. Kitu
i, M
akue
ni.an
d M
acha
kos
• De
velo
ping
the n
ew p
ort r
ail an
d ro
ad fr
om La
mu
to p
ass t
hrou
gh p
ulse
- gro
wing
area
s thr
ough
th
e Lam
u Po
rt–So
uthe
rn S
udan
–Eth
iopi
a Tran
spor
t Cor
ridor
pro
ject.
3X
XX
XX
• Fe
asib
ility
analy
sis –
th
roug
h po
sitio
n pa
per –
for
exten
sion
of ex
isting
rail
infras
tructu
re pr
ojec
ts su
bmitt
ed to
the M
inistr
y of
Trans
port
and
Infras
tructu
re by
the e
nd o
f 201
6
Mini
stry o
f Tra
nspo
rt an
d Inf
rastru
cture
Coun
ty go
vern
men
ts,Ke
nya R
ailwa
ysNo
rther
n Co
rrido
r pr
ojec
t ( La
mu
Port–
Sout
hern
Sud
an–
Ethio
pia T
ransp
ort
Corri
dor )

[ ROADMAP PLAN OF ACTION ]
71
stra
tegi
c ob
ject
ive
2 : P
rom
ote
fdi a
nd d
evel
op p
roce
ssin
g ca
paci
ty in
Ken
ya fo
r pro
cess
ing
and
expo
rt of
val
ue a
dded
pul
ses.
oper
atio
nal
objec
tive
activ
ities
prio
rity
1=hi
gh2=
med
3=lo
w
star
ting
perio
dta
rget
mea
sure
sle
ad
impl
emen
ters
supp
ortin
g im
plem
ente
rson
goin
g / f
utur
e de
velo
pmen
t pr
ogra
mm
es +
in
tern
atio
nal p
artn
ers
2016
2017
2018
2019
2020
2 .3
impr
ove
esse
ntial
infra
-st
ruct
ure
in th
e se
ctor
.
2 .3 .
2 De
velo
p co
ld ch
ains f
or g
reen
gram
to en
sure
the p
reser
vatio
n of
colo
ur ( a
nd o
ther
qua
lity
param
eters
) whic
h is
the m
ain cr
iteria
use
d to
dete
rmine
the v
alue o
f this
par
ticul
ar va
riety.
Pro
mot
e pr
ivate
inves
tmen
t in
cold
stor
age f
acili
ties t
hrou
gh th
e fol
lowi
ng :
1 . A
dvoc
ate fo
r an
enab
ling
polic
y fram
ewor
k by t
he G
over
nmen
t ;2 .
Adv
ocate
for e
nabl
ing fi
scal
polic
ies to
enco
urag
e priv
ate in
vestm
ent b
y offe
ring
low
intere
st rat
e lo
ans ;
3 . L
aunc
h ten
der f
or a
share
d co
ld st
orag
e fac
ility
near
selec
t dem
onstr
ation
farm
s ;4 .
Integ
rate k
nowl
edge
shari
ng an
d tra
ining
on
the i
mpo
rtanc
e of c
old
storag
e fac
ilitie
s rela
ted to
gr
een
gram
crop
with
exist
ing Tr
aining
of T
raine
rs ini
tiativ
es.
2X
XX
X•
Posit
ion
pape
r as a
n ad
voca
cy m
echa
nism
( for
#
1 an
d #
2 ) ) s
ubm
itted
by
the e
nd o
f 201
6•
Tend
er fo
r col
d sto
rage
facili
ty lau
nche
d by
m
id-2
017
MAL
FM
oIED,
EAGC
, KEN
AFF,
Na-
tiona
l Trea
sury
2 .3 .
3 Di
rect t
he N
ation
al Tre
asur
y’s P
PP U
nit to
prio
ritize
the c
ompl
etion
of i
ts fir
st irr
igati
on P
PP7
in an
area
with
hig
h pu
lse o
utpu
t. PP
P Un
it an
d Ke
nInve
st to
colla
borat
e on
getti
ng m
axim
um ex
posu
re fo
r the
tend
er.
2X
XX
• Pr
iorit
izatio
n co
mpl
eted
and
pulse
-relat
ed p
rojec
t ini
tiated
by m
id-2
017
Natio
nal
Treas
ury
KenIn
vest
2 .4
impr
ove
ac-
cess
to fi
nanc
e in
the
sect
or .
2 .4 .
1 Es
tablis
h an
expo
rt gu
arant
ee fu
nd to
be s
et up
und
er th
e Nati
onal
Treas
ury w
ith q
uotas
to sp
e-cif
ically
addr
ess t
he p
ulse
s sec
tor.
This
fund
will
be a
strat
egic
busin
ess u
nit an
d wi
ll of
fer cr
edit
risk
insur
ance
cove
r to
expo
rters,
ban
ks, e
tc. Th
is fu
nd w
ill al
so p
rovid
e trad
e fina
nce t
hrou
gh re
finan
cing
the c
omm
ercial
ban
ks, b
ased
on
a pro
duct
deve
lope
d fo
r this
pur
pose
.Th
e prim
ary o
bjec
tive o
f the
fund
will
be t
o pr
omot
e the
coun
try’s
expo
rts b
y cov
ering
the r
isk o
f ex
port
on cr
edit.
Pro
visio
ns w
ill in
clude
:
• A
range
of i
nsur
ance
cove
rs to
Ken
yan
expo
rters
again
st th
e risk
of n
on-re
aliza
tion
of ex
port
proc
eeds
due
to co
mm
ercial
or p
oliti
cal c
ause
s ;•
Diffe
rent t
ypes
of g
uaran
tees t
o ba
nks a
nd o
ther
fina
ncial
insti
tutio
ns to
enab
le th
em to
exten
d cr
edit
facili
ties t
o ex
porte
rs on
a lib
eral
basis
.
2X
XX
• Fu
nd se
t up
and
oper
ation
al by
201
8 Na
tiona
l Tre
asur
yEA
GC, E
PC,
Exim
Ban
k of In
dia (
as
advis
er ),
com
merc
ial
bank
s, M
oIED,
MAL
F,
KEPS
A
2 .4 .
2 Fin
alize
the l
ow-in
teres
t ind
ustri
aliza
tion
fund
und
er d
evelo
pmen
t by M
oIED,
whic
h wo
uld
be
used
to p
rovid
e man
ufac
turer
s with
loan
s at i
nter
natio
nally
com
petit
ive in
teres
t rate
s in
the s
ingle
digi
ts, an
d as
sure
its co
verag
e of a
gro-
proc
esso
rs.
2X
• Fu
nd fi
naliz
ed an
d op
erati
onal
by th
e end
of
2016
MoIE
DCo
mm
ercial
ban
ks
2 .4 .
3 As
sess
opt
ions
to in
corp
orate
pul
ses i
n th
e pilo
t pr o
ject f
or st
ructu
red co
mm
odity
trad
e fi -
nanc
e.
• Ide
ntify
fina
ncial
insti
tutio
ns ( i
nclu
ding
micr
ofina
ncing
) for
par
ticip
ation
and
finan
cing.
• Ba
nks t
o su
ppor
t farm
ers w
ith p
osth
arves
t sol
utio
ns b
y fina
ncing
acqu
isitio
n of
pos
tharv
est
hand
ling
techn
olog
ies.
• Ide
ntify
ware
hous
es fo
r par
ticip
ation
in th
e pilo
t.•
Defin
e qua
lity p
aram
eters
as w
ell as
dev
elop
a pro
per g
rading
and
certi
ficati
on m
echa
nism
.•
Estab
lish
a stru
ctured
com
mod
ity tr
ade f
inanc
ing m
echa
nism
.
2X
XX
X•
Proj
ect l
aunc
hed
by th
e end
of
201
7EA
GCKE
BS, N
ation
al Ce
-rea
ls an
d Pr
oduc
e Bo
ard, M
ALF
Wor
ld B
ank
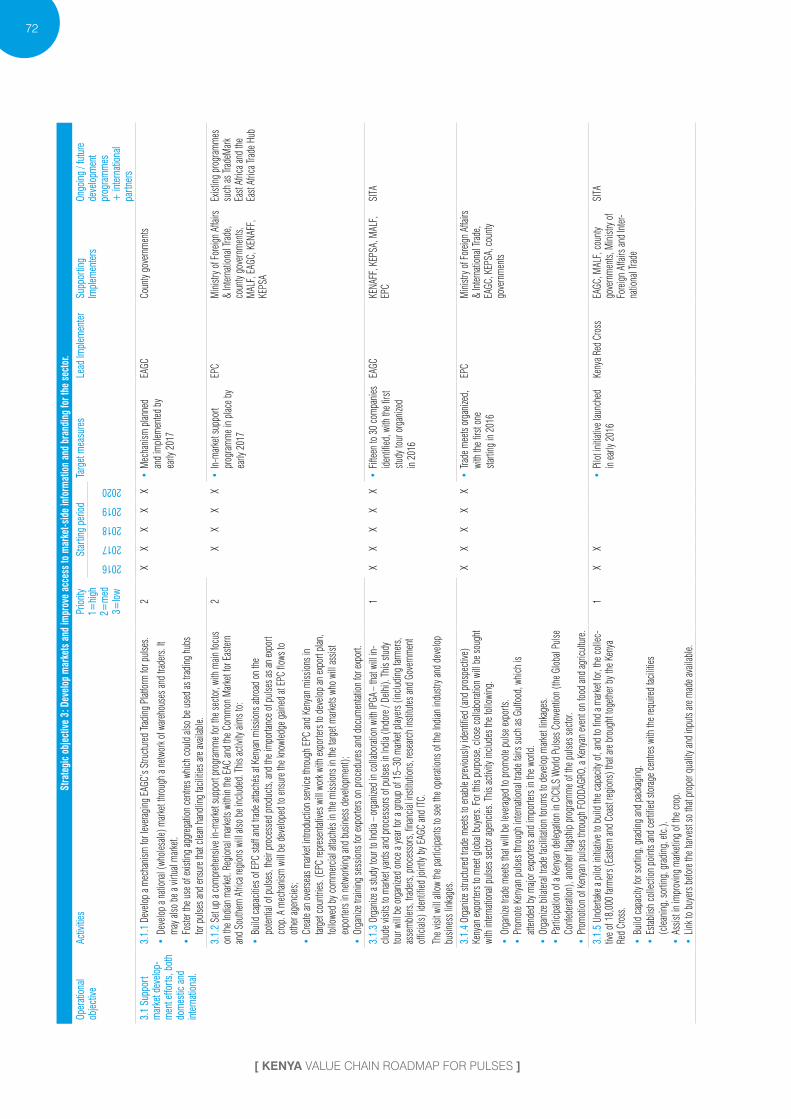
72
[ KENYA Value Chain Roadmap foR pulSeS ]
stra
tegi
c ob
ject
ive
3 : d
evel
op m
arke
ts a
nd im
prov
e ac
cess
to m
arke
t-sid
e in
form
atio
n an
d br
andi
ng fo
r the
sec
tor.
oper
atio
nal
objec
tive
activ
ities
prio
rity
1=hi
gh2=
med
3=lo
w
star
ting
perio
dta
rget
mea
sure
sle
ad im
plem
ente
rsu
ppor
ting
impl
emen
ters
ongo
ing
/ fut
ure
deve
lopm
ent
prog
ram
mes
+
inte
rnat
iona
l pa
rtner
s
2016
2017
2018
2019
2020
3 .1
supp
ort
mar
ket d
evelo
p-m
ent e
fforts
, bot
h do
mes
tic a
nd
inte
rnat
iona
l .
3 .1 .
1 De
velo
p a m
echa
nism
for l
ever
aging
EAG
C’s S
tructu
r ed Tr
ading
Plat
form
for p
ulse
s.
• De
velo
p a n
ation
al ( w
holes
ale ) m
arket
thro
ugh
a netw
ork o
f ware
hous
es an
d tra
ders.
It
may
also
be a
virtu
al m
arket.
• Fo
ster t
he u
se o
f exis
ting
aggr
egati
on ce
ntres
whic
h co
uld
also
be u
sed
as tr
ading
hub
s fo
r pul
ses a
nd en
sure
that
clean
han
dling
facil
ities
are a
vaila
ble.
2X
XX
XX
• M
echa
nism
plan
ned
and
impl
emen
ted b
y ea
rly 2
017
EAGC
Coun
ty go
vern
men
ts
3 .1 .
2 Se
t up
a com
preh
ensiv
e in-
mark
et su
ppor
t pro
gram
me f
or th
e sec
tor,
with
main
focu
s on
the I
ndian
mark
et. R
egio
nal m
arkets
with
in th
e EAC
and
the C
omm
on M
arket
for E
aster
n an
d So
uthe
rn A
frica
regi
ons w
ill al
so b
e inc
lude
d. Th
is ac
tivity
aim
s to :
• Bu
ild ca
pacit
ies o
f EPC
staff
and
trade
attac
hés a
t Ken
yan
miss
ions
abro
ad o
n th
e po
tentia
l of p
ulse
s, th
eir p
roce
ssed
pro
ducts
, and
the i
mpo
rtanc
e of p
ulse
s as a
n ex
port
crop
. A m
echa
nism
will
be d
evelo
ped
to en
sure
the k
nowl
edge
gain
ed at
EPC
flow
s to
othe
r age
ncies
;•
Crea
te an
ove
rseas
mark
et int
rodu
ction
servi
ce th
r oug
h EP
C an
d Ke
nyan
miss
ions
in
targe
t cou
ntrie
s. ( E
PC re
pres
entat
ives w
ill w
ork w
ith ex
porte
rs to
dev
elop
an ex
port
plan
, fo
llowe
d by
com
merc
ial at
taché
s in
the m
issio
ns in
the t
arget
mark
ets w
ho w
ill as
sist
expo
rters
in ne
twor
king
and
busin
ess d
evelo
pmen
t ) ;•
Orga
nize t
rainin
g se
ssio
ns fo
r exp
orter
s on
proc
edur
es an
d do
cum
entat
ion
for e
xpor
t.
2X
XX
X•
In-m
arket
supp
ort
prog
ramm
e in
plac
e by
early
201
7
EPC
Mini
stry o
f For
eign
Affai
rs &
Inter
natio
nal T
rade,
coun
ty go
vern
men
ts,
MAL
F, E
AGC,
KEN
AFF,
KE
PSA
Exist
ing p
rogr
amm
es
such
as Tr
adeM
ark
East
Afric
a and
the
East
Afric
a Trad
e Hub
3 .1 .
3 Or
ganiz
e a st
udy t
our t
o Ind
ia – o
rgan
ized
in co
llabo
ratio
n wi
th IP
GA –
that
will
in-clu
de vi
sits t
o m
arket
yard
s and
pro
cess
ors o
f pul
ses i
n Ind
ia ( In
dore
/ Delh
i ). Th
is stu
dy
tour
will
be o
rgan
ized
once
a ye
ar fo
r a g
roup
of 1
5–30
mark
et pl
ayer
s ( in
cludi
ng fa
rmer
s, as
sem
bler
s, tra
ders,
pro
cess
ors,
finan
cial i
nstit
utio
ns, r
esea
rch
instit
utes
and
Gove
rnm
ent
offic
ials )
iden
tified
joint
ly by
EAG
C an
d ITC
.Th
e visi
t will
allo
w th
e par
ticip
ants
to se
e the
ope
ratio
ns o
f the
Indi
an in
dustr
y and
dev
elop
busin
ess l
inkag
es.
1X
XX
XX
• Fif
teen
to 3
0 co
mpa
nies
iden
tified
, with
the f
irst
study
tour
org
anize
d in
2016
EAGC
KENA
FF, K
EPSA
, MAL
F,
EPC
SITA
3 .1 .
4 Or
ganiz
e stru
ctured
trad
e mee
ts to
enab
le pr
evio
usly
iden
tified
( and
pro
spec
tive )
Ke
nyan
expo
rters
to m
eet g
loba
l buy
ers.
For t
his p
urpo
se, c
lose
colla
borat
ion
will
be so
ught
wi
th in
terna
tiona
l pul
ses s
ecto
r age
ncies
. This
activ
ity in
clude
s the
follo
wing
.
• Or
ganiz
e trad
e mee
ts th
at wi
ll be
leve
raged
to p
rom
ote p
ulse
expo
rts.
• Pr
omot
e Ken
yan
pulse
s thr
ough
inter
natio
nal t
rade f
airs s
uch
as G
ulfo
od, w
hich
is att
ende
d by
majo
r exp
orter
s and
impo
rters
in th
e wor
ld.
• Or
ganiz
e bila
teral
trade
facil
itatio
n fo
rum
s to
deve
lop
mark
et lin
kage
s.•
Parti
cipati
on o
f a K
enya
n de
legati
on in
CIC
ILS W
orld
Pul
ses C
onve
ntio
n ( th
e Glo
bal P
ulse
Co
nfed
erati
on ),
anot
her f
lagsh
ip p
rogr
amm
e of t
he p
ulse
s sec
tor.
• Pr
omot
ion
of K
enya
n pu
lses t
hrou
gh F
OODA
GRO,
a Ke
nyan
even
t on
food
and
agric
ultu
re.
XX
XX
X•
Trade
mee
ts or
ganiz
ed,
with
the f
irst o
ne
starti
ng in
201
6
EPC
Mini
stry o
f For
eign
Affai
rs &
Inter
natio
nal T
rade,
EAGC
, KEP
SA, c
ount
y go
vern
men
ts
3 .1 .
5 Un
derta
ke a
pilo
t init
iative
to b
uild
the c
apac
ity o
f, an
d to
find
a m
arket
for,
the c
ollec
-tiv
e of 1
8,00
0 far
mer
s ( Ea
stern
and
Coas
t reg
ions
) tha
t are
brou
ght t
ogeth
er b
y the
Ken
ya
Red
Cros
s.
• Bu
ild ca
pacit
y for
sorti
ng, g
rading
and
pack
aging
.•
Estab
lish
colle
ction
poi
nts a
nd ce
rtifie
d sto
rage c
entre
s with
the r
equir
ed fa
ciliti
es
( clea
ning,
sorti
ng, g
rading
, etc.
).•
Assis
t in
impr
oving
mark
eting
of t
he cr
op.
• Lin
k to
buye
rs be
fore
the h
arves
t so
that
prop
er q
ualit
y and
inpu
ts are
mad
e ava
ilabl
e.
1X
X•
Pilot
initi
ative
laun
ched
in
early
201
6Ke
nya R
ed C
ross
EAGC
, MAL
F, co
unty
gove
rnm
ents,
Mini
stry o
f Fo
reign
Affa
irs an
d Int
er-na
tiona
l Trad
e
SITA

[ ROADMAP PLAN OF ACTION ]
73
stra
tegi
c ob
ject
ive
3 : d
evel
op m
arke
ts a
nd im
prov
e ac
cess
to m
arke
t-sid
e in
form
atio
n an
d br
andi
ng fo
r the
sec
tor.
oper
atio
nal
objec
tive
activ
ities
prio
rity
1=hi
gh2=
med
3=lo
w
star
ting
perio
dta
rget
mea
sure
sle
ad im
plem
ente
rsu
ppor
ting
impl
emen
ters
ongo
ing
/ fut
ure
deve
lopm
ent
prog
ram
mes
+
inte
rnat
iona
l pa
rtner
s
2016
2017
2018
2019
2020
3 .2
deve
lop
new
tool
s fo
r pro
vi-sio
n of
tim
ely a
nd
relev
ant m
arke
t in
tellig
ence
.
3 .2 .
1 Lin
k exis
ting
mark
et inf
orm
ation
plat
form
s suc
h as
RAT
IN, N
ation
al Fa
rmer
s Inf
orm
a-tio
n Se
rvice
, M-F
arm an
d Ce
realM
art,
to p
rovid
e inf
orm
ation
on
pulse
s. Th
e exis
ting
RATIN
sy
stem
will
be u
pgrad
ed to
pul
l data
from
AGM
ARKN
ET in
Indi
a and
oth
er fr
ee in
form
a-tio
n so
urce
s. Th
e sys
tem w
ill al
so su
bscr
ibe t
o da
ta ve
ndor
s’ co
mm
ercial
servi
ces s
uch
as
Reut
ers a
nd G
ro V
entu
res ( a
Ken
ya-b
ased
Info
rmati
on ve
ndor
) to
have
acce
ss to
addi
tiona
l so
urce
s of i
nfor
mati
on to
be d
istrib
uted
to th
e sec
tor.
In or
der t
o ac
hieve
this,
the f
ollo
wing
ste
ps w
ill b
e will
be c
arried
out
.
• Co
nduc
t a co
mpr
ehen
sive s
tudy
on
exist
ing m
arket
infor
mati
on sy
stem
s, inc
ludi
ng a
gap
analy
sis.
• St
rengt
hen
the d
ataba
se fo
r the
pul
ses v
alue c
hain
for f
armer
s, tra
ders,
aggr
egato
rs an
d tec
hnica
l exp
erts.
• Co
nfig
ure t
he sy
stem
to re
ceive
and
distr
ibut
e inf
orm
ation
relat
ed to
the p
ulse
s mark
et ( in
cludi
ng p
rices
) thr
ough
exter
nal s
ourc
es su
ch as
AGM
ARKN
ET ( I
ndia )
and
Bloo
mbe
rg.
• Co
nfig
ure t
he sy
stem
to re
ceive
and
diss
emina
te inf
orm
ation
from
EAG
C’s S
tructu
red
Tradi
ng P
latfo
rm.
2X
XX
X•
Gap
analy
sis co
nduc
ted
by th
e end
of 2
016
• Sy
stem
s int
egrat
ion
com
plete
d by
the e
nd
of 2
017
EAGC
KEPS
A,co
mm
ercial
info
rmati
on
prov
ider
s
3 .2 .
2 Se
t up
a virt
ual n
etwor
king
platf
orm
for b
uyer
s in
India
and
selle
rs in
Keny
a thr
ough
a n
etwor
king
platf
orm
and
inter
activ
e web
site,
with
requ
ired
cent
ral co
ntro
l for
secu
rity f
ea-
tures
with
a va
lidati
on m
echa
nism
to el
imina
te fak
e offe
rs.
3X
XX
X•
Netw
orkin
g pl
atfor
m in
pl
ace b
y earl
y 201
7EP
CEA
GCSI
TA
3 .2 .
3 De
velo
p an
SM
S fac
ility
aimed
at sh
aring
valu
able
infor
mati
on o
n pu
lses w
ith fa
rmer
s. Inf
orm
ation
abou
t pric
es w
ill b
e a p
ush
servi
ce, w
hile i
nfor
mati
on ab
out p
rodu
ction
tech
nol-
ogy,
sowi
ng, h
arves
ting
and
storag
e will
be a
pul
l ser
vice.
2X
X•
SMS
facili
ty in
plac
e by
mid
-201
7EA
GCTe
chno
logy
pro
vider
sRA
TIN
3 .2 .
4 Tra
in far
mer
s on
the u
se o
f mark
et inf
orm
ation
syste
m to
ols a
nd m
ake i
nfor
mati
on
abou
t pul
ses m
ore e
asily
avail
able.
Train
ing w
ill al
so fo
cus o
n int
erpr
etatio
n of
mark
et in-
form
ation
.Le
verag
e exis
ting
platf
orm
s suc
h as
SM
S se
rvice
s for
diss
emina
tion
of p
rices
and
othe
r in-
form
ation
to fa
rmer
s and
trad
ers o
perat
ing in
the p
ulse
s sec
tor i
n Ke
nya.
2X
XX
XX
• Fir
st ba
tch o
f trai
ning
prov
ided
in 2
016,
with
pl
annin
g fo
r an
annu
al ev
ent
EAGC
Tech
nolo
gy P
rovid
ers
Exist
ing in
itiati
ves
inclu
de M
-Farm
, Es
oko,
G–S
oko.
M–
Soko
3 .3
Build
and
pro
-m
ote
the
keny
an
pulse
s br
and .
3 .3 .
1 Fo
rmul
ate a
syste
mati
c ‘So
urce
d in
Keny
a’ ca
mpa
ign
/ bran
d to
leve
rage c
o-br
andi
ng
oppo
rtunit
ies fo
r pro
ducts
( targ
eting
end
cons
umer
s ) in
prem
ium m
arkets
. Dev
elop
a br
andi
ng co
mm
unica
tion
strate
gy fo
r the
Ken
yan
and
Indian
pul
ses s
ecto
rs th
at de
fines
co-
bran
ding
term
s of r
eferen
ce. S
ynch
roniz
e with
‘Buy
Ken
ya, B
uild
Keny
a’.
3X
XX
• Co
mm
unica
tion
strate
gy
initia
ted b
y earl
y 201
8EP
CEA
GC

74
[ KENYA Value Chain Roadmap foR pulSeS ]
APPENdix: kenya’s poliCies and tRade agReements in a nutshell
Beyond the description of the different actors in the pulses value chain in Kenya, it is important to review the policy and regulatory framework that contributes to structuring the sector’s development. The following section provides an overview of national plans, policies and initiatives directly or indirectly supporting the pulses sector’s development.
the kenyan Constitution 2010
The recently adopted Constitution is the backbone of the country’s policies and provides for two levels of Government : at national and at county level. It recognizes distinct and interdependent functions for each level of government but mandates the two to cooperate, support, consult and liaise with each other for the purpose of exchanging information, coordinating, and enhancing policies and administration.49
national plan
kenya Vision 2030
Kenya Vision 2030 is the country’s long-term development blueprint covering the period 2008–2030 and implemented through successive five-year Medium Term Plans. Based on three pillars, i.e. economic, social and political, the Vision aims to transform the country into a ‘newly industrial-izing, middle income country providing a high quality of life for all its citizens by the year 2030’.
Under the economic component, agriculture was one of six sectors50 identified on the basis of their potential to contribute to the Vision’s objective of achieving an average gross domestic product growth rate of 10 % per annum beginning in 2012.
The long-term goal of the agriculture sector, which also comprises livestock and fisheries, is the ‘attainment of food security and increased incomes through value addition by in-country processing of primary agricultural and livestock products’ something that will be achieved through an ‘innovative, commercially oriented and modern agriculture’. The specific strategies identified for the sector under Vision 2030 are also very much in line with the objectives set under the SITA Initiative for the pulses sector in Kenya, notably aiming at :
� Increasing the productivity of crops through better yields � Promoting household and private sector agricultural growth � Improving market access for smallholders through better marketing � Increasing use of uncultivated land.
Several flagship projects of interest to the pulses sector were implemented during the First Medium Term Plan ( 2008–2012 ), including the enactment of three Acts : the Agriculture, Fisheries and Food Authority Act, the Crops Act and the National Agricultural Research Act ( see below ). A Fertilizer Cost Reduction Strategy was also implemented, as well as programmes aimed at expanding irrigation coverage, improving delivery of extension services, and seed improvements.
49.– Republic of Kenya, Ministry of Agriculture, Livestock and Fisheries ( 2015 ). National Irrigation Policy, 2015.50.– Other sectors include tourism, wholesale and retail trade, manufacturing, information and communications technology and business process outsourcing, and financial services.

[ ROADMAP PLAN OF ACTION ]
75
The Second Medium Term Plan ( 2013–2017 ), that is currently being implemented, also comprises programmes and projects for the agriculture, livestock and fisheries sector. Several activities envis-aged under this Plan are in line with the objectives of the roadmap for value chain optimization developed under the SITA Initiative for the pulses sector. These flagship projects and programmes include the following.
� Implementation of the Consolidated Agricultural Reform Legislations, including setting up institu-tions such as AFFA and KALRO proposed in the new Acts ( see below ).
� The Fertilizer Cost Reduction Strategy to address issues of access to and affordability of fertiliz-ers, namely through establishing a local, privately owned fertilizer plant. Investors have already been identified and several plants are currently being established.
� Agricultural development along the Lamu Port–South Sudan–Ethiopia Transport corridor, involv-ing feasibility studies and providing investment incentives to actors interested in investing in agriculture in the region.
� The National Agricultural Sector Extension Programme aimed at improving access to agricultural extension by farmers and further strengthening agricultural research and development.
� The Agri-Business Development Programme, geared towards improving access to markets by all agricultural value chain players as well as improving and modernizing market facilities. It is anticipated that the programme will ensure the creation of local, regional and international marketing opportunities for agricultural commodities, which was identified as a significant need for the Kenyan pulses sector.
� Accelerated Agricultural Inputs Access Programme to improve access to agricultural inputs such as fertilizers, agrochemicals and certified seeds.
� Agricultural Credit and Financial Services Access Programme aimed at improving access to agricultural credit and insurance for agricultural value chain players.
� Agricultural Programme for Schools to train pupils in primary and secondary schools in agri-cultural skills and engage them in irrigated agriculture.
agriculture sector development strategy ( 2010–2020 )
This Strategy was drafted following the revision of the Strategy for Revitalizing Agriculture ( 2004–2014 ) and aims to support Vision 2030. The Agriculture Sector Development Strategy lays the foundations of Kenya’s agriculture policies and strategies, with the main objective of transforming the country into a food-secure and prosperous nation.
More specifically, it strives to ‘increase and provide the basis for equitable incomes, employ-ment and improved food security as a result of improved production and productivity in the rural smallholder farm and off-farm sectors’ ( Republic of Kenya, Ministry of Agriculture, Livestock and Fisheries, 2011, p. 29 ). In this context, the strategy endeavours to achieve an agricultural growth rate of 7 % per year over the period 2010–2014. Its areas of intervention are structured in three components :
� Sector-wide coordination ( i.e. enabling institutional environment ) � Natural resource management ( i.e. ensure sustainability and adaptation ) � Value chain development ( i.e. long-term gains through equitable commercialization of agricul-
tural sector produce ).51
51.– Republic of Kenya, Ministry of Agriculture, Livestock and Fisheries ( 2011 ). Agricultural Sector Development Support Programme.
76
[ KENYA Value Chain Roadmap foR pulSeS ]
The pulses subsector is governed by the Strategies for the Crops and Land Development Sub-sector under the Agriculture Sector Development Strategy, which lays down the pillars for the formulation and implementation of policies within the subsector, namely :
� ‘Improvement of agribusiness and market access � Strengthening of research, extension and training � Improvement of land use and crop development � Enhancing accessibility of affordable inputs and credit to farmers � Enhancing institutional efficiency and effectiveness in implementation and service delivery’
( Republic of Kenya, 2009, p.40 ).52
key national Regulations
As stated above, three pieces of legislation were crafted against the backdrop of the proposal by Kenya Vision 2030 of ‘consolidating agricultural policy reform legislation’ and the Agriculture Sector Development Strategy. The three Acts, namely the Agriculture, Fisheries and Food Authority Act ( 2013 ), the Crops Act ( 2013 ) and the Kenya Agricultural and Livestock Act ( 2013 ) are detailed hereafter, together with other key Acts and regulations.
agriculture, fisheries and food authority act ( 2013 )
This Act of Parliament provides for the consolidation of laws on the regulation and promotion of agriculture generally, and makes provisions for the respective roles of national and county governments in agriculture, excluding livestock, in line with the provisions of the Fourth Schedule of the Constitution of Kenya.53 AFFA, a state corporation, was established as a new overarching regulatory agency under the Agriculture, Fisheries and Food Authority Act of 2013. AFFA is the successor of former regulatory institutions in the sector that were merged into Directorates under the Authority with the commencement of the Crops Act, 2013 on 1 August 2014.54
In the context of devolution of competencies from Nairobi to county governments, this legislation will be of utmost importance for the development of the pulses sector as it clearly defines the roles and responsibilities of county governments, a key element in the implementation of the SITA Initiative’s activities.
Crops act ( 2013 )
The Crops Act aims to ‘consolidate and repeal various statutes relating to crops ; to provide for the growth and development of agricultural crops and for connected purposes.’
Through promotion of the production, processing, marketing and distribution of crops in suitable areas of the country, the objective of this Act is to accelerate the growth and development of agriculture in general ; enhance productivity and incomes of farmers and the rural population ; improve the investment climate and efficiency of agribusiness ; and develop agricultural crops as export crops.
52.– Republic of Kenya ( 2009 ). Agriculture Sector Development Strategy 2009–2020.53.– Republic of Kenya, Agriculture, Fisheries and Food Authority. Website. Available from http : / /agricultureauthority.go.ke / .54.– Ibid.

[ ROADMAP PLAN OF ACTION ]
77
The Act comprises provisions to :
� Circumvent unnecessary regulatory bureaucracy in the crops subsector ; � Reduce unnecessary levies, taxes or other barriers to free movement of crop products and
provide for a rationalized taxation system ; � Reduce unnecessary regulation or over-regulation of the crops subsector ; � Reduce duplication and overlap of functions among institutions involved in the regulation of
crop agriculture ; � Promote competitiveness in the crops subsector and develop diversified crop products and
market outlets ; � Attract and promote private investment in crop agriculture.
Broad in scope, the Act nonetheless provides for the development of export crops and comprises incentive provisions for the promotion of the production and marketing of such crops. The pulses sector could therefore benefit from the provisions of the Act, its objectives being in line with some of the activities envisaged under the present SITA Initiative.
Awareness-raising campaigns will also be needed to disseminate information to all interested parties in the pulses sector, as the industry has little knowledge or understanding of this Act.
kenya agricultural and livestock act ( 2013 )
This Act provides for the establishment and functions of KALRO. The legislation provides for organs of KALRO and for the coordination of agricultural research activities in Kenya, activities which are of utmost importance for the development of new pulse varieties and seeds in the pulses sector.
seeds and plant Varieties act ( 1975, revised 2012 )
The Seeds and Plant Varieties Act came into force in 1975. This legal text aims to regulate and control the ‘production, processing, testing, certification and marketing of seeds’.
The Act is comprehensive in scope and encompasses crucial provisions for ensuring the supply of quality seeds for the agricultural sector as a whole. As per the Act, such regulations may in particular be made for the following purposes :
� Ensuring that reliable and adequate information is afforded as to the nature, condition and quality of seeds intended for sale ;
� Preventing the sale of seeds which are deleterious ; � Requiring the registration of persons growing any specified crop for the main purpose of seed
production, or of persons selling any seed ; � Preventing the spread of plant disease by the sale of seeds ; � Regulating, controlling or prohibiting the export of seeds ; � Regulating the containers in which seed may be sold.
Regarding seed testing, the text provides for the establishment of ‘one or more official seed testing stations’ and makes provisions for the regulation and control of the certification of the test results by an authorized officer.
The Act also includes provisions to restrict the introduction of new varieties and provides guidelines for the establishment of an index of names of plant varieties.
78
[ KENYA Value Chain Roadmap foR pulSeS ]
In addition, the text makes provisions to control the importation of seeds in order to prevent imports of potentially deleterious seeds and to authorize measures to prevent injurious cross-pollination, thereby guaranteeing a certain quality of seeds for the pulses sector. Seeds which are unsuitable for use in Kenya can therefore be denied access to Kenya.
Finally, the Seeds and Plant Varieties Act provides for the grant of proprietary rights to persons breeding or discovering new varieties and grants plant breeders in plant variety exclusive rights to produce reproductive material of the variety for commercial purposes.
Although the Act seems comprehensive, the question remains as to whether the provisions are being properly implemented and whether the controls and sanctions are applied. For example, it appears that the official seed testing stations contemplated by the Act have not been established. Further, it appears from the consultations held thus far that the industry is largely unaware of this Act and the provisions it encompasses, highlighting the need to raise awareness of the importance of such legislation.
national irrigation policy ( 2015 )
The National Irrigation Policy 2015 aims to stimulate and guide irrigation and drainage development through targeted technical support, intensified investment in the sector, improved research and technology, extension services, and capacity-building for both staff and farmers’ organizations to ensure development and sustainability of the subsector.55
small and medium enterprise parks
This Initiative aims at providing basic infrastructure to small and medium-sized enterprises that do not have the capital – or access to it – to invest in infrastructure but that do have the financial capacity to pay for it. The specific objectives outlined by the Government are :56
� To promote the development of small and medium industries � To enhance value addition to natural and agricultural resources � To attract local and foreign investment � To create an enabling environment through improved infrastructure � To facilitate transfer of technology � To promote productivity and competitiveness of enterprises.
micro and small enterprises act ( 2012 )
The purpose of this Act is the development, promotion and regulation of micro and small enter-prises in Kenya. It specifies the following actions :57
� Authority to advise on zoning of land � Development of infrastructure � Capacity-building programmes for micro and small enterprises � Development of markets and provision of marketing services � Technology transfer, acquisition, etc. � Creation of a Micro and Small Enterprises Development Fund � Management of the Fund.
55.– Republic of Kenya, Ministry of Agriculture, Livestock and Fisheries ( 2015 ). National Irrigation Policy, 2015.56.– Republic of Kenya, Ministry of Industrialization ( n.d. ). BrieA on Vision 2030 ManuAacturing Sector.57.– Government of Kenya ( 2013 ). The Micro and Small Enterprises Act, 2012, Kenya Gazette Supplement No. 219 ( Acts No. 55 ).

[ ROADMAP PLAN OF ACTION ]
79
The Micro and Small Enterprises Authority, a state corporation, was also established under this Act to ‘formulate and review policies and programmes, promote and develop the micro and small enterprises sector, monitor and evaluate implementation policies, programmes and activities related to micro and small enterprise development’.58
export processing zones act
This Act of Parliament provides for ‘the establishment of export processing zones and the Export Processing Zones Authority ; to provide for the promotion and facilitation of export-oriented invest-ments and the development of an enabling environment for such investment and for connected purposes’.
As for incentives the Kenyan Government provides to investors aiming to participate in Kenya’s export expansion, the following are granted to EPZ companies :59
� Ten-year corporate tax holiday and 25 % tax rate on profits thereafter ( except for commercial activities )
� Ten-year withholding tax holiday � Duty and value added tax exemption on inputs � Stamp duty exemption � Operation under essentially one licence issued by EPZA � No minimum level of investment � Rapid project approval ( under 30 days’ approval on application ) � One-stop-shop service by EPZA for set up, facilitation and aftercare ( work permits, labour
relations, port, utilities, etc. ) � On-site Customs documentation and inspection.
the investment promotion act ( 2004 )
The Investment Promotion Act of 2004, ratified on 31 December 2004, streamlined administrative and legal procedures to create a more attractive investment climate by assisting investors in obtaining the licences necessary to invest and by providing other assistance and incentives. The Act also created some new barriers with more restrictive entry regimes for FDI, namely introducing a mandatory investment threshold and restrictive screening procedure for all foreign investments.
The text makes a formal distinction between domestic and foreign investors, and requires the latter to apply to KenInvest for an Investment Certificate.60 The conditions under which KenInvest is allowed to issue an Investment Certificate to a foreign investor are restrictive, initially requiring that the amount invested be at least US $ 500,000. The Government later revised the minimum foreign investment threshold to US $ 100,000 as an amendment to the Act. In contrast, domestic investors are not required to obtain Investment Certificates ( even if their investments have to be registered with KenInvest ), with a lower minimum capital investment set at KES 5 million ( US $ 65,000 ). These restrictive screening procedures for foreign investments can be a significant impediment to FDI inflows, in particular for investors with limited financial capacities.
In addition, the investment must be deemed by KenInvest to be to the benefit of Kenya, including at least as a result of : the creation of employment for Kenyans, the acquisition of new skills or technology by Kenyans, and the contribution to tax revenues or other government revenues. The Investment Promotion Act also comprises incentive provisions, which are obtained through
58.– Republic of Kenya, Micro and Small Enterprises Authority ( 2015 ). Website. Available from http : // www.mseauthority.go.ke.59.– United States Agency for International Development ( 2014 ). Strengthening the Cotton, Textile and Apparel Value Chain in East AArica : An Assessment ( draft ).60.– An amendment later made this foreign investment certificate requirement optional.

Photo: (CC BY-SA 2.0) CC0 Public Domain, PDPics.Apg
80
[ KENYA Value Chain Roadmap foR pulSeS ]
the granting of an Investment Certificate by KenInvest. These provisions include the granting of temporary business licences and the entitlement to entry permits for expatriates.
Importantly for foreign investors willing to invest in the agriculture sector in Kenya, the Land Control Act of 1967 forbids non-citizens and private companies from acquiring or leasing agricultural land. However, presidential exemptions can be granted and are thus the main channel through which foreign investors can acquire agricultural land.
Also of importance for potential investments ( foreign or domestic ) in the processed pulses sector, is the development of EPZs, regulated by the Export Processing Zones Act ( 1990, with subse-quent amendments ). In addition to procedural incentives and the higher quality of infrastructure, fiscal incentives are provided for enterprises operating in EPZs such as the ‘exemption from all existing and future taxes and duties payable under the Customs and Excise Act and Value Added Tax Act on all export processing zone imports for use in the eligible business activities of the EPZ enterprise’ and exemption from the payment of income tax for the first 10 years from the date of first sale, followed by a rate of 25 % for the subsequent 10 years and the standard rate thereafter.
Finally, to encourage the transfer of technology and skills, the Government allows foreign inves-tors to acquire up to 49 % of local stockbrokerage firms and up to 70 % of local fund management companies.61
In addition, and of utmost importance for the pulses industry, the ability of foreigners to own or lease land classified as agricultural is restricted by the Land Control Act ( 1967 ), constituting an impediment to any agroprocessing investment that may require land. The development of EPZs, however, offers a tangible alternative for the development of the processed pulses industry.
61.– United States Department of State ( 2012 ). Investment climate statement – Kenya. Available from http : // www.state.gov / e / eb / rls / othr / ics / 2012 / 191175.htm.
[ ROADMAP PLAN OF ACTION ]
81
rEfErENcEs
Alexandratos, N. and Bruinsma, J. ( 2012 ). World agriculture towards 2030 / 2050 : The 2012 revision. ESA Working Paper No. 12–03, June. FAO.
Alliance for a Green Revolution in Africa ( 2013 ). Establishing the Status oA Post-Harvest Losses and Storage Aor MaAor Staple Crops in Eleven AArican Countries ( Phase I ), p. xviii. Nairobi, Kenya : AGRA.
Dalipagic, Ian and Elepu, Dr. Gabriel ( 2014 ). Agricultural Value Chain Analysis in Northern Uganda : Maize, Rice, Groundnuts, Sunflower and Sesame. Action Against Hunger / ACF International.
Food and Agriculture Organization of the United Nations ( 2015 ). Statistics database. Available from http : / /faostat3.fao.org / download / T / * / E. Accessed 5 August 2015.
Food and Agriculture Organization of the United Nations ( 2005 ). Pulses : Past Trends and Future Prospects. Summary of paper contributed by FAO to the 4th International Food Legumes Research Conference, New Delhi, 18–22 October. Available from http : // www.fao.org / fileadmin / tem-plates / est / COMM_MARKETS_MONITORING / Pulses / Documents / PulsesStudy.pdf.
Government of Kenya ( 2013 ). The Micro and Small Enterprises Act, 2012, Kenya Gazette Supplement No. 219 ( Acts No. 55 ).
International Food Policy Research Institute Worldwide Extension Study ( 2011 ). Extension and advisory services in Kenya : a brief history of public extension services policies, resources and ad-visory activities in Kenya. Available from http : // www.worldwide-extension.org / africa / kenya / s-kenya.
International Trade Centre ( 2015 ). Trade Map Database. Available from http : // www.trademap.org / Index.aspx. Accessed 28 October 2015.
Katungi, E., Farrow. A., Chianu. J., Sperling. L., and Beebe. S. ( 2009 ). Common Bean in Eastern and Southern AArica : A Situation and Outlook Analysis. International Centre for Tropical Agriculture.
Murphy, S., Burch, D. and Clapp, J. ( 2012 ). Cereal secrets : The world’s largest grain traders and global agriculture. Oxfam Research Reports, August.
National Council of Applied Economic Research, India ( 2014 ). India’s Pulses Scenario. New Delhi.
Njagi, Kagondu ( 2013 ). As wheat yields fall in Kenya, farmers turn to beans. Thomson Reuters Foundation, 25 April.
Noealt Corporate Services ( 2013 ). Annual Strategy Dossier – 2013 – World’s 6 Leading Agriculture Equipment ManuAacturers – Key Strategies, Plans, SWOT, Trends & Strategic Outlook.
Oloo, Jeo ( 2010 ). Food safety and quality management in Kenya : an overview of the roles played by various stakeholders. AArican Journal oA Food, Agricultural, Nutrition and Development, Vol. 10, No. 11.
Online Indus News ( 2015 ). Pulses import rises by 37 %, 24 March. Available from http : // www.onlineindus.com / pulses-import-rises-by-37 / .
Pereira, Charles ( 1996 ). The role of agricultural research in the development of Kenya before independence. In Review oA Kenyan Agricultural Research, Vol 1.
82
[ KENYA Value Chain Roadmap foR pulSeS ]
Peter Best and Ken Jennison ( 2012 ). Special report : top feed companies 2011–2012, 31 August. WattAgNet.com. Available from http : // www.wattagnet.com / articles / 13420-special-report- top-feed-companies-2011-2012.
Republic of Kenya ( 2009 ). Agriculture Sector Development Strategy 2009–2020.
Republic of Kenya, Agriculture, Fisheries and Food Authority. Website. Available from http : / / agricultureauthority.go.ke / .
Republic of Kenya, Ministry of Agriculture, Livestock and Fisheries ( 2015 ). National Irrigation Policy, 2015.
Republic of Kenya, Ministry of Agriculture, Livestock and Fisheries ( 2011 ). Agricultural Sector Development Support Programme.
Republic of Kenya, Micro and Small Enterprises Authority ( 2015 ). Website. Available from http : // www.mseauthority.go.ke.
Republic of Kenya, Ministry of Industrialization ( n.d. ). BrieA on Vision 2030 ManuAacturing Sector.
Shand, Hope ( 2012 ). The big six : a profile of corporate power in seeds, agrochemicals, & biotech. The Heritage Farm Companion ( Summer ), pp. 10–15.
Shiferaw B. and others ( 2008 ). Unlocking the Potential oA High-Value Legumes in the Semi-Arid Regions : Analyses oA the Pigeonpea Value Chains in Kenya, p. 17. Nairobi, Kenya : ICRISAT.
The Dawn ( 2015 ). Another dal crisis : Pakistan is jailing shopkeepers to combat pulse shortage, 20 October. Available from http : / /scroll.in / article / 763514 / another-daal-crisis-pakistan-is-jailing-shopkeepers-as-it-combats-pulse-shortage.
Thurston, Anne ( 1987 ). Smallholder Agriculture in Colonial Kenya : The Official Mind and the Swynnerton Plan. Cambridge African Monographs 8.
United States Agency for International Development ( 2010 ). Staple Foods Value Chain Analysis, Country Report – Kenya. USAID.
United States Agency for International Development ( 2014 ). Strengthening the Cotton, Textile and Apparel Value Chain in East AArica : An Assessment ( draft ).
United States Department of State ( 2012 ). Investment climate statement – Kenya. Available from http : // www.state.gov / e / eb / rls / othr / ics / 2012 / 191175.htm.
Wambugu P.W. and Muthamia Z.K. ( 2009 ). Country Report on the State oA Plant Genetic Resources Aor Food and Agriculture : Kenya, p. 19. Kenya Agricultural Research Institute ; National Genebank of Kenya.
World Bank ( 2016 ). Doing Business 2016 : Measuring Regulatory Quality and Efficiency. Washington, D.C. : World Bank Group.

[ ROADMAP PLAN OF ACTION ]
83
ANNEx 1: list of inVited paRtiCipants
1st consultation – may 19,20 2015Institution / Organization Invitee Title Location
Machakos County Government Sheila Mueni MukunyaChief officer – Dept of Trade, Economic Planning and Industrialisation Machakos
Trans Nzoia County Government Veronica Okoth Minister for Economic Planning, Commerce and Industry Nanyuki
Kenya Bureau of Standards Mugambi Michubu Nairobi
Kenya National Farmers Federation ( Kenaff ) Dr John Mutunga CEO Nairobi
Eastern Africa Farmers Federation ( Eaff ) Steven Muchiri CEO Nairobi
Kilimo Biashara Initiative Florence Mbugua Nairobi
Kamili Packers Ltd Sunil Shah Nairobi
Spiceworld Ltd Beju Shah Nairobi
Export Trading Kungu Wainaina Nairobi
Nafics Grain Trading Isaac Chege Nairobi
Kings Commodities Bonface Kagechu Nairobi
Shree Sai Enterprises Bina Patel Nairobi
Food Chain Millers Anthony Ndirangu Nakuru
Chase Bank Sam Donga Nairobi
Kenya Red Cross Suada Ibrahim Manager, Disaster Risk Reduction Nairobi
Bunda Cakes Dipti Sethia Nakuru
Meru County / Kenya Agricultural Productivity Project Dr. Gilbert Muthee Mwoga Project Coordinator Meru
Silden International Mr. Paresh Patel
Mwailu Enterprises Limited Johnson Gachuhi Makueni
Export Processing Zones Authority Michael Ngaruiya Project Executive Athi River
Export Trading Kungu Wainaina Nairobi

84
[ KENYA Value Chain Roadmap foR pulSeS ]
2nd stakeholders consultation – aug 6,7 2015Institution / Organization Invitee Title Location
Ministry of Agriculture, Livestock and Fisheries Annastacia Kivuva Nairobi
Machakos County Government Sheila Mueni MukunyaChief officer – Dept of Trade, Economic Planning and Industrialisation Machakos
Trans Nzoia County Government Veronica OkothMinister for Economic Planning, Commerce and Industry Nanyuki
Embu County Government Dr. Francis Nyaga Kathuri Chief officer – Agriculture Embu
Kitui County Government Charles Muthui Kang’e County Minister for Agriculture, Water & Irrigation Kitui
Makueni County Government Mr.jacobus Mutuku KiiluCounty Minister for Agriculture, Livestock and Fisheries Makueni
Meru County Government Severino Kinge ManeneCounty Minister for Agriculture, Livestock and Fisheries Meru
Export Processing Zones Authority Margaret Waithaka GM Business Development Athi River
Export Processing Zones Authority Michael Ngaruiya Project Executive Athi River
Export Promotion Council Ruth Mwaniki Chief Executive Nairobi
Kenya Bureau of Standards Mugambi Michubu Nairobi
Kepsa Daniel Ndung’u Nairobi
National Cross Border Traders Association David Erulu Awilie Nairobi
Cereal Growers Association Antony Kioko CEO Nairobi
Eastern Africa Farmers Federation ( Eaff ) Steven Muchiri CEO Nairobi
Kilimo Biashara Initiative Florence Mbugua Nairobi
Kamili Packers Ltd Sunil Shah Nairobi
Spiceworld Ltd Beju Shah Nairobi
Tesamco Traders Theresia Mugore Nairobi
Export Trading Kungu Wainaina Nairobi
Namutech Enterprises Cleophas Namusiule Nairobi
Pisu & Co. Ltd Amos Okasido Nairobi
Mjengo Ltd Anne Ndunda Thika
Phoenix Procurement John Mungo Nairobi
Nafics Grain Trading Isaac Chege Nairobi
Kings Commodities Bonface Kagechu Nairobi
Winnies Pure Health Tarah Gitau Nairobi
Seaboard Overseas Fadhil Haji Mombasa
Capital Reef Kirit Kanabar Mombasa
Nakumatt Holdings Jackson Ndegwa Nairobi
Cargill Alex Dietz Nairobi
Combic Limited Monica Ndegwa Nairobi
Shree Sai Enterprises Bina Patel Nairobi
Agritrade Moses Gichuru Nairobi
Amani Flour Mills Njoro Mathew Nairobi
Food Chain Millers Anthony Ndirangu Nairobi
Kenya Institute of Food Science Technology Joyce Kiio Kiambu
Kephis Esther Kimani
Kenya Agricultural Research Institute Dr. Mulinge Nairobi
Photo: (CC BY-SA 2.0) CIAT (CC BY-SA 2.0), bean market3.Apg
[ ROADMAP PLAN OF ACTION ]
85
Institution / Organization Invitee Title Location
Consultative Group For International Agricultural Research ( Cgiar ) Joseph Karugia Nairobi
Tegemeo Institute ( Egerton University ) Francis Karim Nairobi
Jomo Kenyatta University of Agriculture & Technology Dr. David M. Nburu Dean, Faculty of Agriculture Nairobi
Kenya Agricultural & Livestock Research Organisation David Karanja Nairobi
Chase Bank Sam Donga Nairobi
Equity Bank George Macharia Nairobi
Kenya Commercial Bank Betty Maloba Nairobi
Transnational Bank Sammy Langat Nairobi
Agricultural Finance Corporation Andrew Tuimur Managing Director Nairobi
Unaitas Sacco Society Ltd Jadiel Kinyua Chief Manager, Credit Nairobi
Kenya Red Cross Suada Ibrahim Manager, Disaster Risk Reduction Nairobi
Kenya Red Cross Elijah Muli Advisor, Disaster Risk Nairobi

FSC is an independent, non-governmental, not for profit organization established to promote the responsible management of the world´s forests.
Printed by ITC Digital Printing Service on FSC paper, which is environmentally-friendly paper (without chlorine) using vegetable-based inks. The printed matter is recyclable.

Sponsored by :
In partnership with :
Street address: ITC, 54-56, rue de Montbrillant, 1202 Geneva, Switzerland
Postal address: ITC, Palais des Nations, 1211 Geneva 10, Switzerland
Telephone: +41-22 730 0111 Fax: +41-22 733 4439E-mail: [email protected]: www.intracen.org