Study to Select Value Chain and Analyze Selected Value Chain
74
Study to Select Value Chain and Analyze Selected Value Chain Presentation on Value Chain Assessment
Transcript of Study to Select Value Chain and Analyze Selected Value Chain

Study to Select Value Chain and
Analyze Selected Value Chain
Presentation on Value Chain Assessment
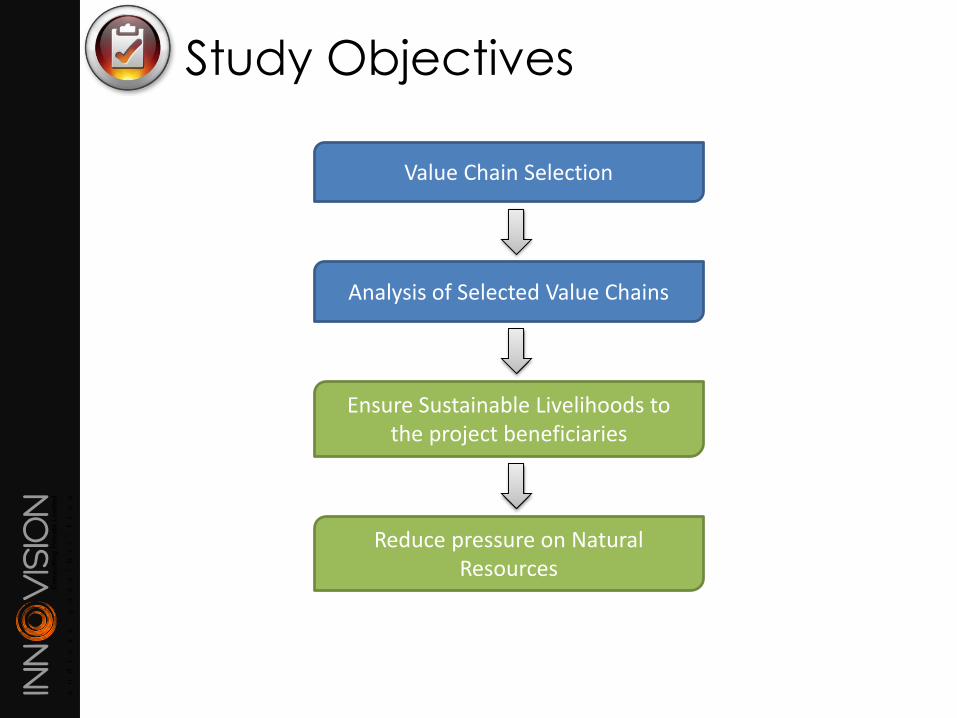
Study Objectives
Value Chain Selection
Analysis of Selected Value Chains
Ensure Sustainable Livelihoods tothe project beneficiaries
Reduce pressure on Natural Resources
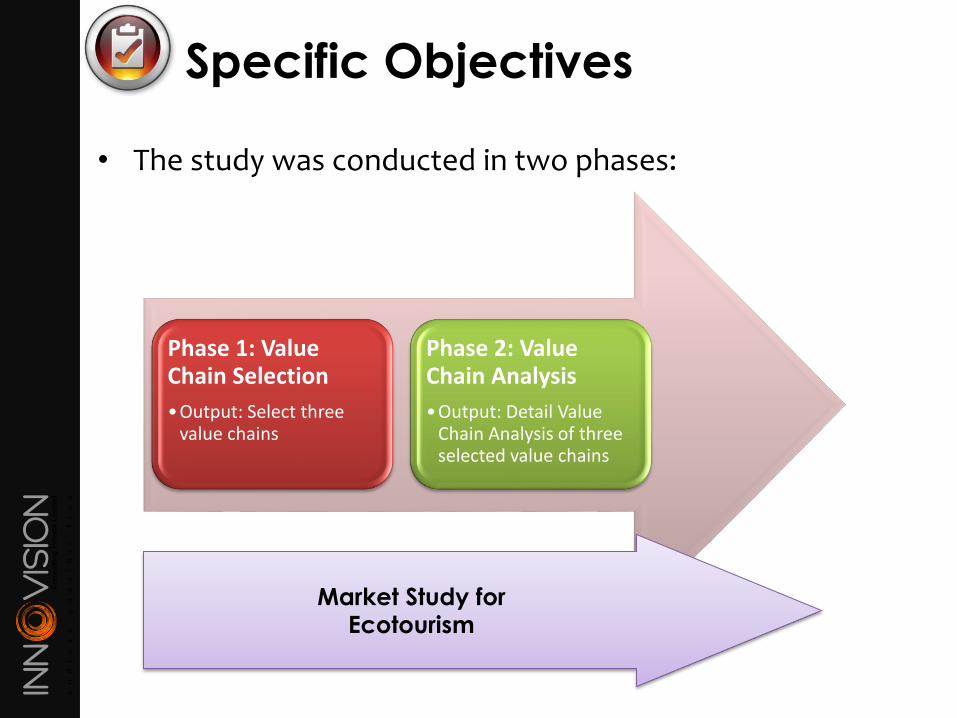
Specific Objectives
• The study was conducted in two phases:
Phase 1: Value Chain Selection
•Output: Select three value chains
Phase 2: Value Chain Analysis
•Output: Detail Value Chain Analysis of three selected value chains
Market Study for Ecotourism
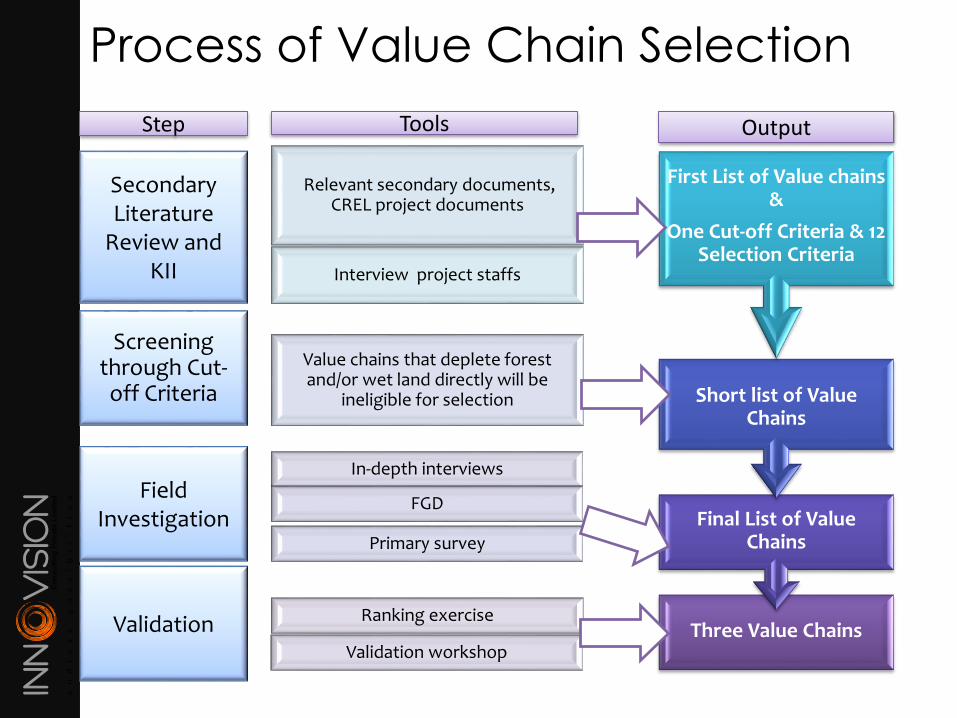
Process of Value Chain Selection
Three Value ChainsRanking exercise
Validation workshop
Final List of Value Chains
In-depth interviews
FGD
Primary survey
Short list of Value Chains
Value chains that deplete forest and/or wet land directly will be
ineligible for selection
First List of Value chains &
One Cut-off Criteria & 12 Selection Criteria
Relevant secondary documents, CREL project documents
Interview project staffs
Secondary Literature
Review and KII
Screening through Cut-off Criteria
Field Investigation
Validation
Step Tools Output
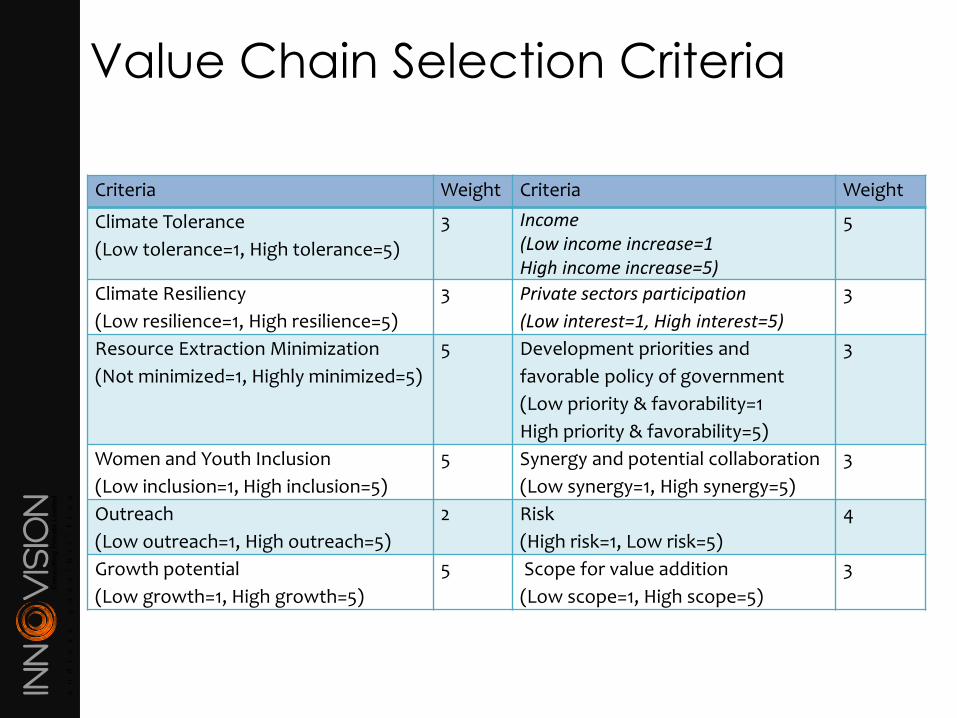
Value Chain Selection Criteria
Criteria Weight Criteria Weight
Climate Tolerance
(Low tolerance=1, High tolerance=5)
3 Income(Low income increase=1High income increase=5)
5
Climate Resiliency
(Low resilience=1, High resilience=5)
3 Private sectors participation
(Low interest=1, High interest=5)
3
Resource Extraction Minimization
(Not minimized=1, Highly minimized=5)
5 Development priorities and
favorable policy of government
(Low priority & favorability=1
High priority & favorability=5)
3
Women and Youth Inclusion
(Low inclusion=1, High inclusion=5)
5 Synergy and potential collaboration
(Low synergy=1, High synergy=5)
3
Outreach
(Low outreach=1, High outreach=5)
2 Risk
(High risk=1, Low risk=5)
4
Growth potential
(Low growth=1, High growth=5)
5 Scope for value addition
(Low scope=1, High scope=5)
3
CREL Livelihood Officer & MDO
directly participated in most of the
interviews with Innovision Team
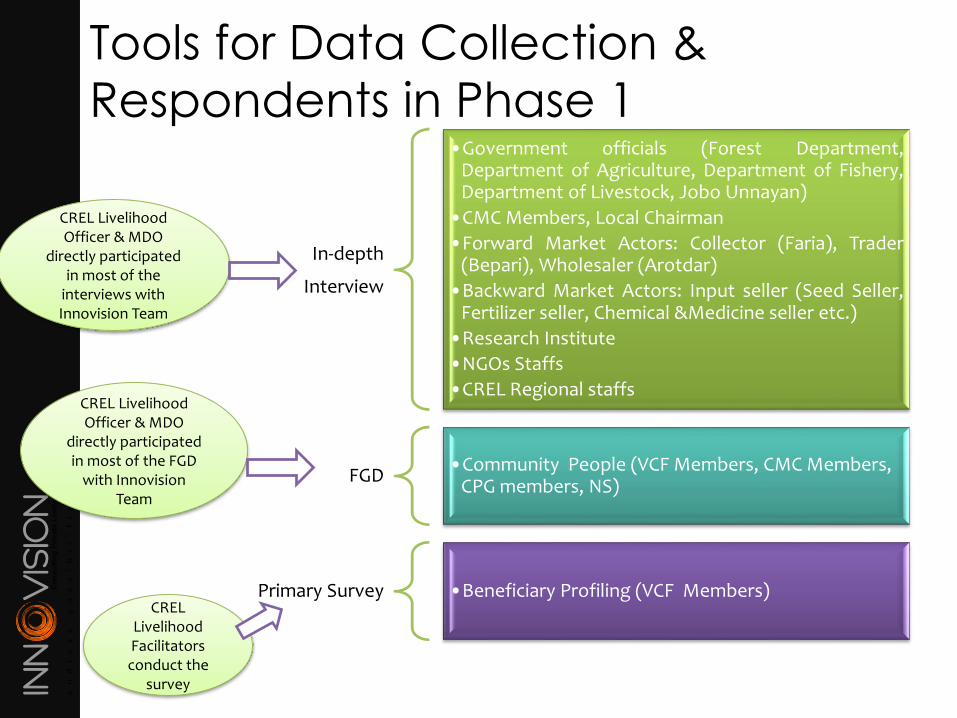
Tools for Data Collection &
Respondents in Phase 1
In-depth
Interview
•Government officials (Forest Department,Department of Agriculture, Department of Fishery,Department of Livestock, Jobo Unnayan)
•CMC Members, Local Chairman
•Forward Market Actors: Collector (Faria), Trader(Bepari), Wholesaler (Arotdar)
•Backward Market Actors: Input seller (Seed Seller,Fertilizer seller, Chemical &Medicine seller etc.)
•Research Institute
•NGOs Staffs
•CREL Regional staffs
FGD•Community People (VCF Members, CMC Members,
CPG members, NS)
Primary Survey •Beneficiary Profiling (VCF Members)
CREL Livelihood Officer & MDO
directly participated in most of the FGD
with Innovision Team
CREL Livelihood Facilitators conduct the
survey
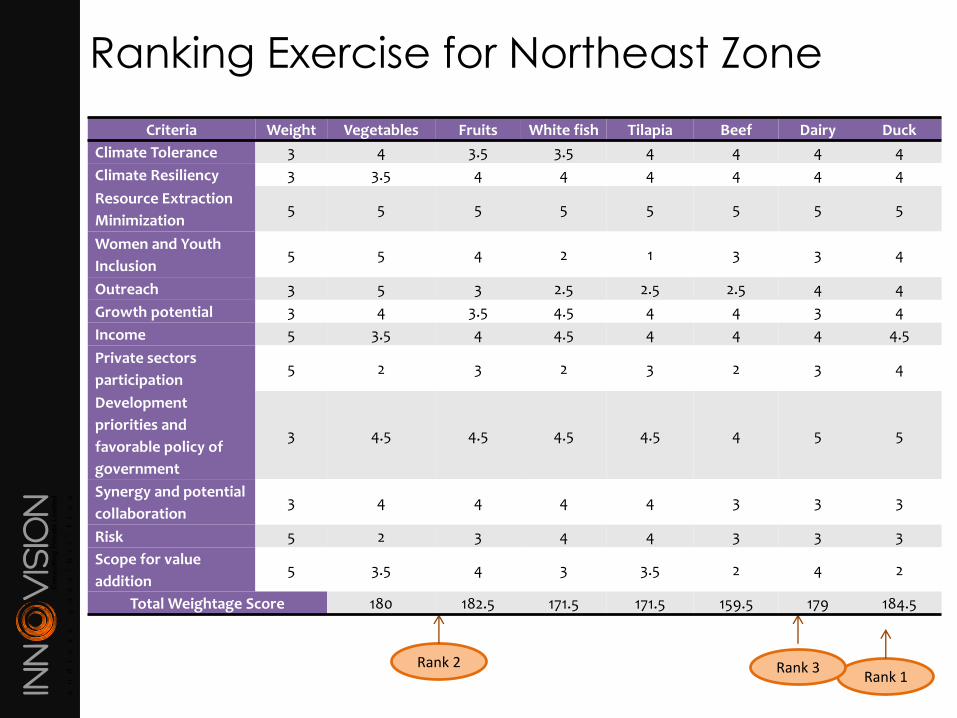
Ranking Exercise for Northeast Zone
Rank 1Rank 3Rank 2
Criteria Weight Vegetables Fruits White fish Tilapia Beef Dairy Duck
Climate Tolerance 3 4 3.5 3.5 4 4 4 4
Climate Resiliency 3 3.5 4 4 4 4 4 4
Resource Extraction
Minimization5 5 5 5 5 5 5 5
Women and Youth
Inclusion5 5 4 2 1 3 3 4
Outreach 3 5 3 2.5 2.5 2.5 4 4
Growth potential 3 4 3.5 4.5 4 4 3 4
Income 5 3.5 4 4.5 4 4 4 4.5
Private sectors
participation5 2 3 2 3 2 3 4
Development
priorities and
favorable policy of
government
3 4.5 4.5 4.5 4.5 4 5 5
Synergy and potential
collaboration3 4 4 4 4 3 3 3
Risk 5 2 3 4 4 3 3 3
Scope for value
addition5 3.5 4 3 3.5 2 4 2
Total Weightage Score 180 182.5 171.5 171.5 159.5 179 184.5
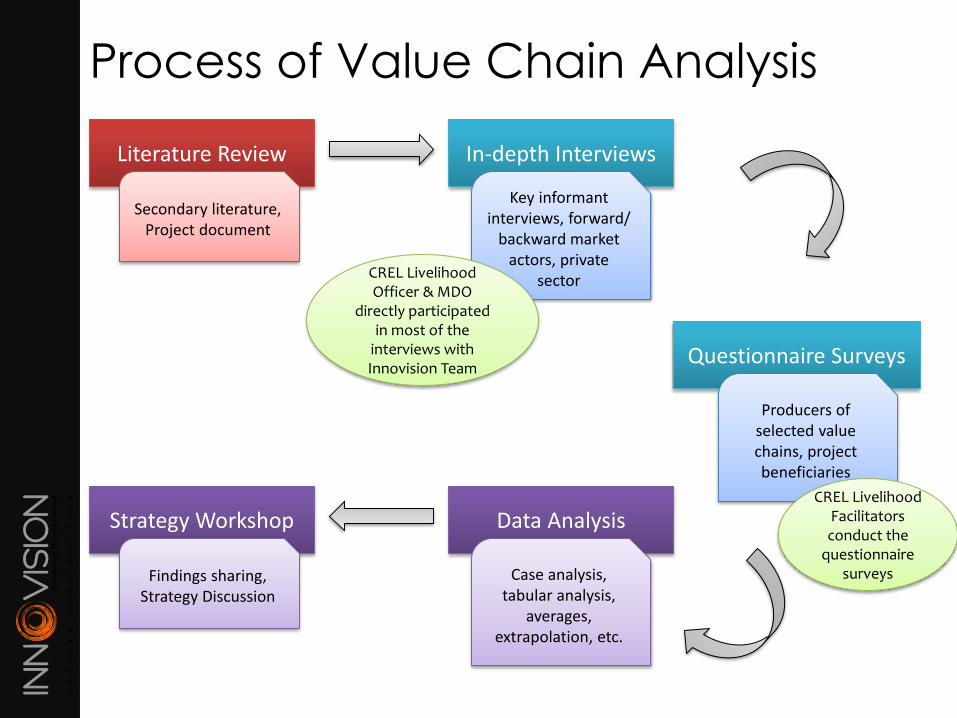
Process of Value Chain Analysis
Literature Review
Secondary literature, Project document
In-depth Interviews
Key informant interviews, forward/
backward market actors, private
sector
Questionnaire Surveys
Producers of selected value chains, project beneficiaries
Data Analysis
Case analysis, tabular analysis,
averages, extrapolation, etc.
Strategy Workshop
Findings sharing, Strategy Discussion
CREL Livelihood Officer & MDO
directly participated in most of the
interviews with Innovision Team
CREL Livelihood Facilitators conduct the
questionnaire surveys
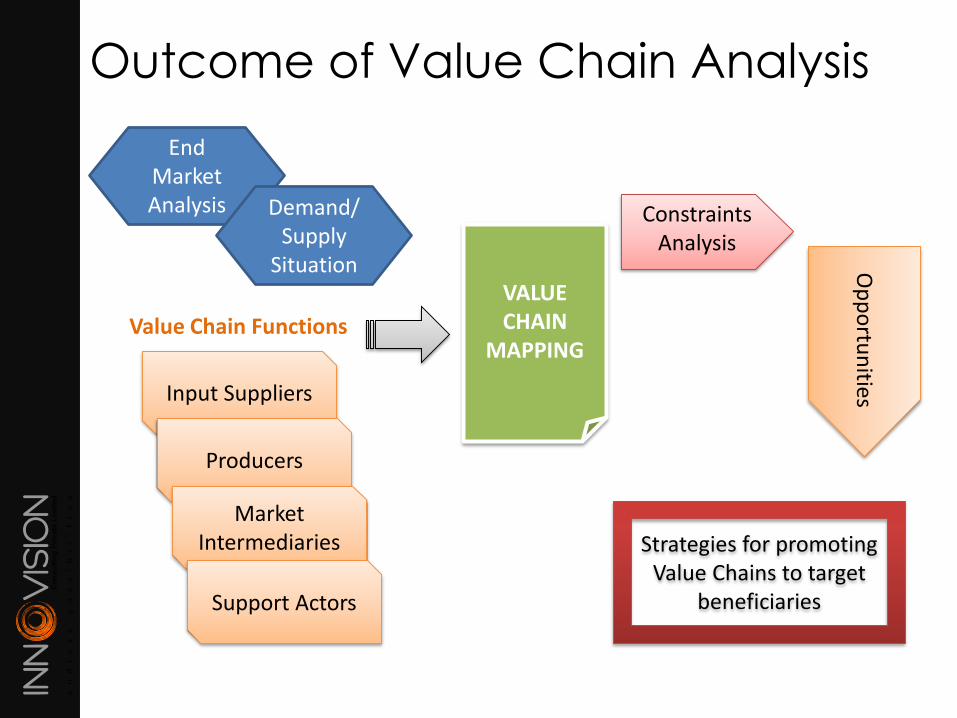
Outcome of Value Chain Analysis
End Market Analysis Demand/
Supply Situation
Input Suppliers
Producers
Market Intermediaries
Support Actors
Value Chain Functions
VALUE CHAIN
MAPPING
Op
po
rtun
ities
Strategies for promoting Value Chains to target
beneficiaries
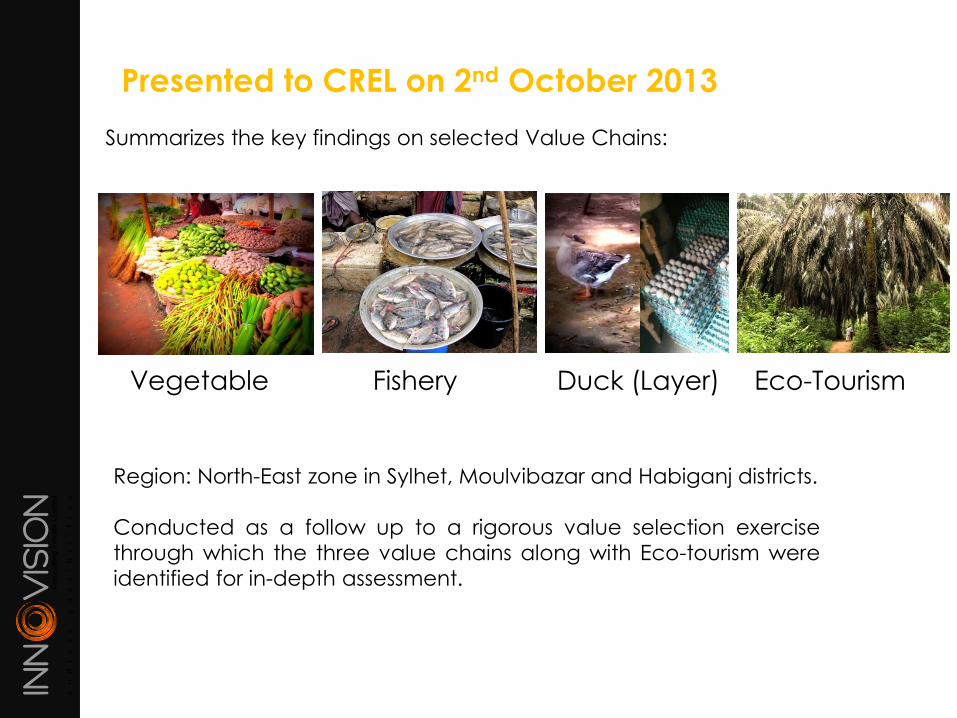
Presented to CREL on 2nd October 2013
Summarizes the key findings on selected Value Chains:
Region: North-East zone in Sylhet, Moulvibazar and Habiganj districts.
Conducted as a follow up to a rigorous value selection exercise
through which the three value chains along with Eco-tourism were
identified for in-depth assessment.
Vegetable Fishery Duck (Layer) Eco-Tourism
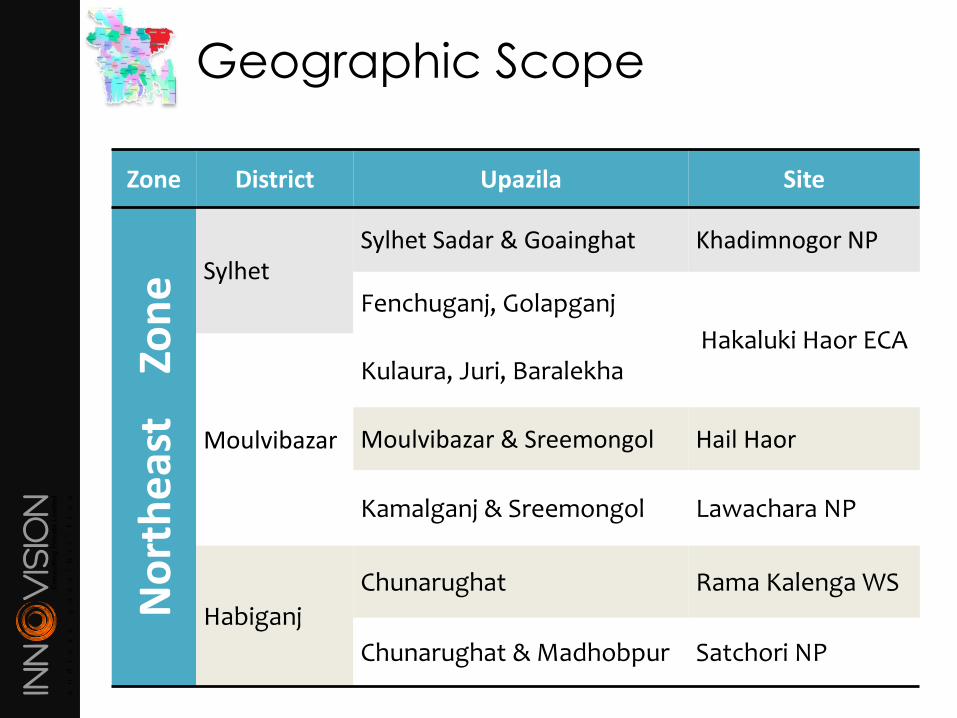
Geographic Scope
Zone District Upazila SiteN
ort
he
ast
Zo
ne Sylhet
Sylhet Sadar & Goainghat Khadimnogor NP
Fenchuganj, Golapganj
Hakaluki Haor ECA
Moulvibazar
Kulaura, Juri, Baralekha
Moulvibazar & Sreemongol Hail Haor
Kamalganj & Sreemongol Lawachara NP
Habiganj
Chunarughat Rama Kalenga WS
Chunarughat & Madhobpur Satchori NP
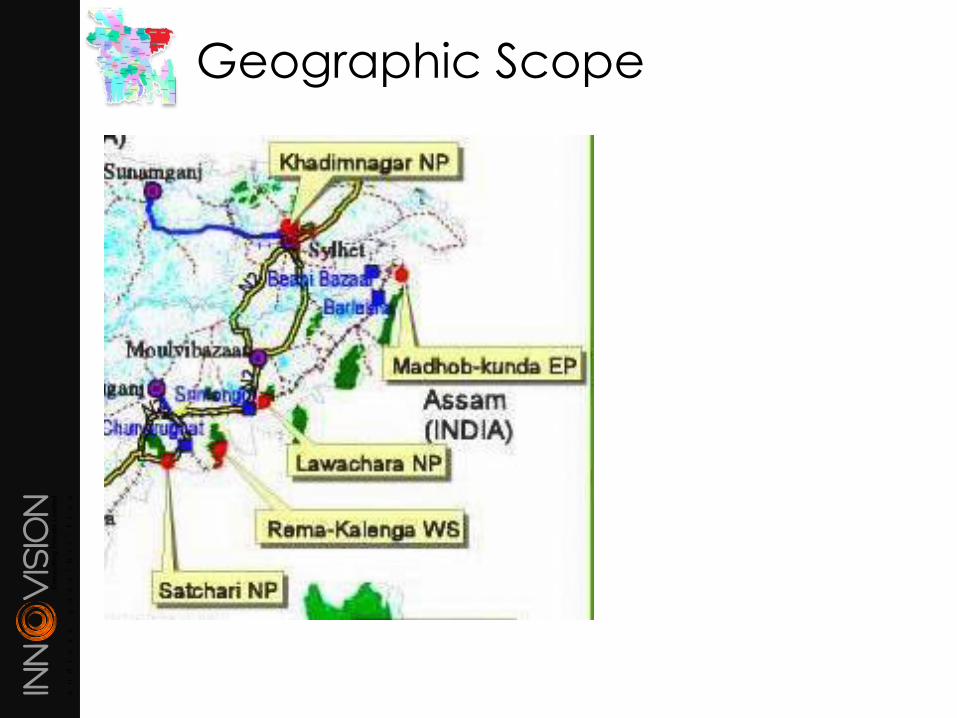
Geographic Scope
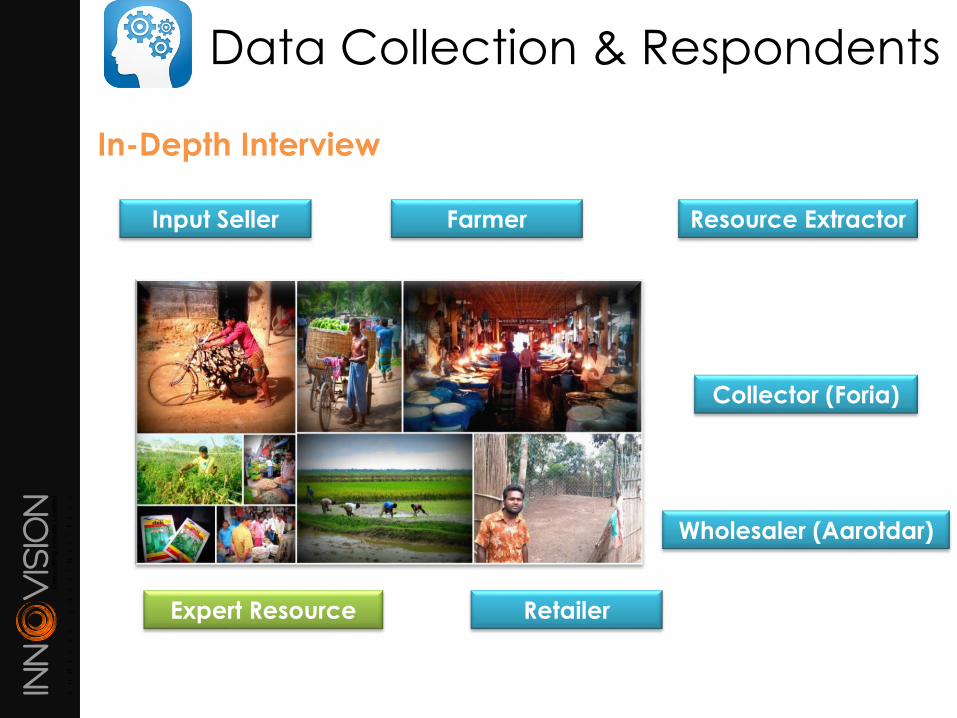
Data Collection & Respondents
Farmer
In-Depth Interview
Input Seller
Collector (Foria)
Wholesaler (Aarotdar)
RetailerExpert Resource
Resource Extractor
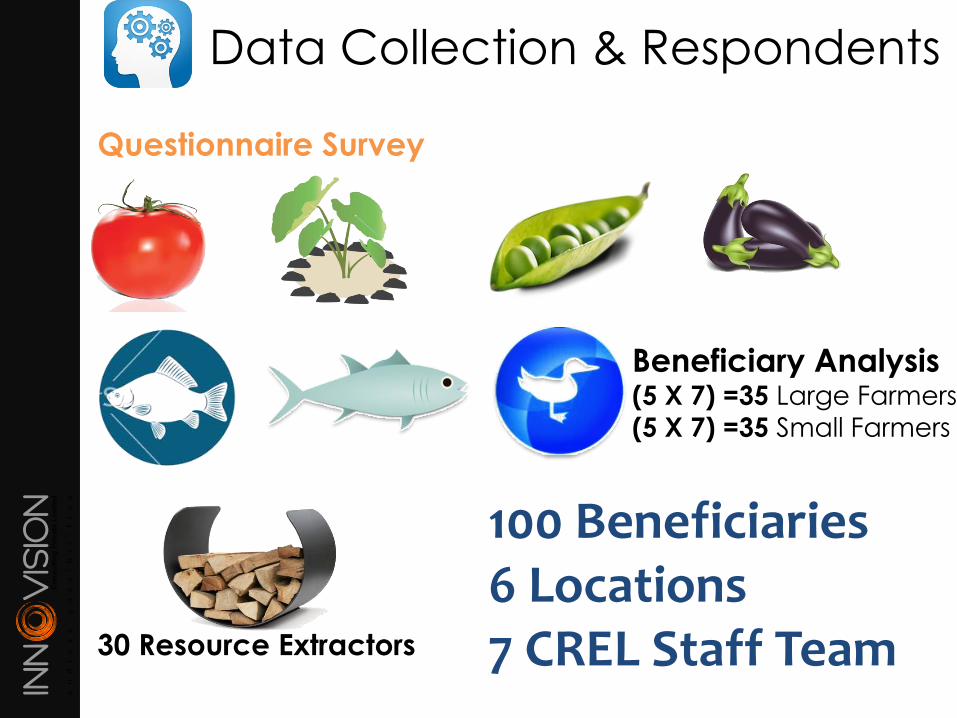
Questionnaire Survey
Data Collection & Respondents
100 Beneficiaries6 Locations7 CREL Staff Team
Beneficiary Analysis(5 X 7) =35 Large Farmers
(5 X 7) =35 Small Farmers
30 Resource Extractors
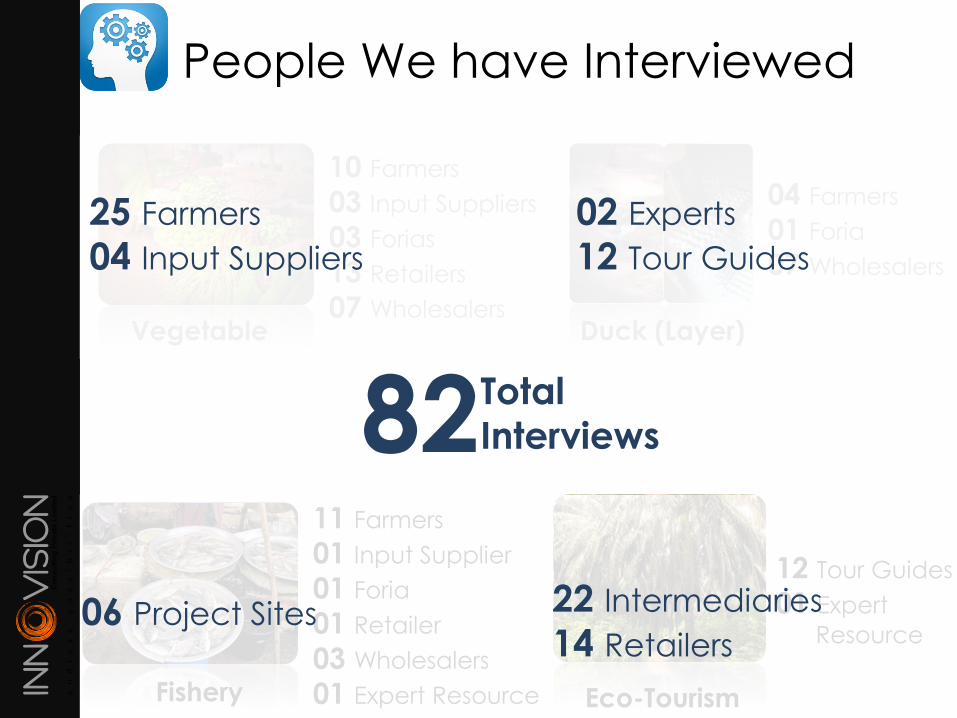
Duck (Layer)
04 Farmers
01 Foria
07 Wholesalers
Vegetable
10 Farmers
03 Input Suppliers
03 Forias
13 Retailers
07 Wholesalers
Fishery
11 Farmers
01 Input Supplier
01 Foria
01 Retailer
03 Wholesalers
01 Expert Resource Eco-Tourism
12 Tour Guides
01 Expert
Resource
People We have Interviewed
25 Farmers
04 Input Suppliers
22 Intermediaries
14 Retailers
82Total Interviews
02 Experts
12 Tour Guides
06 Project Sites
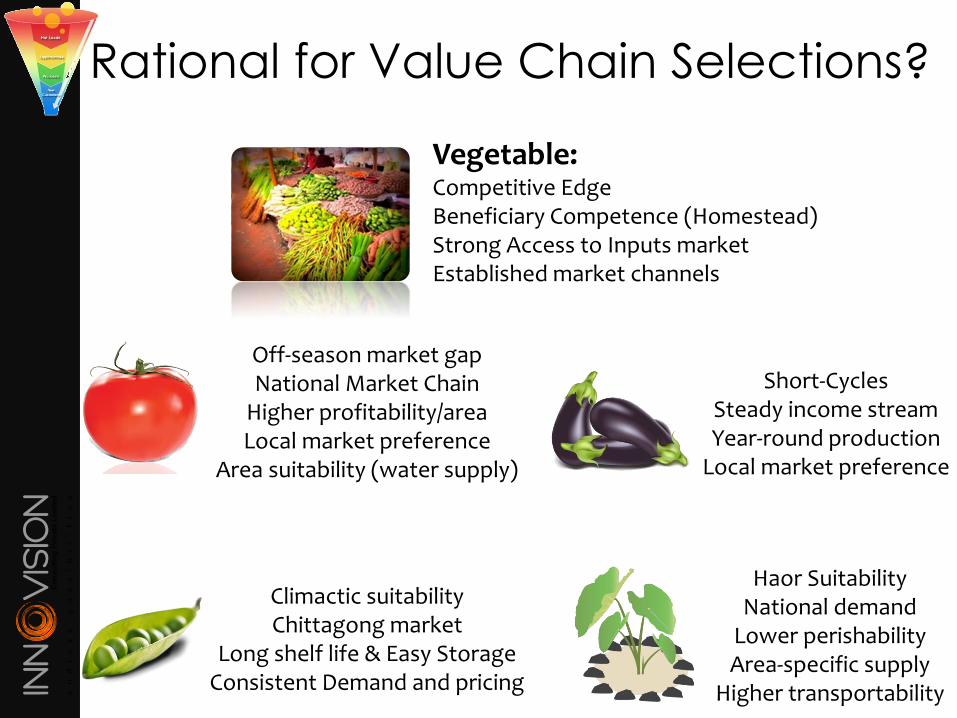
Rational for Value Chain Selections?
Vegetable:Competitive EdgeBeneficiary Competence (Homestead)Strong Access to Inputs marketEstablished market channels
Climactic suitabilityChittagong market
Long shelf life & Easy StorageConsistent Demand and pricing
Haor SuitabilityNational demand
Lower perishabilityArea-specific supply
Higher transportability
Off-season market gapNational Market Chain
Higher profitability/areaLocal market preference
Area suitability (water supply)
Short-CyclesSteady income streamYear-round production
Local market preference
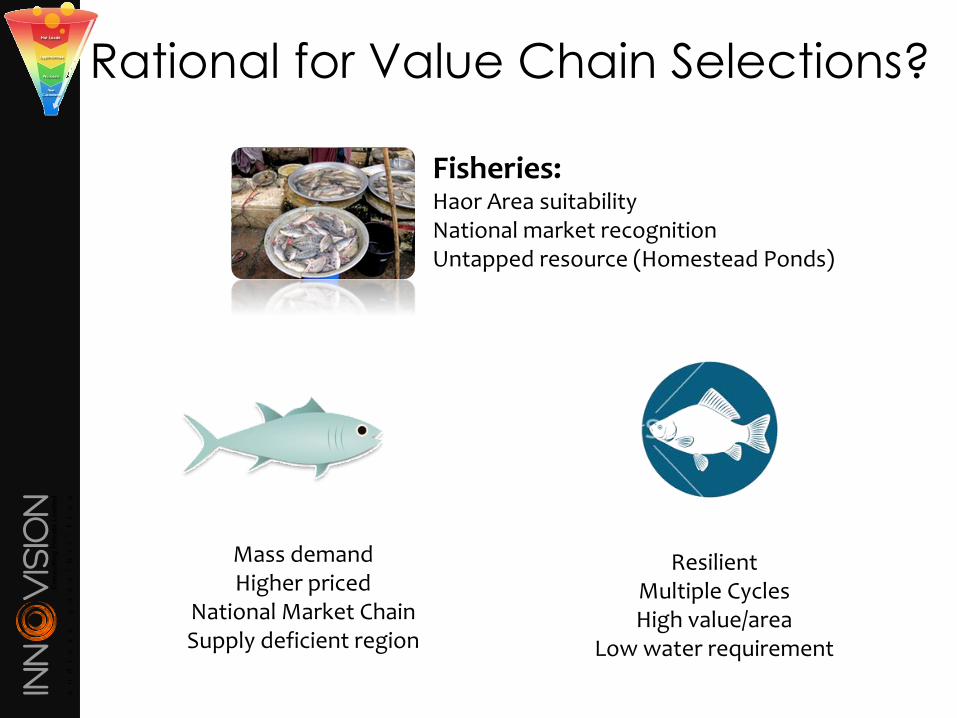
Fisheries:Haor Area suitabilityNational market recognitionUntapped resource (Homestead Ponds)
Rational for Value Chain Selections?
Mass demandHigher priced
National Market ChainSupply deficient region
ResilientMultiple CyclesHigh value/area
Low water requirement
Rational for Value Chain Selections?
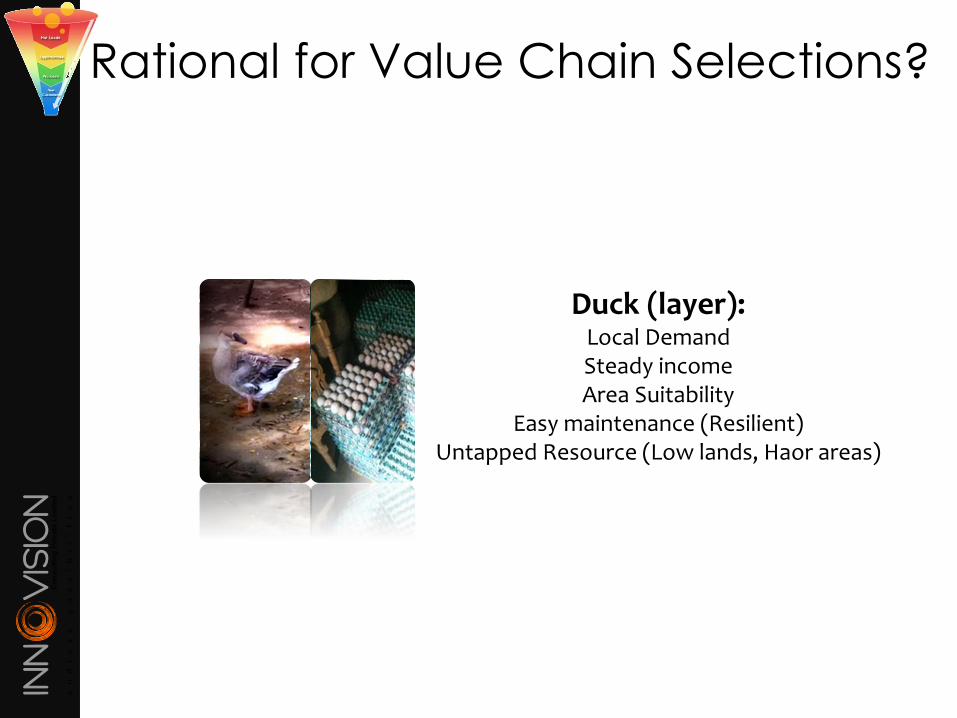
Duck (layer):Local DemandSteady incomeArea Suitability
Easy maintenance (Resilient)Untapped Resource (Low lands, Haor areas)
Value Chain Analysis:
VEGETABLE
End Market Analysis
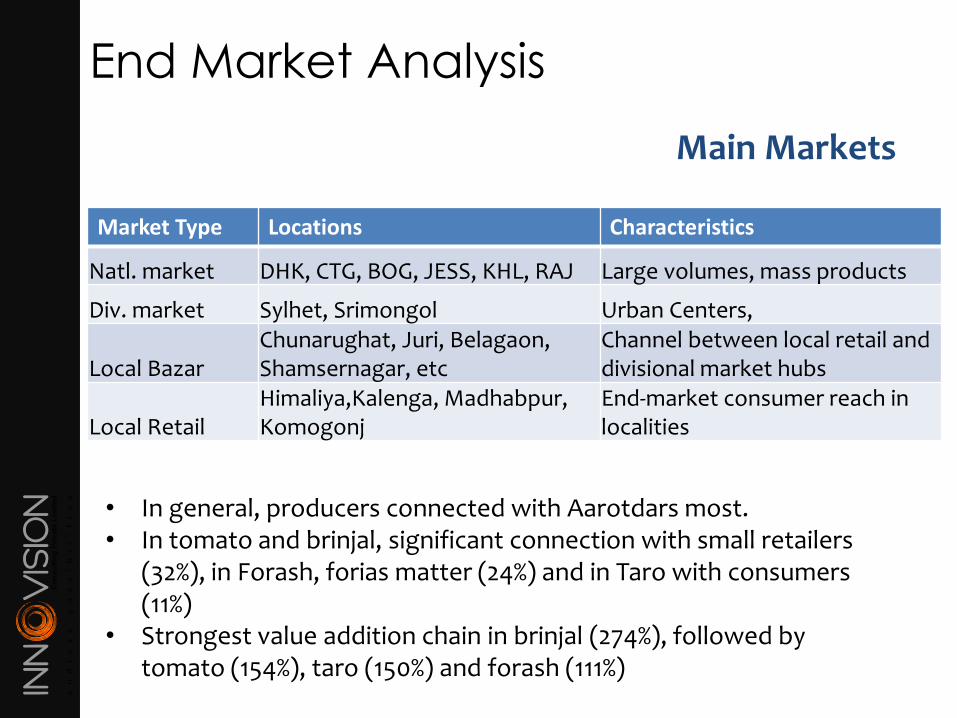
Main Markets
Market Type Locations Characteristics
Natl. market DHK, CTG, BOG, JESS, KHL, RAJ Large volumes, mass products
Div. market Sylhet, Srimongol Urban Centers,
Local BazarChunarughat, Juri, Belagaon, Shamsernagar, etc
Channel between local retail and divisional market hubs
Local RetailHimaliya,Kalenga, Madhabpur, Komogonj
End-market consumer reach in localities
• In general, producers connected with Aarotdars most.• In tomato and brinjal, significant connection with small retailers
(32%), in Forash, forias matter (24%) and in Taro with consumers (11%)
• Strongest value addition chain in brinjal (274%), followed by tomato (154%), taro (150%) and forash (111%)
End Market Analysis
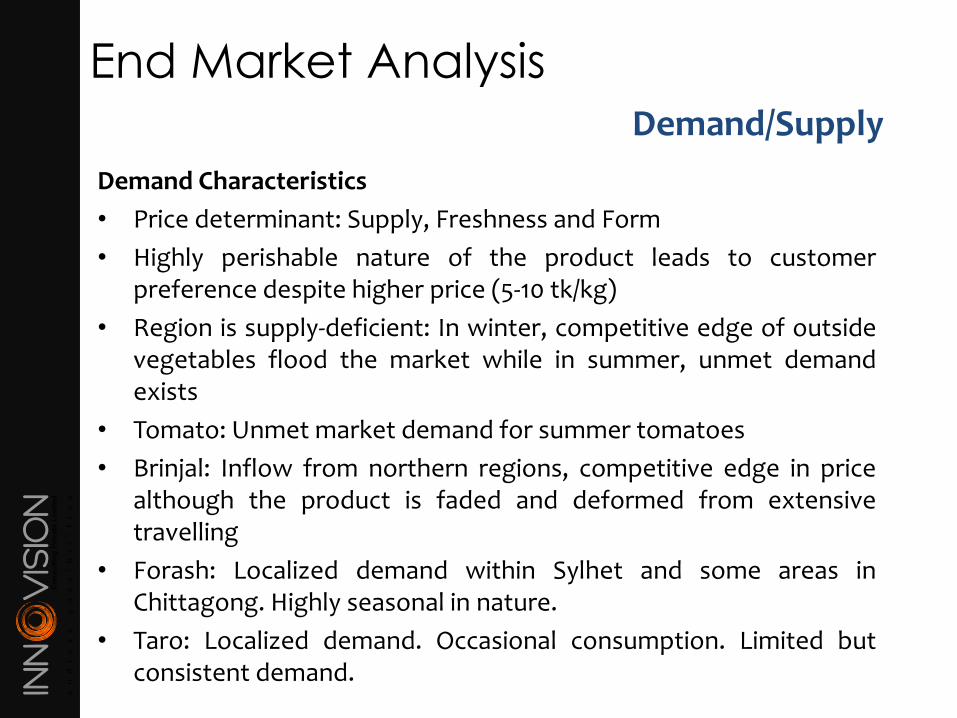
Demand/Supply
Demand Characteristics
• Price determinant: Supply, Freshness and Form
• Highly perishable nature of the product leads to customerpreference despite higher price (5-10 tk/kg)
• Region is supply-deficient: In winter, competitive edge of outsidevegetables flood the market while in summer, unmet demandexists
• Tomato: Unmet market demand for summer tomatoes
• Brinjal: Inflow from northern regions, competitive edge in pricealthough the product is faded and deformed from extensivetravelling
• Forash: Localized demand within Sylhet and some areas inChittagong. Highly seasonal in nature.
• Taro: Localized demand. Occasional consumption. Limited butconsistent demand.
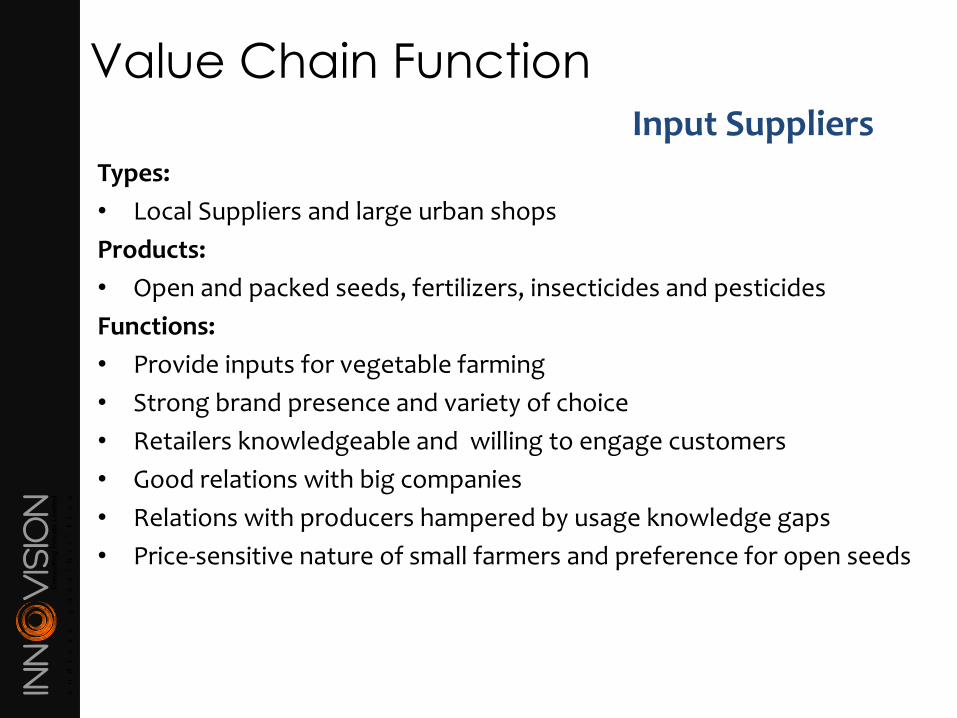
Value Chain Function
Types:
• Local Suppliers and large urban shops
Products:
• Open and packed seeds, fertilizers, insecticides and pesticides
Functions:
• Provide inputs for vegetable farming
• Strong brand presence and variety of choice
• Retailers knowledgeable and willing to engage customers
• Good relations with big companies
• Relations with producers hampered by usage knowledge gaps
• Price-sensitive nature of small farmers and preference for open seeds
Input Suppliers
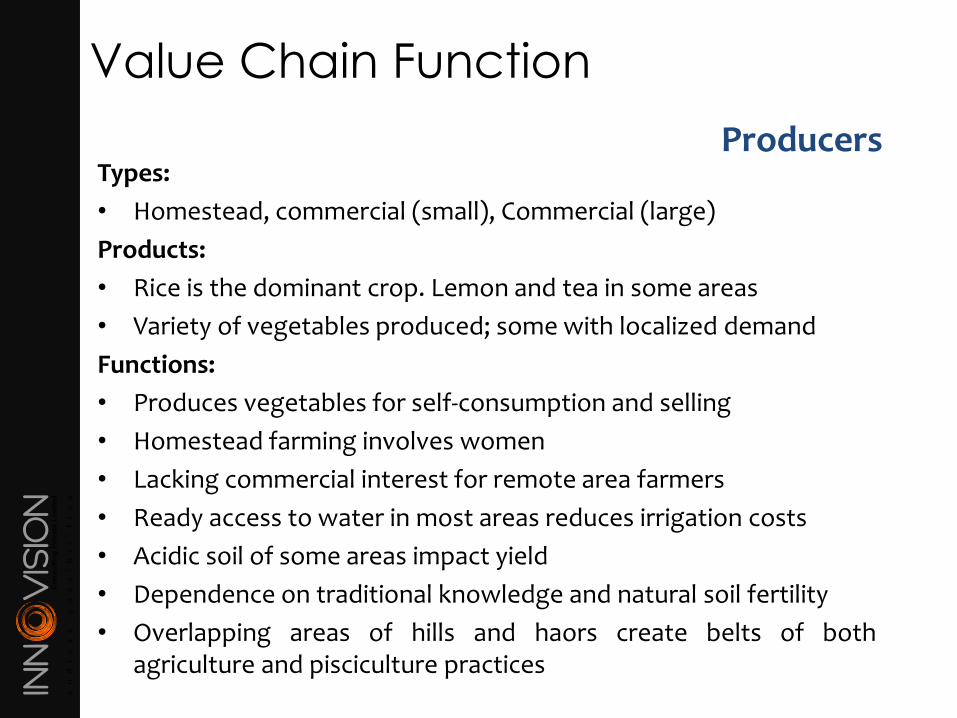
Value Chain Function
Types:
• Homestead, commercial (small), Commercial (large)
Products:
• Rice is the dominant crop. Lemon and tea in some areas
• Variety of vegetables produced; some with localized demand
Functions:
• Produces vegetables for self-consumption and selling
• Homestead farming involves women
• Lacking commercial interest for remote area farmers
• Ready access to water in most areas reduces irrigation costs
• Acidic soil of some areas impact yield
• Dependence on traditional knowledge and natural soil fertility
• Overlapping areas of hills and haors create belts of bothagriculture and pisciculture practices
Producers
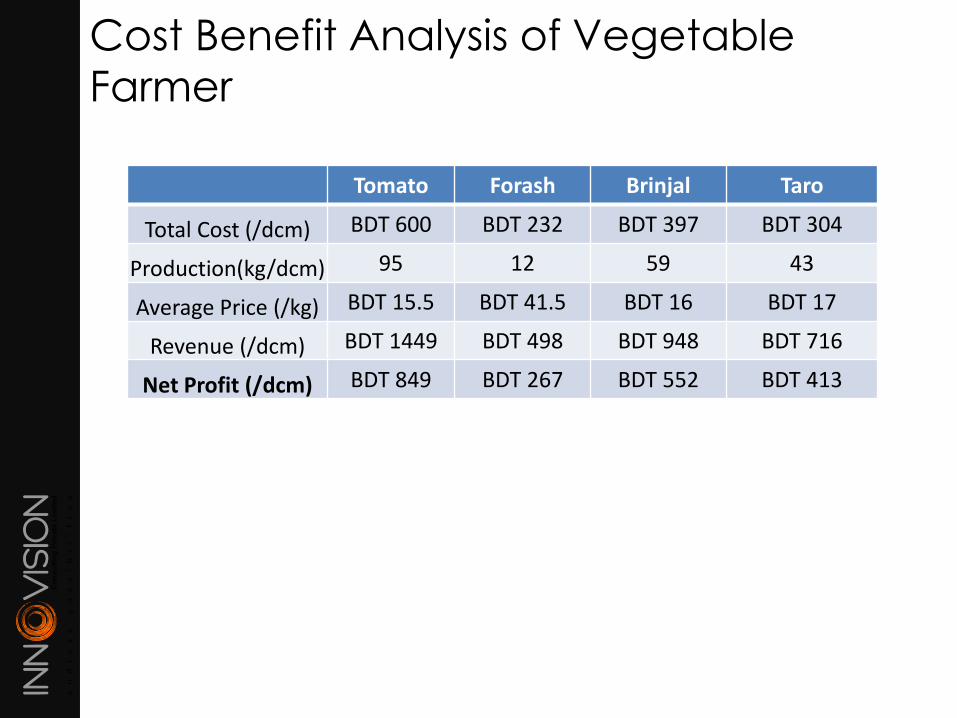
Cost Benefit Analysis of Vegetable
Farmer
Tomato Forash Brinjal Taro
Total Cost (/dcm) BDT 600 BDT 232 BDT 397 BDT 304
Production(kg/dcm) 95 12 59 43
Average Price (/kg) BDT 15.5 BDT 41.5 BDT 16 BDT 17
Revenue (/dcm) BDT 1449 BDT 498 BDT 948 BDT 716
Net Profit (/dcm) BDT 849 BDT 267 BDT 552 BDT 413
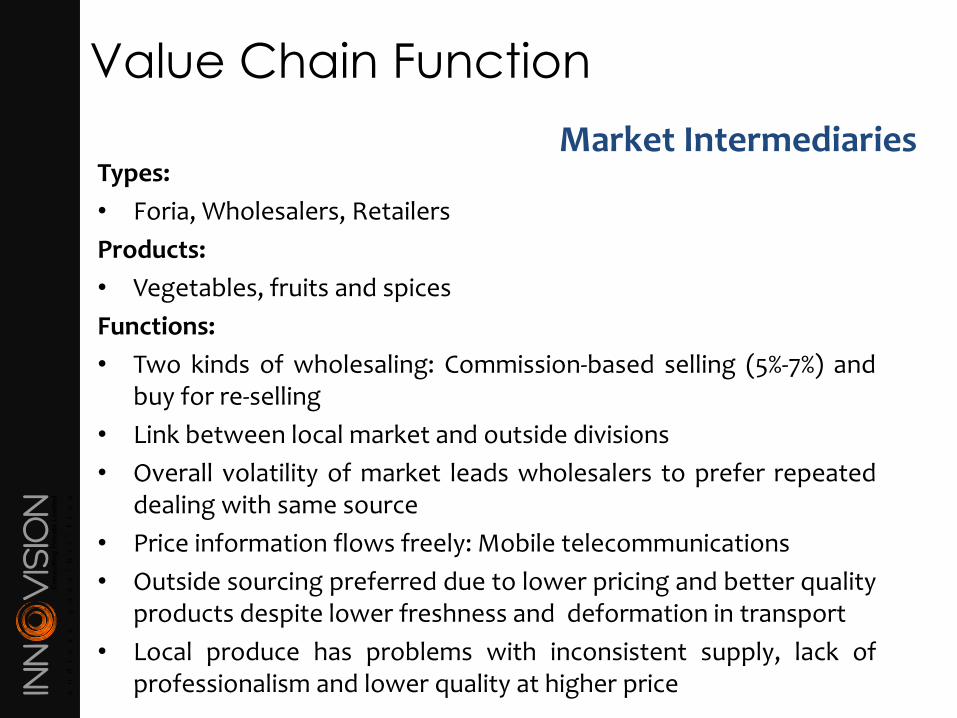
Value Chain Function
Types:
• Foria, Wholesalers, Retailers
Products:
• Vegetables, fruits and spices
Functions:
• Two kinds of wholesaling: Commission-based selling (5%-7%) andbuy for re-selling
• Link between local market and outside divisions
• Overall volatility of market leads wholesalers to prefer repeateddealing with same source
• Price information flows freely: Mobile telecommunications
• Outside sourcing preferred due to lower pricing and better qualityproducts despite lower freshness and deformation in transport
• Local produce has problems with inconsistent supply, lack ofprofessionalism and lower quality at higher price
Market Intermediaries
Value Chain Function
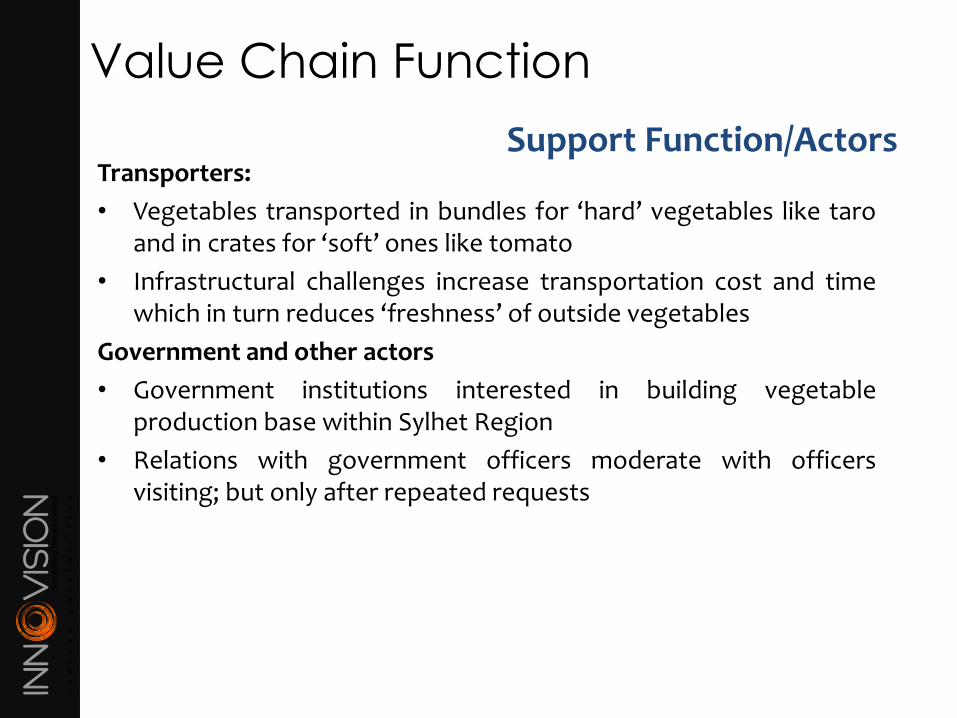
Transporters:
• Vegetables transported in bundles for ‘hard’ vegetables like taroand in crates for ‘soft’ ones like tomato
• Infrastructural challenges increase transportation cost and timewhich in turn reduces ‘freshness’ of outside vegetables
Government and other actors
• Government institutions interested in building vegetableproduction base within Sylhet Region
• Relations with government officers moderate with officersvisiting; but only after repeated requests
Support Function/Actors
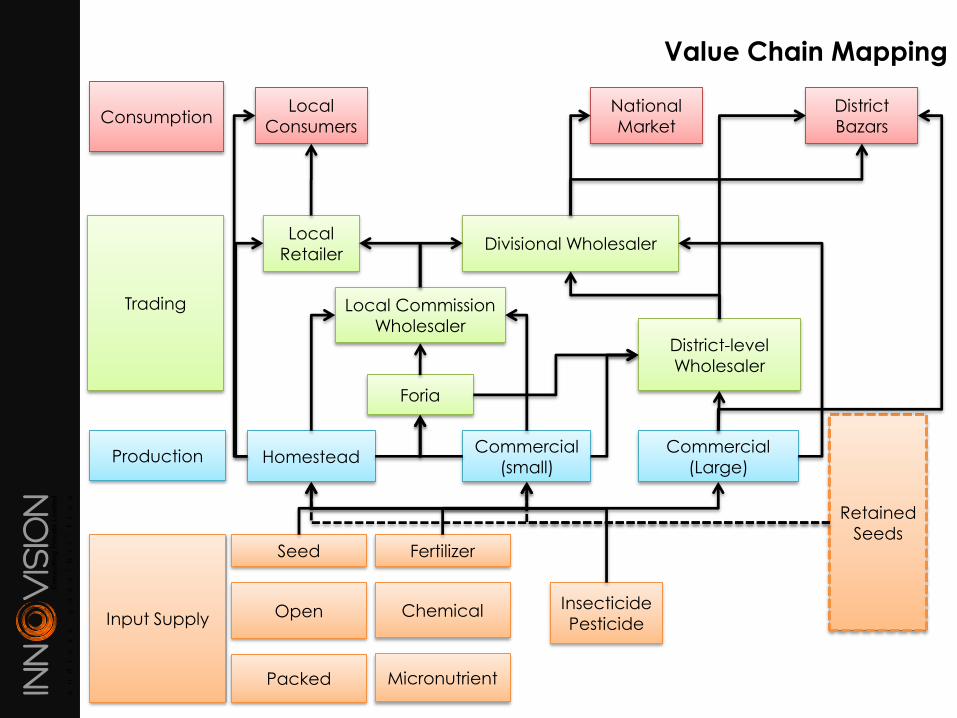
Consumption
Input Supply
Production
Packed
Open
Retained
Seeds
Homestead
Local Commission
Wholesaler
Trading
Value Chain Mapping
Insecticide
Pesticide
Commercial
(small)
Commercial
(Large)
Seed Fertilizer
Micronutrient
Chemical
District-level
Wholesaler
Divisional WholesalerLocal
Retailer
Local
Consumers
National
Market
District
Bazars
Foria
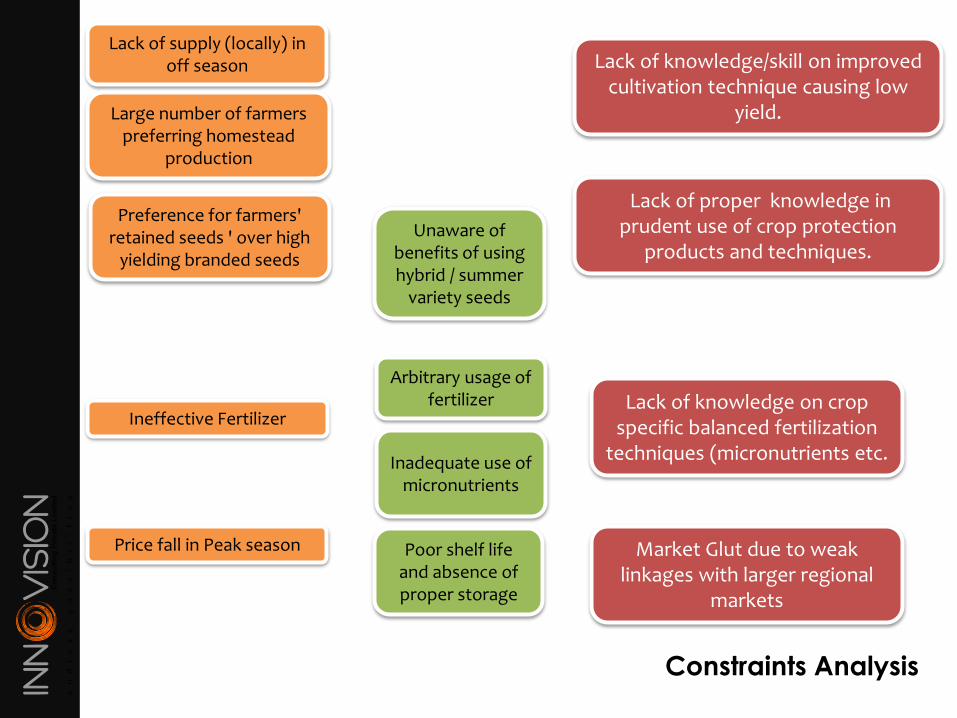
Constraints Analysis
Lack of supply (locally) in off season
Large number of farmers preferring homestead
production
Preference for farmers' retained seeds ' over high
yielding branded seeds
Poor shelf life and absence of proper storage
Lack of knowledge/skill on improved cultivation technique causing low
yield.
Lack of proper knowledge in prudent use of crop protection
products and techniques.Unaware of
benefits of using hybrid / summer
variety seeds
Arbitrary usage of fertilizer
Inadequate use of micronutrients
Lack of knowledge on crop specific balanced fertilization
techniques (micronutrients etc.
Ineffective Fertilizer
Price fall in Peak season Market Glut due to weak linkages with larger regional
markets
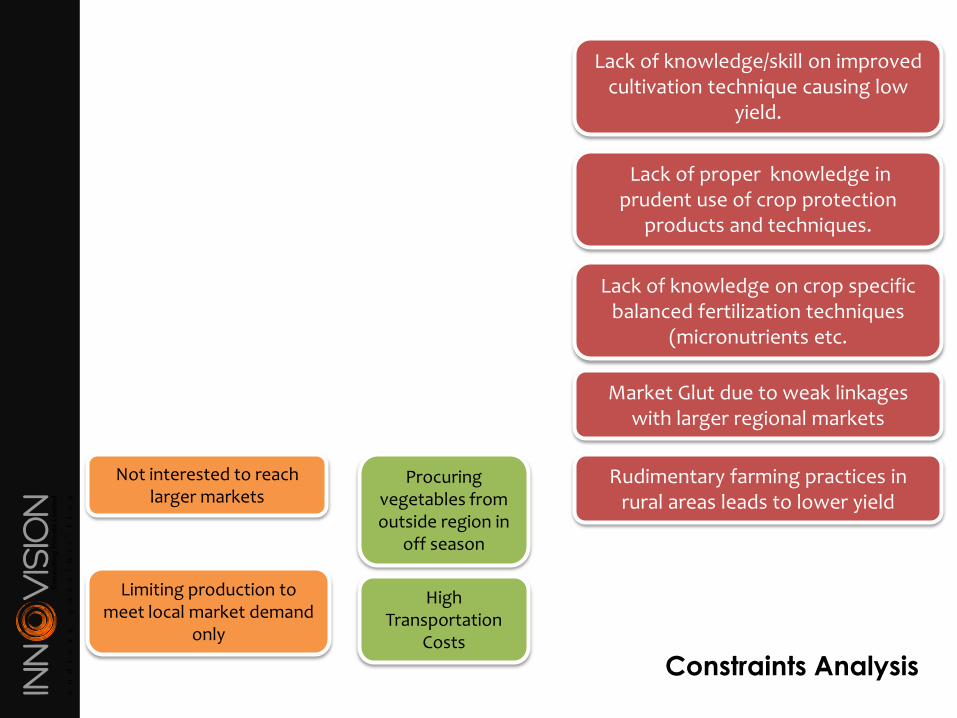
Constraints Analysis
Not interested to reach larger markets
Limiting production to meet local market demand
only
Lack of knowledge/skill on improved cultivation technique causing low
yield.
Lack of proper knowledge in prudent use of crop protection
products and techniques.
Procuring vegetables from outside region in
off season
Lack of knowledge on crop specific balanced fertilization techniques
(micronutrients etc.
Market Glut due to weak linkages with larger regional markets
High Transportation
Costs
Rudimentary farming practices in rural areas leads to lower yield
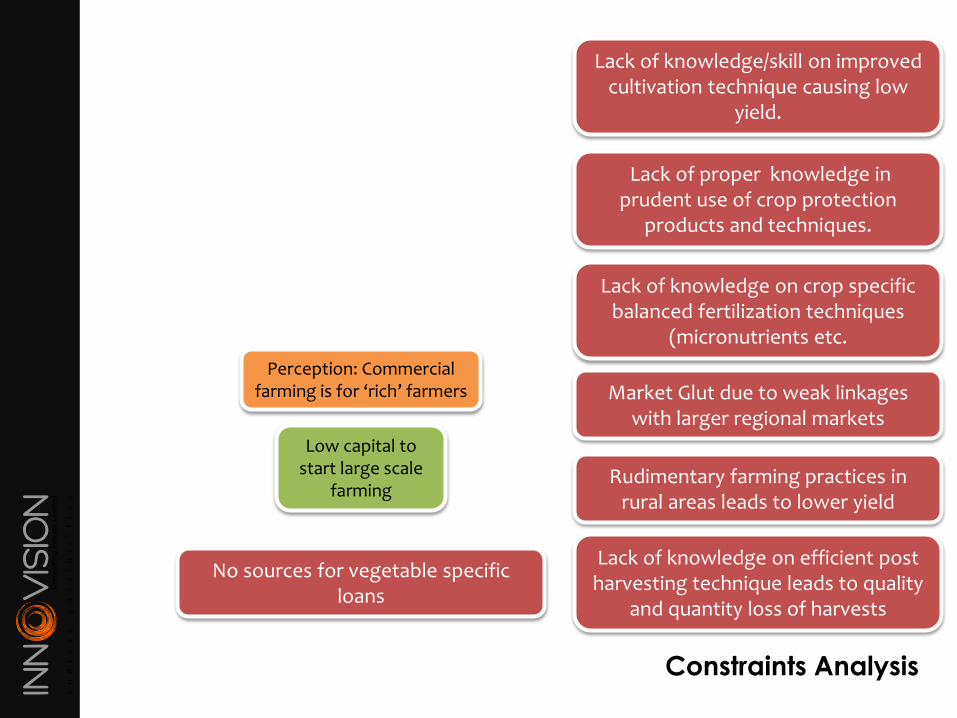
Constraints Analysis
Perception: Commercial farming is for ‘rich’ farmers
Lack of knowledge/skill on improved cultivation technique causing low
yield.
Lack of proper knowledge in prudent use of crop protection
products and techniques.
Low capital to start large scale
farming
Lack of knowledge on crop specific balanced fertilization techniques
(micronutrients etc.
Market Glut due to weak linkages with larger regional markets
Rudimentary farming practices in rural areas leads to lower yield
Lack of knowledge on efficient post harvesting technique leads to quality
and quantity loss of harvests
No sources for vegetable specific loans
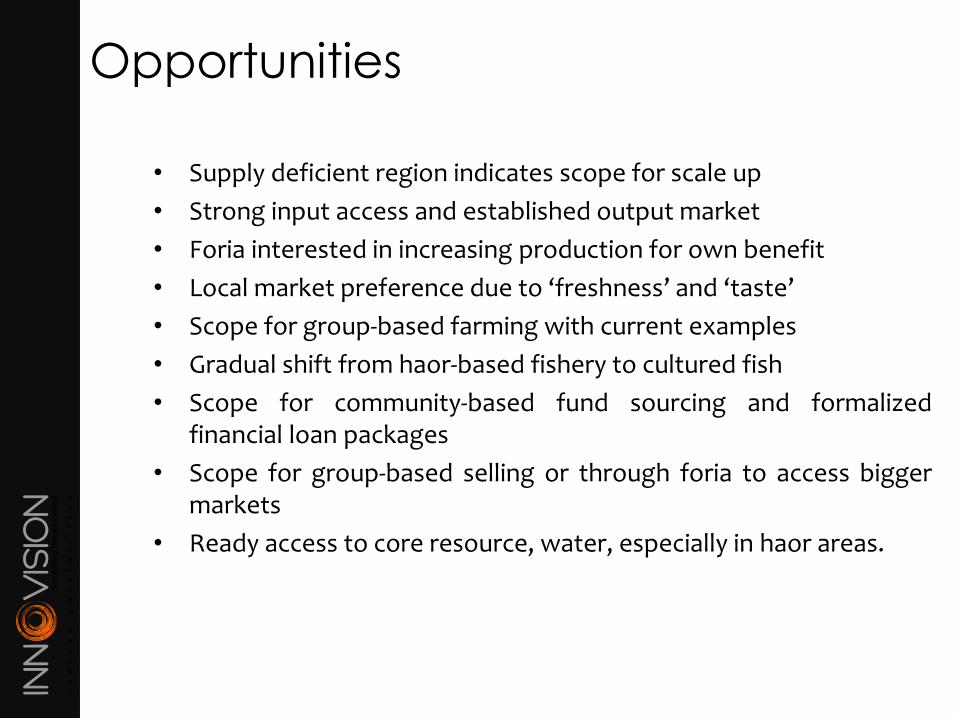
Opportunities
• Supply deficient region indicates scope for scale up
• Strong input access and established output market
• Foria interested in increasing production for own benefit
• Local market preference due to ‘freshness’ and ‘taste’
• Scope for group-based farming with current examples
• Gradual shift from haor-based fishery to cultured fish
• Scope for community-based fund sourcing and formalizedfinancial loan packages
• Scope for group-based selling or through foria to access biggermarkets
• Ready access to core resource, water, especially in haor areas.

Discussion on Strategies & Interventions
Value Chain Analysis:
Fishery
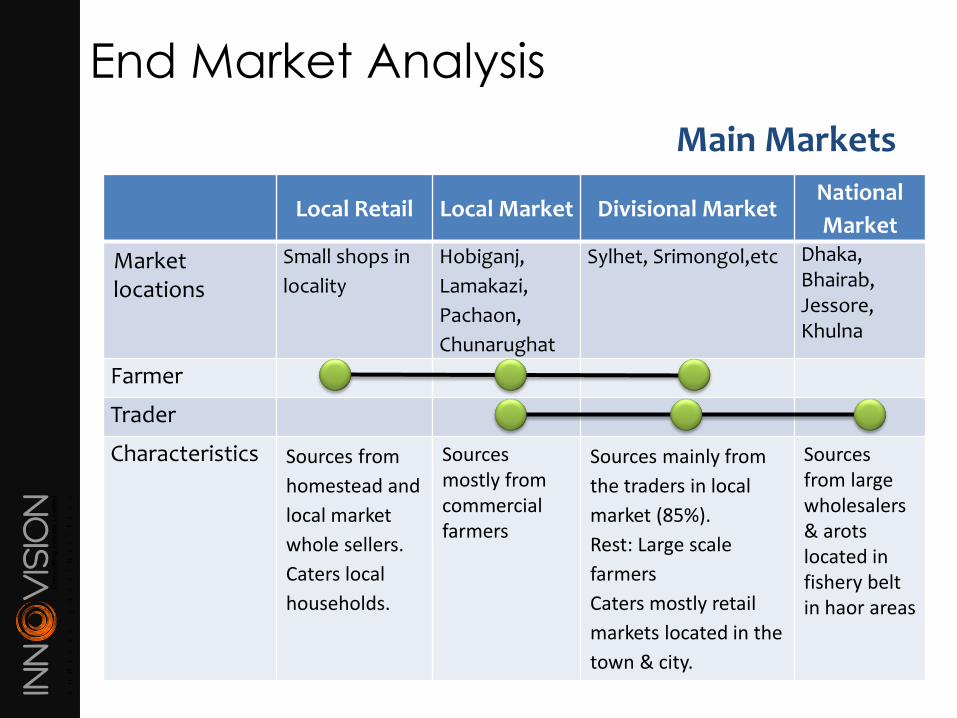
End Market Analysis
Main Markets
Local Retail Local Market Divisional MarketNational
Market
Market locations
Small shops in
locality
Hobiganj,
Lamakazi,
Pachaon,
Chunarughat
Sylhet, Srimongol,etc Dhaka,Bhairab, Jessore, Khulna
Farmer
Trader
Characteristics Sources from
homestead and
local market
whole sellers.
Caters local
households.
Sources mostly from commercial farmers
Sources mainly from
the traders in local
market (85%).
Rest: Large scale
farmers
Caters mostly retail
markets located in the
town & city.
Sources from large wholesalers & arotslocated in fishery belt in haor areas
End Market Analysis
Demand/Supply
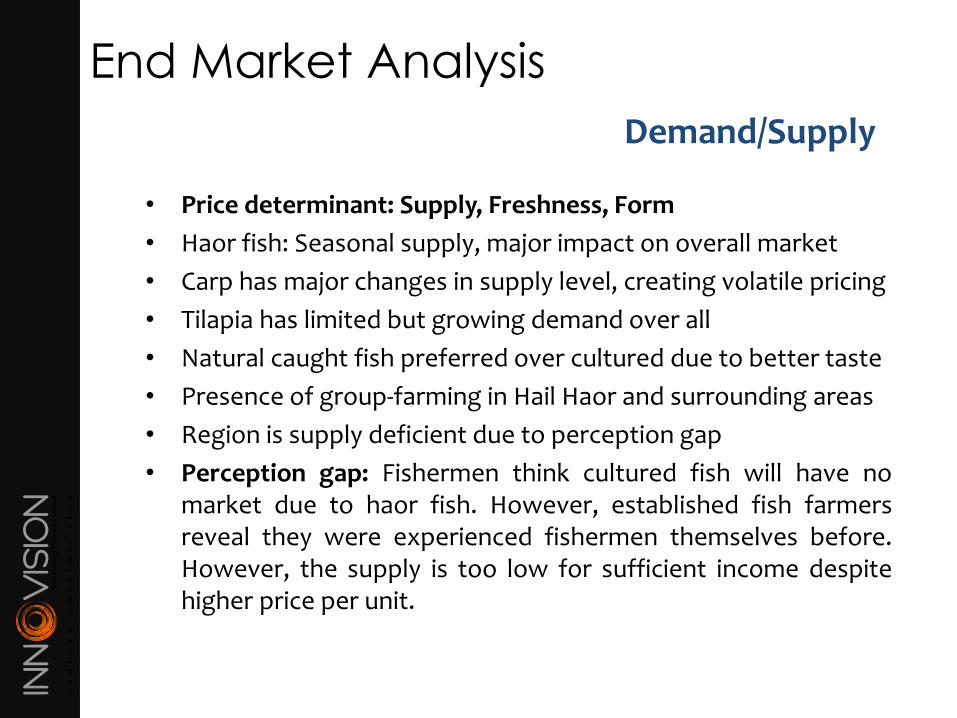
• Price determinant: Supply, Freshness, Form
• Haor fish: Seasonal supply, major impact on overall market
• Carp has major changes in supply level, creating volatile pricing
• Tilapia has limited but growing demand over all
• Natural caught fish preferred over cultured due to better taste
• Presence of group-farming in Hail Haor and surrounding areas
• Region is supply deficient due to perception gap
• Perception gap: Fishermen think cultured fish will have nomarket due to haor fish. However, established fish farmersreveal they were experienced fishermen themselves before.However, the supply is too low for sufficient income despitehigher price per unit.
Value Chain Function
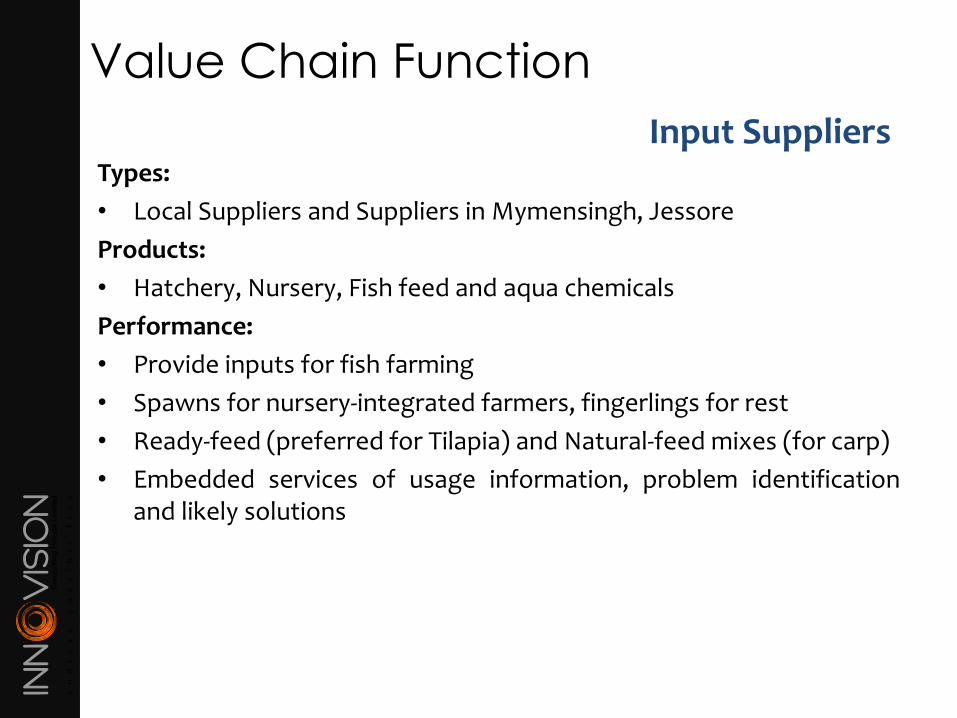
Types:
• Local Suppliers and Suppliers in Mymensingh, Jessore
Products:
• Hatchery, Nursery, Fish feed and aqua chemicals
Performance:
• Provide inputs for fish farming
• Spawns for nursery-integrated farmers, fingerlings for rest
• Ready-feed (preferred for Tilapia) and Natural-feed mixes (for carp)
• Embedded services of usage information, problem identificationand likely solutions
Input Suppliers
Value Chain Function
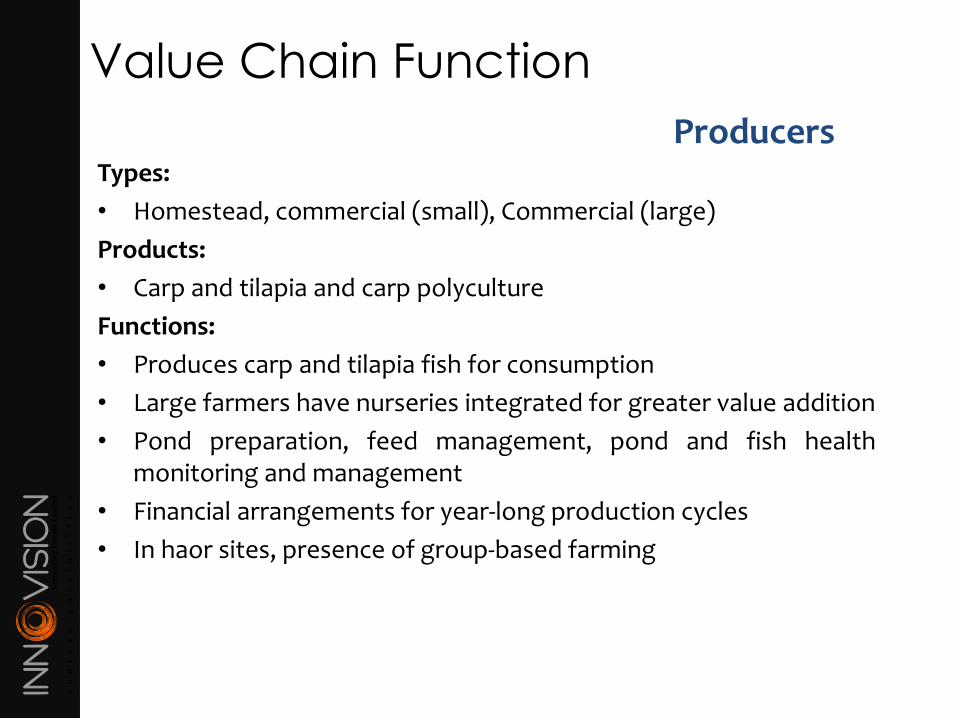
Types:
• Homestead, commercial (small), Commercial (large)
Products:
• Carp and tilapia and carp polyculture
Functions:
• Produces carp and tilapia fish for consumption
• Large farmers have nurseries integrated for greater value addition
• Pond preparation, feed management, pond and fish healthmonitoring and management
• Financial arrangements for year-long production cycles
• In haor sites, presence of group-based farming
Producers
Cost Benefit Analysis of Fish Farmer
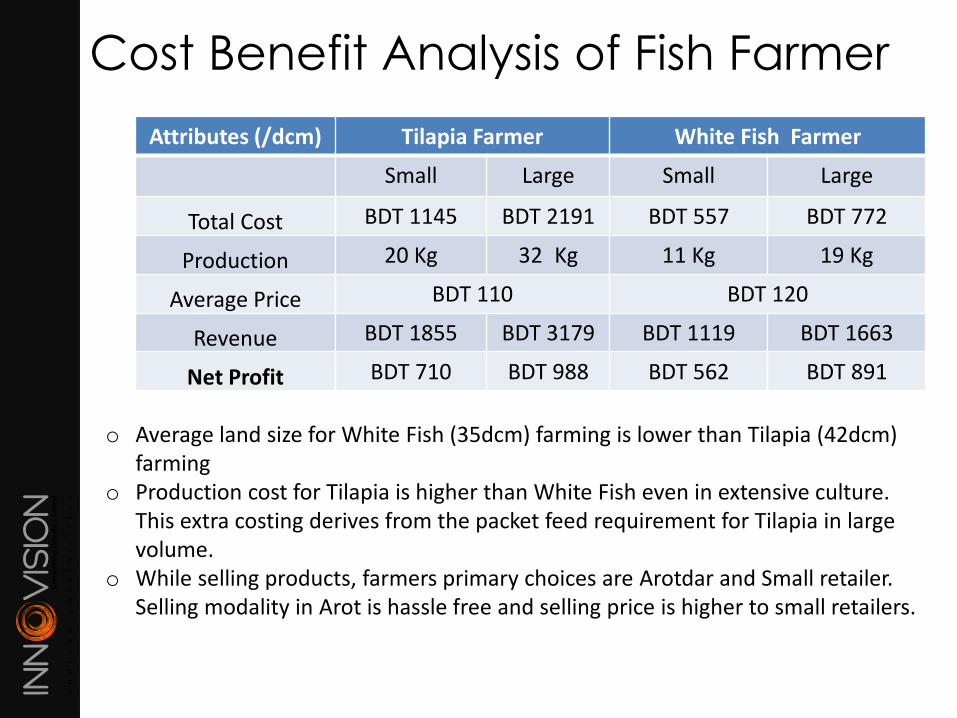
Attributes (/dcm) Tilapia Farmer White Fish Farmer
Small Large Small Large
Total Cost BDT 1145 BDT 2191 BDT 557 BDT 772
Production 20 Kg 32 Kg 11 Kg 19 Kg
Average Price BDT 110 BDT 120
Revenue BDT 1855 BDT 3179 BDT 1119 BDT 1663
Net Profit BDT 710 BDT 988 BDT 562 BDT 891
o Average land size for White Fish (35dcm) farming is lower than Tilapia (42dcm) farming
o Production cost for Tilapia is higher than White Fish even in extensive culture. This extra costing derives from the packet feed requirement for Tilapia in large volume.
o While selling products, farmers primary choices are Arotdar and Small retailer. Selling modality in Arot is hassle free and selling price is higher to small retailers.
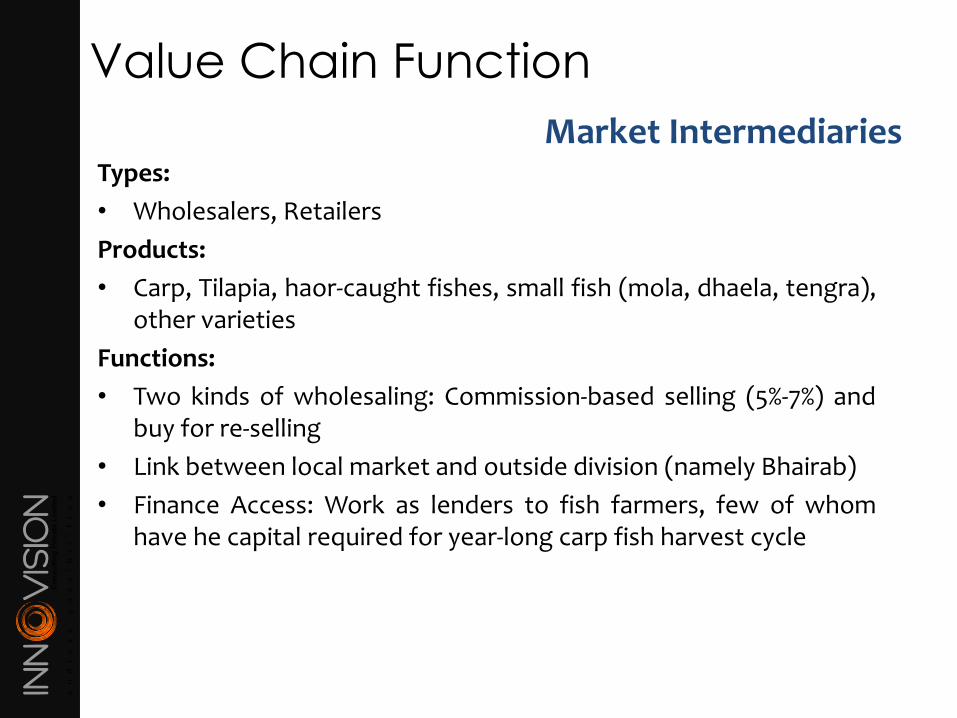
Value Chain Function
Types:
• Wholesalers, Retailers
Products:
• Carp, Tilapia, haor-caught fishes, small fish (mola, dhaela, tengra),other varieties
Functions:
• Two kinds of wholesaling: Commission-based selling (5%-7%) andbuy for re-selling
• Link between local market and outside division (namely Bhairab)
• Finance Access: Work as lenders to fish farmers, few of whomhave he capital required for year-long carp fish harvest cycle
Market Intermediaries
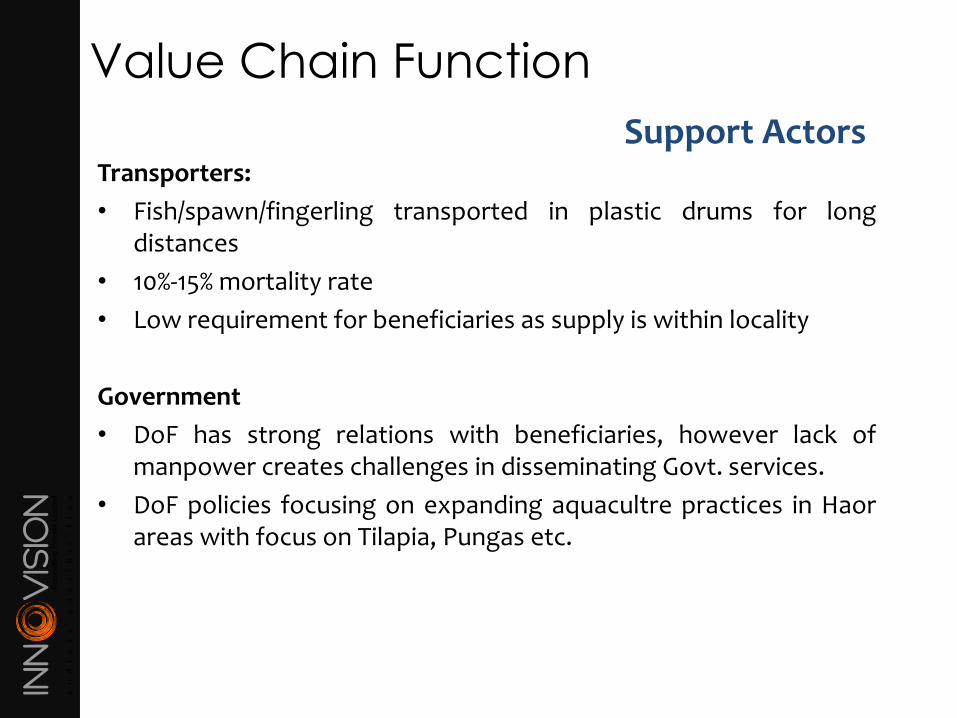
Value Chain Function
Transporters:
• Fish/spawn/fingerling transported in plastic drums for longdistances
• 10%-15% mortality rate
• Low requirement for beneficiaries as supply is within locality
Government
• DoF has strong relations with beneficiaries, however lack ofmanpower creates challenges in disseminating Govt. services.
• DoF policies focusing on expanding aquacultre practices in Haorareas with focus on Tilapia, Pungas etc.
Support Actors
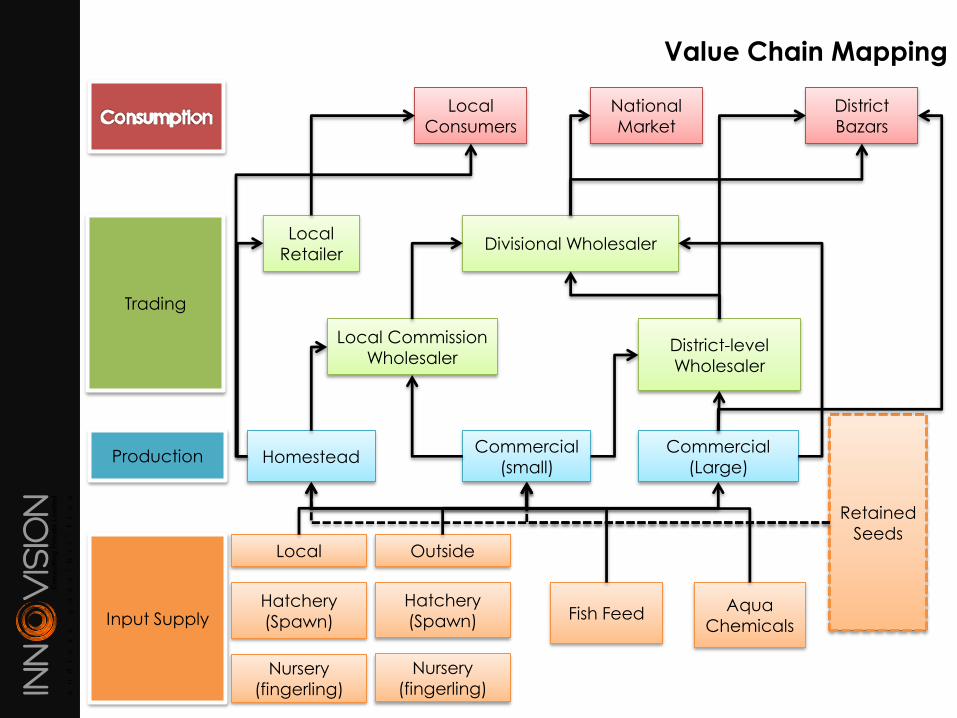
Input Supply
Production
Nursery
(fingerling)
Hatchery
(Spawn)
Retained
Seeds
Homestead
Local Commission
Wholesaler
Trading
Value Chain Mapping
Aqua
ChemicalsFish Feed
Commercial
(small)
Commercial
(Large)
Local Outside
Nursery
(fingerling)
Hatchery
(Spawn)
District-level
Wholesaler
Divisional WholesalerLocal
Retailer
Local
Consumers
National
Market
District
Bazars
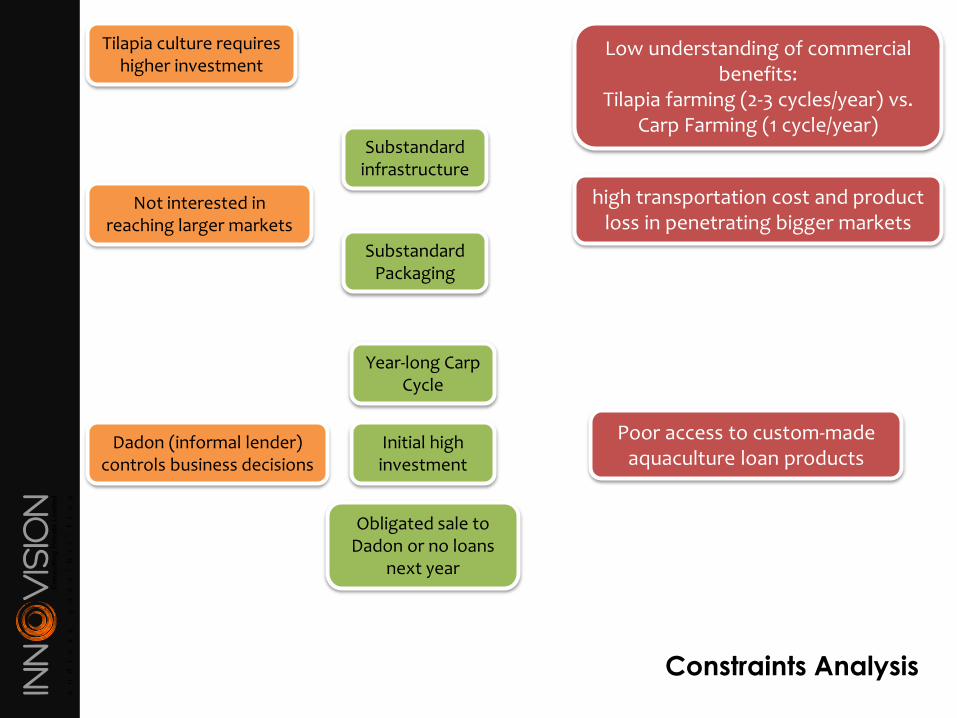
Constraints Analysis
Tilapia culture requires higher investment
Not interested in reaching larger markets
Dadon (informal lender) controls business decisions
Obligated sale to Dadon or no loans
next year
Low understanding of commercial benefits:
Tilapia farming (2-3 cycles/year) vs. Carp Farming (1 cycle/year)
high transportation cost and product loss in penetrating bigger markets
Substandard infrastructure
Substandard Packaging
Year-long Carp Cycle
Initial high investment
Poor access to custom-made aquaculture loan products
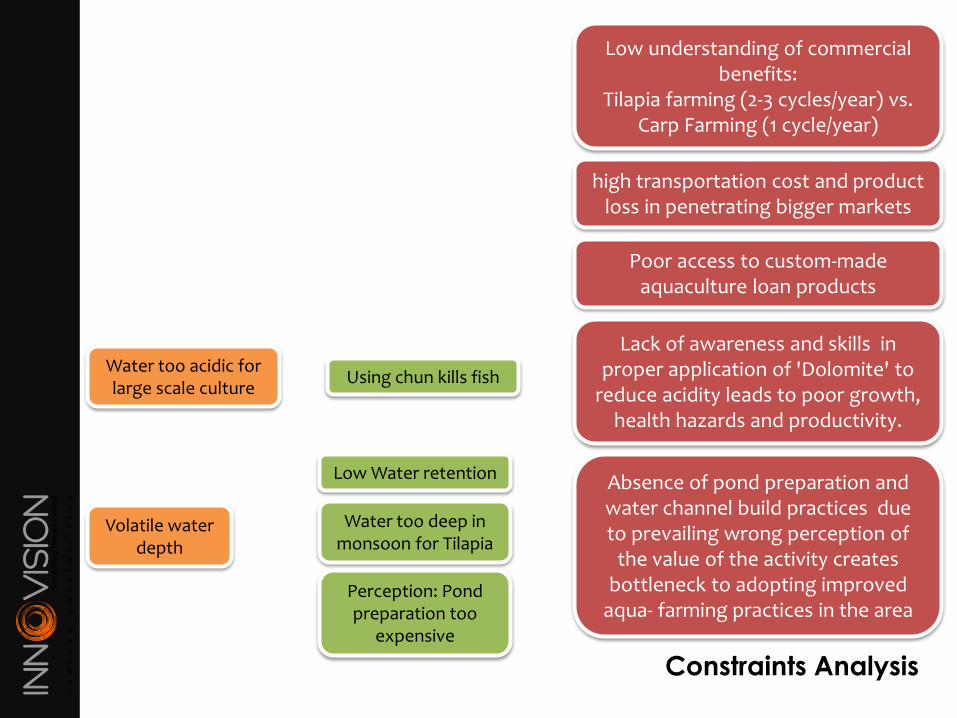
Constraints Analysis
Water too acidic for large scale culture
Using chun kills fish
Volatile water depth
Low understanding of commercial benefits:
Tilapia farming (2-3 cycles/year) vs. Carp Farming (1 cycle/year)
high transportation cost and product loss in penetrating bigger markets
Poor access to custom-made aquaculture loan products
Lack of awareness and skills in proper application of 'Dolomite' to
reduce acidity leads to poor growth, health hazards and productivity.
Low Water retention
Water too deep in monsoon for Tilapia
Perception: Pond preparation too
expensive
Absence of pond preparation and water channel build practices due to prevailing wrong perception of
the value of the activity creates bottleneck to adopting improved
aqua- farming practices in the area
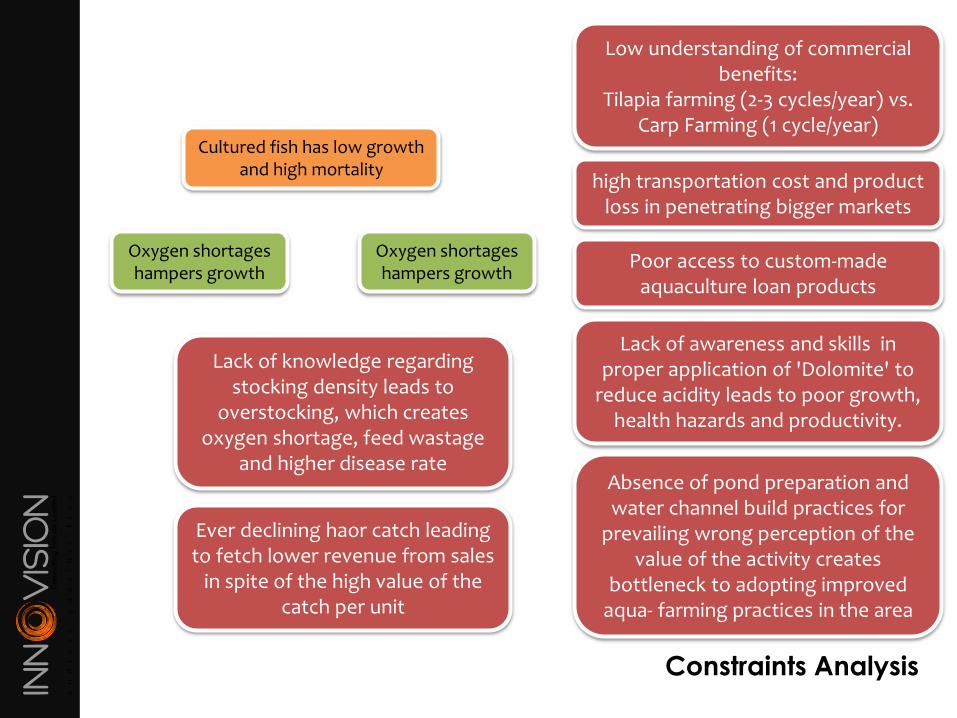
Cultured fish has low growth and high mortality
Low understanding of commercial benefits:
Tilapia farming (2-3 cycles/year) vs. Carp Farming (1 cycle/year)
high transportation cost and product loss in penetrating bigger markets
Poor access to custom-made aquaculture loan products
Lack of awareness and skills in proper application of 'Dolomite' to
reduce acidity leads to poor growth, health hazards and productivity.
Absence of pond preparation and water channel build practices for
prevailing wrong perception of the value of the activity creates
bottleneck to adopting improved aqua- farming practices in the area
Oxygen shortages hampers growth
Ever declining haor catch leading to fetch lower revenue from sales
in spite of the high value of the catch per unit
Oxygen shortages hampers growth
Lack of knowledge regarding stocking density leads to
overstocking, which creates oxygen shortage, feed wastage
and higher disease rate
Constraints Analysis
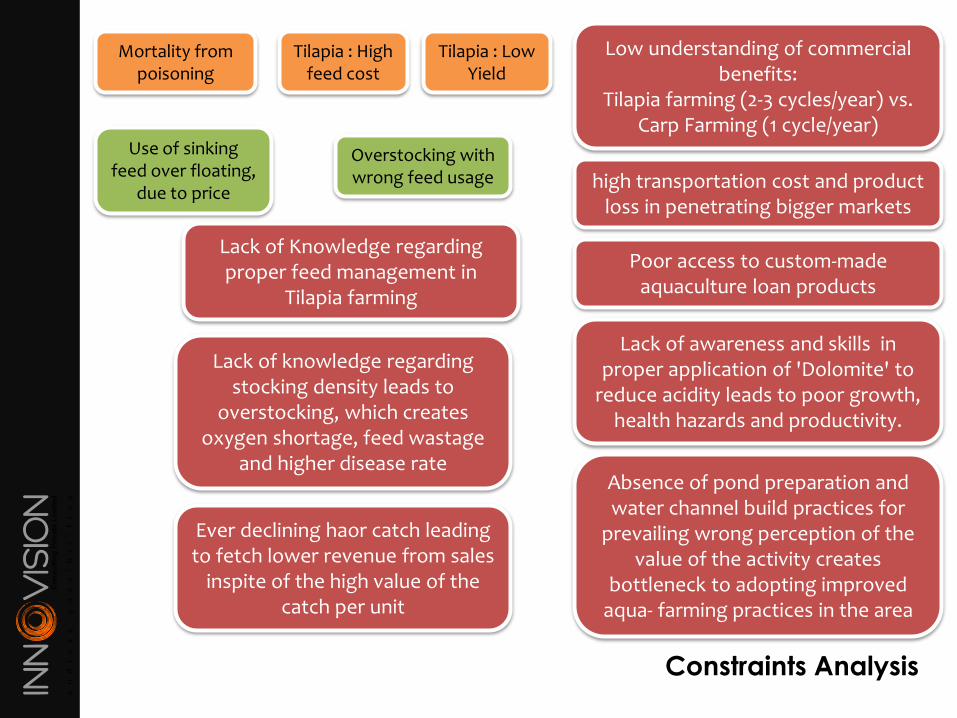
Low understanding of commercial benefits:
Tilapia farming (2-3 cycles/year) vs. Carp Farming (1 cycle/year)
high transportation cost and product loss in penetrating bigger markets
Poor access to custom-made aquaculture loan products
Lack of awareness and skills in proper application of 'Dolomite' to
reduce acidity leads to poor growth, health hazards and productivity.
Absence of pond preparation and water channel build practices for
prevailing wrong perception of the value of the activity creates
bottleneck to adopting improved aqua- farming practices in the area
Ever declining haor catch leading to fetch lower revenue from sales
inspite of the high value of the catch per unit
Lack of knowledge regarding stocking density leads to
overstocking, which creates oxygen shortage, feed wastage
and higher disease rate
Mortality from poisoning
Use of sinking feed over floating,
due to price
Tilapia : High feed cost
Tilapia : Low Yield
Overstocking with wrong feed usage
Lack of Knowledge regarding proper feed management in
Tilapia farming
Constraints Analysis
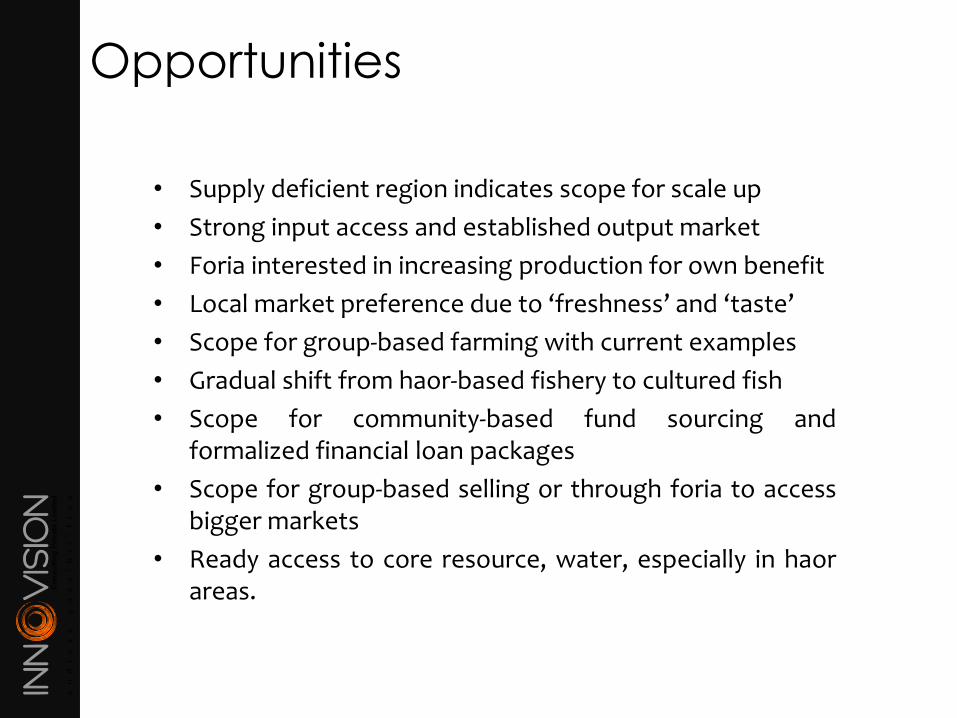
Opportunities
• Supply deficient region indicates scope for scale up
• Strong input access and established output market
• Foria interested in increasing production for own benefit
• Local market preference due to ‘freshness’ and ‘taste’
• Scope for group-based farming with current examples
• Gradual shift from haor-based fishery to cultured fish
• Scope for community-based fund sourcing andformalized financial loan packages
• Scope for group-based selling or through foria to accessbigger markets
• Ready access to core resource, water, especially in haorareas.

Discussion on Strategies & Interventions
Value Chain Analysis:
Duck (Layer)
End Market Analysis
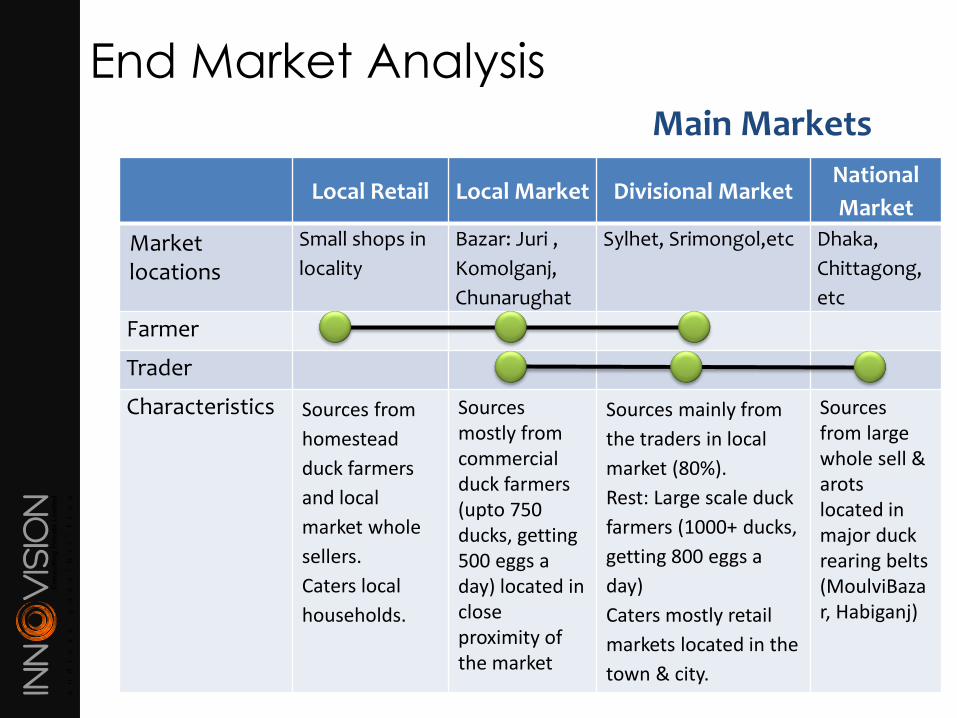
Main Markets
Local Retail Local Market Divisional MarketNational
Market
Market locations
Small shops in
locality
Bazar: Juri ,
Komolganj,
Chunarughat
Sylhet, Srimongol,etc Dhaka,
Chittagong,
etc
Farmer
Trader
Characteristics Sources from
homestead
duck farmers
and local
market whole
sellers.
Caters local
households.
Sources mostly from commercial duck farmers (upto 750 ducks, getting 500 eggs a day) located in close proximity of the market
Sources mainly from
the traders in local
market (80%).
Rest: Large scale duck
farmers (1000+ ducks,
getting 800 eggs a
day)
Caters mostly retail
markets located in the
town & city.
Sources from large whole sell & arotslocated in major duck rearing belts (MoulviBazar, Habiganj)
End Market AnalysisDemand/Supply
• Price is mostly determined by availability of egg. It varies slightly with the size.
• Consumption increases with increased supply. When supply is adequate, broiler egg is replaced by duck egg in meal more frequently.
• Maximum demand supply gap is noticed in rainy season. Throughout the region demand is higher than supply.
• In local bazaars 100% consumption is local in off season, while in peak season it’s around 60% – 65%. Rest of the egg goes to divisional large markets.
Value Chain Function
Types:
• Feed seller, Vaccine & Medicine Seller (Govt.& Private), DOC Seller
Functions:
• Selling packet feeds and open feeds (Khoil, Kura etc.)
• Selling medicines and vaccines
• Selling “Day Old Chicks” to duck farmers
• (Embedded) Providing information to the farmers on applying medicines and vaccines
Input Suppliers
Value Chain Function
Types:
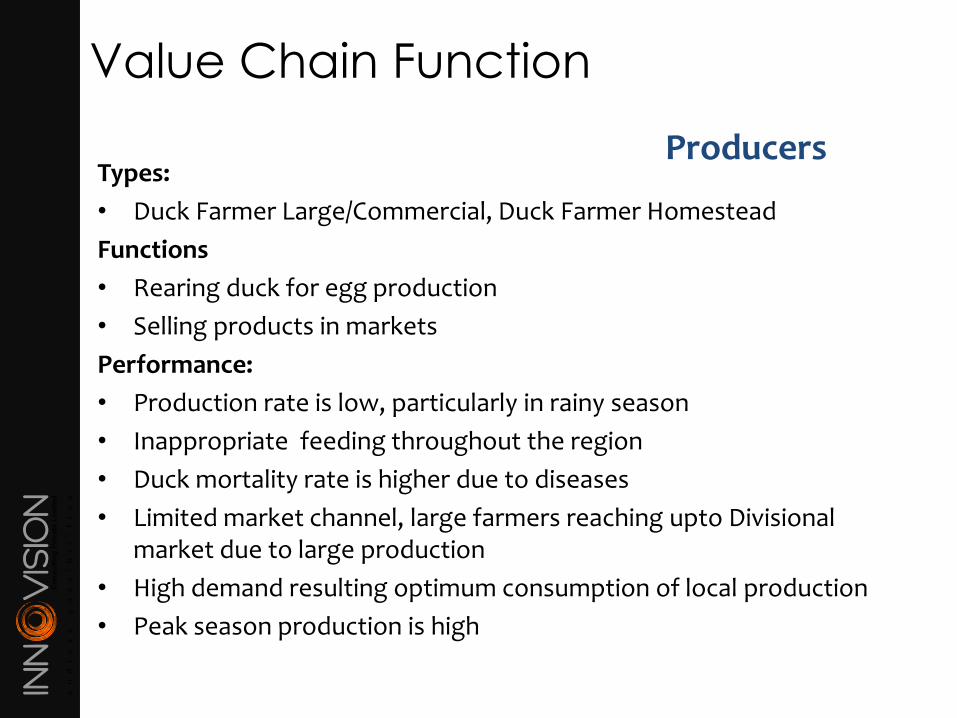
• Duck Farmer Large/Commercial, Duck Farmer Homestead
Functions
• Rearing duck for egg production
• Selling products in markets
Performance:
• Production rate is low, particularly in rainy season
• Inappropriate feeding throughout the region
• Duck mortality rate is higher due to diseases
• Limited market channel, large farmers reaching upto Divisional market due to large production
• High demand resulting optimum consumption of local production
• Peak season production is high
Producers
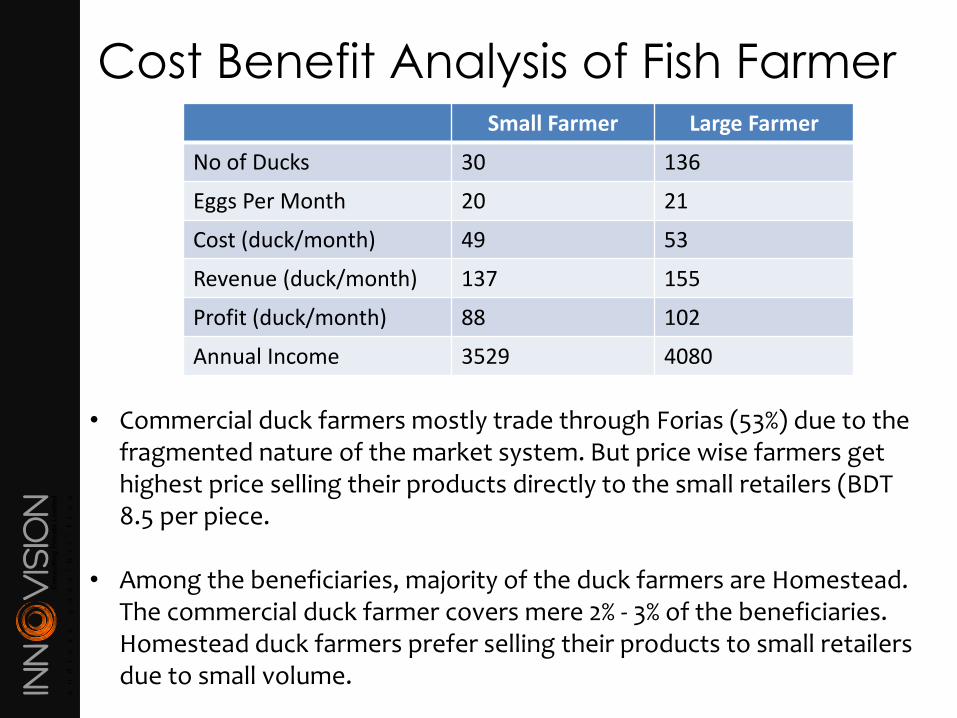
Small Farmer Large Farmer
No of Ducks 30 136
Eggs Per Month 20 21
Cost (duck/month) 49 53
Revenue (duck/month) 137 155
Profit (duck/month) 88 102
Annual Income 3529 4080
• Commercial duck farmers mostly trade through Forias (53%) due to the fragmented nature of the market system. But price wise farmers get highest price selling their products directly to the small retailers (BDT 8.5 per piece.
• Among the beneficiaries, majority of the duck farmers are Homestead. The commercial duck farmer covers mere 2% - 3% of the beneficiaries. Homestead duck farmers prefer selling their products to small retailers due to small volume.
Cost Benefit Analysis of Fish Farmer
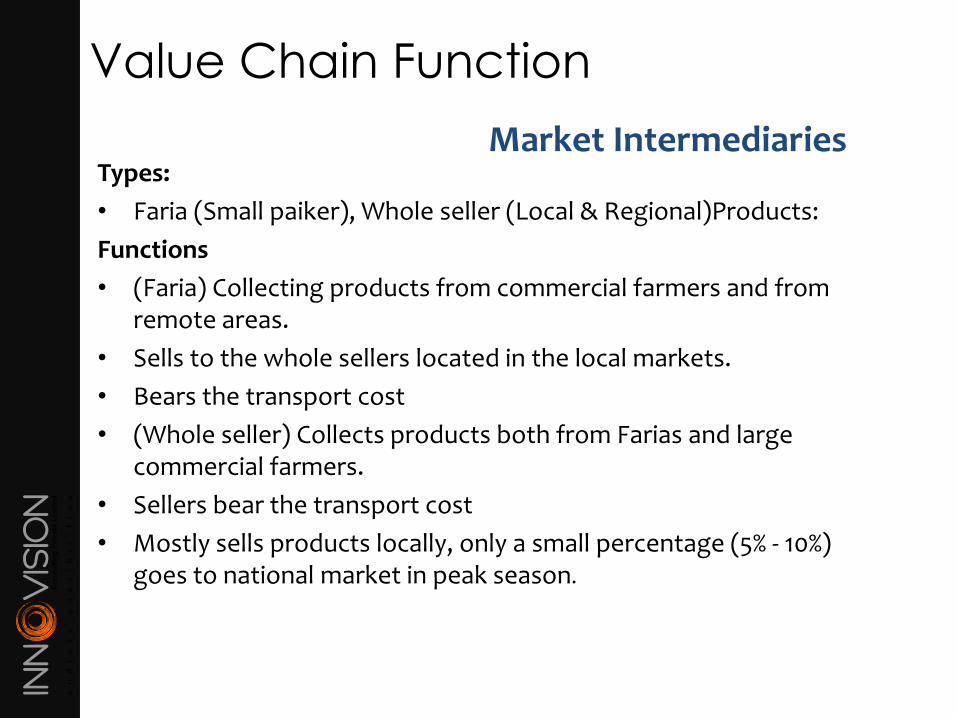
Value Chain Function
Types:
• Faria (Small paiker), Whole seller (Local & Regional)Products:
Functions
• (Faria) Collecting products from commercial farmers and from remote areas.
• Sells to the whole sellers located in the local markets.
• Bears the transport cost
• (Whole seller) Collects products both from Farias and large commercial farmers.
• Sellers bear the transport cost
• Mostly sells products locally, only a small percentage (5% - 10%) goes to national market in peak season.
Market Intermediaries
Value Chain Function
Transportation
• Transport service provider
• Providing carrying and transport facilities to the traders and farmers
Government Support
• Govt. services provide better quality inputs. Duck farmers get service from Livestock department when they visit there.
• Medicines / Vaccines from Govt. sources are sometimes low on supply
Support Actors
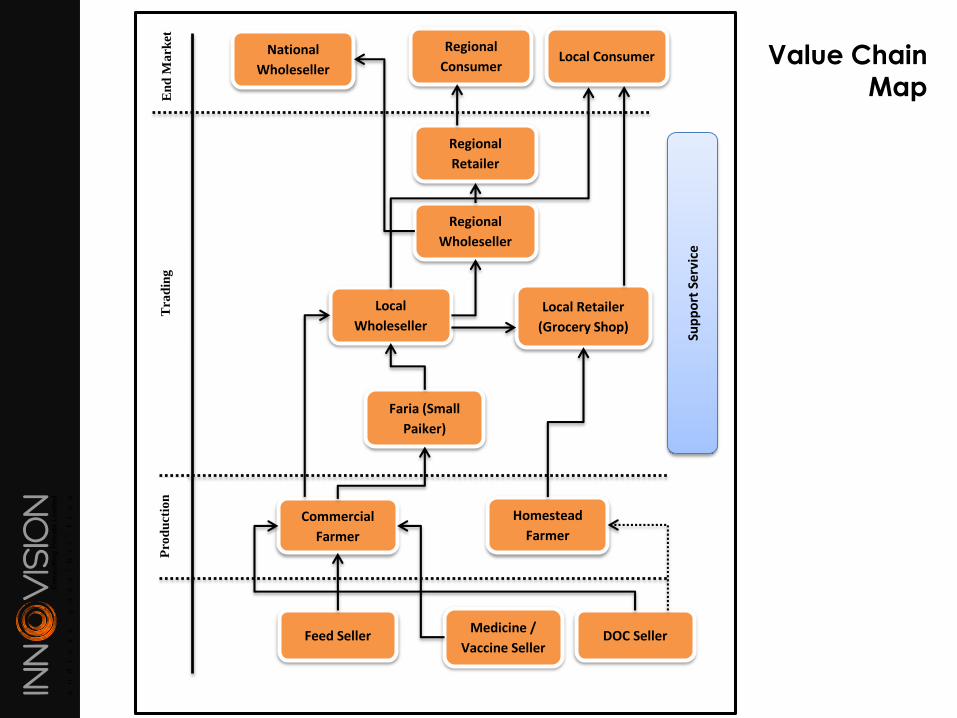
Value Chain
Map
Sup
po
rt S
erv
ice
Pro
du
ctio
nT
rad
ing
En
d M
ark
et
Local Retailer
(Grocery Shop)
Feed Seller
Faria (Small
Paiker)
Local
Wholeseller
Regional
Wholeseller
National
Wholeseller
Medicine /
Vaccine Seller
Commercial
Farmer
Homestead
Farmer
Local Consumer
DOC Seller
Regional
Retailer
Regional
Consumer
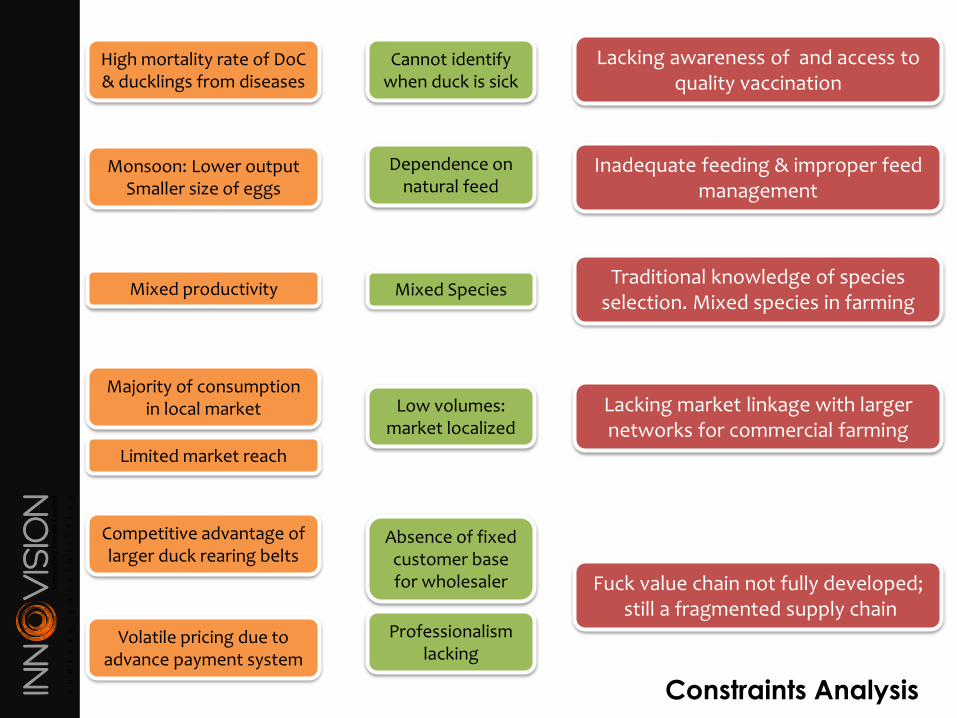
Constraints Analysis
High mortality rate of DoC& ducklings from diseases
Monsoon: Lower output Smaller size of eggs
Mixed productivity
Inadequate feeding & improper feed management
Lacking awareness of and access to quality vaccination
Cannot identify when duck is sick
Mixed Species
Dependence on natural feed
Traditional knowledge of species selection. Mixed species in farming
Majority of consumption in local market
Limited market reach
Competitive advantage of larger duck rearing belts
Volatile pricing due to advance payment system
Low volumes: market localized
Lacking market linkage with larger networks for commercial farming
Absence of fixed customer base for wholesaler
Professionalismlacking
Fuck value chain not fully developed;still a fragmented supply chain
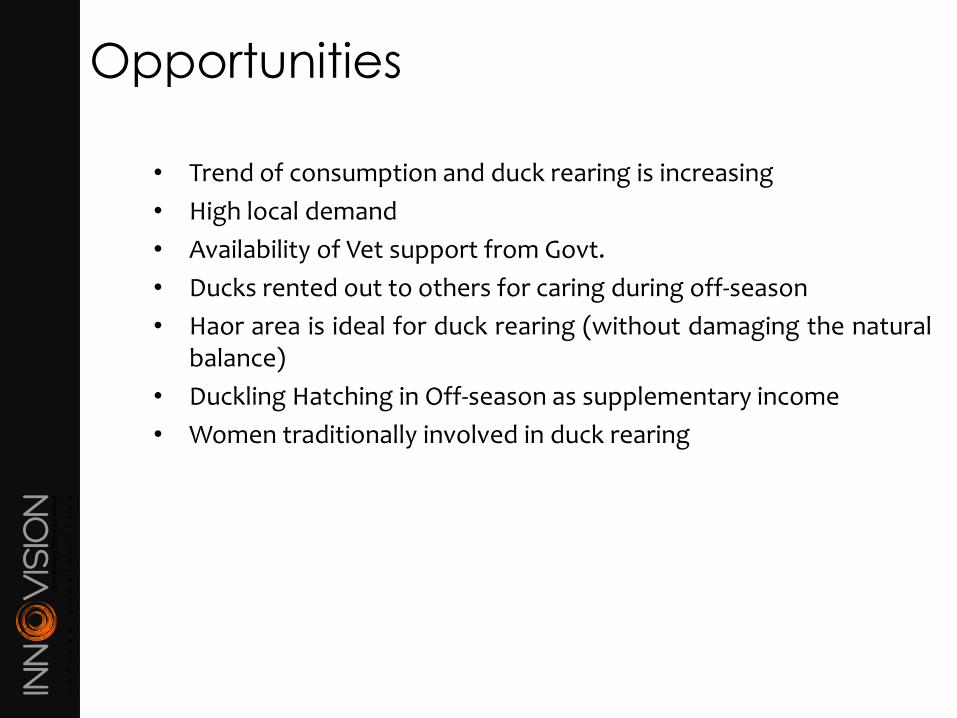
Opportunities
• Trend of consumption and duck rearing is increasing
• High local demand
• Availability of Vet support from Govt.
• Ducks rented out to others for caring during off-season
• Haor area is ideal for duck rearing (without damaging the naturalbalance)
• Duckling Hatching in Off-season as supplementary income
• Women traditionally involved in duck rearing

Discussion on Strategies & Interventions
Value Chain Analysis:
Eco-tourism
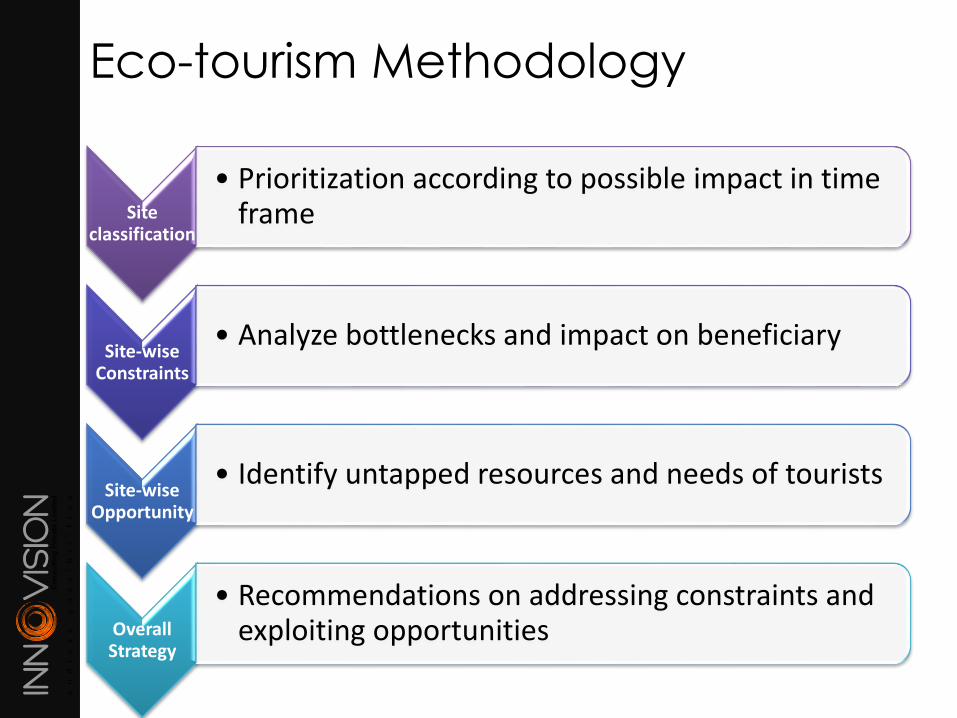
Eco-tourism Methodology
Site classification
• Prioritization according to possible impact in time frame
Site-wise Constraints
• Analyze bottlenecks and impact on beneficiary
Site-wise Opportunity
• Identify untapped resources and needs of tourists
Overall Strategy
• Recommendations on addressing constraints and exploiting opportunities
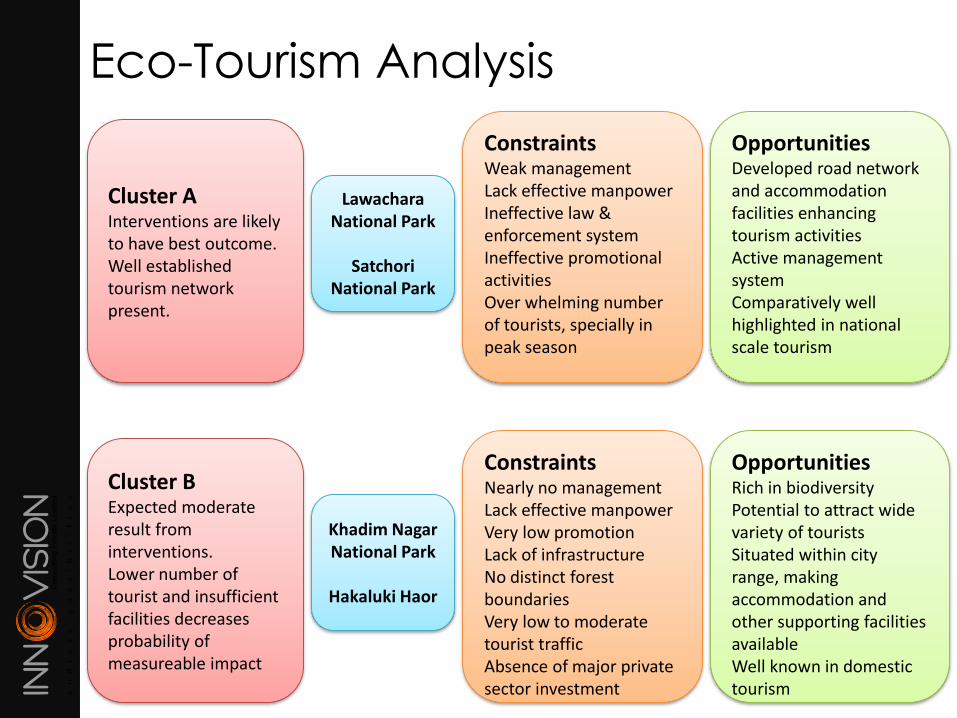
Cluster AInterventions are likely to have best outcome. Well established tourism network present.
ConstraintsWeak managementLack effective manpowerIneffective law & enforcement systemIneffective promotional activitiesOver whelming number of tourists, specially in peak season
Lawachara National Park
SatchoriNational Park
OpportunitiesDeveloped road network and accommodation facilities enhancing tourism activitiesActive management systemComparatively well highlighted in national scale tourism
Cluster BExpected moderate result from interventions. Lower number of tourist and insufficient facilities decreases probability of measureable impact
ConstraintsNearly no managementLack effective manpowerVery low promotionLack of infrastructure No distinct forest boundariesVery low to moderate tourist trafficAbsence of major private sector investment
Khadim Nagar National Park
Hakaluki Haor
OpportunitiesRich in biodiversity Potential to attract wide variety of touristsSituated within city range, making accommodation and other supporting facilities availableWell known in domestic tourism
Eco-Tourism Analysis
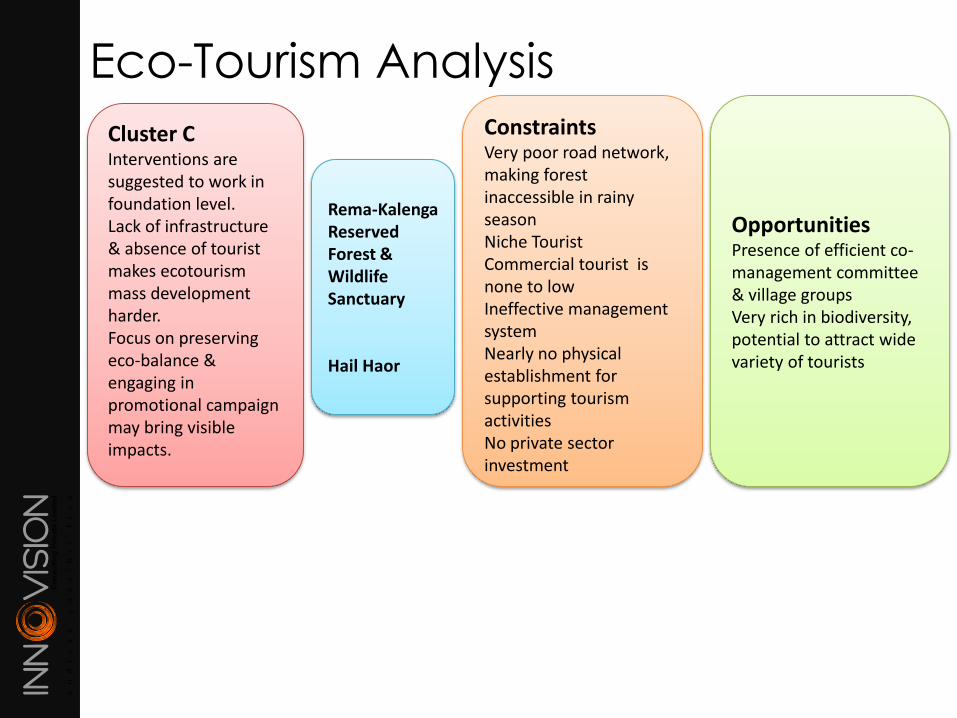
Eco-Tourism Analysis
Cluster CInterventions are suggested to work in foundation level. Lack of infrastructure & absence of tourist makes ecotourism mass development harder.Focus on preserving eco-balance & engaging in promotional campaign may bring visible impacts.
ConstraintsVery poor road network, making forest inaccessible in rainy seasonNiche TouristCommercial tourist is none to lowIneffective management systemNearly no physical establishment for supporting tourism activitiesNo private sector investment
Rema-KalengaReserved Forest & Wildlife Sanctuary
Hail Haor
OpportunitiesPresence of efficient co-management committee & village groupsVery rich in biodiversity, potential to attract wide variety of tourists
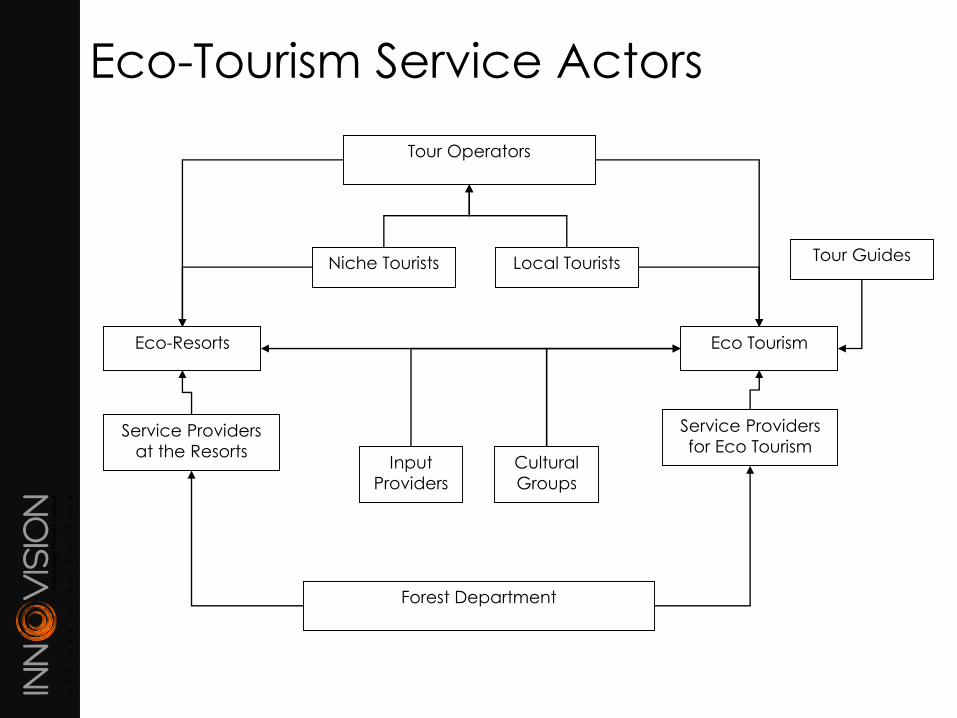
Eco-Tourism Service Actors
Eco-Resorts
Local Tourists
Tour Operators
Input
Providers
Service Providers
at the Resorts
Eco Tourism
Service Providers
for Eco Tourism
Tour Guides
Cultural
Groups
Forest Department
Niche Tourists
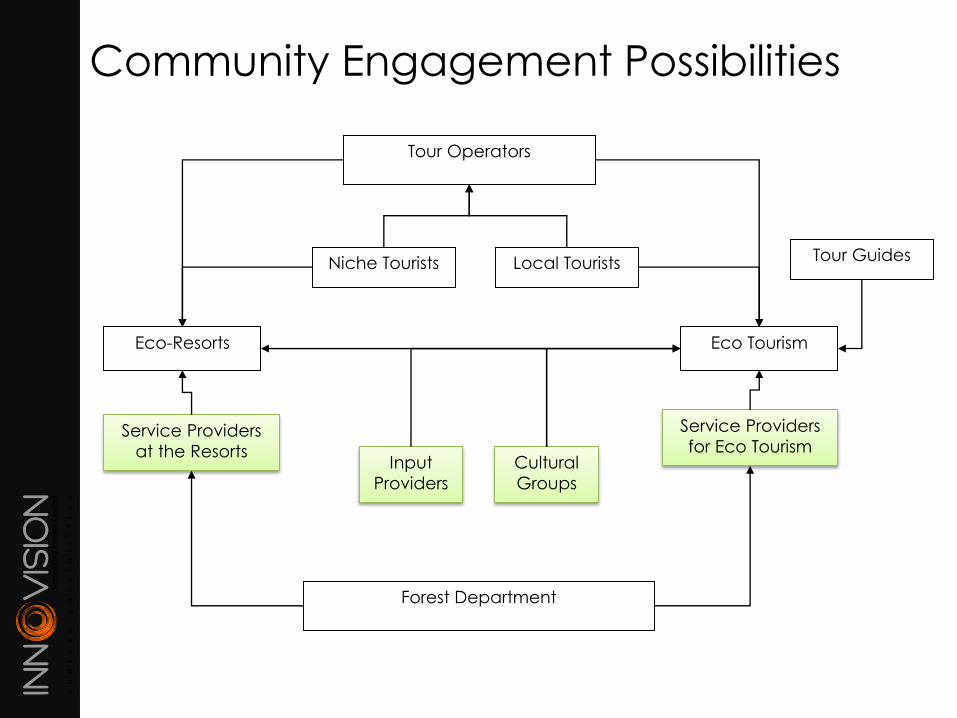
Community Engagement Possibilities
Eco-Resorts
Local Tourists
Tour Operators
Input
Providers
Service Providers
at the Resorts
Eco Tourism
Service Providers
for Eco Tourism
Tour Guides
Cultural
Groups
Forest Department
Niche Tourists

Market Opportunities
• Private sector engagement possibilities
• Facilities development
• Financing opportunities
• Promotional activities

Recommended Strategy
• Increasing Management Efficiency
• System upgrade
• Capacity development of Service Providers
Tentative Outreach Through The
Selected Value Chains
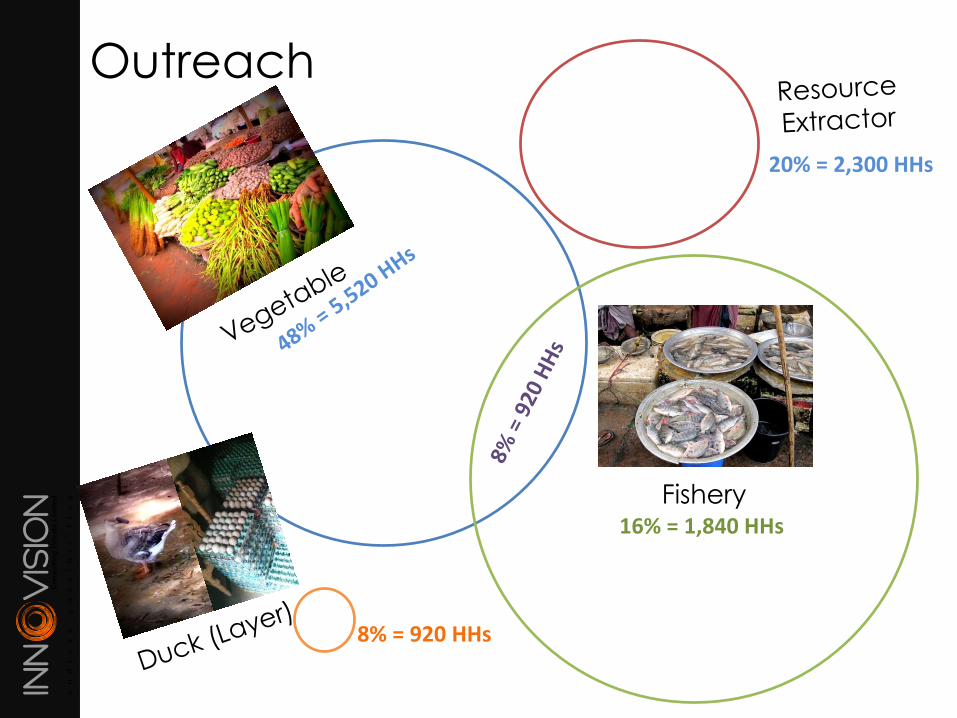
Outreach
8% = 920 HHs
16% = 1,840 HHs
Fishery
20% = 2,300 HHs

Potential Trades for the Resource
Extractors
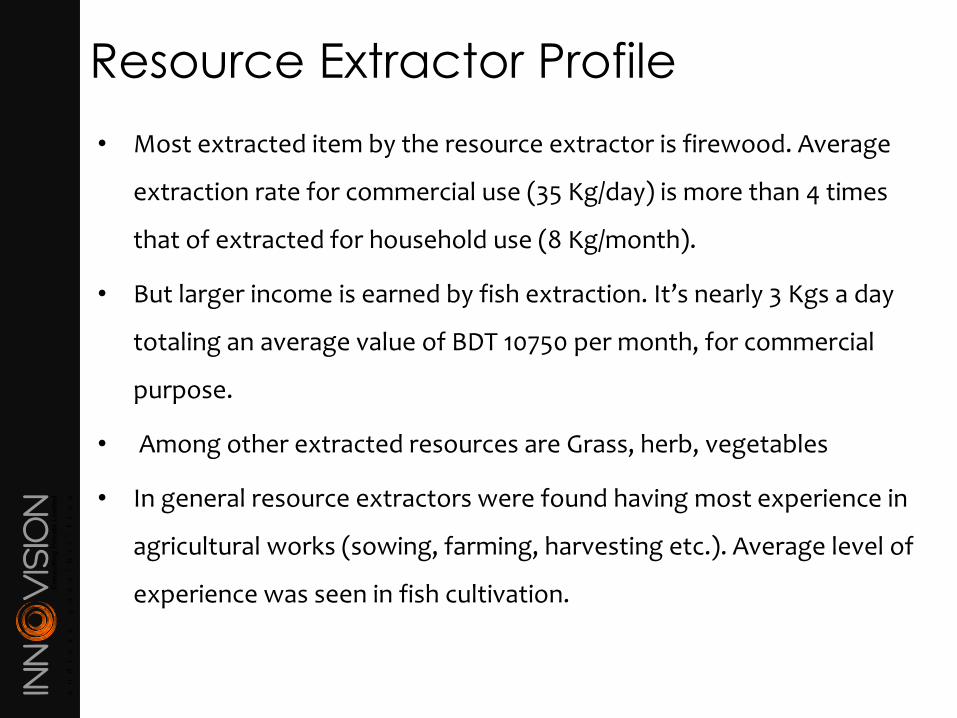
Resource Extractor Profile
• Most extracted item by the resource extractor is firewood. Average
extraction rate for commercial use (35 Kg/day) is more than 4 times
that of extracted for household use (8 Kg/month).
• But larger income is earned by fish extraction. It’s nearly 3 Kgs a day
totaling an average value of BDT 10750 per month, for commercial
purpose.
• Among other extracted resources are Grass, herb, vegetables
• In general resource extractors were found having most experience in
agricultural works (sowing, farming, harvesting etc.). Average level of
experience was seen in fish cultivation.
Potential Trades
Potential Trades
• Put labor in agriculture, fish farming
• Taking care of Cow / Duck in rainy season when there’s scarcity of food
• Involving in handicraft / souvenir making
• Boat or net making (repairing)
• Rickshaw / van pulling
Rationale for trade selection
• Resource extractors have experience in working as labor in agriculture /
fish farming
• Cow / Duck renting is an existing IGA in the region
• Indigenous community have skill in handicraft
• Extractors in Haor areas have skills in making / repairing of boats & net
• Developing Access to Finance situation can help extractors acquiring
rickshaw / van by loan
Potential Trades (cont..)
Selected Beneficiaries
• Extractors aging from 18 – 40
• Women family members
Project intervention opportunity
• Provide training on cow/duck rearing, improved harvesting techniques etc.
• Linkage development for handicraft/souvenir marketing with CMC/private sectors
working in Tourist areas
• Develop financing facilities to provide easy load
Prediction of potential outreach through selected trades
• Large number of engagement in fish farming related trade in Haor areas
• Agriculture / Handicraft trade can reach large number in Forest areas
• Training programs will cover both beneficiaries and extractors specially
who are landless

Thank You!