Differential Case: Service and Repair 9.75 Inch Ring Gear ...

VALUATION: SIX LESSONS TO TAKE AWAY! July 2015 Aswath Damodaran
Aswath Damodaran 1

2
I. Don’t mistake accounting for finance
Assets Liabilities
Fixed Assets
Debt
Equity
Short-term liabilities of the firm
Intangible Assets
Long Lived Real Assets
Assets which are not physical,like patents & trademarks
Current Assets
Financial InvestmentsInvestments in securities &assets of other firms
Short-lived Assets
Equity investment in firm
Debt obligations of firm
Current Liabilties
Other Liabilities Other long-term obligations
The Balance Sheet
Assets are recorded at original cost, adjusted for depreciation.
True intangible assets like brand name, patents and customer did not show up. The only intangible asset of any magnitude (goodwill) is a plug variable that is of consequence only if you do an acquisition.
Valued based upon motive for investment – some marked to market, some recorded at cost and some at quasi-cost
Equity reflects original capital invested and historical retained earnings.
3
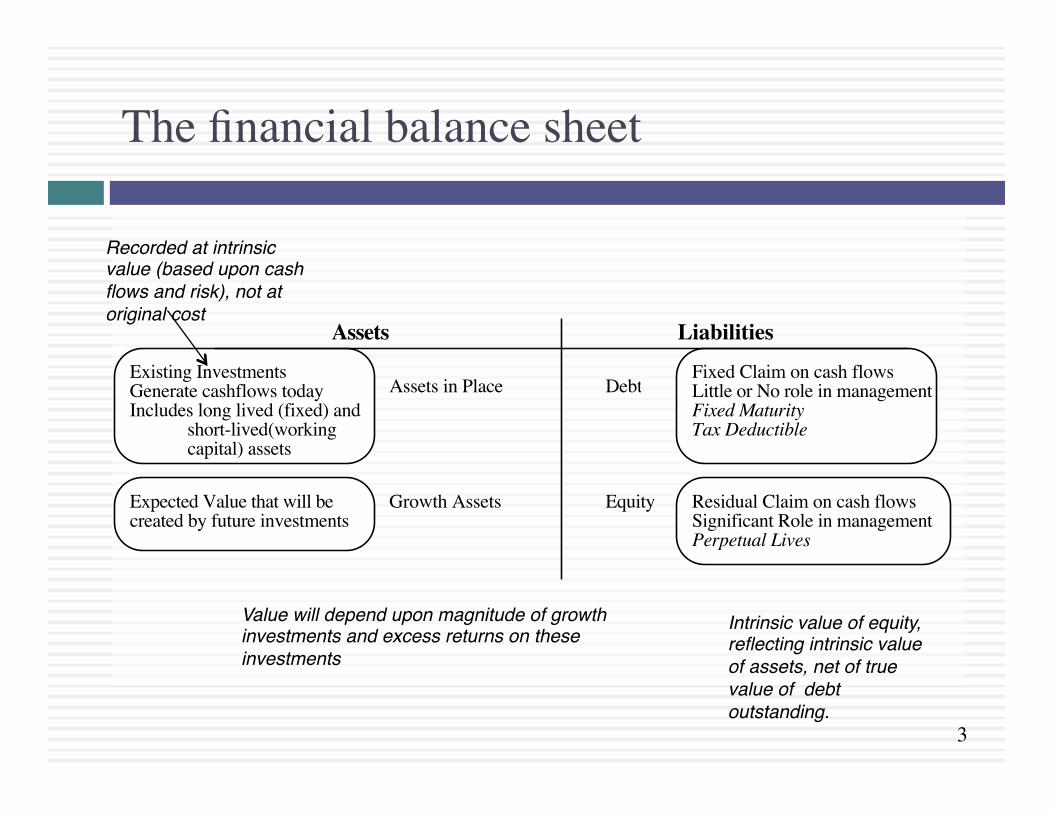
The financial balance sheet
Assets Liabilities
Assets in Place Debt
Equity
Fixed Claim on cash flowsLittle or No role in managementFixed MaturityTax Deductible
Residual Claim on cash flowsSignificant Role in managementPerpetual Lives
Growth Assets
Existing InvestmentsGenerate cashflows todayIncludes long lived (fixed) and
short-lived(working capital) assets
Expected Value that will be created by future investments
Recorded at intrinsic value (based upon cash flows and risk), not at original cost
Value will depend upon magnitude of growth investments and excess returns on these investments
Intrinsic value of equity, reflecting intrinsic value of assets, net of true value of debt outstanding.

4
II. Don’t assume that D+CF = DCF
¨ The value of a risky asset can be esRmated by discounRng the expected cash flows on the asset over its life at a risk-‐adjusted discount rate:
1. The IT Proposi.on: If “it” does not affect the cash flows or alter risk (thus changing discount rates), “it” cannot affect value.
2. The DUH Proposi.on: For an asset to have value, the expected cash flows have to be posiRve some Rme over the life of the asset.
3. The DON’T FREAK OUT Proposi.on: Assets that generate cash flows early in their life will be worth more than assets that generate cash flows later; the la`er may however have greater growth and higher cash flows to compensate.
Aswath Damodaran
4

5
The drivers of value..
Aswath Damodaran
5
What are the cashflows from existing assets?- Equity: Cashflows after debt payments- Firm: Cashflows before debt payments
What is the value added by growth assets?Equity: Growth in equity earnings/ cashflowsFirm: Growth in operating earnings/ cashflows
How risky are the cash flows from both existing assets and growth assets?Equity: Risk in equity in the companyFirm: Risk in the firm’s operations
When will the firm become a mature firm, and what are the potential roadblocks?

6
DCF as a tool for intrinsic valuaRon
Aswath Damodaran
6
Cash flows from existing assetsThe base earnings will reflect the
earnings power of the existing assets of the firm, net of taxes and
any reinvestment needed to sustain the base earnings.
Value of growthThe future cash flows will reflect expectations of how quickly earnings will grow in the future (as a positive) and how much the company will have to reinvest to generate that growth (as a negative). The net effect will determine the value of growth.
Expected Cash Flow in year t = E(CF) = Expected Earnings in year t - Reinvestment needed for growth
Risk in the Cash flowsThe risk in the investment is captured in the discount rate as a beta in the cost of equity and the default spread in the cost
of debt.
Steady stateThe value of growth comes from the capacity to generate excess
returns. The length of your growth period comes from the strength & sustainability of your competitive
advantages.

7
1. Match your cash flows to your discount rates..
Aswath Damodaran
7
-‐2.00%
0.00%
2.00%
4.00%
6.00%
8.00%
10.00%
12.00%
14.00%
Japane
se Yen
Czech Ko
runa
Swiss Franc
Euro
Danish Krone
Sw
edish
Krona
Taiwanese $
Hungarian Forin
t Bu
lgarian Lev
Kuna
Thai Baht
BriRsh Pou
nd
Romanian Leu
Norwegian Kron
e HK
$
Israeli She
kel
Polish Zloty
Canadian $
Korean W
on
US $
Singapore $
Phillipine Pe
so
Pakistani Rup
ee
Vene
zuelan Bolivar
Vietnamese Do
ng
Australian $
Malyasia
n Ringgit
Chinese Yuan
NZ $
Chilean Peso
Iceland Kron
a Pe
ruvian Sol
Mexican Peso
Colombian Peso
Indo
nesia
n Ru
piah
Indian Rup
ee
Turkish
Lira
South African Rand
Kenyan Shilling
Reai
Naira
Russian Ru
ble
Riskfree Rates: January 2015
Risk free Rate

8
2. Don’t let your inputs be at war with each other..
Aswath Damodaran
8
Growth
Risk Reinvestment
Are you reinvesting enough, given
your growth rate?
Is yo
ur ris
k refl
ectiv
e of h
ow m
uch,
how
& wh
ere y
ou ar
e gro
wing
?
Is your risk consistent with your reinvestment strategy?
Value

9
And consider the trade offs..
Aswath Damodaran
9
0.00%
5.00%
10.00%
15.00%
20.00%
25.00%
30.00%
35.00%
40.00%
45.00%
Australia, NZ and Canada
Developed Europe Emerging Markets Japan United States Global
Excess Return (ROC minus Cost of Capital) for firms with market capitaliza.on> $50 million: Global in 2014
<-‐5%
-‐5% -‐ 0%
0 -‐5%
5 -‐10%
>10%

10
3. GlobalizaRon is not a buzz word
¨ As companies get globalized, the valuaRons that we do have to reflect that globalizaRon. In parRcular, we need to be wary of ¤ Currency mismatches: MulRnaRonals derive their revenues in many currencies but you have to be currency-‐consistent.
¤ Beta gaming: When a company is listed in many markets, you can get very different betas, depending on how you set up and run a beta regression
¤ Equity Risk Premiums: The standard pracRce of esRmaRng equity risk premiums based on your country of incorporaRon will lead to skewed valuaRons.
Aswath Damodaran
10
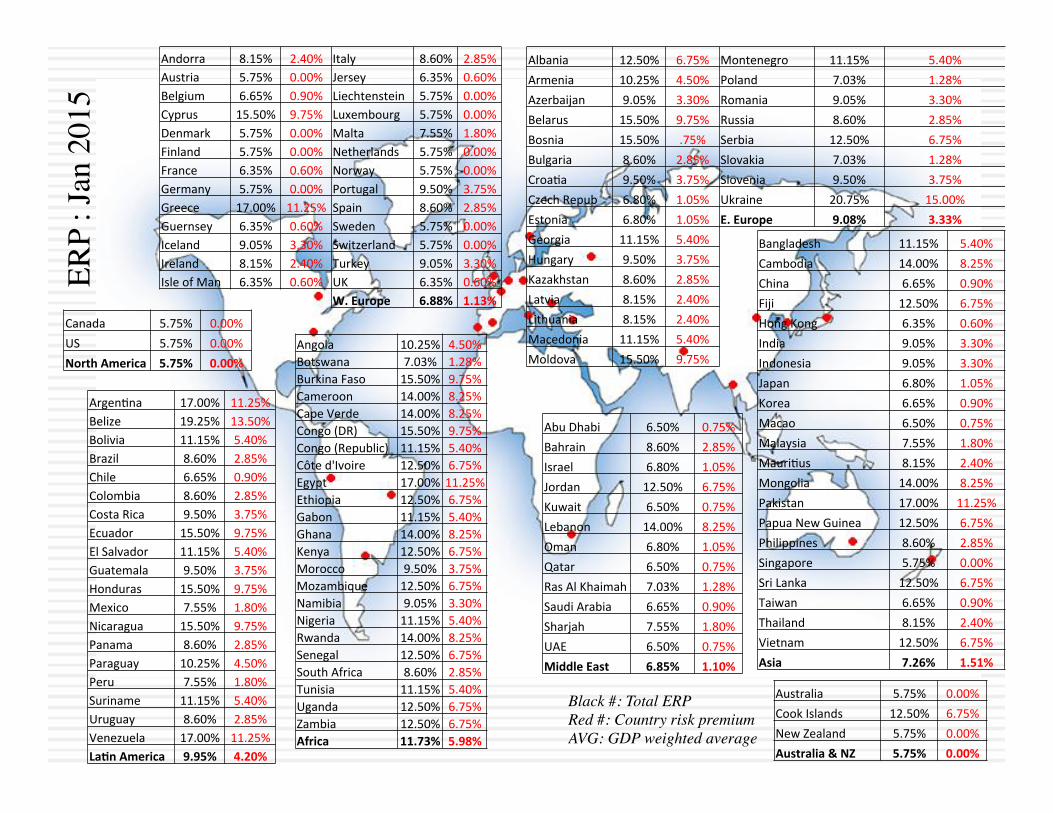
Black #: Total ERPRed #: Country risk premiumAVG: GDP weighted average
ERP
: Jan
201
5
Angola 10.25% 4.50% Botswana 7.03% 1.28% Burkina Faso 15.50% 9.75% Cameroon 14.00% 8.25% Cape Verde 14.00% 8.25% Congo (DR) 15.50% 9.75% Congo (Republic) 11.15% 5.40% Côte d'Ivoire 12.50% 6.75% Egypt 17.00% 11.25% Ethiopia 12.50% 6.75% Gabon 11.15% 5.40% Ghana 14.00% 8.25% Kenya 12.50% 6.75% Morocco 9.50% 3.75% Mozambique 12.50% 6.75% Namibia 9.05% 3.30% Nigeria 11.15% 5.40% Rwanda 14.00% 8.25% Senegal 12.50% 6.75% South Africa 8.60% 2.85% Tunisia 11.15% 5.40% Uganda 12.50% 6.75% Zambia 12.50% 6.75% Africa 11.73% 5.98%
Bangladesh 11.15% 5.40% Cambodia 14.00% 8.25% China 6.65% 0.90% Fiji 12.50% 6.75% Hong Kong 6.35% 0.60% India 9.05% 3.30% Indonesia 9.05% 3.30% Japan 6.80% 1.05% Korea 6.65% 0.90% Macao 6.50% 0.75% Malaysia 7.55% 1.80% MauriRus 8.15% 2.40% Mongolia 14.00% 8.25% Pakistan 17.00% 11.25% Papua New Guinea 12.50% 6.75% Philippines 8.60% 2.85% Singapore 5.75% 0.00% Sri Lanka 12.50% 6.75% Taiwan 6.65% 0.90% Thailand 8.15% 2.40% Vietnam 12.50% 6.75% Asia 7.26% 1.51%
Australia 5.75% 0.00% Cook Islands 12.50% 6.75% New Zealand 5.75% 0.00% Australia & NZ 5.75% 0.00%
Abu Dhabi 6.50% 0.75% Bahrain 8.60% 2.85% Israel 6.80% 1.05% Jordan 12.50% 6.75% Kuwait 6.50% 0.75% Lebanon 14.00% 8.25% Oman 6.80% 1.05% Qatar 6.50% 0.75% Ras Al Khaimah 7.03% 1.28% Saudi Arabia 6.65% 0.90% Sharjah 7.55% 1.80% UAE 6.50% 0.75% Middle East 6.85% 1.10%
Albania 12.50% 6.75% Montenegro 11.15% 5.40% Armenia 10.25% 4.50% Poland 7.03% 1.28% Azerbaijan 9.05% 3.30% Romania 9.05% 3.30% Belarus 15.50% 9.75% Russia 8.60% 2.85% Bosnia 15.50% .75% Serbia 12.50% 6.75% Bulgaria 8.60% 2.85% Slovakia 7.03% 1.28% CroaRa 9.50% 3.75% Slovenia 9.50% 3.75% Czech Repub 6.80% 1.05% Ukraine 20.75% 15.00% Estonia 6.80% 1.05% E. Europe 9.08% 3.33% Georgia 11.15% 5.40% Hungary 9.50% 3.75% Kazakhstan 8.60% 2.85% Latvia 8.15% 2.40% Lithuania 8.15% 2.40% Macedonia 11.15% 5.40% Moldova 15.50% 9.75%
Andorra 8.15% 2.40% Italy 8.60% 2.85% Austria 5.75% 0.00% Jersey 6.35% 0.60% Belgium 6.65% 0.90% Liechtenstein 5.75% 0.00% Cyprus 15.50% 9.75% Luxembourg 5.75% 0.00% Denmark 5.75% 0.00% Malta 7.55% 1.80% Finland 5.75% 0.00% Netherlands 5.75% 0.00% France 6.35% 0.60% Norway 5.75% 0.00% Germany 5.75% 0.00% Portugal 9.50% 3.75% Greece 17.00% 11.25% Spain 8.60% 2.85% Guernsey 6.35% 0.60% Sweden 5.75% 0.00% Iceland 9.05% 3.30% Switzerland 5.75% 0.00% Ireland 8.15% 2.40% Turkey 9.05% 3.30% Isle of Man 6.35% 0.60% UK 6.35% 0.60%
W. Europe 6.88% 1.13%
ArgenRna 17.00% 11.25% Belize 19.25% 13.50% Bolivia 11.15% 5.40% Brazil 8.60% 2.85% Chile 6.65% 0.90% Colombia 8.60% 2.85% Costa Rica 9.50% 3.75% Ecuador 15.50% 9.75% El Salvador 11.15% 5.40% Guatemala 9.50% 3.75% Honduras 15.50% 9.75% Mexico 7.55% 1.80% Nicaragua 15.50% 9.75% Panama 8.60% 2.85% Paraguay 10.25% 4.50% Peru 7.55% 1.80% Suriname 11.15% 5.40% Uruguay 8.60% 2.85% Venezuela 17.00% 11.25% LaHn America 9.95% 4.20%
Canada 5.75% 0.00% US 5.75% 0.00% North America 5.75% 0.00%

12
4. Everyone may do it, but that does not make it right.. The small cap premium
Aswath Damodaran
12

13
5. Value is about the future, not the past..
Aswath Damodaran
Arithmetic Average Geometric Average Stocks - T. Bills Stocks - T. Bonds Stocks - T. Bills Stocks - T. Bonds1928-2014 8.00% 6.25% 6.11% 4.60% 2.17% 2.32% 1965-2014 6.19% 4.12% 4.84% 3.14% 2.42% 2.74% 2005-2014 7.94% 4.06% 6.18% 2.73% 6.05% 8.65%
Base year cash flow (last 12 mths)Dividends (TTM): 38.57+ Buybacks (TTM): 61.92
= Cash to investors (TTM): 100.50Earnings in TTM: 114.74
Expected growth in next 5 yearsTop down analyst estimate of earnings
growth for S&P 500 with stable payout: 5.58%
106.10 112.01 118.26 124.85 131.81 Beyond year 5Expected growth rate = Riskfree rate = 2.17%
Expected CF in year 6 = 131.81(1.0217)
Risk free rate = T.Bond rate on 1/1/15= 2.17%
r = Implied Expected Return on Stocks = 7.95%
S&P 500 on 1/1/15= 2058.90
E(Cash to investors)
Minus
Implied Equity Risk Premium (1/1/15) = 7.95% - 2.17% = 5.78%
Equals
100.5 growing @ 5.58% a year
2058.90 = 106.10(1+ r)
+112.91(1+ r)2
+118.26(1+ r)3
+124.85(1+ r)4
+131.81(1+ r)5
+131.81(1.0217)(r −.0217)(1+ r)5

14
6. Don’t sweat the small stuff
Aswath Damodaran
14
0.
200.
400.
600.
800.
1,000.
1,200.
1,400.
1,600.
1,800.
2,000.
<4% 4-‐5% 5-‐6% 6-‐7% 7-‐8% 8-‐9% 9-‐10% 10-‐11% 11-‐12% 12-‐13% 13-‐14% 14-‐15% >15%
250. 213.
628.
852.
1,463.
1,865.
926.
474.
225. 141.
90. 70.
681.
Cost of equity for Publicly traded US firms -‐ January 2015

Aswath Damodaran15
Term Yr12,1143,0299,086
Terminal Value10= 9,086/(.0729-.025) = 189,738
Cost of Capital (WACC) = 8.52% (0.885) + 2.40% (0.115) = 7.81%
Return on Capital12.61%
Reinvestment Rate 53.93%
Unlevered Beta for Sectors: 0.9239
ERP for operations5.76%Beta
1.0013Riskfree Rate:Riskfree rate = 2.75%
Op. Assets 125,484+ Cash: 3,931+ Non op inv 2,849- Debt 15,961- Minority Int 2,721=Equity 113,582-Options 869Value/Share $ 62.26
WeightsE = 88.5% D = 11.5%
Cost of Debt(2.75%+1.00%)(1-.361)
= 2.40%Based on actual A rating
Cost of Equity8.52%
Stable Growthg = 2.5%; Beta = 1.00;
Debt %= 20%; k(debt)=3.75Cost of capital =7.29%
Tax rate=36.1%; ROC= 10%; Reinvestment Rate=2.5/10=25%
Expected Growth .5393*.1261=.068 or 6.8%
Current Cashflow to FirmEBIT(1-t)= 10,032(1-.31)= 6,920- (Cap Ex - Deprecn) 3,629 - Chg Working capital 103= FCFF 3,188Reinvestment Rate = 3,732/6920
=53.93%Return on capital = 12.61%
+ X
Disney - November 2013
In November 2013, Disney was trading at $67.71/share
First 5 years
D/E=13.10%
1 2 3 4 5 6 7 8 9 10EBIT/*/(1/2/tax/rate) $7,391 $7,893 $8,430 $9,003 $9,615 $10,187 $10,704 $11,156 $11,531 $11,819/2/Reinvestment $3,985 $4,256 $4,546 $4,855 $5,185 $4,904 $4,534 $4,080 $3,550 $2,955FCFF $3,405 $3,637 $3,884 $4,148 $4,430 $5,283 $6,170 $7,076 $7,981 $8,864
Growth declines gradually to 2.75%
Cost of capital declines gradually to 7.29%

‹#›Aswath Damodaran16
D+CF ≠ DCF
The$Chimera(DCF(mixes$dollar$cash$flows$with$peso$discount$rates,$nominal$cash$flows$with$real$costs$of$capital$and$cash$flows$before$debt$payments$with$costs$of$equity,$viola;ng$basic$consistency$rules
In$a$Dreamstate(DCF,$you$build$amazing$companies$on$spreadsheets,$making$outlandish$assump;ons$about$growth$and$opera;ng$margins$over$;me.
In$a$Dissonant(DCF,$assump;ons$about$growth,$risk$and$cash$flows$are$not$consistent$with$each$other,$with$liAle$or$no$explana;on$given$for$the$mismatch.
In$a$Trojan(Horse(DCF,$Just$as$the$Greeks$used$a$wooden$horse$to$smuggle$soldiers$into$Troy,$analysts$use$the$Trojan$Horse$of$cash$flows$to$smuggle$in$a$pricing$(in$the$form$of$a$terminal$value,$es;mated$by$using$a$mul;ple).
A$Kabuki(DCF$is$a$work$of$art,$where$analyst$and$rule$maker$(or$court)$go$through$the$mo;ons$of$valua;on,$with$the$intent$of$developing$models$that$are$legally$or$accoun;ngIrule$defensible$rather$than$yielding$reasonable$values.
In$a$Robo(DCF,$the$analyst$builds$a$valua;on$almost$en;rely$from$the$most$recent$financial$statements$and$automated$forecasts.$
A$Mutant(DCF$is$a$collec;on$of$numbers$where$items$have$familiar$names$(free$cash$flow,$cost$of$capital)$but$the$analyst$puKng$it$together$has$neither$a$narra;ve$nor$a$sense$of$the$basic$principles$of$
17
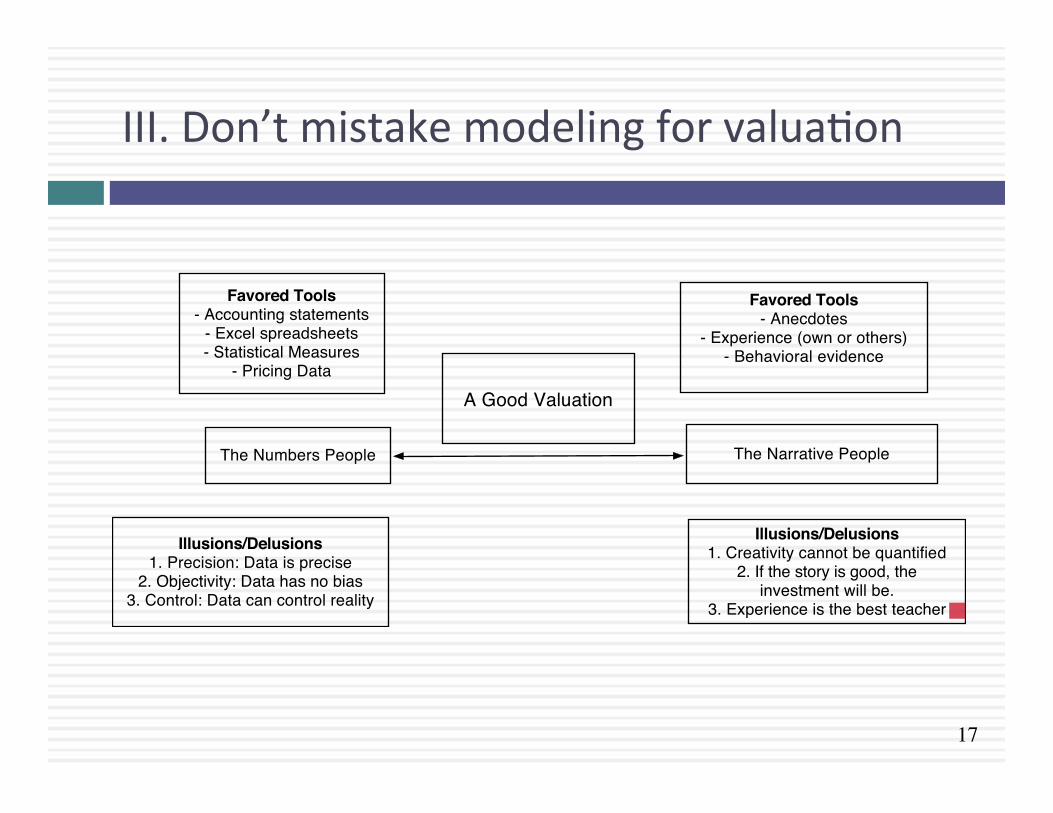
III. Don’t mistake modeling for valuaRon
The Numbers People
Favored Tools- Accounting statements
- Excel spreadsheets- Statistical Measures
- Pricing Data
Illusions/Delusions1. Precision: Data is precise
2. Objectivity: Data has no bias3. Control: Data can control reality
The Narrative People
Favored Tools- Anecdotes
- Experience (own or others)- Behavioral evidence
Illusions/Delusions1. Creativity cannot be quantified
2. If the story is good, the investment will be.
3. Experience is the best teacher
A Good Valuation
18
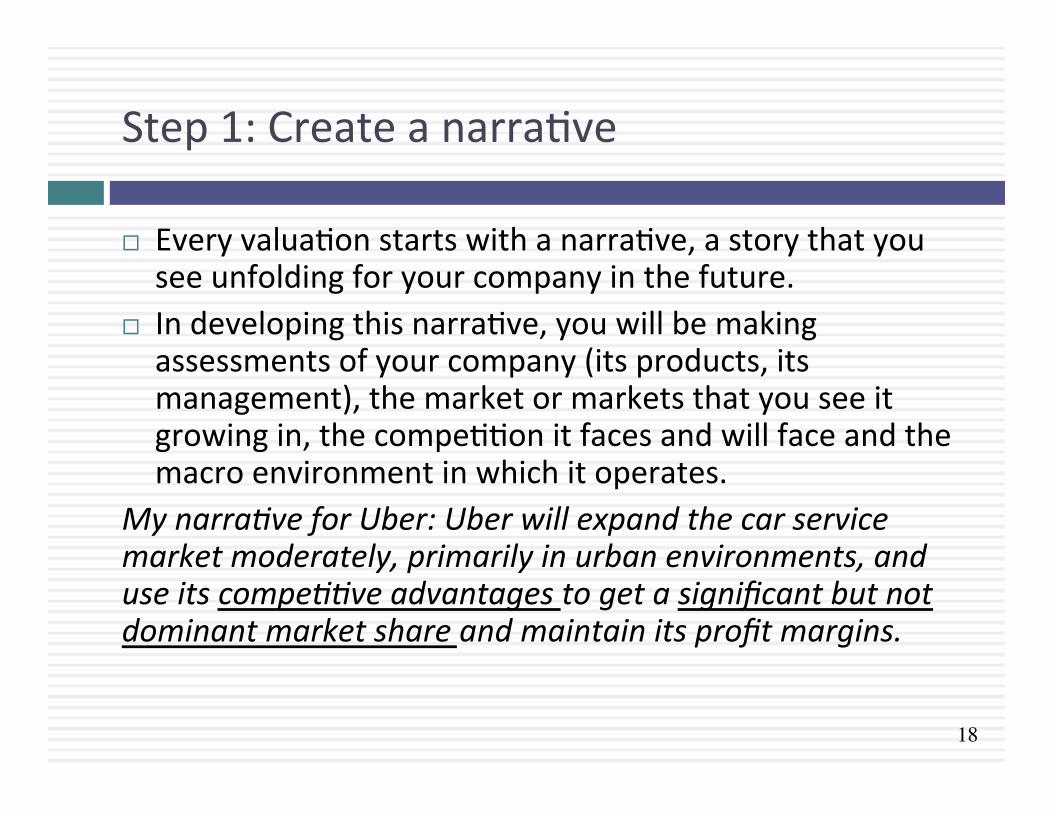
Step 1: Create a narraRve
¨ Every valuaRon starts with a narraRve, a story that you see unfolding for your company in the future.
¨ In developing this narraRve, you will be making assessments of your company (its products, its management), the market or markets that you see it growing in, the compeRRon it faces and will face and the macro environment in which it operates.
My narra.ve for Uber: Uber will expand the car service market moderately, primarily in urban environments, and use its compe..ve advantages to get a significant but not dominant market share and maintain its profit margins.

19
Step 2: Check the narraRve against history, economic first principles & common sense
Aswath Damodaran
19
20
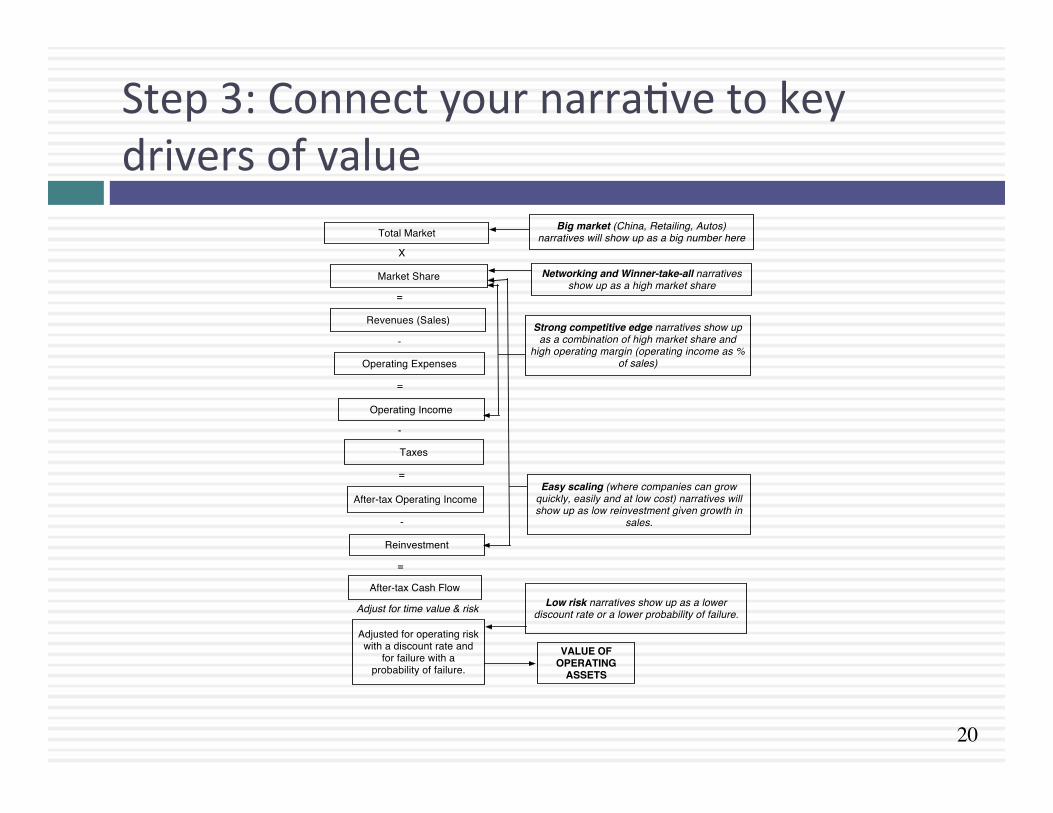
Step 3: Connect your narraRve to key drivers of value
Total Market
X
Market Share
=
Revenues (Sales)
-
Operating Expenses
=
Operating Income
-
Taxes
=
After-tax Operating Income
-
Big market (China, Retailing, Autos) narratives will show up as a big number here
Reinvestment
=
After-tax Cash Flow
Networking and Winner-take-all narratives show up as a high market share
Strong competitive edge narratives show up as a combination of high market share and
high operating margin (operating income as % of sales)
Easy scaling (where companies can grow quickly, easily and at low cost) narratives will show up as low reinvestment given growth in
sales.
Low risk narratives show up as a lower discount rate or a lower probability of failure.
Adjusted for operating risk with a discount rate and
for failure with a probability of failure.
VALUE OF OPERATING
ASSETS
Adjust for time value & risk

21
Step 4: Value the company
Aswath Damodaran
21

22
Step 5: Keep the feedback loop
Aswath Damodaran
22

23
Step 6: Be ready to modify narraRve as events unfold NarraHve Break/End NarraHve ShiP NarraHve Change
(Expansion or ContracHon)
Events, external (legal, poliRcal or economic) or internal (management, compeRRve, default), that can cause the narraRve to break or end.
Improvement or deterioraRon in iniRal business model, changing market size, market share and/or profitability.
Unexpected entry/success in a new market or unexpected exit/failure in an exisRng market.
Your valuaRon esRmates (cash flows, risk, growth & value) are no longer operaRve
Your valuaRon esRmates will have to be modified to reflect the new data about the company.
ValuaRon esRmates have to be redone with new overall market potenRal and characterisRcs.
EsRmate a probability that it will occur & consequences
Monte Carlo simulaRons or scenario analysis
Real OpRons
Aswath Damodaran
23

24
IV. Don’t mistake precision for quality..
¨ It is natural, especially if you work with numbers, to assume that precision and quality go hand in hand, i.e., that more precise valuaRons are both be`er and more useful than less precise ones.
¨ It is this principle that leads old Rme value investors to argue that you are be`er served valuing mature companies, with established business models, than young start-‐ups and that valuaRon makes more sense in stable economic environments than during periods of macro economic crisis.
¨ The ironic truth is that valuaRon is most useful when it is least precise and why you face the most uncertainty.
Aswath Damodaran
24

25
Valuing a start up is hard to do..
What are the cashflows from existing assets?
What is the value added by growth assets?
How risky are the cash flows from both existing assets and growth assets?
When will the firm become a mature fiirm, and what are the potential roadblocks?
Cash flows from existing assets non-existent or negative.
Limited historical data on earnings, and no market prices for securities makes it difficult to assess risk.
Making judgments on revenues/ profits difficult because you cannot draw on history. If you have no product/service, it is difficult to gauge market potential or profitability. The company's entire value lies in future growth but you have little to base your estimate on.
Will the firm make it through the gauntlet of market demand and competition? Even if it does, assessing when it will become mature is difficult because there is so little to go on.
Figure 3: Estimation Issues - Young and Start-up Companies
What is the value of equity in the firm?
Different claims on cash flows can affect value of equity at each stage.

26
And the dark side will beckon..
¨ With young start up companies, you will be told that it is “too difficult” or even “impossible” to value these companies, because there is so li`le history and so much uncertainty in the future.
¨ Instead, you will be asked to come over to the “dark side”, where ¤ You will see value metrics that you have never seen before ¤ You will hear “macro” stories, jusRfying value ¤ You will be asked to play the momentum game
¨ While all of this behavior is understandable, none of it makes the uncertainty go away. You have a choice. You can either hide from uncertainty or face up to it.
Aswath Damodaran
26

27
Twi`er: Se{ng the table in October 2013

Aswath Damodaran
Twitter: Priming the Pump for Valuation1. Make small revenues into big revenues
My estimate for 2023: Overall online advertising market will be close to $200 billion and Twitter will have about 5.7% ($11.5 billion)
2. Make losses into profits
My estimate for Twitter: Operating margin of 25% in year 10
3. Reinvest for growth
My estimate for Twitter: Sales/Capital will be 1.50 for next 10 years

29
The Cost of Capital for Twi`er
Cost of capital = 11.12% (.981) + 5.16% (.019) = 11.01%
90% advertising (1.44) + 10% info svcs (1.05)
Risk Premium6.15%
Cost of Debt(2.5%+5.5%)(1-.40)
= 5.16%
Cost of Equity11.12% Weights
E = 98.11% D = 1.89%
Riskfree Rate:Riskfree rate = 2.5% +
Beta 1.40 X
D/E=1.71%
75% from US(5.75%) + 25% from rest of world (7.23%)
0.
500.
1,000.
1,500.
2,000.
2,500.
Cost of Capital: US -‐ Nov ‘13
Risk in the discount rate
Survival Risk
Probability that the firm will not make it as a going concern
0% 100%
Certain to make it as going concern
Certain to fail
My assumption for Twitter
My estimate for Twitter

Terminal year (11)EBIT (1-t) $ 1,852- Reinvestment $ 386FCFF $ 1,466
Terminal Value10= 1466/(.08-.025) = $26,657
Cost of capital = 11.12% (.981) + 5.16% (.019) = 11.01%
90% advertising (1.44) + 10% info svcs (1.05)
Risk Premium6.15%
Operating assets $9,705+ Cash 321+ IPO Proceeds 1295- Debt 214Value of equity 11,106- Options 713Value in stock 10,394/ # of shares 582.46Value/share $17.84
Cost of Debt(2.5%+5.5%)(1-.40)
= 5.16%
Cost of Equity11.12%
Stable Growthg = 2.5%; Beta = 1.00;
Cost of capital = 8% ROC= 12%;
Reinvestment Rate=2.5%/12% = 20.83%
WeightsE = 98.1% D = 1.9%
Riskfree Rate:Riskfree rate = 2.5% +
Beta 1.40 X
Cost of capital decreases to 8% from years 6-10
D/E=1.71%
Twitter Pre-IPO Valuation: October 27, 2013
Revenue growth of 51.5%
a year for 5 years, tapering down to 2.5% in
year 10
Pre-tax operating
margin increases to 25% over the next 10 years
Sales to capital ratio of
1.50 for incremental
sales
Starting numbers
75% from US(5.75%) + 25% from rest of world (7.23%)
Last%10KTrailing%12%month
Revenues $316.93 $534.46Operating income :$77.06 :$134.91Adjusted Operating Income $7.67Invested Capital $955.00Adjusted Operatng Margin 1.44%Sales/ Invested Capital 0.56Interest expenses $2.49 $5.30
1 2 3 4 5 6 7 8 9 10Revenues 810$ 1,227$ 1,858$ 2,816$ 4,266$ 6,044$ 7,973$ 9,734$ 10,932$ 11,205$ Operating Income 31$ 75$ 158$ 306$ 564$ 941$ 1,430$ 1,975$ 2,475$ 2,801$ Operating Income after tax 31$ 75$ 158$ 294$ 395$ 649$ 969$ 1,317$ 1,624$ 1,807$ - Reinvestment 183$ 278$ 421$ 638$ 967$ 1,186$ 1,285$ 1,175$ 798$ 182$ FCFF (153)$ (203)$ (263)$ (344)$ (572)$ (537)$ (316)$ 143$ 826$ 1,625$

31
A sobering reminder: You will be “wrong” and it is okay
¨ No ma`er how careful you are in ge{ng your inputs and how well structured your model is, your esRmate of value will change both as new informaRon comes out about the company, the business and the economy.
¨ As informaRon comes out, you will have to adjust and adapt your model to reflect the informaRon. Rather than be defensive about the resulRng changes in value, recognize that this is the essence of risk.
¨ Remember that it is not just your value that is changing, but so is the price, and the price will change a great deal more than the value.
Aswath Damodaran
31

32
ForecasRng in the face of uncertainty. A test:
¨ In which of these two ciRes would you find it easier to forecast the weather?
Aswath Damodaran
32
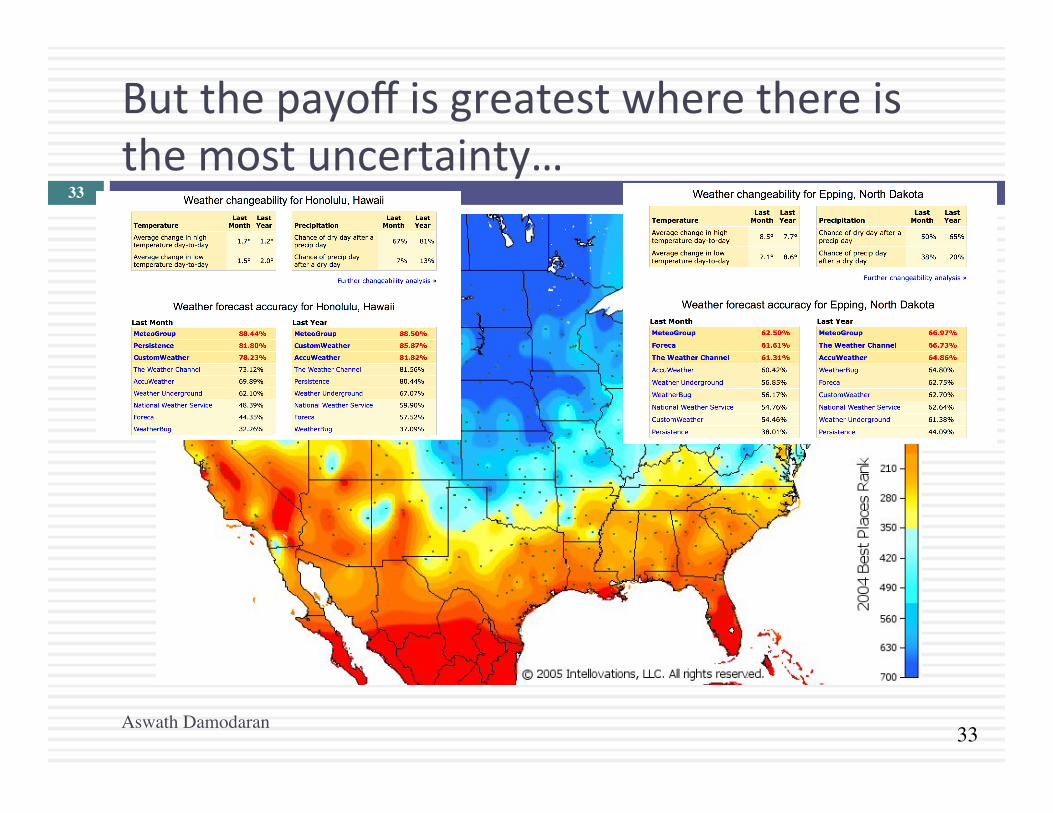
33
But the payoff is greatest where there is the most uncertainty…
Aswath Damodaran
33

34
V. Don’t mistake price for value!
Aswath Damodaran
34
PRICEValue
Price
THE GAPIs there one?
If so, will it close?If it will close, what will
cause it to close?
Drivers of intrinsic value- Cashflows from existing assets- Growth in cash flows- Quality of Growth
Drivers of price- Market moods & momentum- Surface stories about fundamentals
INTRINSIC VALUE
Accounting Estimates
Valuation Estimates

35
Test 1: Are you pricing or valuing?
Aswath Damodaran
35
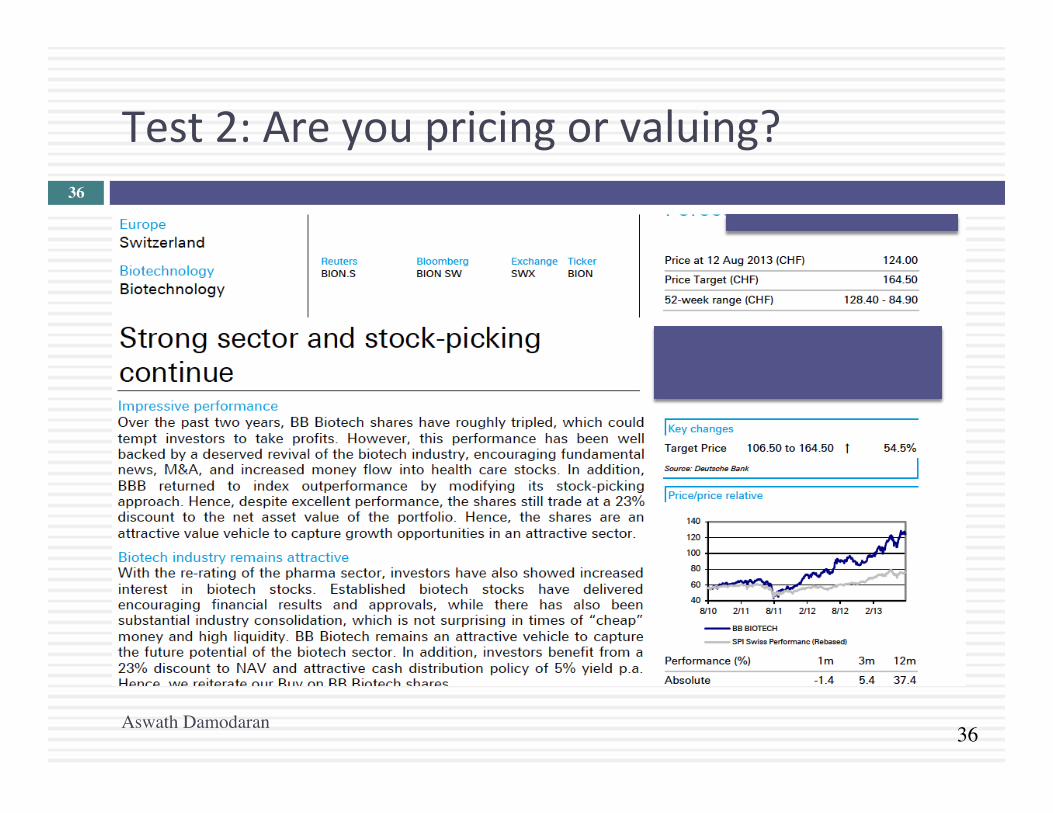
36
Test 2: Are you pricing or valuing?
Aswath Damodaran
36
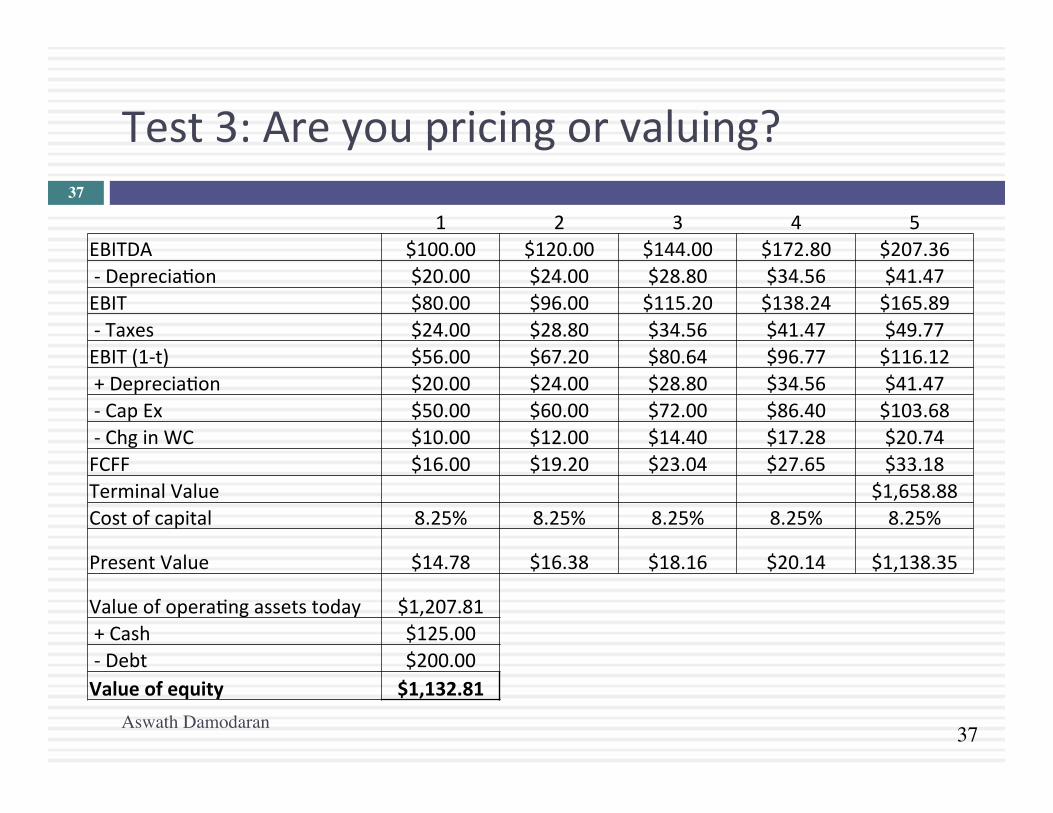
37
Test 3: Are you pricing or valuing?
Aswath Damodaran
37
1 2 3 4 5 EBITDA $100.00 $120.00 $144.00 $172.80 $207.36 -‐ DepreciaRon $20.00 $24.00 $28.80 $34.56 $41.47 EBIT $80.00 $96.00 $115.20 $138.24 $165.89 -‐ Taxes $24.00 $28.80 $34.56 $41.47 $49.77 EBIT (1-‐t) $56.00 $67.20 $80.64 $96.77 $116.12 + DepreciaRon $20.00 $24.00 $28.80 $34.56 $41.47 -‐ Cap Ex $50.00 $60.00 $72.00 $86.40 $103.68 -‐ Chg in WC $10.00 $12.00 $14.40 $17.28 $20.74 FCFF $16.00 $19.20 $23.04 $27.65 $33.18 Terminal Value $1,658.88 Cost of capital 8.25% 8.25% 8.25% 8.25% 8.25%
Present Value $14.78 $16.38 $18.16 $20.14 $1,138.35
Value of operaRng assets today $1,207.81 + Cash $125.00 -‐ Debt $200.00 Value of equity $1,132.81

38
The determinants of price
Aswath Damodaran
38
The Market Price
Mood and MomentumPrice is determined in large part
by mood and momentum, which, in turn, are driven by
behavioral factors (panic, fear, greed).
Liquidity & Trading EaseWhile the value of an asset may not change much from period to
period, liquidity and ease of trading can, and as it does, so
will the price.
Incremental informationSince you make money on
price changes, not price levels, the focus is on incremental information (news stories, rumors, gossip) and how it measures up, relative to
expectations
Group ThinkTo the extent that pricing is about gauging what other
investors will do, the price can be determined by the "herd".

39
MulRples and Comparable TransacRons
Book Valuea. Equity= BV of equityb. Firm= BV of debt + BV of equityc. Invested Capital= BV of equity + BV of debt - Cash
Cash flowa. To Equity- Net Income + Depreciation- Free CF to Equityb. To Firm- EBIT + DA (EBITDA)- Free CF to Firm
Earningsa. To Equity investors - Net Income - Earnings per shareb. To Firm - Operating income (EBIT)
Revenuesa. Accounting revenues
b. Drivers- # Customers- # Subscribers
= # units
Numerator = What you are paying for the asset
Denominator = What you are getting in return
Market value of equity Market value for the firmFirm value = Market value of equity
+ Market value of debt
Market value of operating assets of firmEnterprise value (EV) = Market value of equity
+ Market value of debt- Cash
Multiple =Step 1: Pick a multiple
Step 2: Choose comparables
Narrow versus Broad sector/business
Similar market cap or all companies
Country, Region or Global
Other criteria, subjective &
objective
CHOOSE A MULTIPLE
PICK COMPARABLE FIRMS
Step 3: Tell a story
Risk- Lower risk for higher value- Higher risk for lower value
Growth- Higher growth for higher value- Lower growth for lower value
Quality of growth- Higher barriers to entry/moats for higher value- Lower barriers to entry for lower value
SPIN/TELL YOUR STORY

40
To be a be`er pricer, here are four suggesRons
Aswath Damodaran
¨ Check your mulRple or consistency/uniformity ¤ In use, the same mulRple can be defined in different ways by different
users. When comparing and using mulRples, esRmated by someone else, it is criRcal that we understand how the mulRples have been esRmated
¨ Look at all the data, not just the key staRsRcs ¤ Too many people who use a mulRple have no idea what its cross secRonal
distribuRon is. If you do not know what the cross secRonal distribuRon of a mulRple is, it is difficult to look at a number and pass judgment on whether it is too high or low.
¨ Don’t forget the fundamentals ulRmately ma`er ¤ It is criRcal that we understand the fundamentals that drive each mulRple,
and the nature of the relaRonship between the mulRple and each variable. ¨ Don’t define comparables based only on sector
¤ Defining the comparable universe and controlling for differences is far more difficult in pracRce than it is in theory.

41
Pricing Twi`er: Start with the “comparables”
Aswath Damodaran
41
Company Market Cap Enterprise value Revenues EBITDA Net Income
Number of users (millions) EV/User EV/Revenue EV/EBITDA PE
Facebook $173,540.00 $160,090.00 $7,870.00 $3,930.00 $1,490.00 1230.00 $130.15 20.34 40.74 116.47 Linkedin $23,530.00 $19,980.00 $1,530.00 $182.00 $27.00 277.00 $72.13 13.06 109.78 871.48 Pandora $7,320.00 $7,150.00 $655.00 -‐$18.00 -‐$29.00 73.40 $97.41 10.92 NA NA Groupon $6,690.00 $5,880.00 $2,440.00 $125.00 -‐$95.00 43.00 $136.74 2.41 47.04 NA Ne~lix $25,900.00 $25,380.00 $4,370.00 $277.00 $112.00 44.00 $576.82 5.81 91.62 231.25 Yelp $6,200.00 $5,790.00 $233.00 $2.40 -‐$10.00 120.00 $48.25 24.85 2412.50 NA Open Table $1,720.00 $1,500.00 $190.00 $63.00 $33.00 14.00 $107.14 7.89 23.81 52.12 Zynga $4,200.00 $2,930.00 $873.00 $74.00 -‐$37.00 27.00 $108.52 3.36 39.59 NA Zillow $3,070.00 $2,860.00 $197.00 -‐$13.00 -‐$12.45 34.50 $82.90 14.52 NA NA Trulia $1,140.00 $1,120.00 $144.00 -‐$6.00 -‐$18.00 54.40 $20.59 7.78 NA NA Tripadvisor $13,510.00 $12,860.00 $945.00 $311.00 $205.00 260.00 $49.46 13.61 41.35 65.90 Average $130.01 11.32 350.80 267.44 Median $97.41 10.92 44.20 116.47

42
Read the tea leaves: See what the market cares about
Aswath Damodaran
42
Market
Cap Enterprise
value Revenues EBITDA Net
Income Number of
users (millions)
Market Cap 1.
Enterprise value 0.9998 1.
Revenues 0.8933 0.8966 1.
EBITDA 0.9709 0.9701 0.8869 1.
Net Income 0.8978 0.8971 0.8466 0.9716 1.
Number of users (millions) 0.9812 0.9789 0.8053 0.9354 0.8453 1.
Twitter had 240 million users at the time of its IPO. What price would you attach to the company?

43
Use the “market metric” and “market price”
Aswath Damodaran
43
¨ The most important variable, in late 2013, in determining market value and price in this sector (social media, ill defined as that is) is the number of users that a company has.
¨ Looking at comparable firms, it looks like the market is paying about $100/user in valuing social media companies, with a premium for “predictable” revenues (subscripRons) and user intensity.
¨ Twi`er has about 240 million users and can be valued based on the $100/user:
¨ Enterprise value = 240 * 100 = $24 billion

44
VI. Don’t mistake luck for skill!
Aswath Damodaran
44

45
But here is the big picture
Aswath Damodaran
45

46
The Impossible Quest: Searching for “smart” money ¨ We are constantly told that there is “smart” money out there, i.e.,
investors who have figured out ways to beat the market consistently. ¤ Can you name one category of investors that you would list as “smart”
money? ¤ Can you name individual investors that you would call “smart” money”
¨ It is every acRve investor’s dream to be one of the “smart money” group. What do you need to bring to the game to have a good chance of succeeding? a. Lots of money to invest b. Smarts (High IQ, College Pedigree) c. InformaRon access (Be`er data, More data, Proprietary data) d. InformaRon processing (Be`er models, Bigger computers) e. Trading pla~orm (High speed trading) f. Something else (What?)
Aswath Damodaran
46

47
And the final lesson..
Aswath Damodaran