Amazon.com Valuation Exercise 15.402 Finance Theory II Prof. Kevin Rock 5/10/01.
date post
22-Dec-2015Category
view
214download
1
ValuationValuationWinter 2010Winter 2010
By Michael Swiericzuk
Amazon.com, Inc.

Amazon’s offerings 20,000ft
Offers web-based services to:• Consumers• Product Sellers• Web Business Developers +• “Manufactures” the Kindle
Swiericzuk - Amazon.com Valuation March 2010

Sources:•Books and Music (media)•Product Sales (electronics etc)•Seller Branded Websites•Co-branded credit card agreements •Marketing and promotional services•Online advertising
Revenue
Swiericzuk - Amazon.com Valuation March 2010

Two operational segments: 1.North America 2.International
Three sales segments:1.Media2.Electronics and General Merchandise3.Other
Organizational StructureOrganizational Structure
Swiericzuk - Amazon.com Valuation March 2010

Sales year over year 2009North America: 20%International: 37%Consolidated: 29% (ex. Exchange Rates)
Acquisitions•November 2009 – Zappos 2009•February 2010 – Touchco
Growth
Swiericzuk - Amazon.com Valuation March 2010

InternationalN. America
2009 Revenue: $24.5B
International
N. America
2008 Revenue: $19.1 B
N. America
International
2007 Revenue: $14.8 B
Swiericzuk - Amazon.com Valuation March 2010

Sales Proportions 2007-2009
Swiericzuk - Amazon.com Valuation March 2010

Revenue and Net Income
Swiericzuk - Amazon.com Valuation March 2010

Why is Amazon so successful?
•Management - stable and experienced
•Systems Focused - constant Improvement
•Customer Focused - shipping and easy use- security
•Product Prices- not the cheapest
Swiericzuk - Amazon.com Valuation March 2010

Amazon’s Management
•Performance•Consistent Growth•International Expansion•Cost control
•2008-2010•Growth – really strong growth•Beat the “Street”•Paid down Debt
Swiericzuk - Amazon.com Valuation March 2010

•Consistent Growth•Stable Growth•Cost Control•International Expansion•Constant Improvement•Lead in ecommerce•Customer satisfaction
Amazon.com StrategyAmazon.com Strategy
Swiericzuk - Amazon.com Valuation March 2010

Where’s the Debt?
What does this do to WACC?
Equity Debt Preferred
Stock Capital
Market Value 55,850* 425** -
$56.275B Weight 0.99 0.01 0.00 100.00%Cost 11.17% 5.38% 0.00% 11.13%*Market Cap 03/03/2010 according to CNBC.com**Market Value of Debt
Swiericzuk - Amazon.com Valuation March 2010

Amazon’s Risks•Competition (BKS, EBAY, WMT,
AAPL)•Business Model•Publishers and Record Companies•Growth•Invest away from core competencies
2000-2001Swiericzuk - Amazon.com Valuation March 2010

Amazon today
Price: $126.00 (03/03/2010)
52 week range: $59.82-$145.91Beta: 1.12-1.29*PE: 61.5PEG: 1.46Market Cap: $55.8 BillionShares: 444.55ROA (5 yr): 8.20ROE (5yr): 36.06*Taken from CNBC.com, Morningstar and Reuters .com 03/03/2010*
Amazon – 12 month chart
Swiericzuk - Amazon.com Valuation March 2010
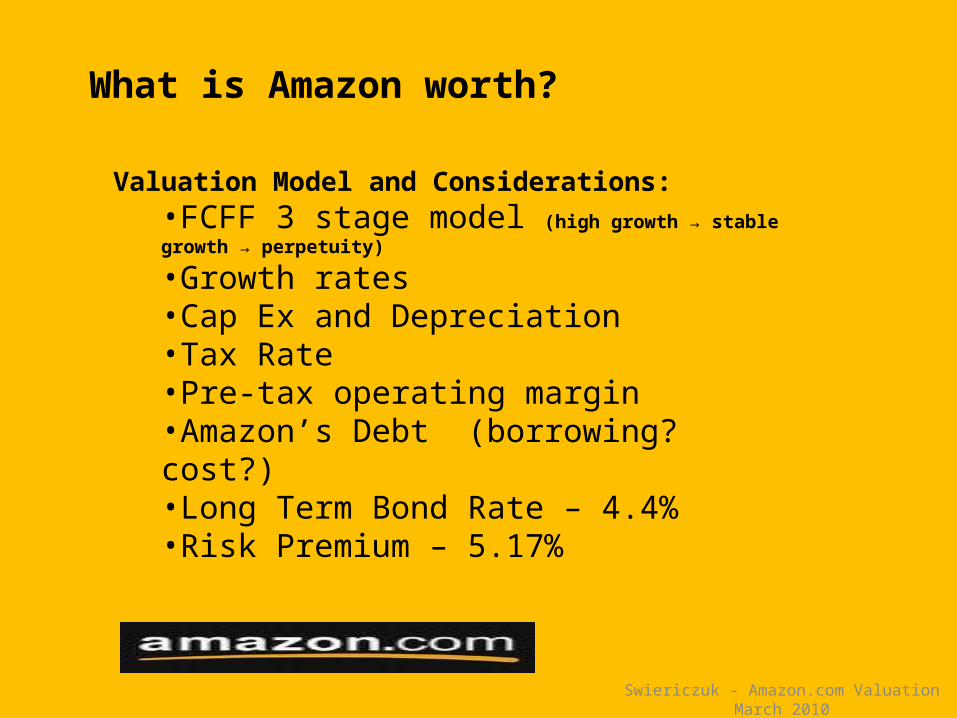
What is Amazon worth?
Valuation Model and Considerations:•FCFF 3 stage model (high growth → stable growth → perpetuity)
•Growth rates•Cap Ex and Depreciation•Tax Rate•Pre-tax operating margin•Amazon’s Debt (borrowing? cost?)•Long Term Bond Rate – 4.4%•Risk Premium – 5.17%
Swiericzuk - Amazon.com Valuation March 2010

High Growth Period 2010-2014Current pre-tax operating margin 4.61%Pre-tax operating margin at end of period 7.00%% of debt in financing investments 2%Growth rate in CAPEX & depreciation 25.00%Working capital (% of revenues) 8.00%Real tax rate 21.78%Beta 1.05Current long term bond rate 4.40%Historical market risk premium 5.17%Cost of borrowing money 4.50%
Stable Period 2015-PerpetuityCAGR at Perpetuity 4.00%Pre-tax operating margin in perpetuity 7.00%Return on capital in perpetuity 8.00%% of Debt used in financing investments 10.00%Average interest rate of debt 7.50%Beta 1.00
Model Inputs
Swiericzuk - Amazon.com Valuation March 2010

Valuation for Amazon.com, Inc.
Value of Firm $ 69,726
+ Cash and marketable securities = $ 3,444
- Value of Debt $ 425
Value of Equity $ 72,745
- Value of Equity options issued by firm $ 2,210
Value of Equity per Share $ 158.67
$158.67 is 36% above today’s value – BUY!
Swiericzuk - Amazon.com Valuation March 2010

FCFF Model SensitivityBeta 0.9 $ 164.80
1.0 $ 151.88 1.3 $ 150.28 1.5 $ 163.26
% Debt (Growth Period) 1% $ 149.80 5% $ 151.72
10% $ 154.16
% Debt (Stable Period) 1% $ 140.76 5% $ 144.84
10% $ 150.28 20% $ 162.45
Cost of Debt in Perpetuity 4% $ 177.91 8% $ 160.53
12% $ 147.16
Swiericzuk - Amazon.com Valuation March 2010

Proposed Growth Rates
AMAZON.comYear 2009 2010 2011 2012 2013 2014 2015 2016 2017 2018 2019 2020 2021 2022 2023 2024 2025International Growth 38% 38% 37% 37% 36% 35% 27% 25% 22% 20% 17% 14% 11% 9% 7% 5% 4%
International Portion of Amazon's revenue 48% 50% 52% 54% 56% 58% 60% 62% 64% 66% 68% 70% 72% 74% 76% 78% 80%
North American Growth 20% 20% 20% 20% 20% 19% 19% 17% 15% 13% 11% 9% 8% 7% 6% 5% 4%
North American Portion of Amazon's revenue 52% 50% 48% 46% 44% 42% 40% 38% 36% 34% 32% 30% 28% 26% 24% 22% 20%
Consolidated growth rate 29% 29% 29% 29% 29% 28% 24% 22% 20% 18% 15% 13% 10% 8% 6% 5% 4%
Growth rates used in the modelGrowth rates used in the model
Swiericzuk - Amazon.com Valuation March 2010

Swiericzuk - Amazon.com Valuation March 2010
?