Vail Valley Symposium
69
Vail Valley Symposium An Economic Recovery Taking Shape Richard Wobbekind Senior Economist and Associate Dean for Business and Government Relations Business Research Division University of Colorado Boulder March 25, 2021
Transcript of Vail Valley Symposium

Vail Valley Symposium An Economic Recovery Taking Shape
Richard WobbekindSenior Economist and Associate Dean for Business and Government RelationsBusiness Research DivisionUniversity of Colorado Boulder
March 25, 2021

colorado.edu/business/brd

What is that Light at the End of the Tunnel ?

U.S. Real GDP$
Tri
llio
ns
Source: Bureau of Economic Analysis and Consensus Forecasts.
15.0
16.0
17.0
18.0
19.0
20.0
21.0
Q1 2015 Q4 2015 Q3 2016 Q2 2017 Q1 2018 Q4 2018 Q3 2019 Q2 2020 Q1 2021 Q4 2021 Q3 2022
Q4 2019
Q3
Q3 2020
Q1
-31.4% SAAR-9% YoY
+33.1% SAAR-2.9% YoY
Consumption
Investment
Net Exports
FederalState and local
Q4
+4.1% SAAR-2.4% YoY

U.S Nonfarm EmploymentM
illi
on
s o
f J
ob
s
Source: Bureau of Labor Statistics, CES (Seasonally Adjusted).
130
135
140
145
150
155
2017 2018 2019 2020 2021
Jan. 2017145.6 million
Feb. 2020152.5 million
February 2021143 million
April 2020130.3 million
March 2020151.1 million
0
DETAIL

National Employment Months to Recovery
Source: Bureau of Labor Statistics (Seasonally Adjusted).
-16.0
-14.0
-12.0
-10.0
-8.0
-6.0
-4.0
-2.0
0.0
2.0
0 6 12 18 24 30 36 42 48 54 60 66 72
Percent
Number of Months Since Peak
2008-20142001-051990-93 1981-831974-761980
2020
-6.3%-6.2%

Employment Growth1-Year Growth, January 2021
Source: Bureau of Labor Statistics, Current Employment Statistics (Seasonally Adjusted).

0 1 2 3 4 5 6 7 8 9 10 11 12 13 14 15 16 17 18 19 20 21 22 23 24 25 26 27 28 29 30 31 32
Bachelor's degree and higher
55 years and over
35 to 44 years
White
45 to 54 years
Women
Total
Men
25 to 34 years
Asian
High School grad., no college
Hispanic or Latino
Less than a High School diploma
Black or African American
20 to 24 years
16 to 19 years
February 2020
Peak (April/May)
February 2021
National Unemployment Rate
Sources: Bureau of Labor Statistics.

Labor Underutilization
0
5
10
15
20
25
1995 1997 1999 2001 2003 2005 2007 2009 2011 2013 2015 2017 2019 2021
U-6
11.1%
U-3
Percentage of Labor Force
6.2%
Average U-6
Average U-3
Sources: Bureau of Labor Statistics (Seasonally Adjusted).

Labor Force Participation Rate
Percent of Population, 16 and Over
50
55
60
65
70
75
80
1980 1984 1988 1992 1996 2000 2004 2008 2012 2016 2020
Sources: Bureau of Labor Statistics (Seasonally Adjusted).
Apr. 2020:
60.2%
67.4%Total
Women
Men
61.4%
55.8%

Personal Income
Source: Bureau of Economic Analysis.
-2,000
0
2,000
4,000
6,000
8,000
10,000
12,000
14,000
16,000
18,000
20,000
22,000
24,000
26,000
Jan Feb Mar Apr May Jun Jul Aug Sep Oct Nov Dec Jan
Transfer Receipts
Proprietor Income
Contributions to Social Insurance
Dividends, Interest, and Rent
Employee Compensation
$ B
illi
on
s, S
easo
na
lly
Ad
j. A
nn
ua
l R
ate

Personal Income and Savings
0%
10%
20%
30%
40%
50%
60%
70%
80%
90%
100%
$0
$5
$10
$15
$20
$25
2007 2009 2011 2013 2015 2017 2019 2021
Percen
t, Sea
son
ally
Ad
justed
An
nu
al R
ate
Tri
llio
ns,
Sea
son
all
y A
dju
sted
An
nu
al
Ra
te
Personal Income (L-Axis)Personal Consumption Expenditures (L-Axis)Personal Savings Rate (R-Axis)
Sources: Bureau of Economic Analysis, Federal Reserve.

Household Wealth
Source: Federal Reserve Board, Balance Sheet of Households and Nonprofit Organizations (B.101) (Not Seasonally Adjusted).
0
20
40
60
80
100
120
140
160
2000 2005 2010 2015 2020
$ T
rill
ion
s
Mutual Funds
Corporate Equities
Real Estate
Other Assets

Household Debt Burden
Percent of Disposable Income
Source: Federal Reserve, Household Debt Service and Obligations Ratios.
13
14
15
16
17
18
19
8
9
10
11
12
13
14
2000 2001 2002 2003 2004 2005 2006 2007 2008 2009 2010 2011 2012 2013 2014 2015 2016 2017 2018 2019 2020
DS
RF
OR
Debt Service Ratio (Left Axis)
Financial Obligations Ratio (Right Axis)

National Retail and Food Services Sales
0
100,000
200,000
300,000
400,000
500,000
600,000
700,000
2005 2006 2007 2008 2009 2010 2011 2012 2013 2014 2015 2016 2017 2018 2019 2020 2021
$ M
illi
on
s
-13% peak to trough,
41 months to return to peak
-22.1% peak to trough,
5 months to return to peak
Source: U.S. Census Bureau.
February 2021:+6.3% year-over-year
-3%% from prior month

National Retail Sales, February YoY
-20% -15% -10% -5% 0% 5% 10% 15% 20%
Food services & drinking places
Department stores
Clothing & clothing accessories
Electronics & appliance stores
Gasoline stations
Miscellaneous store retailers
Health & personal care stores
Total
Furniture & home furn stores
Motor vehicle & parts dealers
Food & beverage stores
Building material & garden equip
Sporting goods, hobby, musical
Year-over-Year Percent Change
Source: U.S. Census Bureau, Monthly Retail Trade (Advance Estimate), September 2020.

Sales Tax CollectionsColorado
0
500
1,000
1,500
2,000
2,500
3,000
3,500
0
50
100
150
200
250
300
350
2015 2016 2017 2018 2019 2020
$, 12
-Mo
nth
Su
m
$ M
illi
on
s, M
on
th
Sources: Individual City and State revenue websites.
Year to Date Growth Figures
Denver Metro (Dec.) -4.7%
City of Boulder (Dec.) -8.8%
Louisville (Dec.) -2.9%
Longmont (Dec.) 4.3%
Superior (Nov.) 18.1%
Lone Tree (July) -28.1%
Fort Collins (Dec.) -3.3%
Greeley (Dec.) -6.7%
Thornton (Dec.) 5.5%
Grand Junction (Dec.) -2.6%
Colorado Springs (Dec.) -0.15%
Pueblo (Dec.) 2.9%
Colorado (Dec.) 2.3%
December YTD: 2.3%Month YoY: -1.4%

0
200
400
600
800
1,000
1,200
1,400
1,600
2002 2003 2004 2005 2006 2007 2008 2009 2010 2011 2012 2013 2014 2015 2016 2017 2018 2019 2020
Va
lue,
$ B
illi
on
s
+4.7%
National Value of Construction
Sources: U.S. Census Bureau.
Commercial
Residential
+11.8%
-0.1%

Manufacturing
Lodging
Office
Amusement and recreation
Educational
Conservation and development
Transportation
Religious
Communication
Sewage and waste disposal
Highway and street
Health Care
Water supply
Commercial
Public safety
Power
-10,000 -8,000 -6,000 -4,000 -2,000 0 2,000 4,000 6,000Value, $ Millions
Change in National Nonresidential Value of Construction
2020 Year-over-Year
Sources: U.S. Census Bureau.

-4,000
-3,500
-3,000
-2,500
-2,000
-1,500
-1,000
-500
0
500
2000 2002 2004 2006 2008 2010 2012 2014 2016 2018 2020 2022
$ B
illi
on
s
-$3,132
-$1,619
-$-2,792
Sources: Office of Management and Budget, Consensus Forecasts, and the Business Research Division.
Federal Budget Balance
2000 to 2022

Money and Prices

The FED
0
1,000,000
2,000,000
3,000,000
4,000,000
5,000,000
6,000,000
7,000,000
8,000,000
2007 2008 2009 2010 2011 2012 2013 2014 2015 2016 2017 2018 2019 2020 2021
Other Assets
Mortgage Backed Securities
Federal Agency Debt Securities
Treasury Securities
$ M
illi
on
s
Source: Board of Governors of the Federal Reserve System.

Interest Rates
Sources: Federal Reserve and Freddie Mac.
0
1
2
3
4
5
6
7
8
9
2000 2003 2006 2009 2012 2015 2018 2021
Per
cen
t
10-Year T-Note
3-Month T-Bill
30-Year Fixed Rate Mortgage Average
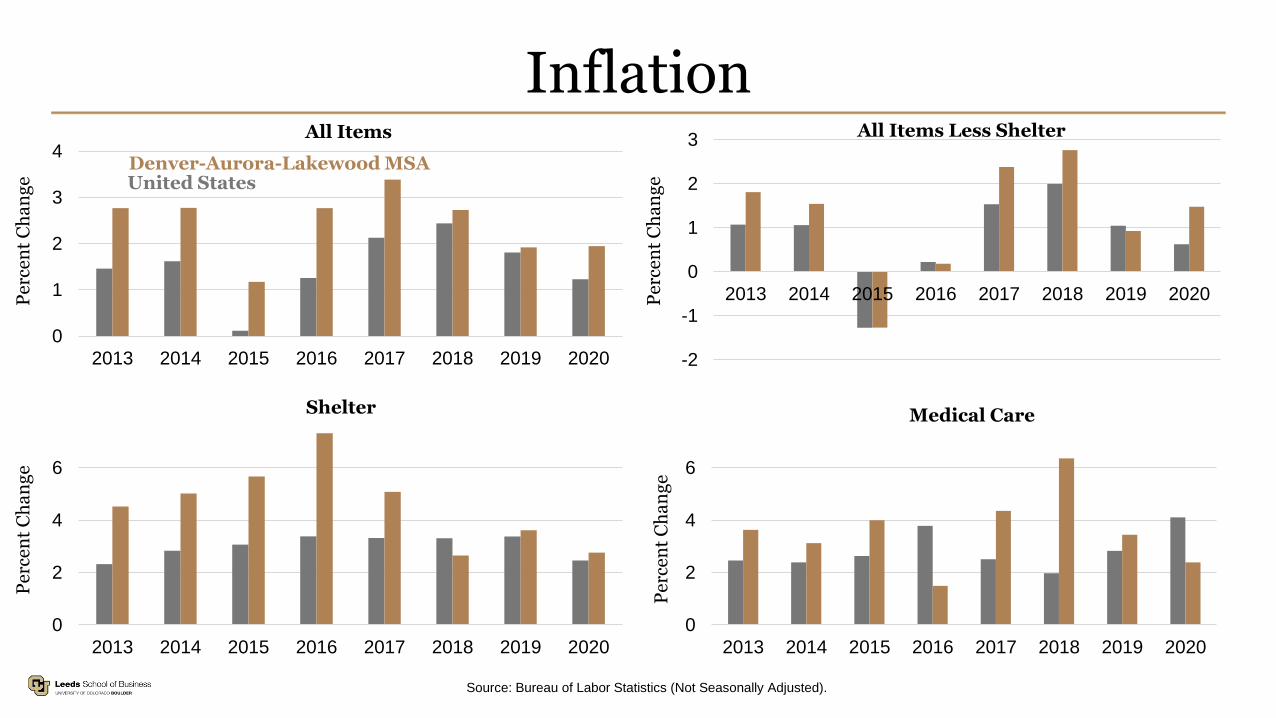
Inflation
Source: Bureau of Labor Statistics (Not Seasonally Adjusted).
0
1
2
3
4
2013 2014 2015 2016 2017 2018 2019 2020
Per
cen
t C
ha
ng
e
All Items
United StatesDenver-Aurora-Lakewood MSA
-2
-1
0
1
2
3
2013 2014 2015 2016 2017 2018 2019 2020Per
cen
t C
ha
ng
e
All Items Less Shelter
0
2
4
6
2013 2014 2015 2016 2017 2018 2019 2020
Per
cen
t C
ha
ng
e
Shelter
0
2
4
6
2013 2014 2015 2016 2017 2018 2019 2020P
erce
nt
Ch
an
ge
Medical Care

Colorado Population, Employment, and the Economy

Colorado Rank Among Other States
Data Sources: Bureau of Economic Analysis (2020), Bureau of Labor Statistics (1/21), U.S. Census Bureau (2019), Bureau of Labor Statistics (2020),
Federal Housing Finance Agency All Transactions Index (Q4 2020), BRD calculations. *Unemployment rate for the last month.
Metric 1-Year 3-Year 5-Year 10-Year
Real GDP Growth 5 4 6 5
Employment Growth 27 12 6 4
Population Growth 8 7 7 3
Personal Income Growth 48 17 11 3
PCPI Growth 48 35 24 6
PCPI 12 11 14 22
Average Hourly Wage % Growth 22 28 31 36
Average Annual Pay % Growth 21 6 8 8
Average Annual Pay 8 9 12 12
Unemployment Rate 35 9 1 32
Labor Force % Growth 4 3 2 3
LFPR 4 6 7 12
FHFA Home Price Index Growth 27 17 6 4

Colorado Change in Population
0
20,000
40,000
60,000
80,000
100,000
120,000
2001 2003 2005 2007 2009 2011 2013 2015 2017 2019 2021 2023 2025
Th
ou
san
ds
Ne
t M
igr
atio
nN
atu
ra
l In
cr
ea
se
Colorado’s population changes• 67k in 2019
• 55k in 2020
• 53k in 2021
COVID impact on migration• To the State
• Within the State
Temporary or permanent?
Sources: Colorado Demography Office, U.S. Census Bureau, and the Business Research Division.

Population Change by County2020-2021
Source: Colorado Demography Office.

Colorado Employment Growth
Sources: Colorado Department of Labor and Employment and the Colorado Business Economic Outlook Committee.
-180
-160
-140
-120
-100
-80
-60
-40
-20
0
20
40
60
80
100
2000 2002 2004 2006 2008 2010 2012 2014 2016 2018 2020
Jo
bs
Ad
ded
, T
ho
usa
nd
s

Employment by MSA
1-Year Change, January 2021
Source: Bureau of Labor Statistics, Current Employment Statistics (Seasonally Adjusted).
-25%
-20%
-15%
-10%
-5%
0%
5%
10%
15%
Per
cen
t C
ha
ng
e
Denver-Aurora-
LakewoodMSA
GreeleyMSA-7.6%
PuebloMSA
Fort CollinsMSA-4.9%
Colorado Springs
MSA
Grand Junction
MSA
BoulderMSA

Jobless Claims Colorado
0
20,000
40,000
60,000
80,000
100,000
120,000Ja
n
Fe
b
Ma
r
Apr
Ma
y
Ju
n
Ju
l
Aug
Sep
Oct
No
v
De
c
Ja
n
Fe
b
Ma
r
Init
ial
Cla
ims,
Sea
son
all
y A
dju
sted
Initial Claims
0
50,000
100,000
150,000
200,000
250,000
300,000
Ja
n
Fe
b
Ma
r
Apr
Ma
y
Ju
n
Ju
l
Aug
Sep
Oct
No
v
De
c
Ja
n
Feb
Ma
r
Init
ial
Cla
ims,
Sea
son
all
y A
dju
sted
Continued Claims
Sources: United States Department of Labor Employment & Training Administration,
Unemployment Insurance Weekly Claims, Seasonally Adjusted. Note: Excludes PUA claims.

Unemployment Rate by CountyJanuary 2021
Source: Bureau of Labor Statistics (Not Seasonally Adjusted),
National 6.2%Colorado 6.6%

Accommodation and Food ServicesGovernment
Arts, Entertainment, and RecreationLocal Government
Healthcare and Social AssistanceOther Services
Admin and Waste MgmtState Government
Mining and LoggingConstruction
ManufacturingEducational Services
InformationWholesale Trade
Real Estate and Rental and LeasingProf., Scientific, and Tech. Services
Retail Trade
Federal GovernmentMgmt of Companies and Enterprises
Finance and InsuranceTransportation and Utilities
-70 -50 -30 -10 10Percent
Accommodation and Food ServicesGovernmentArts, Entertainment, and Recreation
Local GovernmentHealthcare and Social Assistance
Other ServicesAdmin and Waste Mgmt
State GovernmentMining and Logging
ConstructionManufacturing
Educational Services
InformationWholesale Trade
Real Estate and Rental and Leasing
Prof., Scientific, and Tech. ServicesRetail Trade
Federal Government
Mgmt of Companies and EnterprisesFinance and Insurance
Transportation and Utilities
-80,000 -60,000 -40,000 -20,000 0 20,000
Jobs
Colorado Employment Change
January Year-over-Year
Source: Bureau of Labor Statistics.

Colorado Employment by Wage GroupPercent Change from January 2020
Source: Bureau of Labor Statistics CES (Seasonally Adjusted).
Note: Wage terciles are determined by calculating the average annual wage for each industry as of Q1 2020 and grouping each industry’s total employment.
-35%
-30%
-25%
-20%
-15%
-10%
-5%
0%
5%
January February March April May June July August September October NovemberDecember January
Percent
High Income: >$75k
Middle Income: $50k-75k
Low Income: <$50k

Tourism
Photo courtesy of Dustin Doskocil/CPW.

DIA Enplanements and Deplanements2000-2020
Sources: Denver International Airport and Colorado Business Economic Outlook Committee. Photo courtesy of Denver International Airport.
0
1
2
3
4
5
6
7
8
2000 2002 2004 2006 2008 2010 2012 2014 2016 2018 2020
Mil
lio
ns
Monthly
3-Month Moving Average
Dec.2019
Dec.2020
-45.4% YoY
Change
December YTD

0
10
20
30
40
50
60
70
2011 2013 2015 2017 2019 2021
Million66.4
Sources: National Park Service and Colorado Business Economic Outlook Committee. Photo courtesy of Dustin Doskocil/CPW.
Colorado Public Lands Visits
2011 - 2021

National Snowsports Visits
1983/84 - 2019/20
Source: NSAA, National Skier/Snowboarder Visits.
35
40
45
50
55
60
65
1983/84 1989/90 1995/96 2001/02 2007/08 2013/14 2019/20
Millions
51.1
U.S. visits down 13.8%
Lowest visitation since snow-
challenged 2011/12 season
Suspended Colorado ski operations
mid-March
Guest caution mixed with pent-up
demand

Leisure & Hospitality Employment
Year-Over-Year Percent Change in Leisure & Hospitality Employment
Source: Bureau of Labor Statistics, CES.
-50%
-40%
-30%
-20%
-10%
0%
10%
Feb Mar Apr May Jun Jul Aug Sep Oct Nov Dec Jan
Per
cen
t o
f E
sta
bli
shm
ents

Construction& Real Estate

FHFA Home Price Index by MSA
1-Year Home Price Change, Q4 2020
Source: Federal Housing Finance Agency, All Transactions Index (Not Seasonally Adjusted).
-5%
0%
5%
10%
15%
Per
cen
t C
ha
ng
e
Denver-Aurora-
LakewoodMSA
GreeleyMSA
PuebloMSA
Fort CollinsMSA
Colorado Springs
MSA
Grand Junction
MSA Boulder MSA
$0
$5
$10
$15
$20
$25
2010 2012 2014 2016 2018 2020
Va
lue
in B
illi
on
s
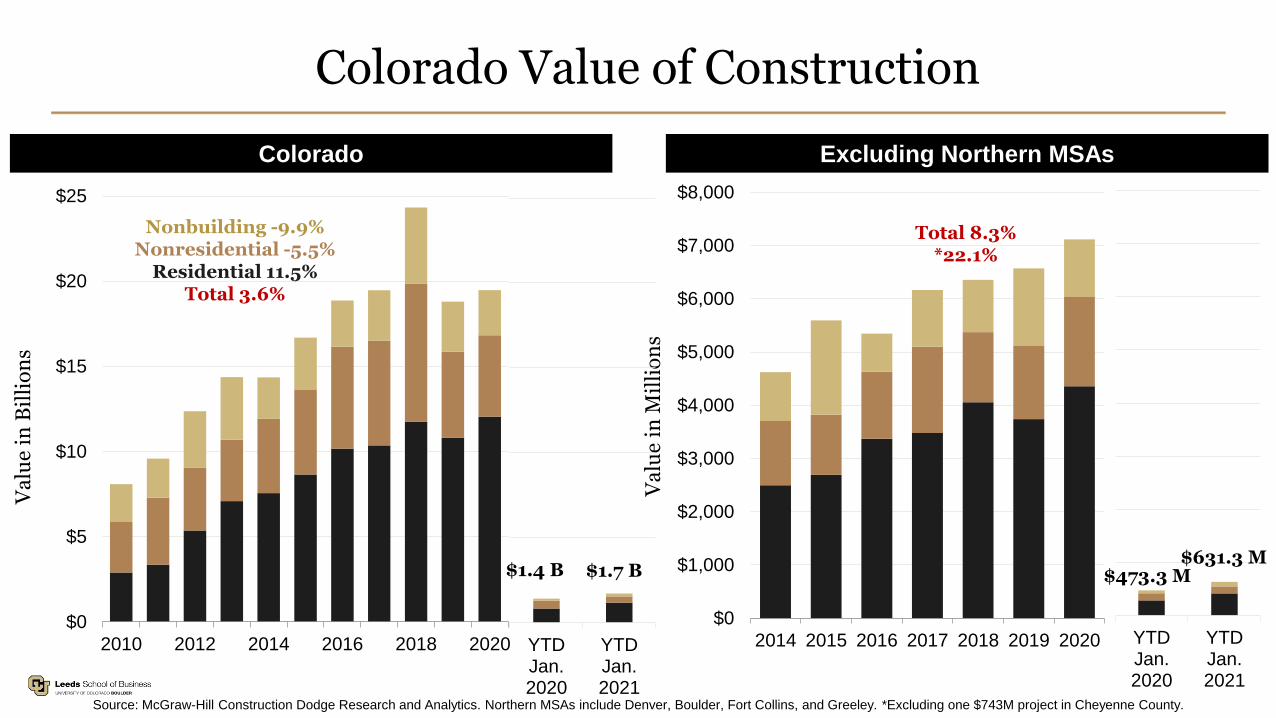
Colorado Value of Construction
Source: McGraw-Hill Construction Dodge Research and Analytics. Northern MSAs include Denver, Boulder, Fort Collins, and Greeley. *Excluding one $743M project in Cheyenne County.
Nonbuilding -9.9%Nonresidential -5.5%
Residential 11.5%Total 3.6%
$0
$1,000
$2,000
$3,000
$4,000
$5,000
$6,000
$7,000
$8,000
2014 2015 2016 2017 2018 2019 2020V
alu
e in
Mil
lio
ns
Colorado Excluding Northern MSAs
Total 8.3%*22.1%
YTDJan.2020
YTDJan.2021
$1.4 B $1.7 B
YTDJan.2020
YTDJan.2021
$473.3 M$631.3 M

0
5,000
10,000
15,000
20,000
25,000
30,000
35,000
40,000
45,000
50,000
2010 2012 2014 2016 2018 2020
Per
mit
s
Residential Building Permits
Sources: U.S. Census Bureau and the Colorado Business Economic Outlook Committee. Northern MSAs include Denver, Boulder, Fort Collins, and Greeley.
Multifamily
Single Family
Colorado
0
5,000
10,000
15,000
20,000
25,000
2010 2012 2014 2016 2018 2020
Per
mit
s
+31.3%
Excluding Northern MSAs
+11.6% NoCo:2020: 0%

Eagle County Residential Building Permits
0
200
400
600
800
1,000
1,200
1,400
1,600
1997 1999 2001 2003 2005 2007 2009 2011 2013 2015 2017 2019
Source: U.S. Census Bureau.
Multifamily
Single Family

Colorado Ski Counties

-4,000
-2,000
0
2,000
4,000
6,000
8,000
10,000
12,000
14,000
1970 1975 1980 1985 1990 1995 2000 2005 2010 2015 2020
Thousands
Natural IncreaseNet Migration
Ski Counties – Population Change
Ski Counties increases• 2,000 in 2019• 2,600 in 2020
Nearly half of the increase from migration
Stable growth
Slower pace than the state
Declining Natural Increase
Eagle County increases• 179 in 2019• 378 in 2020
Source: Colorado Demography Office, U.S. Census Bureau, and the Business Research Division.

Jobless Claims Colorado
0
1,000
2,000
3,000
4,000
5,000
6,000
7,000
8,000
9,000
10,000
0
20,000
40,000
60,000
80,000
100,000
120,000
Ja
n
Fe
b
Ma
r
Apr
Ma
y
Ju
n
Ju
l
Aug
Sep
Oct
Nov
De
c
Ja
n
Fe
b
Init
ial
Cla
ims,
Sea
son
all
y A
dju
sted
Initial Claims
Colorado – Left AxisSki – Right Axis
0
5,000
10,000
15,000
20,000
25,000
30,000
0
50,000
100,000
150,000
200,000
250,000
300,000
Ja
n
Fe
b
Ma
r
Apr
Ma
y
Jun
Ju
l
Aug
Sep
Oct
No
v
De
c
Ja
n
Fe
b
Init
ial
Cla
ims,
Sea
son
all
y A
dju
sted
Continued Claims
Colorado – Left AxisSki – Right Axis
Sources: United States Department of Labor Employment & Training Administration,
Unemployment Insurance Weekly Claims, Seasonally Adjusted. Note: Excludes PUA claims.

Unemployment Rate
January 2021
Source: Bureau of Labor Statistics, LAUS (Not Seasonally Adjusted).
0
5
10
15
20
25
Per
cen
t C
ha
ng
e
SanMiguel
La Plata
Clear Creek
Archuleta, Pitkin
Gunnison
Chaffee
Routt
Summit
Lake
Garfield
Grand
Eagle

Resident Employment Change
January 2021
Source: Bureau of Labor Statistics, LAUS (Not Seasonally Adjusted).
-25
-20
-15
-10
-5
0
5
10
15
20
25
Per
cen
t C
ha
ng
e, Y
ear-
ov
er-Y
ear
San Miguel
La Plata
Gunnison
San Juan
Archuleta Routt
Eagle
Clear Creek, Pitkin
Summit
GarfieldChaffee
Grand, Lake

Le
isu
re
& H
os
pa
lity
Co
ns
tru
cti
on
Fin
an
cia
l A
cti
vit
ies
Oth
er
Se
rv
ice
s
PB
S
TT
U
Go
ve
rn
me
nt
Ed
uc
ati
on
/He
alt
h
Se
rv
ice
s
Info
rm
ati
on
Na
tur
al
Re
so
ur
ce
s/M
inin
g
Ma
nu
fac
tur
ing
0.0
0.5
1.0
1.5
2.0
2.5
3.0
3.5
4.0
4.5
5.0
Lo
cati
on
Qu
oti
ent
Industry Location QuotientsEagle County compared to the U.S., 2019 Annual
Source: Bureau of Labor Statistics.

Average Annual WagesSki Counties
$10,000
$20,000
$30,000
$40,000
$50,000
$60,000
$70,000 Colorado: $64,650
Source: Bureau of Labor Statistics, QCEW, as of Q3 2020.

Eagle County Employment12-Month Rolling Average
0
5,000
10,000
15,000
20,000
25,000
30,000
35,000
40,000
2001 2002 2003 2004 2005 2006 2007 2008 2009 2010 2011 2012 2013 2014 2015 2016 2017 2018 2019 2020
Thousands
Source: Bureau of Labor Statistics, QCEW Data Series, NSA.
September YoY-3,700 jobs, -11.2%

Daily Commute
Eagle County
Vail
Sources: Census OntheMap, 2017 and the
Bureau of Economic Analysis, 2019..
$224.3 M Personal income outflow

Ski Counties Personal Income
-$1
$0
$1
$2
$3
$4
$5
$6
Bil
lio
ns
Personal Current Transfer Payments
Dividends, Interest, Rent
Earnings by Place of Work
Contributions for Social Insurance
Source: Bureau of Economic Analysis, 2019.
Adjustments for Residence
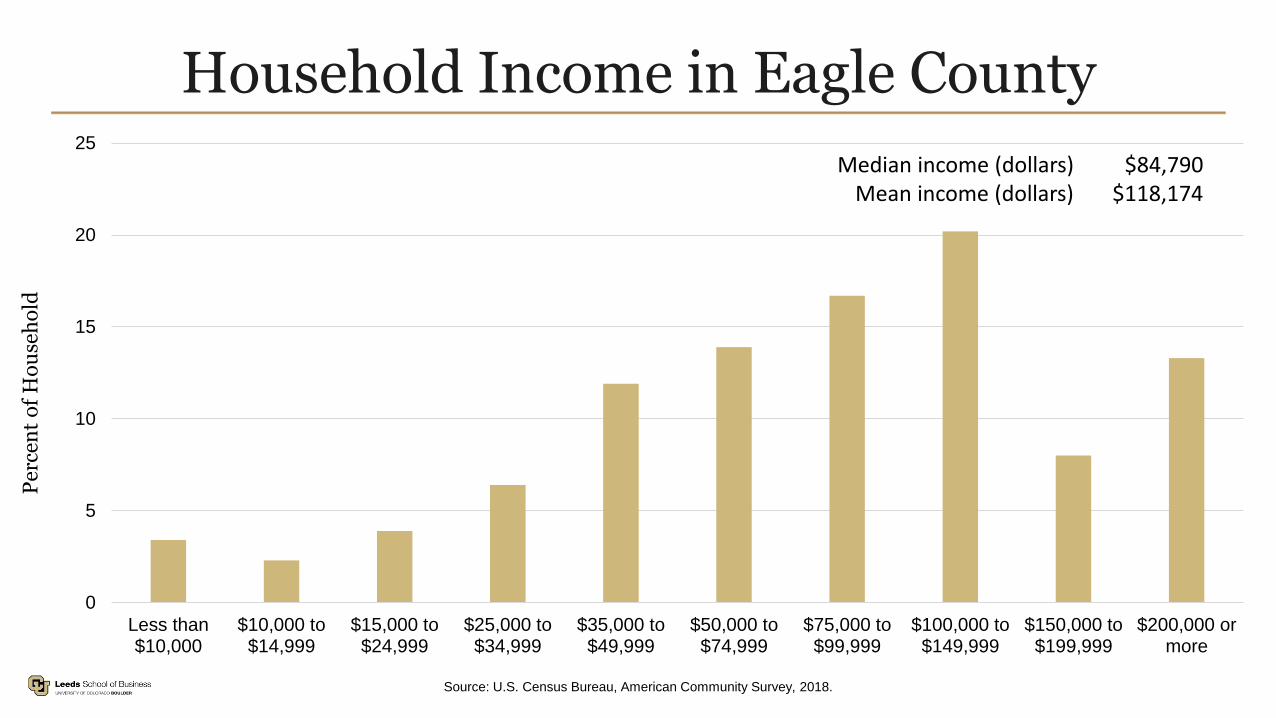
Household Income in Eagle County
0
5
10
15
20
25
Less than$10,000
$10,000 to$14,999
$15,000 to$24,999
$25,000 to$34,999
$35,000 to$49,999
$50,000 to$74,999
$75,000 to$99,999
$100,000 to$149,999
$150,000 to$199,999
$200,000 ormore
Per
cen
t o
f H
ou
seh
old
Median income (dollars) $84,790Mean income (dollars) $118,174
Source: U.S. Census Bureau, American Community Survey, 2018.

Indicators
Photo by Riccardo Annandale on Unsplash.

0
20
40
60
80
100
120
140
160
1996 2000 2004 2008 2012 2016 2020
Index 1985=100
Consumer Confidence
United States
Mountain Region
Index of Consumer Confidence
Sources: The Conference Board, National Bureau of Economic Research, University of Michigan.
50.0
60.0
70.0
80.0
90.0
100.0
110.0
120.0
1980 1988 1996 2004 2012 2020
Consumer Sentiment

ISM Indices
Source: Institute for Supply Management® (ISM).
30
35
40
45
50
55
60
65
70
2002 2004 2006 2008 2010 2012 2014 2016 2018 2020
ISM Manufacturing PMI® Index
30
35
40
45
50
55
60
65
70
2002 2004 2006 2008 2010 2012 2014 2016 2018 2020
ISM Services PMI® Index

Percent of Small Business Establishments
Percent of Establishments with Less Than 20 Employees
Source: Bureau of Labor Statistics, QCEW.
80%
85%
90%
95%
Per
cen
t o
f E
sta
bli
shm
ents
Colorado#17
89% of firms have fewerthan 20 employees
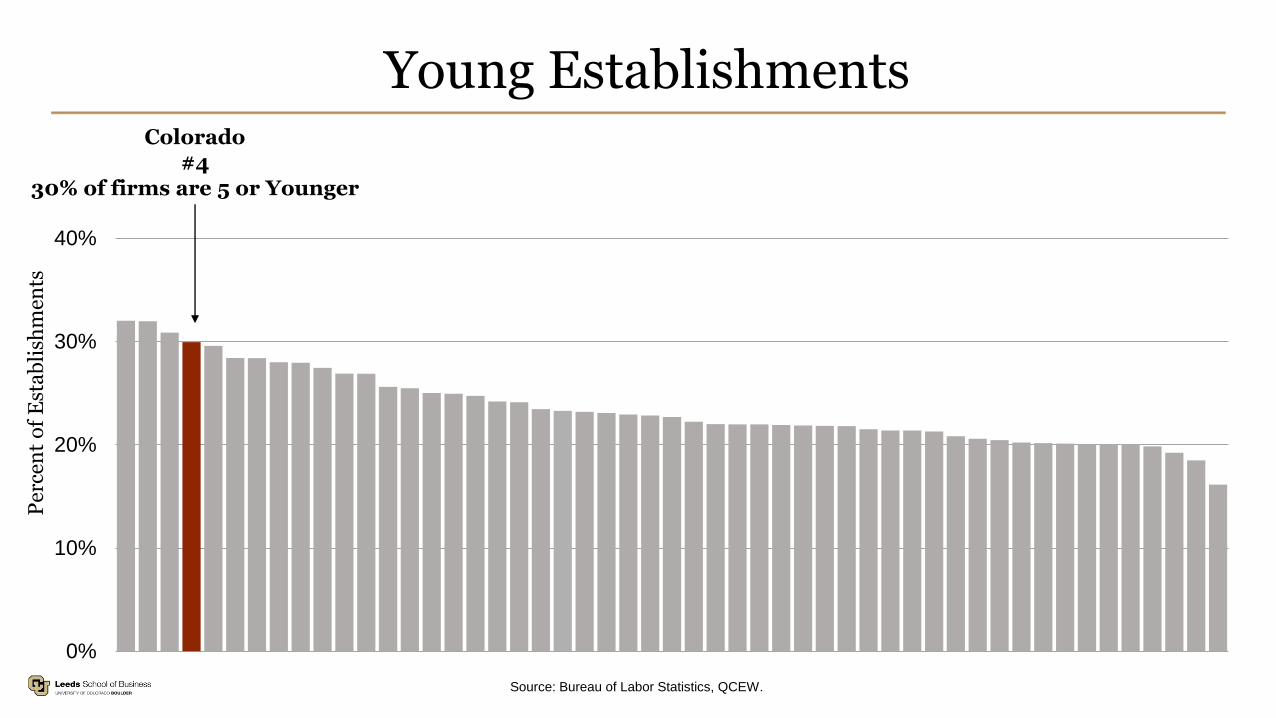
Young Establishments
Source: Bureau of Labor Statistics, QCEW.
0%
10%
20%
30%
40%
Per
cen
t o
f E
sta
bli
shm
ents
Colorado#4
30% of firms are 5 or Younger

Young Businesses and Employment Growth
Sources: Census Bureau, Business Dynamics Statistics; Bureau of Labor Statistics, Current Employment Statistics.
20%
22%
24%
26%
28%
30%
32%
34%
36%
38%
40%
0.0% 0.5% 1.0% 1.5% 2.0% 2.5% 3.0% 3.5%
Colorado
Utah
West Virginia
Per
cen
t o
f E
sta
bli
shm
ents
, 2
01
8
Average Employment Growth, 2011-2019
AlaskaOregon

0
200
400
600
800
1,000
1,200
1,400
1,600
2006 2007 2008 2009 2010 2011 2012 2013 2014 2015 2016 2017 2018 2019 2020
Ba
nk
rup
tcie
s
Chapter 7Chapter 11Chapter 13
Colorado Bankruptcy Filings
Sources: U.S. Bankruptcy Courts.

0
10,000
20,000
30,000
40,000
50,000
60,000
70,000
2003 2004 2005 2006 2007 2008 2009 2010 2011 2012 2013 2014 2015 2016 2017 2018 2019 2020
Colorado Foreclosures
Source: Colorado Department of Local Affairs, Division of Housing.
Sales
Filings
Sales: -62%
Filings: -52%

-40%
-30%
-20%
-10%
0%
10%
20%
30%
40%
50%
2 4 6 8 10 12 14 16 18 20 22 24 26 28 30 32 34 36 38 40 42
2-W
ee
k A
ve
ra
ge
, Y
ea
r-o
ve
r-Y
ea
r G
ro
wth
Week
New Entity Filings, Year-over-Year
Sources: Colorado Secretary of State’s Office.
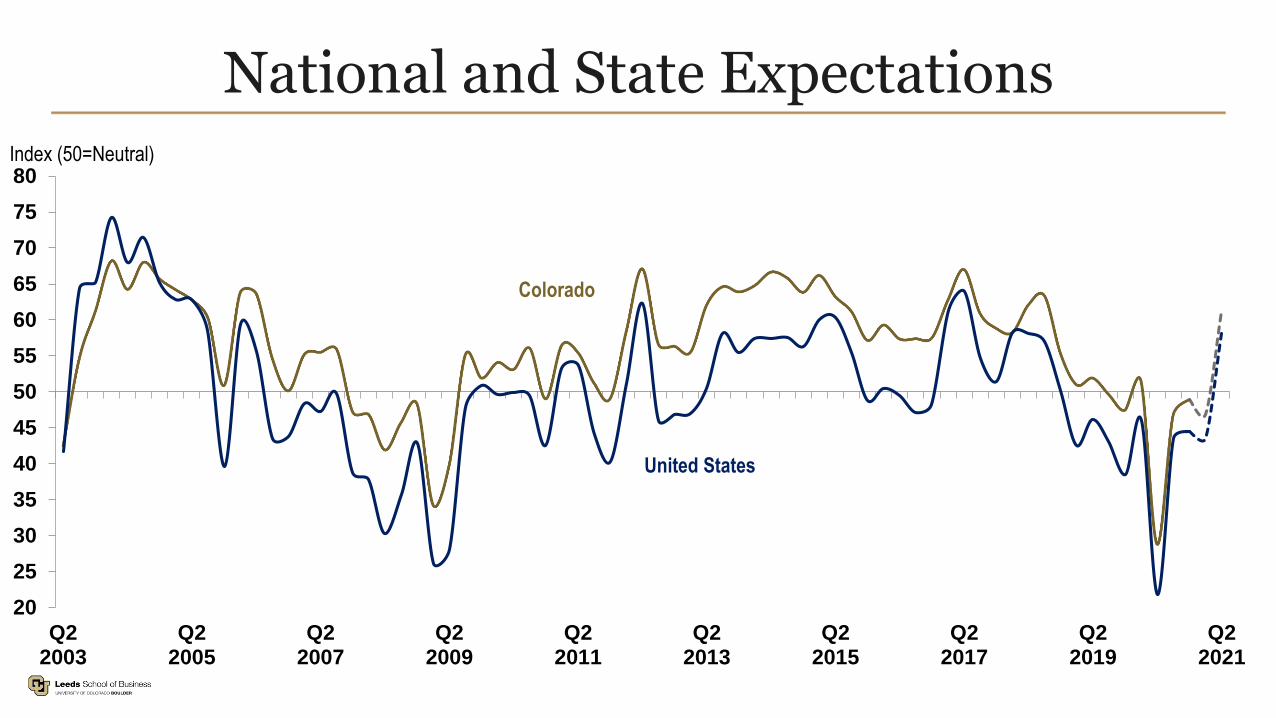
National and State Expectations
20
25
30
35
40
45
50
55
60
65
70
75
80
Q22003
Q22005
Q22007
Q22009
Q22011
Q22013
Q22015
Q22017
Q22019
Q22021
Colorado
United States
Index (50=Neutral)

Venture Capital Investment
Colorado
$0
$200
$400
$600
$800
$1,000
$1,200
$1,400
$1,600
$1,800
$2,000
2009 2010 2011 2012 2013 2014 2015 2016 2017 2018 2019 2020
Millions
Source: CB Insights.
Sample 2019 Deals:
DispatchHealthSomaLogicEdgewise TherapeuticsJumpCloudOutriderAMP RoboticsEnliven Therapeutics

Headwinds, Unknowns, and Tailwinds
Human BehaviorReal Estate/Construction
DroughtFires
ProductivityEducation
Work from Home
COVID-19 VariantTourism
Events and ConventionsBusiness FailuresPolitical Unrest
Racial Strife
Gross Domestic ProductFederal Stimulus 2/3
VaccineRetail Sales
EnergyBiopharmaAgricultureTechnology

Telework Due to Pandemic
Source: Bureau of Labor Statistics, Current Population Survey (CPS) Supplemental Data.
0%
5%
10%
15%
20%
25%
30%
35%
40%
May Jun Jul Aug Sep Oct Nov Dec Jan
Telework Percent
0% 20% 40% 60%
Accomm and food
Agriculture
Construction
Retail trade
Trans and utilities
Other services
Mgmt and admin
Health care
Arts, ent., and rec.
Manufacturing
Wholesale trade
Mining
Real estate
Public admin
Education
Information
Finance
Prof. and tech services
Industry
Pandemic Peak (May)
January 2021

Q&A