Utilizing Python as a scripting language for the McIDAS-V - SSEC
22
Utilizing Python as a scripting language for the McIDAS-V visualization package Mike Hiley (and the McIDAS-V Team) SSEC/CIMSS, University of Wisconsin-Madison 2013 McIDAS User’s Group Meeting September 10, 2013 Madison, WI
Transcript of Utilizing Python as a scripting language for the McIDAS-V - SSEC
Utilizing Python as a scripting language for the McIDAS-V
visualization package
Mike Hiley (and the McIDAS-V Team)
SSEC/CIMSS, University of Wisconsin-Madison 2013 McIDAS User’s Group Meeting
September 10, 2013 Madison, WI

Quick Overview of McIDAS-V
• Free, open-source 3D visualization package under active development at SSEC/CIMSS
• Focused on meteorological data, but not limited to it
• User support provided by the McIDAS User Group (MUG) – anyone can create an account on the forum and get help!
• Java-based architecture; easy to install on Windows/OSX/Linux
• Based on several components (details coming)
McIDAS-V Supported Data • Many supported data types:
– Point data – Numerical weather model output in various formats
(GRIB2, netCDF, GEMPAK, and more) – Satellite imagery, including hyperspectral via HYDRA – Radar (especially NEXRAD) – netCDF files that conform to CF conventions – Remote data access via ADDE, THREDDS – Lots more
McIDAS-V Functionality
• Data choosers let the user put any combination of these data into a display, then manipulate the display interactively
• Display is fully three-dimensional – especially useful for conventional radar as well as cross sections from e.g., CloudSat and CALIPSO

Example Image produced by McIDAS-V: putting the A-train in a single display!
• CloudSat vertically pointing cloud radar
• 89GHz vertically polarized brightness temperatures from AMSR-E
• 0.65 um reflectance from MODIS
Thanks to Prof. Ralf Bennartz (Vanderbilt/SSEC) for help producing this image

Quick History of McIDAS-V
• “Fifth-generation McIDAS” – the successor to McIDAS-X (though codebase is almost completely unrelated)
• Based on several components: – VisAD: Java component library for visualization of virtually
any numerical dataset, developed at SSEC – Integrated Data Viewer (IDV): Extension of VisAD
providing support for meteorological data sources and adding a GUI interface, developed at Unidata
– HYperspectral-viewer for Development of Research Applications (HYDRA): Extension of VisAD focused on visualization of hyperspectral satellite data, developed at SSEC

In a nutshell, McIDAS-V is an extension of the IDV and VisAD that incorporates HYDRA and adds other features
like Suomi NPP support, a dedicated support team, and…
• A new Jython scripting API ! • Under active development at SSEC • McIDAS-V previously had some scripting
capabilities, but: • limited functionality • “Un-Pythonic”
• New API is designed from ground up to ease automation of common workflows in McIDAS-V via a user friendly and well documented API.

Current status of scripting API • McIDAS-V version 1.2, released in April 2012, included the
first version of this new scripting functionality. – So far we have focused primarily on access to satellite imagery
via ADDE – Extensive tutorials and documentation available on McIDAS-V
website • Scripting framework continues to be heavily developed. 1.3
and 1.4 releases include some new functionality: – listADDEImages (find out what is on the server without
downloading images) – Jython Shell improvements (keyboard shortcuts, easier to run
scripts that are on disk) – Numerous stability improvements

McIDAS-V scripting overview
• Users write scripts in the Python programming language
• Python scripts are interpreted in the Java-based McIDAS-V system via Jython, an implementation of the Python programming language in Java
• In addition to our new API, advanced users can call any piece of Java code in the McV/IDV/VisAD library. (Without having to actually write Java code).

Users can run scripts in two modes:
• Interactively: in a normal session of McIDAS-V by typing commands in the “Jython Shell”
• In the “background”: from a terminal session. McIDAS-V boots, runs a script, and closes
Interactive mode

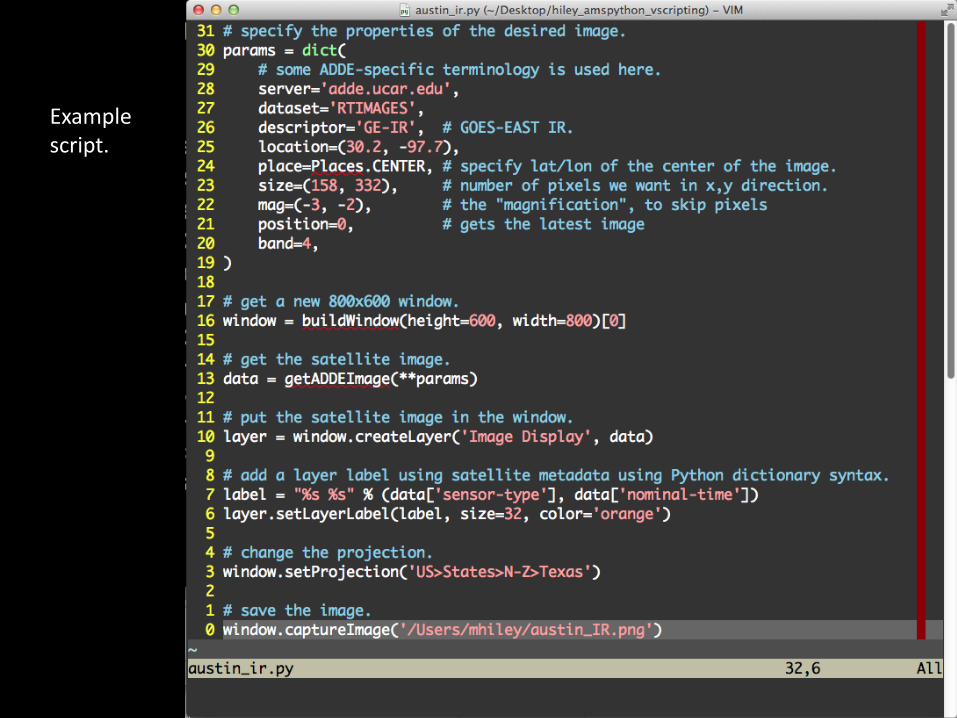
Simple example script
• Use the “getADDEImage” function* to get some satellite imagery.
• Put the data in a display. • Add a descriptive label using metadata from
ADDE. • Change the map projection. • Write out the image as a PNG.
• *(ADDE: Abstract Data Distribution Environment. Used heavily in
McIDAS-X world. Main advantage: can get exactly the part of an image you need, nothing more.)

Example script.
API Design - principles
• Functions and methods should be named well so they have a predictable result
• Anywhere an arbitrary string is required - for example when specifying display type (image, contour, streamlines, etc.) – the user should be able to use the same strings found in the GUI labels
• Pythonic syntax wherever feasible

API design – key classes • _Data: a piece of data, e.g. u and v model winds
– Key metadata can be accessed via Python dictionary syntax – Can perform statistical analysis, do arithmetic operations, etc.
• _Layer: A piece of data that has been displayed (e.g. a streamline display of the model winds) – Can change some key layer properties like enhancement table
• _Window: A combination of multiple layers, e.g. wind streamlines plotted on top of a satellite image – Some key per-display properties you can set:
• Display size • Lat/lon center point of image • Map projection
– Can add text annotations and write image to disk
Example script.

Challenges – Implementation of new scripting API
• The foundation of the McIDAS-V codebase, the IDV, was built primarily as a GUI-based system. For us developers, providing scripting-based access to IDV features can be challenging.
• But – this is precisely why our work is important – to shield end users from these complications!

Challenges – Jython limitations
• Current “final” release is only Jython 2.5.3; Jython 2.7 is under development and it is unclear if we will see a Jython 3. (Current stable CPython is version 3.3).
• No NumPy! • Jython code significantly slower than native
Java code.
Challenges – facilitating data analysis
• In McIDAS-V, all data is internally represented using the “VisAD Data Model”: a generic way of representing virtually any scientific dataset
• We want scientists to do data analysis and algorithm development in McIDAS-V, but that means scientists need to learn this “VisAD Data Model”, which can be seen as a pro or a con: – PRO: VisAD provides a powerful way to manipulate/analyze a
huge variety of data types in a uniform way. – CON: The VisAD learning curve can be steep (VisAD lingo can
seem strange to scientists coming from a MATLAB/IDL world) • Part of our work will be to fill the gap between VisAD and
traditional science code however we can… solid documentation, helper functions, boilerplate scripts, user forum support

Conclusion
• New McIDAS-V scripting API promises to provide consistent access to a wide variety of meteorological data sources using the Python programming language.
• First edition of this scripting framework was introduced in version 1.2, and heavy development has continued since, and will continue for the foreseeable future.
• McIDAS-V already has a wide variety of powerful tools available for both visualization and data analysis. Access to these tools via scripting will get better with every release.
Things you can do right now!!!
• Install McIDAS-V; it’s easy and works on Windows/OSX/Linux; available for free at: – http://www.ssec.wisc.edu/mcidas/software/v/
• Create an account on the McIDAS-V support forum to get help from the developers, support team, and other users!: – http://dcdbs.ssec.wisc.edu/mcidasv/forums/

Thanks for listening!
• McIDAS-V core “scripting team” • Becky Schaffer • Jonathan Beavers • Rick Kohrs • Bob Carp
• The rest of the McIDAS team: • Tom Rink • Tom Whittaker • Tommy Jasmin • Dave Santek • Jay Heinzelman • Barry Roth
• Users that keep pushing the boundaries of McV scripting:
• Joleen Feltz • Hans-Peter Roesli
(EUMETSAT)
Acknowledgements: