User manual for Delphos in AnyWave - univ-amu.fr
8
User manual for Delphos in AnyWave Nicolas ROEHRI Aix Marseille Univ, Inserm, INS, Institut de Neurosciences des Systèmes Marseille, France, Version 1.1 [email protected] Contents 1 Preamble 2 2 How to cite 2 3 Requirements 3 4 Usage 4 Figure 1: Delphos splash screen 1
Transcript of User manual for Delphos in AnyWave - univ-amu.fr

User manual for Delphos in AnyWave
Nicolas ROEHRIAix Marseille Univ,
Inserm,INS, Institut de Neurosciences des Systèmes
Marseille, France,Version 1.1
Contents
1 Preamble 2
2 How to cite 2
3 Requirements 3
4 Usage 4
Figure 1: Delphos splash screen
1

2 HOW TO CITE
1 Preamble
Delphos, standing for Detector of ElectroPhysiological Oscillations and Spikes, is a detector based onthe ZH0-normalization of the wavelet transform described in [Roehri et al., 2016]. As its name suggests,Delphos was designed to detect both oscillations and spikes. Moreover, because the detection happens inthe time-frequency plane, the oscillations are not restrain to a frequency band. Two separate interfaces weredeveloped: Delphos and Delphos Viewer, the multi-channel detection algorithm and the single channel re-viewer, respectively. This manual is for the Delphos 1.0.Note that Delphos should be run on stationary background (e.g. not on seizure or transition from REM toNREM) and on artefact free period as muscle artefact increases the number of false detection. Also, it isrecommended to re-reference the montage in bipolar.
2 How to cite
Please cite Delphos using [Roehri et al., 2016] for the method and [Roehri et al., 2017] for the validation.
2

3 REQUIREMENTS
3 Requirements
• Delphos.zip: Zip forlder containung Delphos plugin and required components,
• MCR_R2018b_win64_installer.exe: Matlab Runtime Executable 2018b.
Delphos.zip must be unzip in C:\Documents\AnyWave\Plugins\Matlab\Delphos.MCR_R2018b_win64_installer will install a Matlab engine to run compiled code such as Delphos.
3

4 USAGE
4 Usage
1. From AnyWave, click on the Process tab and then on Matlab and finally on Delphos (Fig. 2).
Figure 2: AnyWave Processes tab
Note that AnyWave continues running while Delphos is in use, this means AnyWave can be usednormally and other calculations can be launched.
2. A splash screen (Fig. 1) pops up when AnyWave launches Delphos. The main interface (Fig. 3) shouldappears shortly after.
Contoured in red, you have a list of buttons to modify the parameters of the analysis.
• Select Channel(s): select channels from your preselection from AnyWave. By default, Delphosselect all channels of either the previously selected lines/channels or the current montage.
• Duration: set the beginning and duration (in seconds) of the section to be analysed. By default,Delphos analyses 5 minutes (duration = 300s) – or the duration of the file if shorter than 5 minutes– starting from the beginning (start = 0s). To tell Delphos to analyse the whole section you haveto set start at 0 and write all in duration.
• Wavelet Settings:
– the number of voices corresponds to the resolution of the time-frequency plane (similar tothe frequency step in linear scale but in log-scale). Lowering the number of voices speedsup the analysis but lower the sensitivity of the detection.
– the vanishing moment controls the time and frequency resolution of the wavelet. The greater,the higher the frequency resolution but the lower the time resolution.
• Detection Settings:
– Threshold corresponds to the level in the ZH0 time-frequency image separating the back-ground from an event of interest. Default is set to 40.
– Osc width thr is the lowest time width defining an oscillation,– Osc freq spread thr is the highest frequency spread defining an oscillation,– Spk width thr is the highest time width defining a spike,– Spk freq spread is the lowest frequency spread defining a spike,
Fig. 4 illustrates the time width ratio and the frequency spread.
The default settings correspond to the ones which were validated and used in [Roehri et al., 2017,Roehri et al., 2018], respectively.
4

4 USAGE
Figure 3: Delphos main interface
From the panel contoured in green, you can choose the type of events you want to detect and the limitsof the frequency band for the oscillations. In the installation folder of Delphos(C:\Documents\AnyWave\Plugins\Matlab\Delphos), there is a file named default_ freqband.txt wheredefault settings of the oscillations markers are set (label, color and frequency bands) in a semicolonseparated file. The first column corresponds to the label of the oscillation, the second and third columnsto its lower and higher limits of its frequency band respectively, and the last column to the color of the
5

4 USAGE
marker in hexadecimal. An example is given below:
%%Oscillation name;lower frequency;higher frequencyVery Fast Osc;500;Inf;#ff00ffFast Ripple;250;500;#ff0000Ripple;80;250;#ff8000Gamma;24;80;#800000Beta;12.4;24;#00b000Alpha;7.4;12.4;#00b0b0Theta;3.5;7.4;#0070ffDelta;1;3.5;#0000ffInfra slow;0;1;#000090
The Artefact marker panel in blue gives you the possibility to select Global Markers from AnyWaveas artefact markers. Delphos will skip the sections corresponding to these markers.
The Seizure Mode panel in orange enables you to detect events of interest during seizures. To doso, you have to check the Seizure Mode box and select a Global Marker from AnyWave targeting aseizure. Delphos uses 60s- baseline prior to the marker onset to normalised the ictal time-frequency.
3. Once all the parameters have been set press LAUNCH. A bar progress will pop up reading consecu-tively Initializing Parallel Computing, Detection on chunk 1/n and Sending markers to AnyWave.Finally, a bar plot of the rate of the detected events is displayed on Delphos’ main interface (Fig. 5)and the markers appears in AnyWave.
The button Bar plot settings is now active and allows you to modify the frequency band of the oscil-lation rate you want to display. To change the bands, you have to give the limit of the bands of interest
candidate eventspike
oscillationosc width throsc freq spread
spk width thrspk freq spread
oscillation area
spike area
Figure 4: Right panel: Example of a fast ripple occurring during a spike. Left panel: Feature space used todifferentiate oscillations (high time width ratio, low frequency spread) and sharp transients (low time widthratio, high frequency spread).
6
4 USAGE
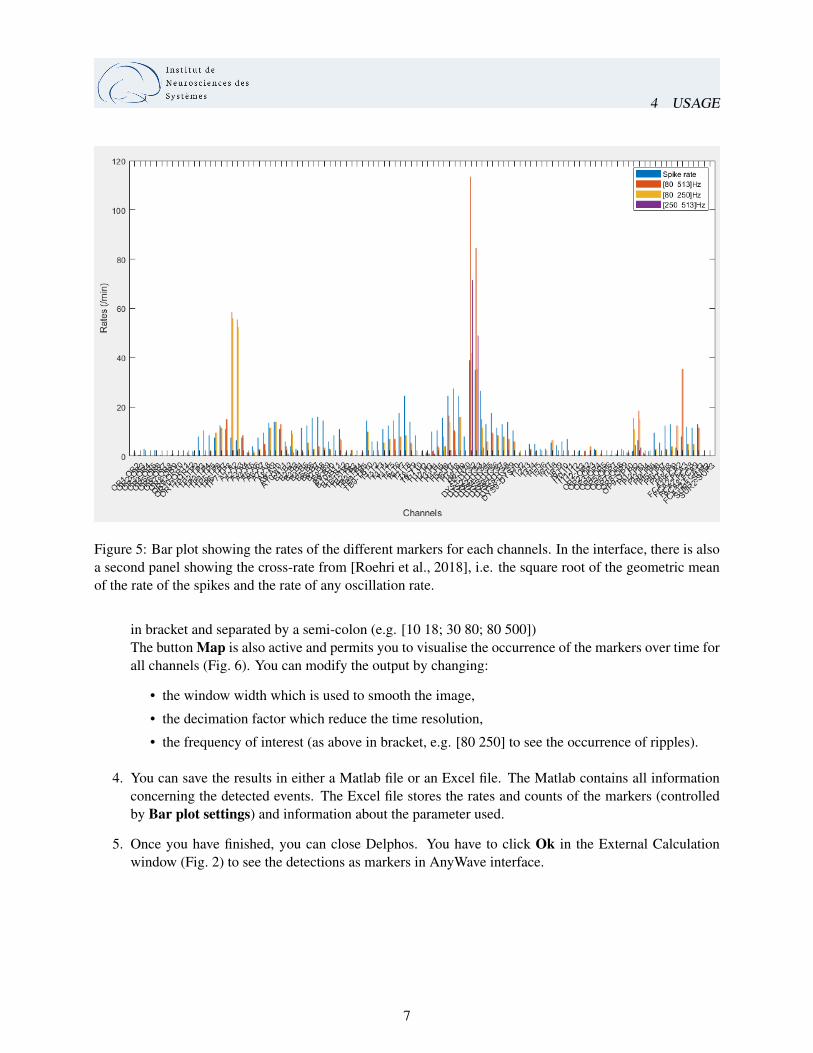
Figure 5: Bar plot showing the rates of the different markers for each channels. In the interface, there is alsoa second panel showing the cross-rate from [Roehri et al., 2018], i.e. the square root of the geometric meanof the rate of the spikes and the rate of any oscillation rate.
in bracket and separated by a semi-colon (e.g. [10 18; 30 80; 80 500])The button Map is also active and permits you to visualise the occurrence of the markers over time forall channels (Fig. 6). You can modify the output by changing:
• the window width which is used to smooth the image,
• the decimation factor which reduce the time resolution,
• the frequency of interest (as above in bracket, e.g. [80 250] to see the occurrence of ripples).
4. You can save the results in either a Matlab file or an Excel file. The Matlab contains all informationconcerning the detected events. The Excel file stores the rates and counts of the markers (controlledby Bar plot settings) and information about the parameter used.
5. Once you have finished, you can close Delphos. You have to click Ok in the External Calculationwindow (Fig. 2) to see the detections as markers in AnyWave interface.
7

Figure 6: Map of the detection over time (in case of a focal cortical dysplasia).
References
[Roehri et al., 2016] Roehri, N., Lina, J.-M., Mosher, J. C., Bartolomei, F., and Bénar, C.-G. (2016). Time-frequency strategies for increasing high frequency oscillation detectability in intracerebral. IEEE Trans-actions on Biomedical Engineering, 63(12):2595–2606.
[Roehri et al., 2017] Roehri, N., Pizzo, F., Bartolomei, F., Wendling, F., and Bénar, C.-G. (2017). What arethe assets and weaknesses of HFO detectors? A benchmark framework based on realistic simulations.PLoS ONE, 12(4).
[Roehri et al., 2018] Roehri, N., Pizzo, F., Lagarde, S., Lambert, I., Nica, A., McGonigal, A., Giusiano,B., Bartolomei, F., and Bénar, C.-G. (2018). High-frequency oscillations are not better biomarkers ofepileptogenic tissues than spikes. Annals of Neurology, 83:84–97.
8