Use of NPs/PAs in the Oncology Setting ARM Workforce Interest Group Clese Erikson Senior Research...
26
Use of NPs/PAs in the Oncology Setting ARM Workforce Interest Group Clese Erikson Senior Research Associate June 2, 2007
-
Upload
russell-jeffery-berry -
Category
Documents
-
view
228 -
download
0
Transcript of Use of NPs/PAs in the Oncology Setting ARM Workforce Interest Group Clese Erikson Senior Research...
Use of NPs/PAs in the Oncology Setting
ARM Workforce Interest Group
Clese Erikson Senior Research Associate June 2, 2007
Oncology Workforce StudyFunded by the American Society of Clinical Oncology
Authors: Clese Erikson, M.P.Aff
Edward Salsberg, MPA
Gaetano Forte
Suanna Bruinooge
Michael Goldstein, MD
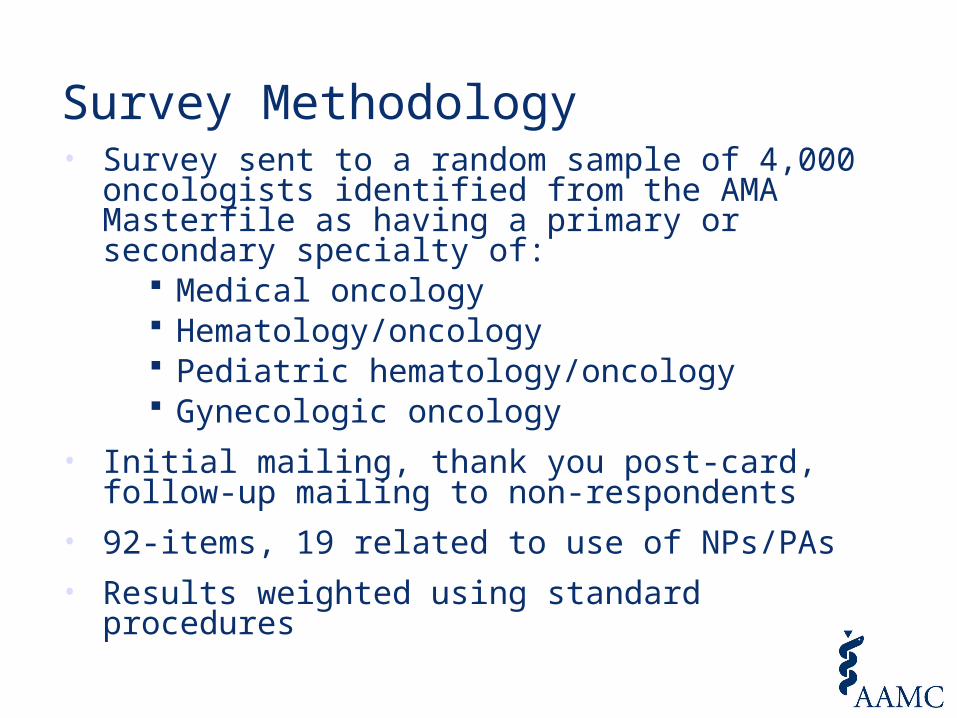
Survey Methodology• Survey sent to a random sample of 4,000
oncologists identified from the AMA Masterfile as having a primary or secondary specialty of:
Medical oncology Hematology/oncology Pediatric hematology/oncology Gynecologic oncology
• Initial mailing, thank you post-card, follow-up mailing to non-respondents
• 92-items, 19 related to use of NPs/PAs
• Results weighted using standard procedures
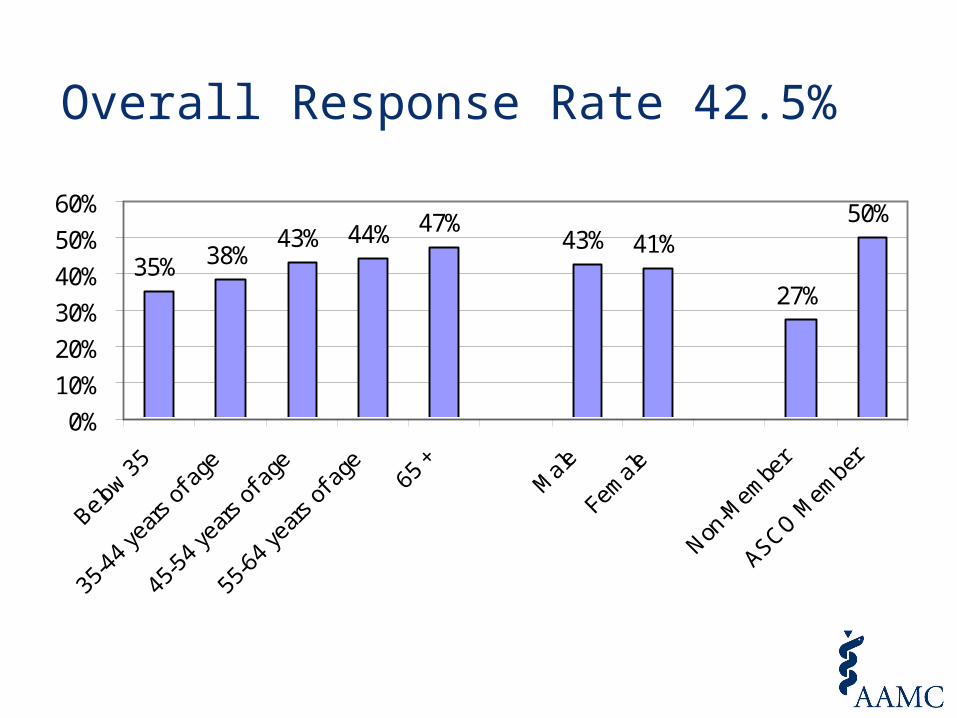
Overall Response Rate 42.5%
35% 38%43% 44% 47%
43% 41%
27%
50%
0%
10%
20%
30%
40%
50%
60%
Below 3
5
35-4
4 ye
ars
of a
ge
45-5
4 ye
ars
of a
ge
55-6
4 ye
ars
of a
ge 65 +
Male
Fem
ale
Non-M
embe
r
ASCO Mem
ber
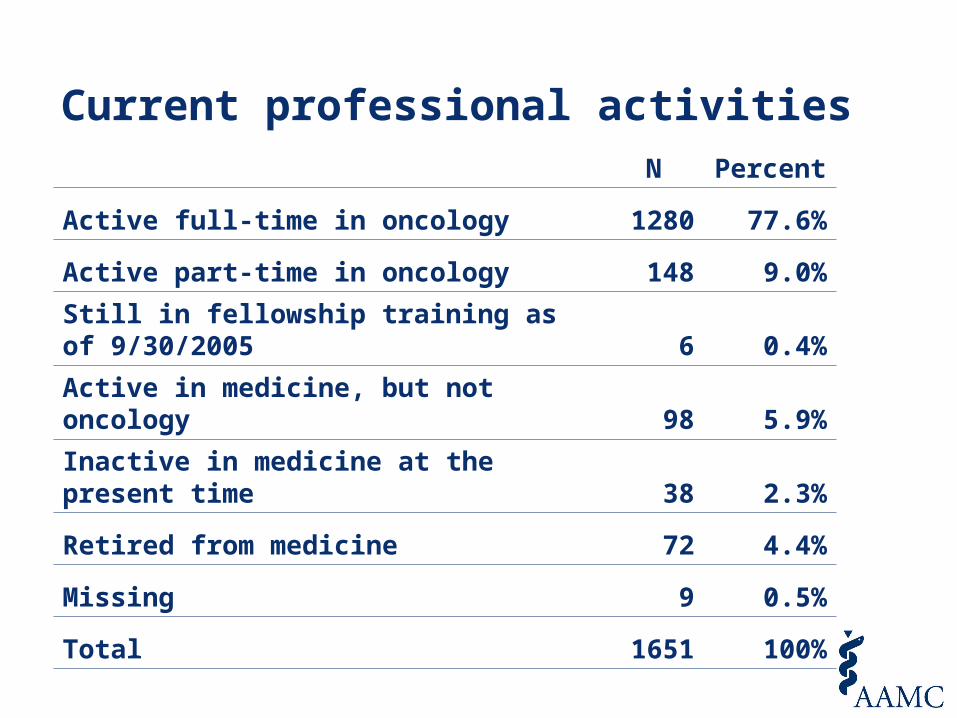
Current professional activitiesN Percent
Active full-time in oncology 1280 77.6%
Active part-time in oncology 148 9.0%
Still in fellowship training as of 9/30/2005 6 0.4%
Active in medicine, but not oncology 98 5.9%
Inactive in medicine at the present time 38 2.3%
Retired from medicine 72 4.4%
Missing 9 0.5%
Total 1651 100%
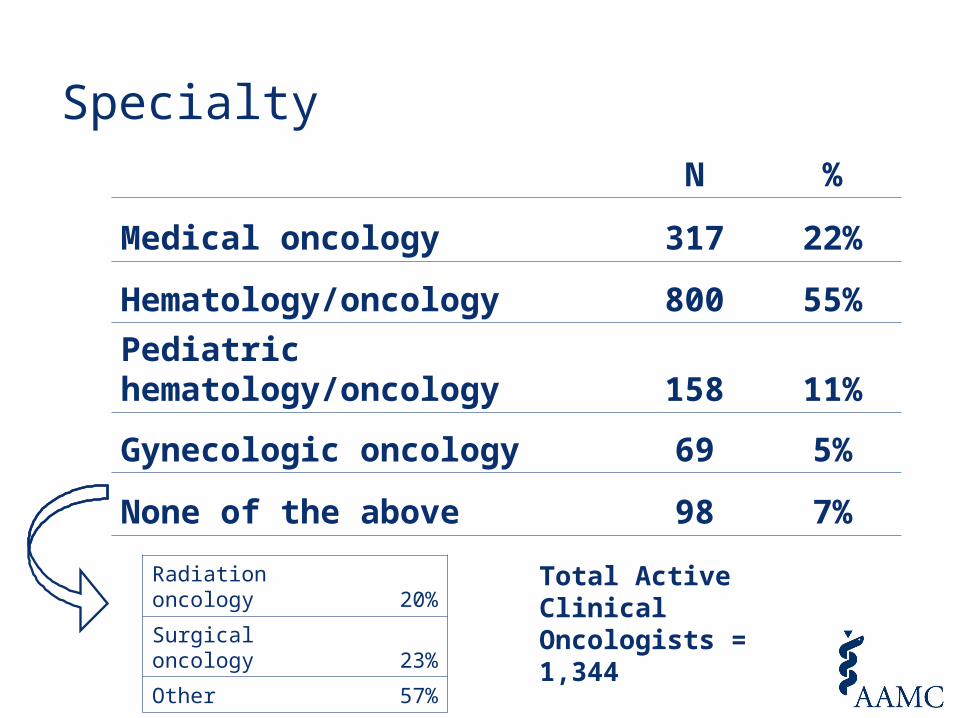
SpecialtyN %
Medical oncology 317 22%
Hematology/oncology 800 55%
Pediatric hematology/oncology 158 11%
Gynecologic oncology 69 5%
None of the above 98 7%
Radiation oncology 20%
Surgical oncology 23%
Other 57%
Total Active Clinical Oncologists = 1,344
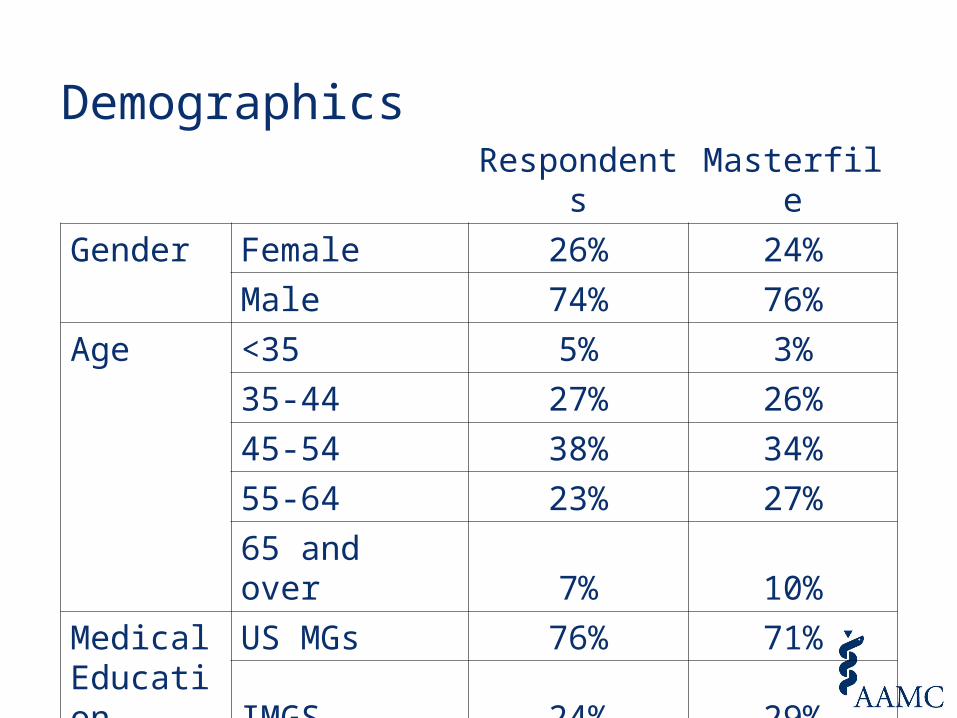
DemographicsRespondents Masterfile
Gender Female 26% 24%
Male 74% 76%
Age <35 5% 3%
35-44 27% 26%
45-54 38% 34%
55-64 23% 27%
65 and over 7% 10%
Medical Education
US MGs 76% 71%
IMGS 24% 29%
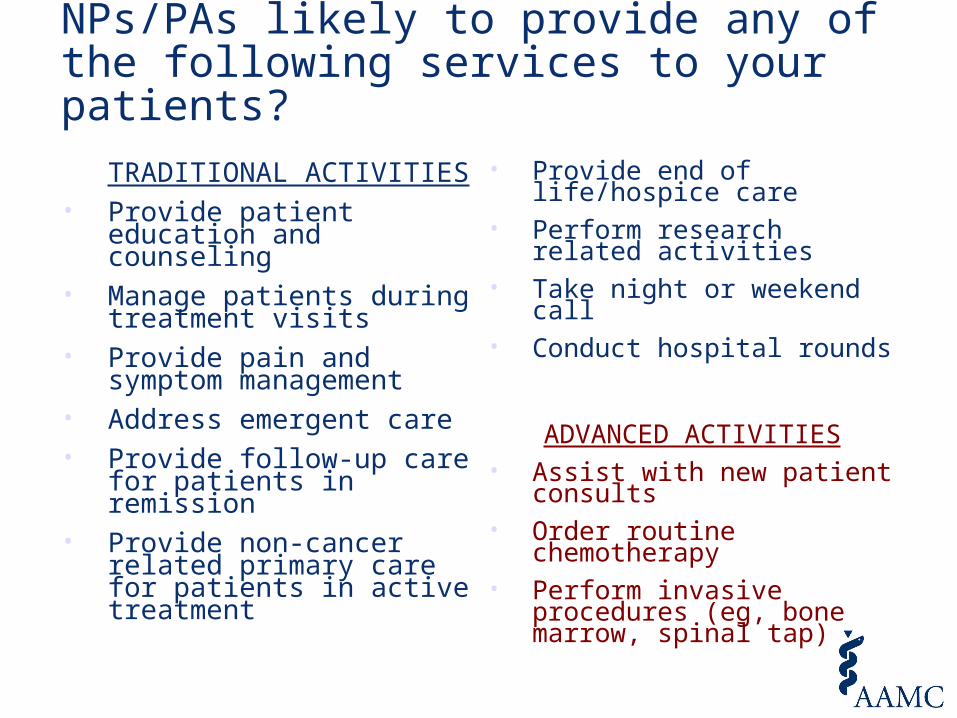
NPs/PAs likely to provide any of the following services to your patients?
TRADITIONAL ACTIVITIES• Provide patient education
and counseling • Manage patients during
treatment visits• Provide pain and symptom
management• Address emergent care• Provide follow-up care for
patients in remission• Provide non-cancer related
primary care for patients in active treatment
• Provide end of life/hospice care
• Perform research related activities
• Take night or weekend call• Conduct hospital rounds
ADVANCED ACTIVITIES• Assist with new patient
consults• Order routine chemotherapy• Perform invasive procedures
(eg, bone marrow, spinal tap)
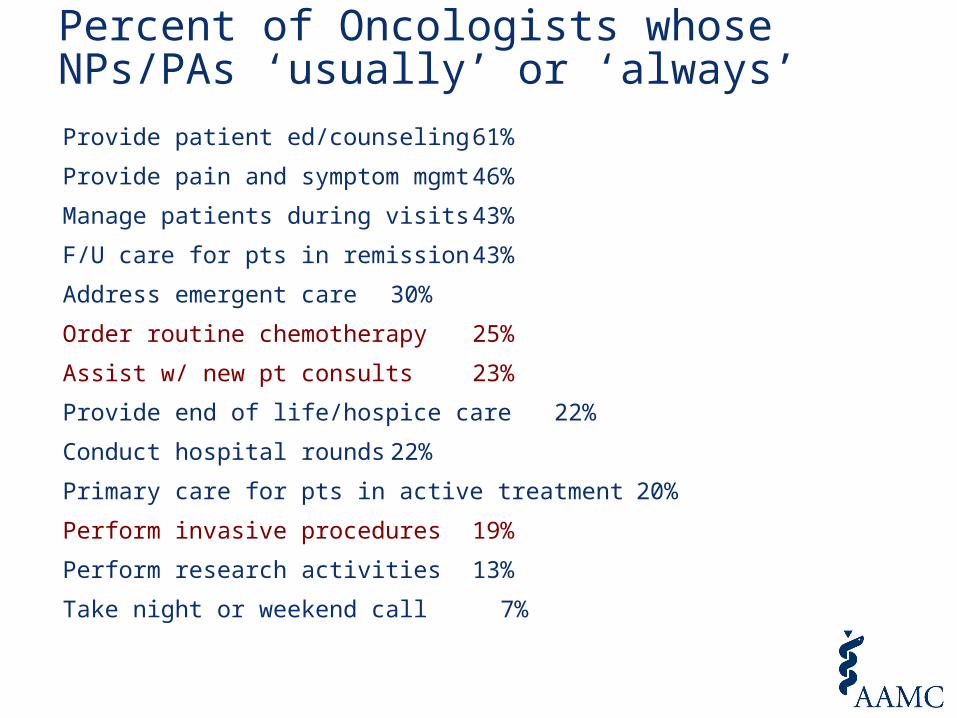
Percent of Oncologists whose NPs/PAs ‘usually’ or ‘always’
Provide patient ed/counseling 61%
Provide pain and symptom mgmt 46%
Manage patients during visits 43%
F/U care for pts in remission 43%
Address emergent care 30%
Order routine chemotherapy 25%
Assist w/ new pt consults 23%
Provide end of life/hospice care 22%
Conduct hospital rounds 22%
Primary care for pts in active treatment 20%
Perform invasive procedures 19%
Perform research activities 13%
Take night or weekend call 7%
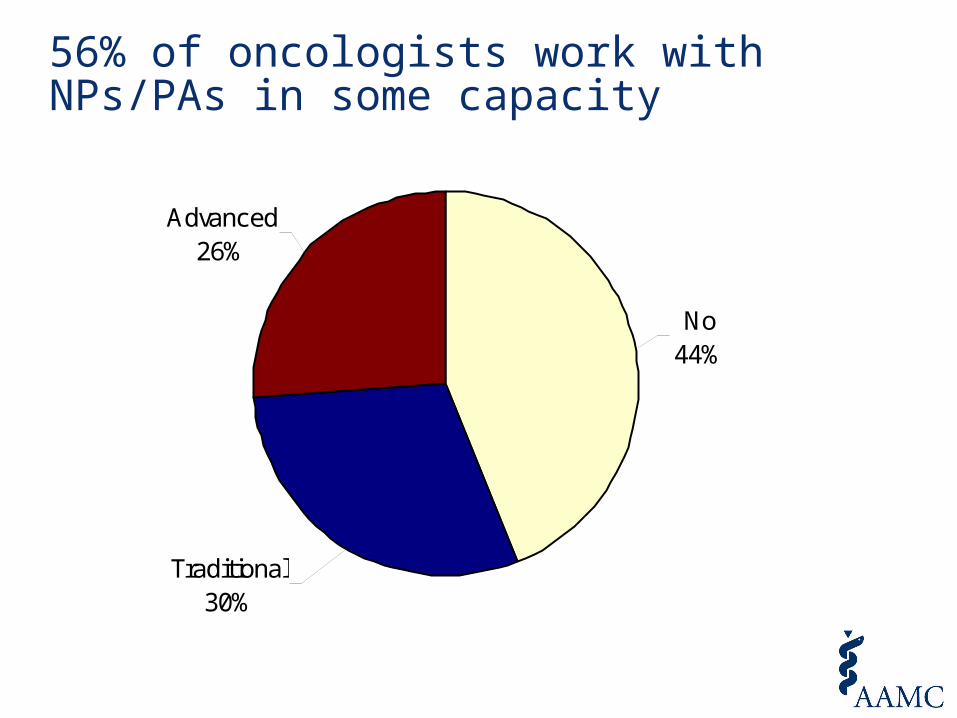
56% of oncologists work with NPs/PAs in some capacity
No44%
Traditional30%
Advanced26%
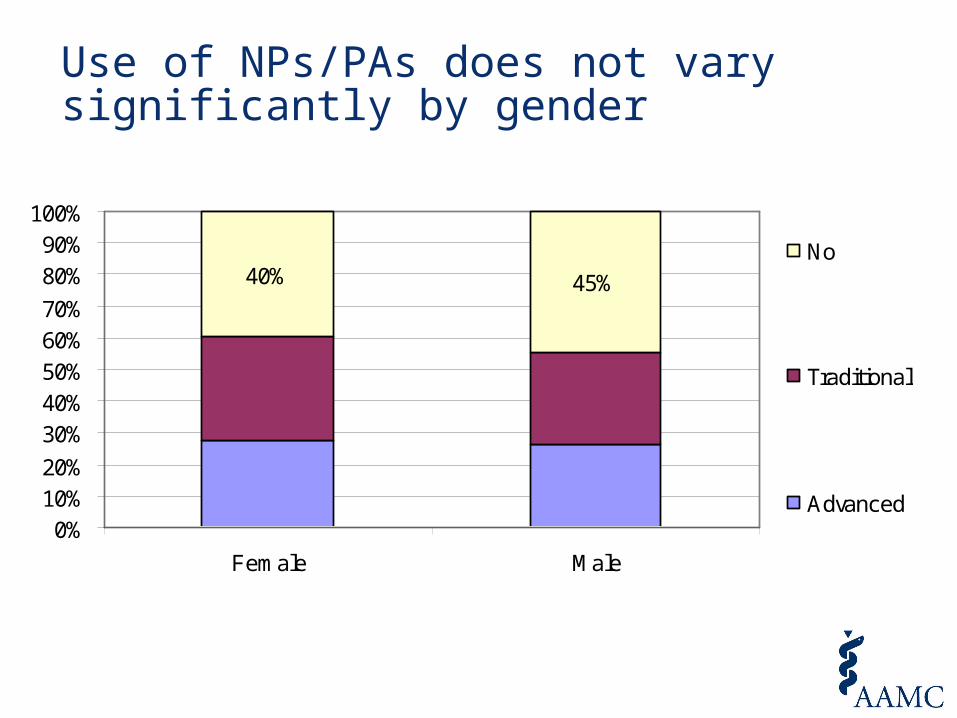
Use of NPs/PAs does not vary significantly by gender
40% 45%
0%10%20%
30%40%50%60%70%
80%90%
100%
Female Male
No
Traditional
Advanced
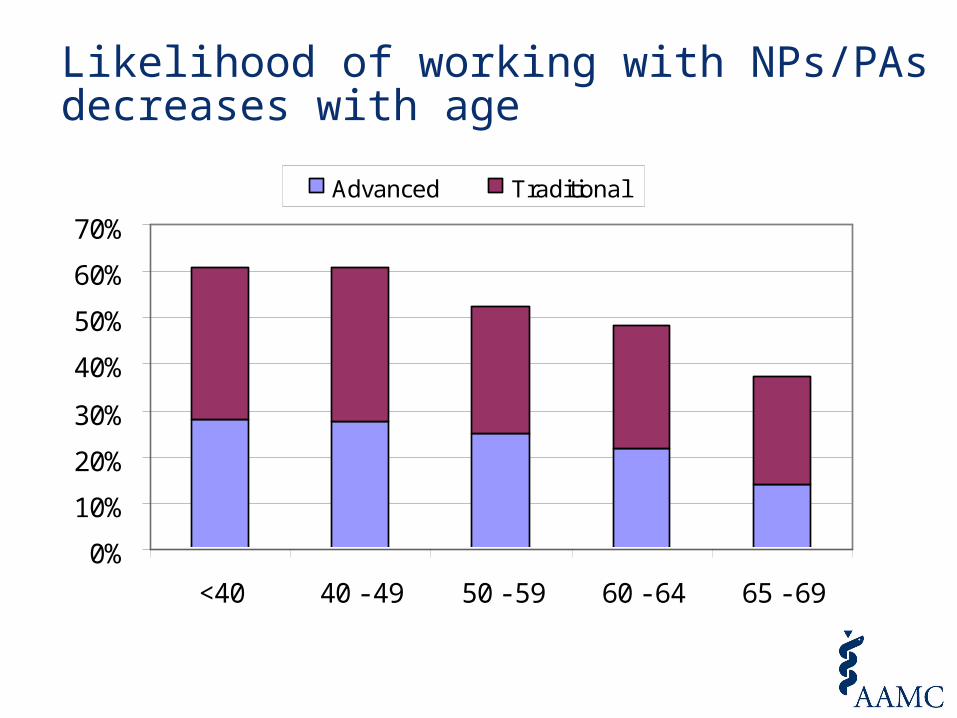
Likelihood of working with NPs/PAs decreases with age
0%
10%
20%
30%
40%
50%
60%
70%
<40 40 - 49 50 - 59 60 - 64 65 - 69
Advanced Traditional

72% of academics work with NPs/PAscompared to 46% of private practice oncologists
39%
32%28%
15%
32%
54%
0%
10%
20%
30%
40%
50%
60%
Advanced Traditional No
Pe
rce
nt
of
Ph
ys
icia
ns
Academic Private Practice

NP/PA contribution valued
70% 73%
66%
16%
31%
69%
92%87% 85%
19%
58%
88%
0%
20%
40%
60%
80%
100%
Increasesefficiency
More time oncomplex cases
Contributesprofessionalsatatisfaction
Increases myworkload
Participate inclinical
research
Improvesoverall patient
care
Per
cen
t A
gre
e
Traditional Advanced
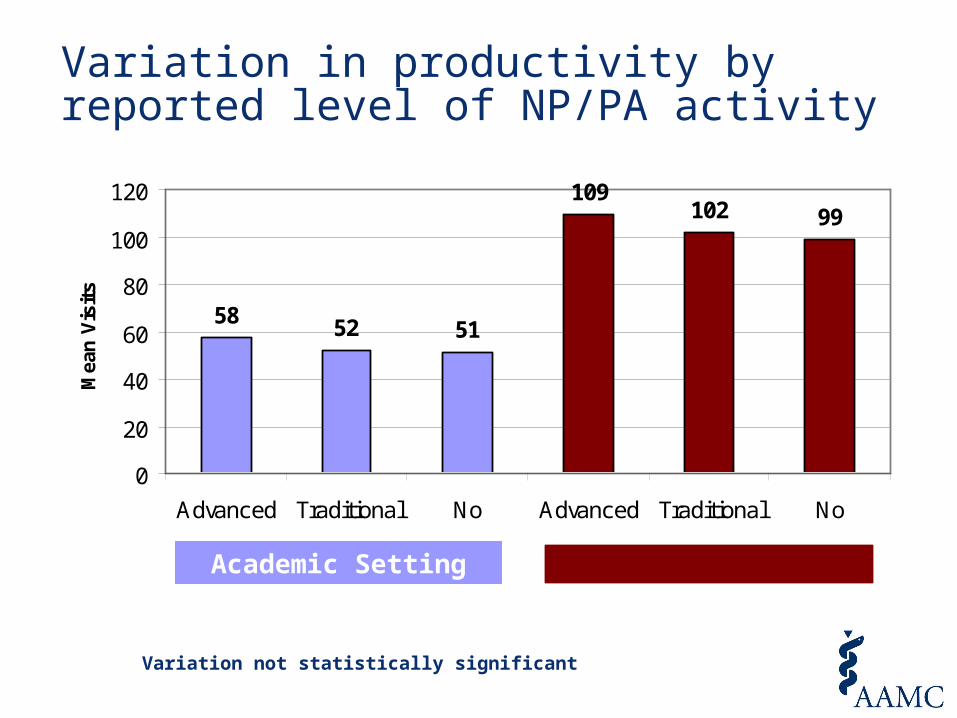
Variation in productivity by reported level of NP/PA activity
58 52 51
109102 99
0
20
40
60
80
100
120
Advanced Traditional No Advanced Traditional No
Mea
n V
isit
s
Private PracticeAcademic Setting
Variation not statistically significant
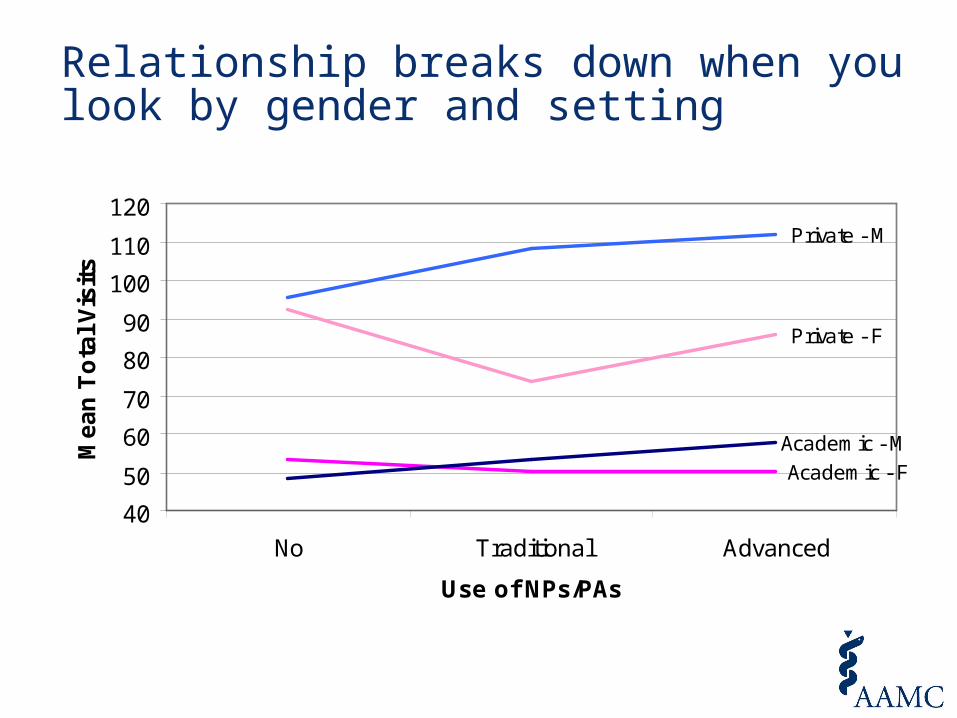
Relationship breaks down when you look by gender and setting
Academic - F
Academic - M
Private - F
Private - M
40
50
60
70
80
90
100
110
120
No Traditional Advanced
Use of NPs/PAs
Me
an
To
tal
Vis
its
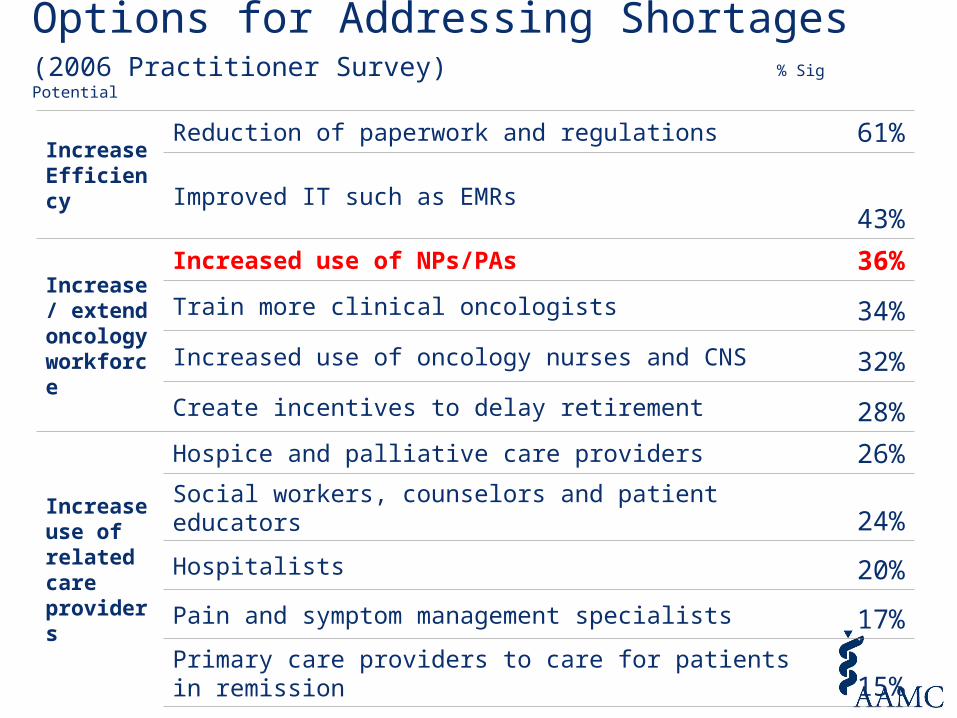
Options for Addressing Shortages (2006 Practitioner Survey) % Sig Potential
Increase Efficiency
Reduction of paperwork and regulations 61%
Improved IT such as EMRs 43%
Increase / extend oncology workforce
Increased use of NPs/PAs 36%
Train more clinical oncologists 34%
Increased use of oncology nurses and CNS 32%
Create incentives to delay retirement 28%
Increase use of related care providers
Hospice and palliative care providers 26%
Social workers, counselors and patient educators 24%
Hospitalists 20%
Pain and symptom management specialists 17%
Primary care providers to care for patients in remission 15%
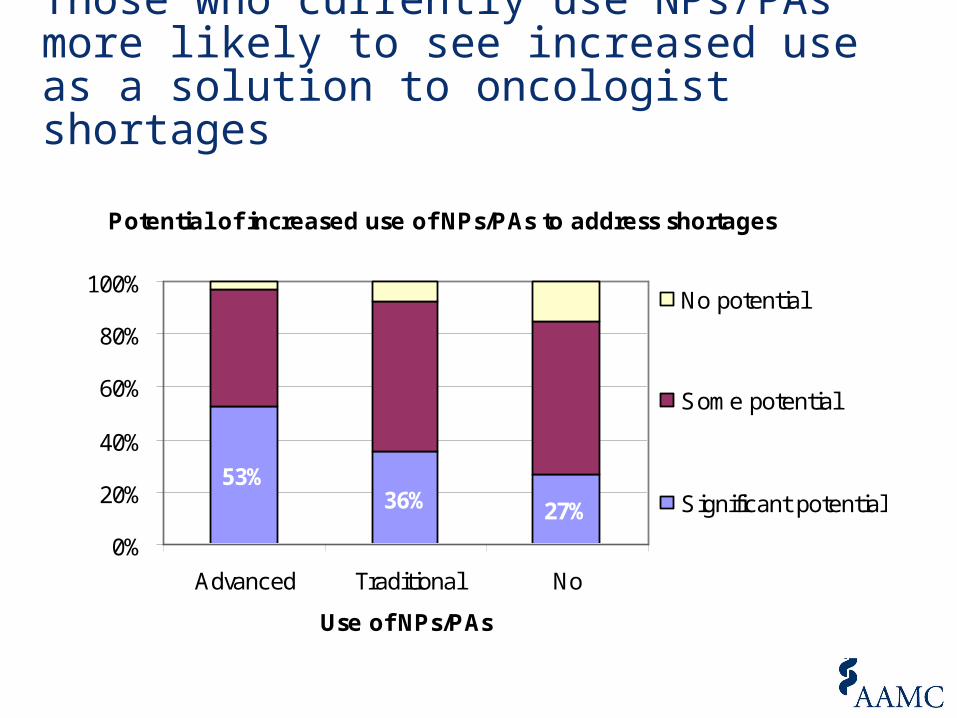
Those who currently use NPs/PAs more likely to see increased use as a solution to oncologist shortages
Potential of increased use of NPs/PAs to address shortages
53%36% 27%
0%
20%
40%
60%
80%
100%
Advanced Traditional No
Use of NPs/PAs
No potential
Some potential
Significant potential
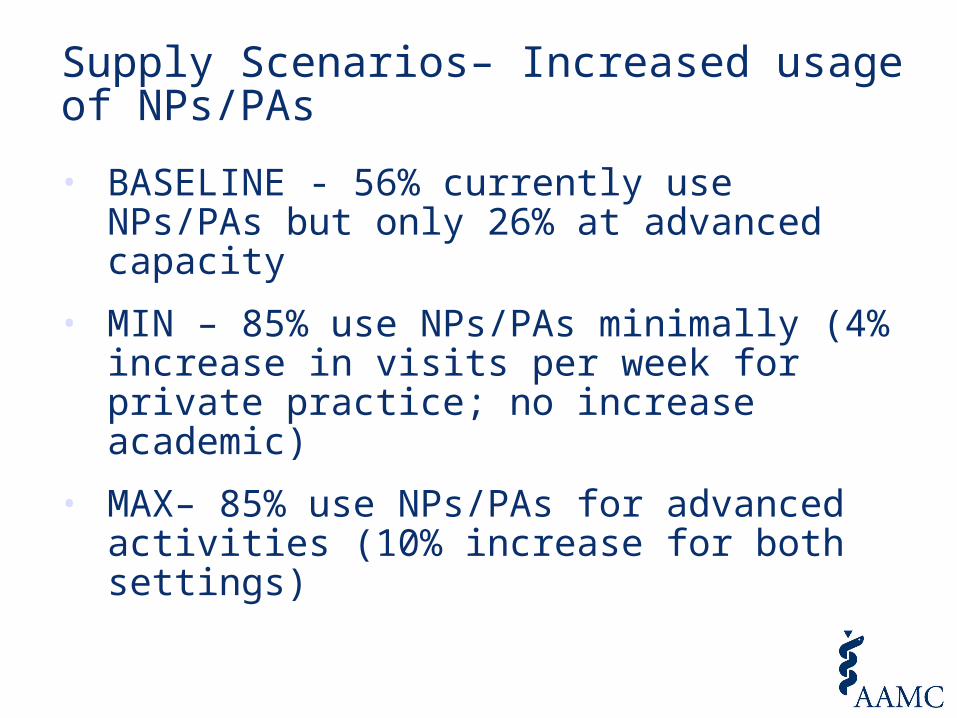
Supply Scenarios– Increased usage of NPs/PAs
• BASELINE - 56% currently use NPs/PAs but only 26% at advanced capacity
• MIN – 85% use NPs/PAs minimally (4% increase in visits per week for private practice; no increase academic)
• MAX– 85% use NPs/PAs for advanced activities (10% increase for both settings)
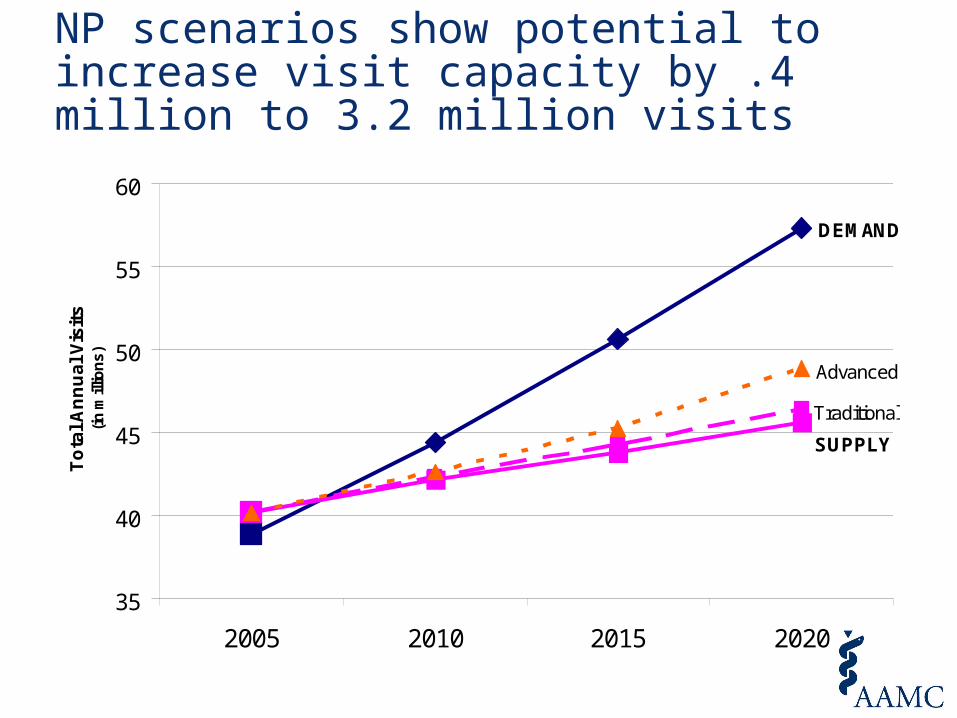
NP scenarios show potential to increase visit capacity by .4 million to 3.2 million visits
DEMAND
SUPPLY
Traditional
Advanced
35
40
45
50
55
60
2005 2010 2015 2020
To
tal
An
nu
al
Vis
its
(i
n m
illio
ns
)

Results from Survey of Physicians Under 50
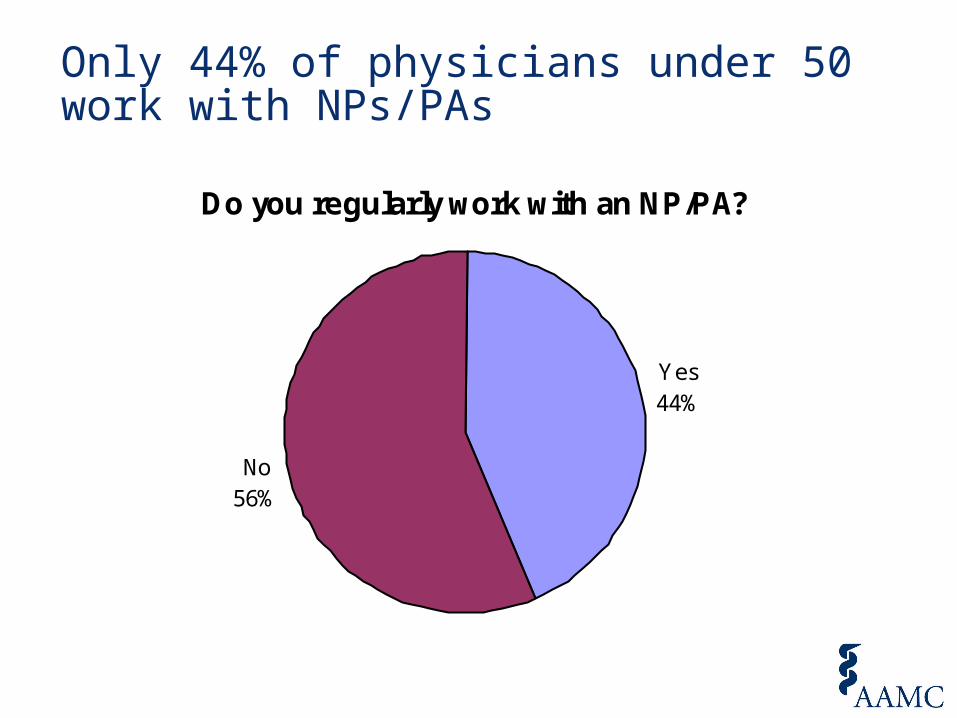
Only 44% of physicians under 50 work with NPs/PAs
Do you regularly work with an NP/PA?
Yes44%
No56%
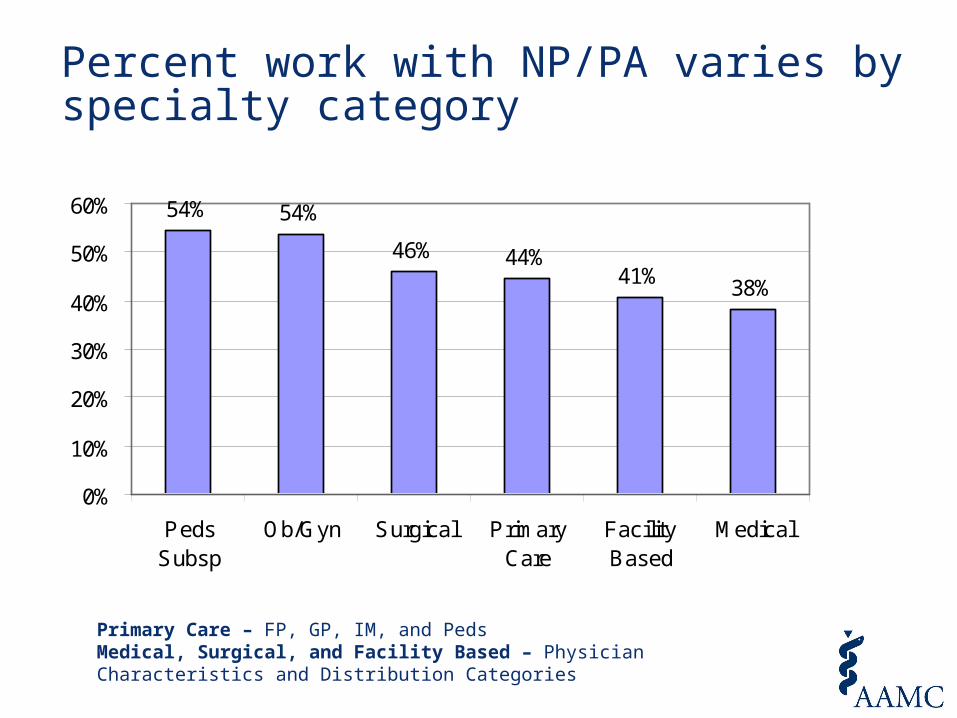
Percent work with NP/PA varies by specialty category
54% 54%
46% 44%41% 38%
0%
10%
20%
30%
40%
50%
60%
PedsSubsp
Ob/Gyn Surgical PrimaryCare
FacilityBased
Medical
Primary Care – FP, GP, IM, and PedsMedical, Surgical, and Facility Based – Physician Characteristics and Distribution Categories
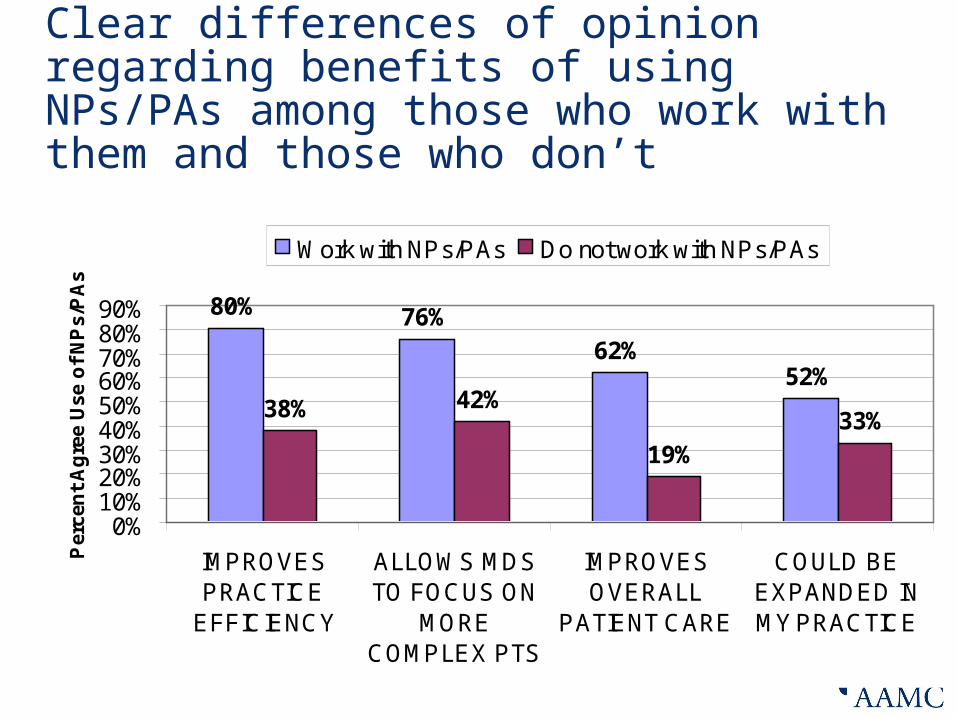
Clear differences of opinion regarding benefits of using NPs/PAs among those who work with them and those who don’t
80% 76%62%
52%38% 42%
19%33%
0%10%20%30%40%50%60%70%80%90%
IMPROVESPRACTICE
EFFICIENCY
ALLOWS MDSTO FOCUS ON
MORECOMPLEX PTS
IMPROVESOVERALL
PATIENT CARE
COULD BEEXPANDED INMY PRACTICE
Per
cen
t A
gre
e U
se o
f N
Ps/
PA
s
Work with NPs/PAs Do not work with NPs/PAs
Conclusions• Oncologists that work with NPs/PAs consistently agree that this improves efficiency and quality without increasing their workload
• Inconclusive that use of NPs/PAs actually improves visit capacity
• Increased use of NPs/PAs could have potential to help address shortages but other solutions will be needed
• Those who do not work with NPs/PAs are less inclined to see the value of their contribution