University of Birmingham Experimental and computational ...
35
University of Birmingham Experimental and computational examination of protein-surface interactions Mallinson, David; Cheung, David; Simionesie, Dorin; Mullen, Alexander ; Zhang, Zhenyu; Lamprou, Dimitrios DOI: 10.1002/jbm.a.35949 License: None: All rights reserved Document Version Peer reviewed version Citation for published version (Harvard): Mallinson, D, Cheung, D, Simionesie, D, Mullen, A, Zhang, Z & Lamprou, D 2016, 'Experimental and computational examination of protein-surface interactions', Journal of Biomedical Materials Research. Part A . https://doi.org/10.1002/jbm.a.35949 Link to publication on Research at Birmingham portal Publisher Rights Statement: This is the peer reviewed version of the following article: Mallinson D, Cheung DL, Simionesie D, Mullen AB, Zhang ZJ, Lamprou DA. 2016. Experimental and computational examination of anastellin (FnIII1c)–polymer interactions, which has been published in final form at http://dx.doi.org/10.1002/jbm.a.35949. This article may be used for non-commercial purposes in accordance with Wiley Terms and Conditions for Self-Archiving. Confirmed 10/11/2016 General rights Unless a licence is specified above, all rights (including copyright and moral rights) in this document are retained by the authors and/or the copyright holders. The express permission of the copyright holder must be obtained for any use of this material other than for purposes permitted by law. • Users may freely distribute the URL that is used to identify this publication. • Users may download and/or print one copy of the publication from the University of Birmingham research portal for the purpose of private study or non-commercial research. • User may use extracts from the document in line with the concept of ‘fair dealing’ under the Copyright, Designs and Patents Act 1988 (?) • Users may not further distribute the material nor use it for the purposes of commercial gain. Where a licence is displayed above, please note the terms and conditions of the licence govern your use of this document. When citing, please reference the published version. Take down policy While the University of Birmingham exercises care and attention in making items available there are rare occasions when an item has been uploaded in error or has been deemed to be commercially or otherwise sensitive. If you believe that this is the case for this document, please contact [email protected] providing details and we will remove access to the work immediately and investigate. Download date: 03. Dec. 2021
Transcript of University of Birmingham Experimental and computational ...

University of Birmingham
Experimental and computational examination ofprotein-surface interactionsMallinson, David; Cheung, David; Simionesie, Dorin; Mullen, Alexander ; Zhang, Zhenyu;Lamprou, DimitriosDOI:10.1002/jbm.a.35949
License:None: All rights reserved
Document VersionPeer reviewed version
Citation for published version (Harvard):Mallinson, D, Cheung, D, Simionesie, D, Mullen, A, Zhang, Z & Lamprou, D 2016, 'Experimental andcomputational examination of protein-surface interactions', Journal of Biomedical Materials Research. Part A .https://doi.org/10.1002/jbm.a.35949
Link to publication on Research at Birmingham portal
Publisher Rights Statement:This is the peer reviewed version of the following article: Mallinson D, Cheung DL, Simionesie D, Mullen AB, Zhang ZJ, Lamprou DA. 2016.Experimental and computational examination of anastellin (FnIII1c)–polymer interactions, which has been published in final form athttp://dx.doi.org/10.1002/jbm.a.35949. This article may be used for non-commercial purposes in accordance with Wiley Terms andConditions for Self-Archiving.
Confirmed 10/11/2016
General rightsUnless a licence is specified above, all rights (including copyright and moral rights) in this document are retained by the authors and/or thecopyright holders. The express permission of the copyright holder must be obtained for any use of this material other than for purposespermitted by law.
•Users may freely distribute the URL that is used to identify this publication.•Users may download and/or print one copy of the publication from the University of Birmingham research portal for the purpose of privatestudy or non-commercial research.•User may use extracts from the document in line with the concept of ‘fair dealing’ under the Copyright, Designs and Patents Act 1988 (?)•Users may not further distribute the material nor use it for the purposes of commercial gain.
Where a licence is displayed above, please note the terms and conditions of the licence govern your use of this document.
When citing, please reference the published version.
Take down policyWhile the University of Birmingham exercises care and attention in making items available there are rare occasions when an item has beenuploaded in error or has been deemed to be commercially or otherwise sensitive.
If you believe that this is the case for this document, please contact [email protected] providing details and we will remove access tothe work immediately and investigate.
Download date: 03. Dec. 2021

For Peer Review
Experimental and computational examination of protein-
surface interactions
Journal: Journal of Biomedical Materials Research: Part A
Manuscript ID Draft
Wiley - Manuscript type: Original Article
Date Submitted by the Author: n/a
Complete List of Authors: Mallinson, David; University of Strathclyde, Strathclyde Institute of Pharmacy and Biomedical Sciences Cheung, David; National University of Ireland, School of Chemistry Simionesie, Dorin ; University of Birmingham, School of Chemical Engineering Mullen, Alexander; University of Strathclyde, Strathclyde Institute of
Pharmacy and Biomedical Sciences Zhang , Zhenyu Jason; University of Birmingham, School of Chemical Engineering Lamprou, Dimitrios; University of Strathclyde, Strathclyde Institute of Pharmacy and Biomedical Sciences
Keywords: Atomic force microscopy, molecular dynamics, polyurethane, poly (methyl methacrylate), fibronectin
John Wiley & Sons, Inc.
Journal of Biomedical Materials Research: Part A

For Peer Review
Journal of Biomedical Materials Research Part A
1
Experimental and computational examination of protein-surface
interactions
David Mallinson1, David L. Cheung2*, Dorin Simionesie3, Alexander B. Mullen1, Zhenyu J.
Zhang3*, Dimitrios A. Lamprou1,4*
1Strathclyde Institute of Pharmacy and Biomedical Sciences (SIPBS), University of
Strathclyde, 161 Cathedral Street, Glasgow, United Kingdom.
2School of Chemistry, National University of Ireland, Galway, University Road, Galway,
Ireland.
3School of Chemical Engineering, University of Birmingham, Edgbaston, Birmingham,
United Kingdom.
4EPSRC Centre for Innovative Manufacturing in Continuous Manufacturing and
Crystallisation (CMAC), University of Strathclyde, Glasgow, United Kingdom.
*Corresponding Authors. E-mails: [email protected], [email protected],
[email protected], Tel.: +44(0)1415484968
Keywords: Atomic force microscopy, molecular dynamics, polyurethane, poly (methyl
methacrylate), fibronectin.
Abstract: Using a combination of experimental and computational approaches, the
interaction between anastellin, a recombinant fragment of fibronectin, and representative
biomaterial surfaces has been examined. The molecular interaction was directly quantified by
atomic force microscope (AFM) based force spectroscopy, complemented by adsorption
Page 1 of 33
John Wiley & Sons, Inc.
Journal of Biomedical Materials Research: Part A
123456789101112131415161718192021222324252627282930313233343536373839404142434445464748495051525354555657585960

For Peer Review
Journal of Biomedical Materials Research Part A
2
measurements using quartz crystal microbalance (QCM). It was found that the anastellin
molecules facilitates a stronger adhesion on polyurethane films (72.0 pN nm-1) than on poly
(methyl methacrylate) films (68.6 pN nm-1). This is consistent with the adsorption
measurements of anastellin on the two polymeric surfaces, observed by QCM. Molecular
dynamics simulations of the behaviour of anastellin on polyurethane in water solution were
performed to rationalise the experimental data, and show that anastellin is capable of rapid
adsorption to PU while its secondary structure is stable upon adsorption in water.
INTRODUCTION
In order to design medical devices that are exposed to physiological environments with
prolonged service life and enhanced biocompatibility, it is vital to understand how biological
objects interact with the surface of the engineered component, and the underlying biophysical
mechanisms. For the development of biomaterials, the predominant mechanisms include the
adsorption of proteins which is the initial stage for cell adhesion. 1 One of the major proteins
that significantly affects the compatibility of biomaterials used intracorporeally is fibronectin
(Fn). This is an important extracellular protein that exists in a variety of forms (e.g.
circulating plasma, tissue and cellular). 2 It is made up of three types of domain (I, II and III).
Types I and II are stabilised with disulphide bonds while type III fibronectin domains (FnIII)
are capable of unfolding under tension. This can expose hidden, cryptic binding sites such as
the Arg-Gly-Asp (RGD) sequence found in the tenth fibronectin type III domain (FnIII10)
and the Pro-His-Ser-Arg-Asn (PHSRN) sequence in the ninth fibronectin type III domain
(FnIII9). The RGD sequence allows binding to cell-bound integrin receptors, such as α5β1, to
enable adhesion of cells to the extracellular matrix while the PHSRN sequence has a
synergistic effect on this binding.3 The RGD peptide sequence has been incorporated onto
Page 2 of 33
John Wiley & Sons, Inc.
Journal of Biomedical Materials Research: Part A
123456789101112131415161718192021222324252627282930313233343536373839404142434445464748495051525354555657585960

For Peer Review
Journal of Biomedical Materials Research Part A
3
biomaterials, 4-6 in its linear form, or cyclic forms, or as part of a larger fragment in order to
improve aspects of biocompatibility such as osseointegration. 4 Use of a protein fragment
offers advantages over whole Fn such as improved stability and increased density of desired
sequences on the surface. 7
Another area of Fn that has been shown to elicit potentially useful interactions is the C-
terminal fragment of the first FnIII domain (FnIII1c), known as anastellin, which has 76
amino acid residues. 8-12 The FnIII1 domain has been identified as a region associated with
matrix formation by Fn-Fn interactions. 13 When mixed with whole Fn molecules, anastellin
can create a different form of Fn known as superfibronectin which is adept at supporting cell
adhesion and spreading. 10,14 Anastellin and superfibronectin have been reported to contribute
towards anti-tumour, anti-metastatic, and anti-angiogenic performance through a mechanism
that involves extracellular signal-regulated kinases (ERK) and a decrease in cyclin D1, cyclin
Al, and cyclin-dependent kinase 4 (cdk4). 9,15-18
Upon adsorption to solid surfaces, the conformation of Fn at the interface appears to depend
largely on the characteristics of the surface. Proteins tend to adopt an extended conformation
on hydrophilic surface but a compact, globular conformation on hydrophobic surfaces. 19,20
Furthermore, other factors such as surface chemistry and topography have been found to play
an important role. 21,22 Hydrophobic surfaces adsorb more Fn than hydrophilic surfaces, 19 the
globular conformation adapted could accommodate more molecules and hence a greater
packing density. 23 The change of conformation to an elongated form is important since it can
expose the aforementioned binding sites such as RGD and PHSRN and allow matrix
formation and cell attachment. Interaction between protein and solid surface and the
consequent confirmation can be examined with a wide range of experimental approaches
including atomic force microscopy (AFM), quartz crystal microbalance, fluorescence
Page 3 of 33
John Wiley & Sons, Inc.
Journal of Biomedical Materials Research: Part A
123456789101112131415161718192021222324252627282930313233343536373839404142434445464748495051525354555657585960

For Peer Review
Journal of Biomedical Materials Research Part A
4
resonance energy transfer (FRET), measuring the adsorption amount of labelled Fn, and
enzyme-linked immunosorbent assays (ELISA). 19,20,24,25
With the readily controlled molecular structure, chain length, and functional groups,
polymers have been widely used as biomaterials. Examples include polyurethane (PU) for
ureteral catheters, 26 poly (methyl methacrylate) (PMMA) as bone cement, 27
polytetrafluoroethylene (PTFE) as artificial heart valves and vascular grafts, 28 and ultra-high
density polyethylene in joint replacement implants. Palacio et al. 29,30 have investigated the
adhesion of whole Fn, bovine serum albumin and collagen to PMMA surfaces as well as di-
and triblock copolymers of PMMA with poly (2-hydroxyethyl methacrylate) (PHEMA)
and/or poly (acrylic acid) (PAA). They used AFM in force-volume mode with probes coated
with silane and protein, and reported that the PMMA regions of the polymer had lower
adhesion than PAA regions due to weaker interactions between the polymer and hydrophobic
regions of Fn. The adhesive force between Fn and PMMA was reduced from 1.0 nN to 0.7
nN as the pH of the surrounding medium is decreased from 7.4 to 6.2. It is possible that the
protein is less negatively charged at lower pH so that the electrostatic repulsion from the acid
groups of the polymer is reduced. Hydrophobicity ought to be an indicator of adhesion since
it would affect the repulsive force between the protein and the polymer.
For a number of years, a molecular simulation approach has been used to investigate protein-
surface adsorption, 31 giving significant insight into the mechanism of adsorption and the
factors that drive this. Due to its relevance to biomaterials 1 the adsorption of a number of
fibronectin modules onto surfaces have been investigated. 32-34 These have shown that
fibronectin adsorption is relatively non-specific, with it readily adsorbing onto organic, 33
inorganic, 34 and graphite surfaces. 32
Page 4 of 33
John Wiley & Sons, Inc.
Journal of Biomedical Materials Research: Part A
123456789101112131415161718192021222324252627282930313233343536373839404142434445464748495051525354555657585960

For Peer Review
Journal of Biomedical Materials Research Part A
5
In the present work, adhesion and adsorption of anastellin on to two polymeric films, PMMA
and PU, were measured by AFM and QCM. Influences of both chemical composition and
hydrophobicity of the polymeric surfaces on the protein-surface interaction were examined.
The experimental results were then compared with the results of molecular dynamics
simulations.
MATERIALS AND METHODS
Materials
Poly (methyl methacrylate) (PMMA; MW 94,600) was purchased from Acros Organics.
Polyurethane (PU) was purchased from Fluka. The FnIII1c protein fragment, phosphate
buffered saline (PBS; pH 7.4) tablets, tetrahydrofuran (THF; ≥ 99.9 %), ethylene glycol (EG;
99.8 %), diiodomethane (DIM; 99 %) and ethanol (≥ 99.8 %) were purchased from Sigma.
Spin Coating
Silica wafer (SW) was cleaned with deionised water, followed by 70 % ethanol and finally
with THF in order to sterilise the surface and remove both water-soluble and organic
contaminants. Polymers were dissolved in THF (2 % w/v). Consequently, the polymer
solution was spin coated onto silica wafer at 2,000 rpm for 30 s with a Laurell WS-400-6NPP
spin coater as per Mallinson et al. 35
Contact Angle Goniometry
The advancing contact angles (θA) of three solvents (deionised water (DW), ethylene glycol
(EG) and diiodomethane (DIM)) on the two polymer surfaces were measured in order to
calculate the surface energy (γs) and surface energy components of the surfaces. As per
Mallinson et al. 35 small drops of DW (18.2 MΩ; surface tension (γL) 72.8 mN m-1 at 20 °C),
Page 5 of 33
John Wiley & Sons, Inc.
Journal of Biomedical Materials Research: Part A
123456789101112131415161718192021222324252627282930313233343536373839404142434445464748495051525354555657585960

For Peer Review
Journal of Biomedical Materials Research Part A
6
EG (γL 48.0 mN m-1 at 20 °C) and DIM (γL 50.8 mN m-1 at 20 °C) were placed on the surface
with a needle, followed by measuring both the left and right contact angles with a Krüss
DSA30B contact angle goniometer (CAG). At least 2 repeats were made for each surface
with 3 drops per sample, resulting in at least 12 measurements per sample. Using these
contact angle values, the surface energies were calculated using a Visual Basic application
developed by Lamprou et al, 36 based on the formula proposed by Good and Oss. 37
Circular Dichroism
Circular dichroism (CD) was performed in order to determine whether the protein fragment
retained the expected structure when reconstituted. The protein sample was dissolved in PBS
solution (pH 7.4) at 200 µg mL-1. Spectra were read with a Chirascan CD spectrophotometer
(Applied Photophysics) in the wavelength range 190-280 nm, with step size of 1 nm and
bandwidth of 1 nm, using a quartz cuvette with a path length of 0.1 mm (Hellma). Three
spectra were averaged and data were processed with Chirascan Viewer and with Microsoft
Excel.
Atomic force microscopy
AFM measurements were performed in ambient using a Bruker Multimode 8 AFM equipped
with a Nanoscope Controller V and SNL-10 probes (cantilever C: nominal spring constant
0.24 N m-1 and nominal resonant frequency 56 kHz). Cantilevers were silanised to allow
protein functionalisation by submerging in 2 mM APTES in toluene for 5 min as per Couston
et al. 38 The cantilevers were subsequently washed with toluene and deionised water in order
to remove unbound silane. The FnIII1c protein fragment was added by incubating the tip in a
drop of 1 mg mL-1 protein solution (in PBS pH 7.4) for 10 min followed by a thorough
rinsing with deionised water to remove unbound protein. Each polymer surface was scanned
4 times with each AFM probe before and after protein functionalisation. This was done with
Page 6 of 33
John Wiley & Sons, Inc.
Journal of Biomedical Materials Research: Part A
123456789101112131415161718192021222324252627282930313233343536373839404142434445464748495051525354555657585960

For Peer Review
Journal of Biomedical Materials Research Part A
7
two different probes. For each of the AFM images approximately 160 curves were chosen at
random from each of the force-volume images (20 curves x 4 areas x 2 probes). Deflection
sensitivity was calibrated with a sapphire reference sample and the tip radius was determined
with a PA01 spiked reference sample (Mikromasch). Ramps were made over 1 × 1 µm
squares.
Surface roughness was determined using images captured using unfunctionalised probes in
PeakForce-Quantitative Nanomechanical (PF-QNM) mode. Images were analysed with
Bruker Nanoscope Analysis version 1.5 to view force curves and calculate surface roughness.
Adhesion values were extracted from the ramps using an in-house Python script. Adhesive
forces were then normalised for the effect of tip radius by dividing by tip radius in
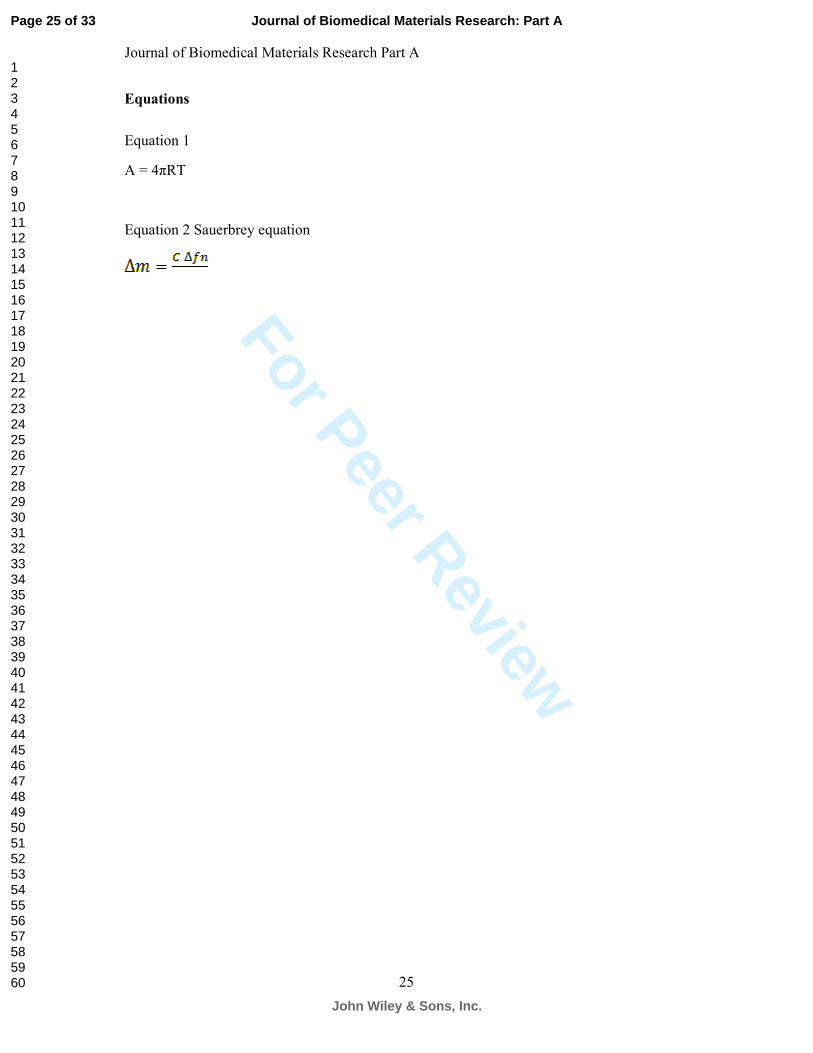
accordance with equation 1 by Sugawara et al. 39
A = 4πRT (Eq.1)
where A is the corrected adhesion, R is tip radius and T is surface tension of the medium.
Quartz Crystal Microbalance
Quartz crystal microbalance (QCM) is a technique that uses a mass sensor 40-42 to measure the
adsorption of biopolymers 43,44 or synthetic electrolytes 45 from liquid and allows observation
of not only the adsorption kinetics and adsorbed mass but also of the viscoelastic properties
of adsorbed polymer layers at the solid liquid interface. 23,46,47 The technique relies upon the
resonant frequency of a quartz crystal. A frequency shift (∆f) will be induced by any change
in adsorbed mass, as ∆f is related to the adsorbed mass per unit surface ∆m, by a linear
relationship known as the Sauerbrey equation (Eq. 2).
(Eq. 2)
Page 7 of 33
John Wiley & Sons, Inc.
Journal of Biomedical Materials Research: Part A
123456789101112131415161718192021222324252627282930313233343536373839404142434445464748495051525354555657585960

For Peer Review
Journal of Biomedical Materials Research Part A
8
where n is the overtone number (n = 1 in the present case) and C is a constant that describes
the sensitivity of the device the changes in mass. Additionally, the exponential decay of the
oscillation amplitude, D, is recorded which can reveal information about the viscoelastic
properties of the adsorbed layer.
PU and PMMA thin films were formed on gold coated AT-cut quartz crystals by spin-
coating, by the same protocol as on the Si wafers, and a SiO2 crystal was used to replicate the
silica wafer surface. All crystals were purchased from Testbourne Ltd. The crystals were
placed in a home-built quartz crystal microbalance and all measurement were taken at room
temperature. For adsorption measurements, the QCM chamber was flooded with HPLC-grade
water solution and left until the frequency stabilises to an equilibrium state at the liquid/solid
interface may be achieved. The protein fragment was initially dissolved in PBS buffer (pH
7.4) with a concentration of 1.0 mg mL-1, and further diluted by HPLC-grade water to a
concentration of 0.025 mg mL-1. The HPLC-water in the QCM chamber was then replaced by
the protein solution while the change in frequency and dissipation was recorded. A
representative QCM adsorption result is presented in Fig. 1 where changes in frequency and
corresponding adsorbed amount are shown.
Fig. 1 Second axis graphs with frequency and mass.
Molecular dynamics
The simulated system consisted of a single anastellin molecule, a slab of PU, water and ions.
The PU surface was constructed from slab of crystalline PU, consisting of 48 chains (three
layers of sixteen), with each chain containing two monomer units. The slab was constructed
Page 8 of 33
John Wiley & Sons, Inc.
Journal of Biomedical Materials Research: Part A
123456789101112131415161718192021222324252627282930313233343536373839404142434445464748495051525354555657585960

For Peer Review
Journal of Biomedical Materials Research Part A
9
using the crystal structure for the trans-trans-dicyclohexylmethane 4,4’-diisocynate (HMDI)
monomer determined by Nigar et al. 48 An energy minimisation followed by short (20 ps)
NVT and NpT simulations of the slab in contact with a vacuum were performed. The
remainder of the simulation box was filled with water and an energy minimization and short
NVT run were performed on the resulting system. The structure of the surface was then held
fixed for the remainder of the simulations.
The structure of anastellin was taken from RCSB (accession code: 1Q38). Initially the protein
centre-of-mass is placed at z = 40 Å, approximately 20 Å from the PU surface. Four different
initial orientations were used: Arg-down where the cluster of arginine residues was orientated
towards the surface; Arg-up where the cluster of arginine residues orientated away from the
surface; N-down where the N-terminus pointed towards the surface and C-down where the C-
terminus pointed towards the surface. Cl- and Na+ ions are added to neutralise the +5e charge
on the protein and simulate different salt conditions. The system is periodic in the x and y
directions and has repulsive Lennard-Jones walls in the z-direction.
The protein was modelled using the Charmm27 force field (with CMAP corrections), 49 the
Charmm Generalised Force Field 50 was used to model the PU surface, and water was
modelled using the Charmm-variant of TIP3P water (with van der Waals interaction sites on
the hydrogen atoms). All simulations were performed at 298 K, with the velocity rescaling
algorithm of Bussi et al. 51 used to control the temperature. For each starting orientation and
salt concentration simulations of 100 ns were performed, with a timestep of 2 fs. Bonds
involving hydrogen atoms were constrained using the LINCS algorithm 52 and the water
geometry was held fixed using the SETTLE algorithm. 53 Long-range electrostatics were
modelled using particle-mesh Ewald summation 54 with a real space cut-off of 10 Å and a
reciprocal space grid spacing of 0.16 Å-1. Van der Waals interactions were truncated at 10 Å.
Page 9 of 33
John Wiley & Sons, Inc.
Journal of Biomedical Materials Research: Part A
123456789101112131415161718192021222324252627282930313233343536373839404142434445464748495051525354555657585960

For Peer Review
Journal of Biomedical Materials Research Part A
10
The simulations were performed using the Gromacs MD package, version 4.6.3. 55 Standard
Gromacs tools were used to set up and analyse the simulations.
Statistical Analysis
Statistical analysis was performed in Microsoft Excel, Python and Minitab 17. A significance
level of 5 % was chosen. Significance between adhesive forces under different conditions
were determined with a one-way ANOVA with a Tukey test.
RESULTS AND DISCUSSION
Contact Angle Goniometry and Surface Energies
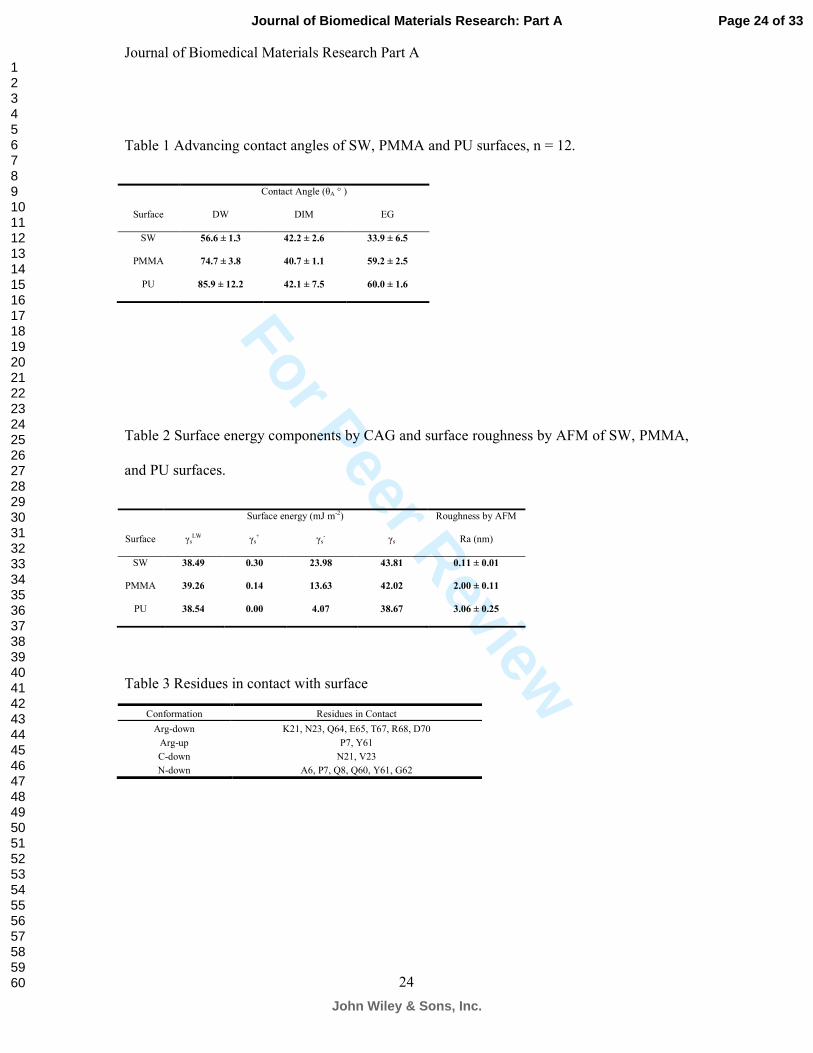
The contact angles of water on all substrates used are presented in Table 1 and agree well
with the literature values for PMMA (74 ° 56 and 69 ° 29), PU (85.1 ° 35) and silica wafer (57.9
° 35). From the chemical structures of PU and PMMA, it can be estimated that PMMA would
be more hydrophobic since displays a greater frequency of lone electron pairs. The surface
energies and surface energy components for all the surfaces are shown in Table 2. The Ra
values (Table 2), based on the surface topography images collected with AFM, show that the
films are smooth – 2.0 ± 0.1 nm and 3.1 ± 0.3 nm for PMMA and PU respectively. This
suggests that the adsorption of Fn 57 and water contact angle 35 are not affected by surface
roughness.
Table 1 Advancing contact angles of SW, PMMA and PU surfaces, n = 12.
Table 2 Surface energy components by CAG and surface roughness by AFM of SW, PMMA, and PU surfaces.
Page 10 of 33
John Wiley & Sons, Inc.
Journal of Biomedical Materials Research: Part A
123456789101112131415161718192021222324252627282930313233343536373839404142434445464748495051525354555657585960
For Peer Review
Journal of Biomedical Materials Research Part A
11
Circular Dichroism
The negative maximum at 218 nm (Fig. 2) suggests anti-parallel beta sheets 58 as is expected
for the protein fragment in its native conformation as imaged by Briknarova et al 59 with
NMR spectroscopy.
Fig. 2 Circular dichroism (CD) spectrum of FnIII1c.
Atomic Force Microscopy
Anastellin functionalisation increases adhesion on all surfaces tested (Fig. 3). This may be
partly due to the protein functionalisation process possibly adding a small layer of crystals
from the PBS as well as the intended protein fragment. Such increases in tip radius do not
appear to be the only factor since the differences between the PMMA (16.8 % increase) and
PU (12.5 % increase) values are greater than those between the silica values (48.2 %
increase). Since tip radius is accounted for, the difference between the polymers and the
APTES-functionalised and protein-ATPES-functionalised probes is likely due to hydrophilic-
hydrophobic interactions between protein fragment and elements of the polymer chains as
found by Palacio et al. with the interactions between Fn and PMMA and poly (acrylic acid)
(PAA). 29 It appears that the adhesion of the anastellin-functionalised probes to the PU films
was greater than to PMMA films (data not shown), contrary to previous work. This could be
at least partly due to the fact that while Palacio et al.’s 29 experiments were performed under
liquid these were performed in air at ambient humidity reducing the role of hydrophilic-
hydrophobic interactions.
Page 11 of 33
John Wiley & Sons, Inc.
Journal of Biomedical Materials Research: Part A
123456789101112131415161718192021222324252627282930313233343536373839404142434445464748495051525354555657585960

For Peer Review
Journal of Biomedical Materials Research Part A
12
Fig. 3 Difference in adhesion force by surface between silanised probes (APTES) and protein-functionalised probes (anastellin). All differences are significant.
Quartz crystal microbalance
Fig. 4 Density of anastellin on SiO2, PU and PMMA surfaces.
Fig. 4a shows a representative measurement of protein adsorption on PMMA, in which both
frequency and the corresponding mass change are presented as a function of time. It is clear
that upon the introduction of protein solution, the mass at the already equilibrated polymer-
buffer solution interface is increased, which confirms the adsorption of protein on the
polymeric film. And the adsorption amounts of the protein (the changed frequency) on three
different surfaces are compared in Fig. 4b. It was found that protein adsorbed the most on the
silica surface, which is consistent with the AFM measurements where strong adhesion
between protein and silica surface was observed. The PU surface shows a higher adsorption
than the PMMA albeit the relative broad error bar, which agrees with the adhesion results.
The increase in experimental error between silica and the polymer coated surfaces can be
attributed to the increased surface roughness on the polymer thin films present as proven in
the contact angle experiments.
Page 12 of 33
John Wiley & Sons, Inc.
Journal of Biomedical Materials Research: Part A
123456789101112131415161718192021222324252627282930313233343536373839404142434445464748495051525354555657585960
For Peer Review
Journal of Biomedical Materials Research Part A
13
Molecular dynamics
The adsorption mechanism and adhesion of anastellin to the polymer surfaces required
further investigation by molecular dynamics. Due to high adhesion in the AFM studies and
high adsorption in the QCM studies PU was selected for these further studies.
Independent of starting orientation the protein adsorbs onto PU surface within 100 ns,
however, the equilibrium protein-surface separation and orientation depend on the initial
configuration (Fig. 5). Starting from the Arg-down configuration the protein adsorbs rapidly
onto the surface with little change in the orientation (the protein lies parallel to the surface
across the entire simulation). In this case the final protein centre of mass position is ~32 Å,
which is comparable to the width of the PU layer plus half the protein width. For the other
starting configurations, adsorption typically takes longer and often involves transient contacts
between the surface and protein before permanent adsorption. Additionally, the final
separation between the protein centre-of-mass and surface is substantially larger, suggesting
that in these cases the bulk of the protein lies further from the surface. This can be seen
through the protein orientation. In particular, when starting from the Arg-up configuration the
protein reorients so the N-terminus is towards the surface, so the final orientation of the
protein in this case is close to that found form starting in the N-down conformation. For the
C-down starting conformation, for most of the simulation the protein lies normal to the
surface with the C-terminus pointing down (θ ~180 °) but slow reorientations of the protein
are evident, notably towards the end of the simulation.
Fig. 5 Protein centre-of-mass position (top) and orientation (bottom) for no salt simulations. Simulations starting in the Arg-down, Arg-up, C-down, and N-down conformations are denoted by black, red, green, and blue lines respectively.
Page 13 of 33
John Wiley & Sons, Inc.
Journal of Biomedical Materials Research: Part A
123456789101112131415161718192021222324252627282930313233343536373839404142434445464748495051525354555657585960
For Peer Review
Journal of Biomedical Materials Research Part A
14
Fig. 6 Simulation snapshots showing adsorption of anastellin on to polyurethane surface. (a) Protein in Arg-down starting configuration at (left to right) t = 0 ns, 13 ns, 25 ns, 47 ns, 50 ns, and 100 ns. (b) Protein in Arg-up starting configuration at (left to right) t = 0 ns, 5 ns, 10 ns, 48 ns, 55 ns, and 100 ns. (c) Protein in N-down starting configuration at (left to right) t = 0 ns, 1 ns, 15 ns, 20 ns, 50 ns, and 100 ns. (d) Protein in C-down starting configuration at (left to right) t = 0 ns, 1 ns, 10 ns, 27.5 ns, 47 ns, and 100 ns. Residues involved in adsorption (see text) are highlighted.
Qualitative information on protein adsorption may be found from viewing simulation
snapshots. For the Arg-down conformation (Fig. 6), these show the rapid adsorption of the
protein onto the PU surface, with little subsequent change to either the protein structure or
orientation. From the Arg-up conformation, the protein initially reorients itself in solution so
that the N-terminus is directed towards the surface (t = 5 ns), followed by attachment to the
surface through this region. While adsorbed on the surface, the protein can slowly reorient.
Similarly, when the protein is initially placed in the N-down conformation, the protein’s N-
terminus rapidly adsorbs onto the surface (t = 1 ns). For the C-down conformation the protein
attaches through the C-terminus (t = 10 ns) but more slowly than for N-down conformation
(whereas the N-down conformation attached to the surface after only 1 ns the C-down
conformation is still in bulk water at this time). Compared to the N-down conformation the
protein appears to have greater orientational freedom, which may also be seen from the
variation in protein angle over time. While the initial attachment is through the residues at the
extreme end of the C-terminus, this changes towards the end of the simulation, with residues
at the C-terminus end of the beta-sheet coming into contact with the surface.
Page 14 of 33
John Wiley & Sons, Inc.
Journal of Biomedical Materials Research: Part A
123456789101112131415161718192021222324252627282930313233343536373839404142434445464748495051525354555657585960

For Peer Review
Journal of Biomedical Materials Research Part A
15
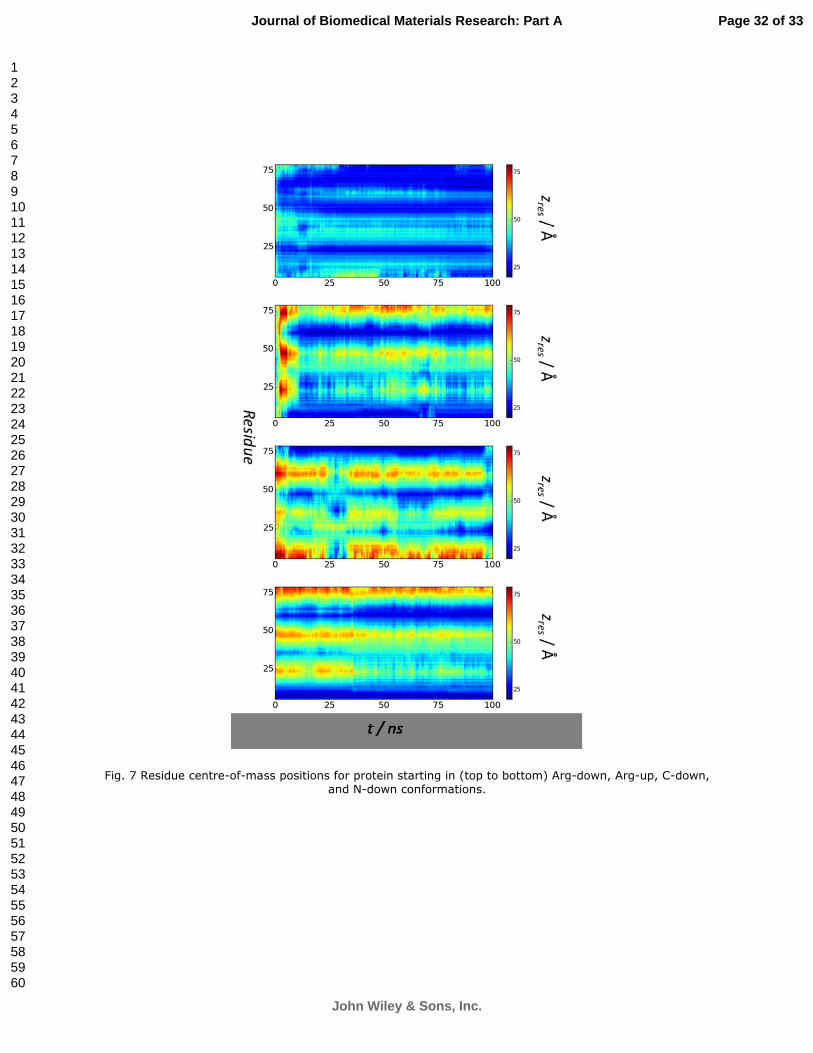
Fig. 7 Residue centre-of-mass positions for protein starting in (top to bottom) Arg-down, Arg-up, C-down, and N-down conformations.
The different starting orientations lead to attachment through different regions of the protein.
This may be seen through considering the centre-of-mass positions of the individual residues
(Fig. 7). Apart from the Arg-down conformation, in which most of the residues lie close to
the surface, only small numbers of residues are typically in contact with the surface. For both
Arg-up and N-down these are the N-terminus and the loop joining the third and fourth beta-
strands (around residue 61). This second region contains a number of residues with
hydrophilic side-chains, which are capable of forming hydrogen bonds with the polar groups
in the PU surface. For the C-down orientation while the initial contact is through the C-
terminal end at the end of the simulation this has detached from the surface with a loop
containing residues 22 to 26 (joining the first and second beta-strands). Again this is a
predominately hydrophilic region, which is consistent with the highest adsorption being
found for hydrophilic surfaces. The residues that are in contact with the surface (taken to be
those with separation between the surface and centres-of-mass less than 5 Å) are shown in
Table 3.
Table 3 Residues in contact with surface
Fig. 8 (a) Secondary structure amounts for (top to bottom) Arg-down, Arg-up, C-down, and N-down starting conformations. Black, red, and green lines denote turn, beta-strand, and random coil respectively. (b) Secondary structure distributions for (top to bottom) Arg-down, Arg-up, C-down, and N-down starting conformations.
Page 15 of 33
John Wiley & Sons, Inc.
Journal of Biomedical Materials Research: Part A
123456789101112131415161718192021222324252627282930313233343536373839404142434445464748495051525354555657585960
For Peer Review
Journal of Biomedical Materials Research Part A
16
Surface adsorption has little effect on the structure of the protein. Shown in Fig. 8a are the
secondary structure compositions for the different starting structures. In all cases the structure
remains predominately beta-strand, with turn and random coil. Apart from N-down, there is a
slight increase in the amount of random coil when the protein adsorbs, with the amount of
turn decreasing. For N-down the amount of random coil and turn remains largely unchanged
across the simulation, in agreement with the CD measurements. The distribution of the
different secondary structure motifs is also largely unchanged during the simulations (Fig.
8b).
From consideration of all of the simulations it may be seen that three particular regions of the
protein are especially important in mediating attachment; these are the loop joining the first
and second beta-strands (around residue 23), the loop joining the third and fourth beta-
strands, and the C-terminus. These contain predominately hydrophilic residues, with
attachment being driven by hydrogen bonding between these groups and the N-H and C=O
groups in the PU. Adsorption through flexible regions suggests that these play a role in
mediating surface adsorption, similar to the fly-casting mechanism exhibited by some DNA-
binding proteins. 60
The use of silanisation to functionalise the AFM probe means that the protein attaches to the
probe via the N-terminal 61 since this allows covalent bonding. Protein that is not covalently
bonded to the AFM probe ought to be removed by the washing stages. This method for
protein functionalisation has been used previously for antibodies 38 and for Fn. Attachment of
protein by the N-terminal would suggest that the C-down, Arg-down and Arg-up orientations
used in the MD simulations are most relevant to the situation in the AFM experiments while
all orientations are relevant to the QCM experiments.
Page 16 of 33
John Wiley & Sons, Inc.
Journal of Biomedical Materials Research: Part A
123456789101112131415161718192021222324252627282930313233343536373839404142434445464748495051525354555657585960
For Peer Review
Journal of Biomedical Materials Research Part A
17
CONCLUSION
In this paper the adsorption of anastellin, a C-terminal fragment of the fibronectin type III
domain, onto biomaterial surfaces was investigated using a combination of experimental and
theoretical methods. Understanding the adsorption of proteins onto synthetic surfaces is of
interest in the development of new materials for medical applications. By combining a
number of different methods, this work provides a picture of the adsorption ranging from the
molecular to macroscopic levels.
Agreement between adhesion data and adsorption results confirm that there is greater
interaction between anastellin and PU than between anastellin and PMMA. There appears to
be agreement between the circular dichroism data and the molecular dynamics simulations of
anastellin which both indicate a stable secondary structure. Molecular dynamics simulations
of anastellin on polyurethane show that adsorption is strong and occurs rapidly. The
simulations also show that the secondary structure of anastellin is stable upon adsorption to
polyurethane in water and remains mostly stable even in saline solutions. Analysis of the
simulations suggest that adsorption onto polyurethane is mediated by hydrophilic amino
acids, due to hydrogen bonding with C=O and N-H groups in the polymer backbone, and
residues in flexible regions of the protein.
ACKNOWLEDGMENTS
The authors would like to acknowledge the UK Engineering & Physical Sciences Research
Council (EPSRC) and the University of Strathclyde for the studentship to David Mallinson,
and the Bridging the gap (BTG) project at the University of Strathclyde for funding this
work. Computational facilities were provided by the Archie-West HPC facility (EPSRC grant
no. EP/K000586/1), and SFI/HEA Irish Centre for High-End Computing (ICHEC) and access
Page 17 of 33
John Wiley & Sons, Inc.
Journal of Biomedical Materials Research: Part A
123456789101112131415161718192021222324252627282930313233343536373839404142434445464748495051525354555657585960

For Peer Review
Journal of Biomedical Materials Research Part A
18
to AFM and contact angle measurements was provided by the EPSRC Centre in Continuous
Manufacturing and Crystallisation (CMAC).
Page 18 of 33
John Wiley & Sons, Inc.
Journal of Biomedical Materials Research: Part A
123456789101112131415161718192021222324252627282930313233343536373839404142434445464748495051525354555657585960

For Peer Review
Journal of Biomedical Materials Research Part A
19
References
1. Vanterpool FA, Cantini M, Seib FP, Salmeron-Sanchez M. A material-based platform to modulate fibronectin activity and focal adhesion assembly. Biores Open Access 2014;3(6):286-96.
2. To WS, Midwood KS. Plasma and cellular fibronectin: distinct and independent functions during tissue repair. Fibrogenesis & Tissue Repair 2011;4(1):1-17.
3. Aota S, Nomizu M, Yamada KM. The short amino-acid-sequence Pro-His-Ser-Arg-Asn in human fibronectin enhances cell-adhesive function. Journal of Biological Chemistry 1994;269(40):24756-24761.
4. Agarwal R, González-García C, Torstrick B, Guldberg RE, Salmerón-Sánchez M, García AJ. Simple coating with fibronectin fragment enhances stainless steel screw osseointegration in healthy and osteoporotic rats. Biomaterials 2015;63:137-145.
5. Herranz-Diez C, Mas-Moruno C, Neubauer S, Kessler H, Gil FJ, Pegueroles M, Manero JM, Guillem-Marti J. Tuning mesenchymal stem cell response onto titanium-niobium-hafnium alloy by recombinant fibronectin fragments. ACS Appl Mater Interfaces 2016.
6. Petrie TA, Capadona JR, Reyes CD, Garcia AJ. Integrin specificity and enhanced cellular activities associated with surfaces presenting a recombinant fibronectin fragment compared to RGD supports. Biomaterials 2006;27(31):5459-70.
7. Hersel U, Dahmen C, Kessler H. RGD modified polymers: biomaterials for stimulated cell adhesion and beyond. Biomaterials 2003;24(24):4385-4415.
8. Morla A, Ruoslahti E. A fibronectin self-assembly site involved in fibronectin matrix assembly: reconstruction in a synthetic peptide. J Cell Biol 1992;118.
9. Yi M, Ruoslahti E. A fibronectin fragment inhibits tumor growth, angiogenesis, and metastasis. Proc Natl Acad Sci U S A 2001;98(2):620-4.
10. Morla A, Zhang Z, Ruoslahti E. Superfibronectin is a functionally distinct form of fibronectin. Nature 1994;367:193-6.
11. Kelsh R, You R, Horzempa C, Zheng M, McKeown-Longo PJ. Regulation of the innate immune response by fibronectin: synergism between the III-1 and EDA domains. PLoS One 2014;9(7):e102974.
12. Stine JM, Sun Y, Armstrong G, Bowler BE, Briknarova K. Structure and unfolding of the third type III domain from human fibronectin. Biochemistry 2015;54(44):6724-33.
13. Morla A, Ruoslahti E. A fibronectin self-assembly site involved in fibronectin matrix assembly: reconstruction in a synthetic peptide. J Cell Biol 1992;118(2):421-9.
14. Ohashi T, Erickson H. Domain unfolding plays a role in superfibronectin formation. Journal of Biological Chemistry 2005;280(47):39143-51.
15. Zheng M, Jones DM, Horzempa C, Prasad A, McKeown-Longo PJ. The First Type III Domain of Fibronectin is Associated with the Expression of Cytokines within the Lung Tumor Microenvironment. J Cancer 2011;2:478-83.
16. Ambesi A, Klein M, Pumiglia K, McKeown-Longo P. Anastellin, a fragment of the first type III repeat of fibronectin, inhibits extracellular signal-regulated kinase and causes G1 arrest in human microvessel endothelial cells. Cancer Research 2005;65:148-56.
17. Ambesi A, McKeown-Longo PJ. Anastellin, the angiostatic fibronectin peptide, is a selective inhibitor of lysophospholipid signaling. Mol Cancer Res 2009;7(2):255-65.
18. You R, Zheng M, McKeown-Longo PJ. The first type III repeat in fibronectin activates an inflammatory pathway in dermal fibroblasts. J Biol Chem 2010;285(47):36255-9.
Page 19 of 33
John Wiley & Sons, Inc.
Journal of Biomedical Materials Research: Part A
123456789101112131415161718192021222324252627282930313233343536373839404142434445464748495051525354555657585960
For Peer Review
Journal of Biomedical Materials Research Part A
20
19. Kowalczynska H, Nowak-Wyrzykowska M, Kolos R, Dobkowski J, Kaminski J. Fibronectin adsorption and arrangement on copolymer surfaces and their significance in cell adhesion. Journal of Biomedical Materials Research Part A 2005;72A(2):228-36.
20. Baugh L, Vogel V. Structural changes of fibronectin adsorbed to model surfaces probed by fluorescence resonance energy transfer. Journal of Biomedical Materials Research Part A 2004;69A(3):525-34.
21. Michael K, Vernekar V, Keselowsky B, Meredith J, Latour R, Garcia A. Adsorption-induced conformational changes in fibronectin due to interactions with well-defined surface chemistries. Langmuir 2003;19(19):8033-40.
22. Thevenot P, Hu W, Tang L. Surface chemistry influences implant biocompatibility. Curr Top Med Chem 2008;8(4):270-80.
23. Roach P, Farrar D, Perry CC. Interpretation of protein adsorption: Surface-induced conformational changes. Journal of the American Chemical Society 2005;127(22):8168-8173.
24. Krammer A, Lu H, Isralewitz B, Schulten K, Vogel V. Forced unfolding of the fibronectin type III module reveals a tensile molecular recognition switch. Proceedings of the National Academy of Sciences of the United States of America 1999;96(4):1351-1356.
25. Kowalczynska HM, Kolos R, Nowak-Wyrzykowska M, Dobkowski J, Elbaum D, Szczepankiewicz A, Kaminski J. Atomic force microscopy evidence for conformational changes of fibronectin adsorbed on unmodified and sulfonated polystyrene surfaces. Journal of Biomedical Materials Research Part A 2009;91A(4):1239-1251.
26. Lange D, Chew BH. Update on ureteral stent technology. Ther Adv Urol 2009;1(3):143-8.
27. Webb JCJ, Spencer RF. The role of polymethylmethacrylate bone cement in modern orthopaedic surgery. Journal of Bone & Joint Surgery, British Volume 2007;89-B(7):851-857.
28. Cassady AI, Hidzir NM, Grøndahl L. Enhancing expanded poly(tetrafluoroethylene) (ePTFE) for biomaterials applications. Journal of Applied Polymer Science 2014;131(15).
29. Palacio M, Schricker S, Bhushan B. Bioadhesion of various proteins on random, diblock and triblock copolymer surfaces and the effect of pH conditions. Journal of the Royal Society Interface 2011;8(58):630-40.
30. Palacio M, Schricker S, Bhushan B. Protein conformation changes on block copolymer surfaces detected by antibody-functionalized atomic force microscope tips. Journal of Biomedical Materials Research Part A 2012;100A(1):18-25.
31. Szott LM, Horbett TA. Protein interactions with surfaces: cellular responses, complement activation, and newer methods. Current Opinion in Chemical Biology 2011;15(5):677-682.
32. Raffaini G, Ganazzoli F. Molecular dynamics simulation of the adsorption of a fibronectin module on a graphite surface. Langmuir 2004;20(8):3371-8.
33. Panos M, Sen TZ, Ahunbay MG. Molecular simulation of fibronectin adsorption onto polyurethane surfaces. Langmuir 2012;28(34):12619-12628.
34. Kubiak-Ossowska K, Mulheran P, Nowak W. Fibronectin module FNIII9 adsorption at contrasting model surfaces studied by atomistic molecular dynamics. Journal of Physical Chemistry B 2014;118(33):9900-8.
35. Mallinson D, Alexiou P, Mullen A, Pelecanou M, Sagnou M, Lamprou DA. Isatin thiosemicarbazone-blended polymer films for biomedical applications: surface
Page 20 of 33
John Wiley & Sons, Inc.
Journal of Biomedical Materials Research: Part A
123456789101112131415161718192021222324252627282930313233343536373839404142434445464748495051525354555657585960

For Peer Review
Journal of Biomedical Materials Research Part A
21
morphology, characterisation and preliminary biological assessment. RSC Advances 2016.
36. Lamprou D, Smith J, Nevell T, Barbu E, Willis C, Tsibouklis J. Towards the determination of surface energy at the nanoscale: a further assessment of the AFM-based approach. Journal of Advanced Microscopy Research 2010;5:137-42.
37. Good R, van Oss C. The modern theory of contact angles and the hydrogen bond components of surface energies. In: G SMaL, editor. Modern Approach to Wettability: Theory and Applications. New York: Plenum; 1992.
38. Couston R, Lamprou D, Uddin S, van der Walle C. Interaction and destabilization of a monoclonal antibody and albumin to surfaces of varying functionality and hydrophobicity. International Journal of Pharmaceutics 2012;438:71-80.
39. Sugawara Y, Ohta M, Konishi T, Morita S, Suzuki M, Enomoto Y. Effects of humidity and tip radius on the adhesive force measured with atomic force microscopy. Wear 1993;168(1–2):13-16.
40. Rodahl M, Hook F, Kasemo B. QCM operation in liquids: An explanation of measured variations in frequency and Q factor with liquid conductivity. Analytical Chemistry 1996;68(13):2219-2227.
41. Kanazawa KK, Gordon JG. The oscillation frequency of a quartz resonator in contact with a liquid. Analytica Chimica Acta 1985;175(SEP):99-105.
42. Schumacher R, Borges G, Kanazawa KK. The quartz microbalance - a sensitive tool to probe surface reconstructions on gold electrodes in liquid. Surface Science 1985;163(1):L621-L626.
43. Hayakawa T, Yoshinari M, Nemoto K. Characterization and protein-adsorption behavior of deposited organic thin film onto titanium by plasma polymerization with hexamethyldisiloxane. Biomaterials 2004;25(1):119-127.
44. Hook F, Voros J, Rodahl M, Kurrat R, Boni P, Ramsden JJ, Textor M, Spencer ND, Tengvall P, Gold J and others. A comparative study of protein adsorption on titanium oxide surfaces using in situ ellipsometry, optical waveguide lightmode spectroscopy, and quartz crystal microbalance/dissipation. Colloids and Surfaces B-Biointerfaces 2002;24(2):155-170.
45. Wagberg L, Pettersson G, Notley S. Adsorption of bilayers and multilayers of cationic and anionic co-polymers of acrylamide on silicon oxide. Journal of Colloid and Interface Science 2004;274(2):480-488.
46. Tammelin T, Merta J, Johansson LS, Stenius P. Viscoelastic properties of cationic starch adsorbed on quartz studied by QCM-D. Langmuir 2004;20(25):10900-10909.
47. Wolff O, Seydel E, Johannsmann D. Viscoelastic properties of thin films studied with quartz crystal resonators. Faraday Discussions 1997;107:91-104.
48. Nigar M, Blackwell J, Chvalun SN, Seneker SD, Schmelzer HG. The structure of the hard domains in trans,trans-HMDI-based polyurethane elastomers. Acta Polymerica 1996;47(1):48-54.
49. MacKerell AD, Bashford D, Bellott M, Dunbrack RL, Evanseck JD, Field MJ, Fischer S, Gao J, Guo H, Ha S and others. All-atom empirical potential for molecular modeling and dynamics studies of proteins. J Phys Chem B 1998;102(18):3586-616.
50. Vanommeslaeghe K, Hatcher E, Acharya C, Kundu S, Zhong S, Shim J, Darian E, Guvench O, Lopes P, Vorobyov I and others. CHARMM general force field: A force field for drug-like molecules compatible with the CHARMM all-atom additive biological force fields. Journal of Computational Chemistry 2010;31(4):671-690.
51. Bussi G, Donadio D, Parrinello M. Canonical sampling through velocity rescaling. The Journal of Chemical Physics 2007;126(1):014101.
Page 21 of 33
John Wiley & Sons, Inc.
Journal of Biomedical Materials Research: Part A
123456789101112131415161718192021222324252627282930313233343536373839404142434445464748495051525354555657585960

For Peer Review
Journal of Biomedical Materials Research Part A
22
52. Hess B. P-LINCS: A parallel linear constraint solver for molecular simulation. Journal of Chemical Theory and Computation 2008;4(1):116-122.
53. Miyamoto S, Kollman PA. Settle: An analytical version of the SHAKE and RATTLE algorithm for rigid water models. Journal of Computational Chemistry 1992;13(8):952-962.
54. Essmann U, Perera L, Berkowitz ML, Darden T, Lee H, Pedersen LG. A smooth particle mesh Ewald method. The Journal of Chemical Physics 1995;103(19):8577-8593.
55. Hess B, Kutzner C, van der Spoel D, Lindahl E. GROMACS 4: Algorithms for highly efficient, load-balanced, and scalable molecular simulation. Journal of Chemical Theory and Computation 2008;4(3):435-447.
56. Dann JR. Forces involved in the adhesive process. Journal of Colloid and Interface Science 1970;32(2):321-331.
57. Elter P, Lange R, Beck U. Atomic force microscopy studies of the influence of convex and concave nanostructures on the adsorption of fibronectin. Colloids and Surfaces B Biointerfaces 2012;89:139-46.
58. Greenfield NJ. Using circular dichroism spectra to estimate protein secondary structure. Nat Protoc 2006;1(6):2876-90.
59. Briknarova K, Akerman M, Hoyt D, Ruoslahti E, Ely K. Anastellin, an FN3 fragment with fibronectin polymerization activity, resembles amyloid fibril precursors. Journal of Molecular Biology 2003;332:205-15.
60. Levy Y, Onuchic JN, Wolynes PG. Fly-casting in protein-DNA binding: frustration between protein folding and electrostatics facilitates target recognition. J Am Chem Soc 2007;129(4):738-9.
61. Aissaoui N, Bergaoui L, Landoulsi J, Lambert J-F, Boujday S. Silane layers on silicon surfaces: mechanism of interaction, stability, and influence on protein adsorption. Langmuir 2012;28(1):656-665.
Page 22 of 33
John Wiley & Sons, Inc.
Journal of Biomedical Materials Research: Part A
123456789101112131415161718192021222324252627282930313233343536373839404142434445464748495051525354555657585960

For Peer Review
Journal of Biomedical Materials Research Part A
23
Figure captions
Fig. 1 Second axis graphs with frequency and mass.
Fig. 2 Circular dichroism (CD) spectrum of FnIII1c.
Fig. 3 Difference in adhesion force by surface between silanised probes (APTES) and
protein-functionalised probes (anastellin). All differences are significant.
Fig. 4 Density of anastellin on SiO2, PU and PMMA surfaces.
Fig. 5 Protein centre-of-mass position (top) and orientation (bottom) for no salt simulations.
Simulations starting in the Arg-down, Arg-up, C-down, and N-down conformations are
denoted by black, red, green, and blue lines respectively.
Fig. 6 Simulation snapshots showing adsorption of anastellin on to polyurethane surface. (a)
Protein in Arg-down starting configuration at (left to right) t = 0 ns, 13 ns, 25 ns, 47 ns, 50 ns,
and 100 ns. (b) Protein in Arg-up starting configuration at (left to right) t = 0 ns, 5 ns, 10 ns,
48 ns, 55 ns, and 100 ns. (c) Protein in N-down starting configuration at (left to right) t = 0
ns, 1 ns, 15 ns, 20 ns, 50 ns, and 100 ns. (d) Protein in C-down starting configuration at (left
to right) t = 0 ns, 1 ns, 10 ns, 27.5 ns, 47 ns, and 100 ns. Residues involved in adsorption (see
text) are highlighted.
Fig. 7 Residue centre-of-mass positions for protein starting in (top to bottom) Arg-down,
Arg-up, C-down, and N-down conformations.
Fig. 8 (a) Secondary structure amounts for (top to bottom) Arg-down, Arg-up, C-down, and
N-down starting conformations. Black, red, and green lines denote turn, beta-strand, and
random coil respectively. (b) Secondary structure distributions for (top to bottom) Arg-down,
Arg-up, C-down, and N-down starting conformations.Error! Reference source not found.
Page 23 of 33
John Wiley & Sons, Inc.
Journal of Biomedical Materials Research: Part A
123456789101112131415161718192021222324252627282930313233343536373839404142434445464748495051525354555657585960
For Peer Review
Journal of Biomedical Materials Research Part A
24
Table 1 Advancing contact angles of SW, PMMA and PU surfaces, n = 12.
Contact Angle (θA ° )
Surface DW DIM EG
SW 56.6 ± 1.3 42.2 ± 2.6 33.9 ± 6.5
PMMA 74.7 ± 3.8 40.7 ± 1.1 59.2 ± 2.5
PU 85.9 ± 12.2 42.1 ± 7.5 60.0 ± 1.6
Table 2 Surface energy components by CAG and surface roughness by AFM of SW, PMMA,
and PU surfaces.
Surface energy (mJ m-2) Roughness by AFM
Surface γsLW γs
+ γs- γs Ra (nm)
SW 38.49 0.30 23.98 43.81 0.11 ± 0.01
PMMA 39.26 0.14 13.63 42.02 2.00 ± 0.11
PU 38.54 0.00 4.07 38.67 3.06 ± 0.25
Table 3 Residues in contact with surface
Conformation Residues in Contact
Arg-down K21, N23, Q64, E65, T67, R68, D70
Arg-up P7, Y61
C-down N21, V23
N-down A6, P7, Q8, Q60, Y61, G62
Page 24 of 33
John Wiley & Sons, Inc.
Journal of Biomedical Materials Research: Part A
123456789101112131415161718192021222324252627282930313233343536373839404142434445464748495051525354555657585960
For Peer Review
Journal of Biomedical Materials Research Part A
25
Equations
Equation 1
A = 4πRT
Equation 2 Sauerbrey equation
Page 25 of 33
John Wiley & Sons, Inc.
Journal of Biomedical Materials Research: Part A
123456789101112131415161718192021222324252627282930313233343536373839404142434445464748495051525354555657585960

For Peer Review
Fig. 1 Second axis graphs with frequency and mass.
218x161mm (111 x 111 DPI)
Page 26 of 33
John Wiley & Sons, Inc.
Journal of Biomedical Materials Research: Part A
123456789101112131415161718192021222324252627282930313233343536373839404142434445464748495051525354555657585960

For Peer Review
Fig. 2 Circular dichroism (CD) spectrum of FnIII1c.
Page 27 of 33
John Wiley & Sons, Inc.
Journal of Biomedical Materials Research: Part A
123456789101112131415161718192021222324252627282930313233343536373839404142434445464748495051525354555657585960

For Peer Review
Fig. 3 Difference in adhesion force by surface between silanised probes (APTES) and protein-functionalised probes (anastellin). All differences are significant.
Page 28 of 33
John Wiley & Sons, Inc.
Journal of Biomedical Materials Research: Part A
123456789101112131415161718192021222324252627282930313233343536373839404142434445464748495051525354555657585960

For Peer Review
Fig. 4 Adsorbed mass of anastellin on SiO2, PU and PMMA surfaces.
174x113mm (150 x 150 DPI)
Page 29 of 33
John Wiley & Sons, Inc.
Journal of Biomedical Materials Research: Part A
123456789101112131415161718192021222324252627282930313233343536373839404142434445464748495051525354555657585960

For Peer Review
Fig. 5 Protein centre-of-mass position (top) and orientation (bottom) for no salt simulations. Simulations starting in the Arg-down, Arg-up, C-down, and N-down conformations are denoted by black, red, green, and
blue lines respectively.
Page 30 of 33
John Wiley & Sons, Inc.
Journal of Biomedical Materials Research: Part A
123456789101112131415161718192021222324252627282930313233343536373839404142434445464748495051525354555657585960

For Peer Review
Fig. 6 Simulation snapshots showing adsorption of anastellin into polyurethane surface. (a) Protein in Arg-down starting configuration at (left to right) t = 0 ns, 13 ns, 25 ns, 47 ns, 50 ns, and 100 ns. (b) Protein in Arg-up starting configuration at (left to right) t = 0 ns, 5 ns, 10 ns, 48 ns, 55 ns, and 100 ns. (c) Protein in
N-down starting configuration at (left to right) t = 0 ns, 1 ns, 15 ns, 20 ns, 50 ns, and 100 ns. (d) Protein in C-down starting configuration at (left to right) t = 0 ns, 1 ns, 10 ns, 27.5 ns, 47 ns, and 100 ns. Residues
involved in adsorption (see text) are highlighted.
Page 31 of 33
John Wiley & Sons, Inc.
Journal of Biomedical Materials Research: Part A
123456789101112131415161718192021222324252627282930313233343536373839404142434445464748495051525354555657585960
For Peer Review
Fig. 7 Residue centre-of-mass positions for protein starting in (top to bottom) Arg-down, Arg-up, C-down, and N-down conformations.
Page 32 of 33
John Wiley & Sons, Inc.
Journal of Biomedical Materials Research: Part A
123456789101112131415161718192021222324252627282930313233343536373839404142434445464748495051525354555657585960

For Peer Review
Fig. 8 (a) Secondary structure amounts for (top to bottom) Arg-down, Arg-up, C-down, and N-down starting conformations. Black, red, and green lines denote turn, beta-strand, and random coil respectively. (b) Secondary structure distributions for (top to bottom) Arg-down, Arg-up, C-down, and N-down starting
conformations.
Page 33 of 33
John Wiley & Sons, Inc.
Journal of Biomedical Materials Research: Part A
123456789101112131415161718192021222324252627282930313233343536373839404142434445464748495051525354555657585960